 Jielin Yang
 Wenping Li*
 Jingzhong Zhu
- School of Resources and Geosciences, China University of Mining and Technology, Xuzhou, China
With the gradual increase of coal production capacity, the mining-induced roof water damage has become increasingly prominent. Accurately and effectively predicting the water yield property of the roof aquifer based on the hydrogeological data is of great significance for preventing and controlling mine water damage. In this study, we select six evaluation factors, including aquifer thickness (AT), permeability coefficient (PC), coring rate (CR), rock brittleness-plasticity ratio (RBPR), equivalent thickness of sandstone (ETS), and fold undulation (FU). A hybrid model is proposed, integrating the convolutional neural networks (CNN) with long short-term memory (LSTM) optimized by the Attention module to improve the model’s performance. The model is applied to predict the water yield property of the Paleocene aquifer in the Yili No. 4 colliery by collecting 100 hydrogeological datasets. The model is trained to predict the unit water inflow (UWI) of the roof aquifer, reflecting the water yield property. Besides, comparative analysis with the CNN, LSTM, and the CNN-LSTM models demonstrates that the prediction performance of the CNN-LSTM-Attention model outperforms the three contrastive models. The CNN-LSTM-Attention hybrid model achieves higher prediction accuracy. This study proposes a scientifically robust evaluation method for delineating WYPZ in mining areas with limited hydrogeological exploration data.
1 Introduction
Mine water disasters pose a serious threat to mining safety, especially the most common and dangerous water in the roof aquifer (Yang et al., 2021; Zhu et al., 2024; Dong et al., 2024). With the wide application and promotion of modern comprehensive mechanized coal mining technology, the thickness of coal mining has been increasing to improve the utilization efficiency of coal resources, leading to an increase in the roof collapse zone and water-conducting fissure zone, thus exacerbating the impact of mining on the roof aquifers, and correspondingly increasing the risk and threat of water hazards (Lu et al., 2018; Hu and Tian, 2010). The degree of water abundance in the aquifer is one of the key factors determining the severity of roof water damage (Wang et al., 2021; Zhu et al., 2021; Song et al., 2016). Thus, before mining activities, a systematic and accurate evaluation of the water yield property of aquifers and risk prediction of water inrush in coal mining can provide scientific guidance for the mine water prevention and control work (Sun et al., 2017; Dong et al., 2020; Liu, 2021).
Against this backdrop, many domestic and foreign scholars have dedicated their efforts to researching the water yield property of aquifers. Currently, the traditional method for the identification of the water yield property of aquifers is mainly the unit water inflow (UWI). UMI is defined as the water yield per unit drawdown and per unit time in a borehole, with the unit of L/(s·m), which is used to quantitatively evaluate the water abundance of an aquifer (Zhu et al., 2025). Namely, field hydrogeological tests reveal the water output capacity and the water level response of aquifers. So, the calculation of the UWI is the most direct means to evaluate the water yield property of aquifers (Wang et al., 2019). However, this evaluation method is usually constrained by the limited hydrogeological data. The occurrence of roof water damage is closely related to the degree of the water yield capacities of the roof aquifer. The water inflow per unit of drilling is the most intuitive hydrogeological parameter of the water yield property of the aquifer and accurate and effective prediction of the water inflow per unit of the roof aquifer, the definition of the key target area for prevention and control of roof water damage, and the timely proposal of scientific and practical preventive and control measures, which can effectively reduce the occurrence of roof water damage accidents in coal mines (Song, 2017; Al-Abadi and Shahid, 2015; Sun et al., 2019; Dai et al., 2023). The result can effectively reduce the occurrence of mine roof water damage accidents.
The proposal of the ‘double-prediction based on triple-graph’ method achieved the spatial fusion of multi-source information for the first time (Wu et al., 2000; Wu et al., 2009; Wu et al., 2011; Wu et al., 2016). Nevertheless, it isn't easy to characterize the nonlinear relationships, such as sandstone cementation degree-fracture connectivity, by the linear weighting system. The subsequent development of variable-weight fuzzy hierarchical analysis (Hou et al., 2019; Li et al., 2022; Lu et al., 2018; Han et al., 2012; Wang, 2016; Xue et al., 2018) reduces the expert experience weight bias by introducing entropy constraints. However, it is still limited by the subjective dependence of screening the main control factors. Large-scale field experiments show that the prediction error of traditional models grows exponentially when the brittleness-plasticity ratio of the rock formation is more than 2.5 times (Gong et al., 2018; Deng et al., 2019; Ki et al., 2020; Sal and Bayu, 2021; Zhou et al., 2021; Hochreiter and Schmidhuber, 1997), which exposes the inadequacy of the coupled mechanics-hydraulics mechanism analysis.
In recent years, deep learning has been widely used in the field of hydrogeology and geotechnical modeling to simulate subsurface conditions, including thermal and flow behaviors (Ahmad et al., 2019; Ahmad et al., 2021; Ahmad et al., 2025). Such as, artificial neural network optimization techniques and Wavelet Support Vector Machine (WA-SVR) model are applied to predicting the groundwater level in the given terrain (Gaur et al., 2021). Groundwater forecasting is significantly needed for groundwater management. The advantage of convolutional neural networks (CNN) in feature space mapping is that they enable implicit association rules to be extracted from multi-scale geological parameters. The FCNN model constructed (Cheng and Wang, 2023) achieved a cross-modal correlation between electromagnetic response signals and water abundance grades through ‘end-to-end learning’, with an accuracy of 91.7% in the test set. On the other hand, extended short-term memory networks (LSTM) demonstrated temporal prediction advantages, and the multivariate LSTM model developed (Shi et al., 2023) reduced the mean square error of water level dynamics prediction. Transformer structure demonstrates more substantial long-range dependency capture in permeability field reconstruction through a self-attentive mechanism (Sun et al., 2020), and the Graph Neural Network (GNN) has also made breakthroughs in modeling seepage paths in fault networks (Zhang and Dai, 2022).
Current research is evolving from a single-model optimization to multimodal fusion: the combined CNN-GRU model improves the depth of memory for periodic seepage events through a gating mechanism (Wang and Gupta, 2024), and the spatio-temporal transformer (STT) achieves multi-resolution analysis of geological parameters using multi-head attention (Yuan et al., 2025). However, there are still two significant defects in the existing hybrid architectures: Insufficient interaction of spatio-temporal features, making it difficult to synchronously capture the mechanical-hydraulic coupling effect of the rock rupture process; Lack of geological a priori constraints on the allocation of attention weights, causing a reduction in the identification of key control factors. Recently, the Geo-Attention mechanism proposed (Guo et al., 2022) provided a new idea to solve the second type of problem, but its computational complexity still restricts the engineering applications.
The main object is the Paleocene aquifer in the 12th panel area, Yili No.4 colliery in this study. By analyzing the geological and hydrogeological conditions, it is concluded that the main water-filling water source is the Paleocene sandstone and conglomerate aquifer overlying the main coal seam. The aquifer thickness (AT), permeability coefficient (PC), coring rate (CR), rock brittleness-plasticity ratio (RBPR), equivalent sandstone thickness (EST), and fold undulation (FU) are selected as the evaluation factors for predicting the water yield property of the Paleocene aquifer. Neural network models are known for accurately reflecting the nonlinear relationship between factors and water yield properties, so they have broad application prospects. However, the reasonable selection of hyperparameters in machine learning models may affect prediction accuracy. In this research, an advanced convolutional neural network optimization algorithm has been proposed. The accuracy of water yield property prediction is further improved by extracting features with different weights using the CNN module, based on which the long-time correlation of the LSTM neural network is utilized. Finally, by innovatively integrating an Attention module at the output stage of the LSTM model, the hybrid CNN-LSTM-Attention framework dynamically prioritizes key data features, leading to a significant improvement in prediction accuracy for aquifer water yield properties. We take the 12th panel area of the Yili No.4 colliery, Xinjiang, as an application case. The results show that the CNN-LSTM-Attention model has higher accuracy and practical engineering application value to the water yield property of the aquifers.
2 Study area profile
Xinjiang is located in the northwest of China and is characterized by an arid and semi-arid area, where coal-bearing strata are mainly distributed in the Mesozoic Jurassic. The geological structure of overburden is different from that of the eastern mines, which has the characteristics of poor cementation, low strength, easy weathering, and disintegration in water, and belongs to the weakly cemented strata. With the gradual increase of coal production capacity, the roof water damage has become more and more serious. Yili No.4 colliery is located in the southeast of Huocheng County, Ili Kazakh Autonomous Prefecture, Xinjiang Uygur Autonomous Region, as shown in Figure 1, with a general topography of high in the northeast and low in the southwest, which is a low mountainous and hilly terrain. Yili Basin is a Mesozoic depression basin with a set of terrestrial clastic deposits.
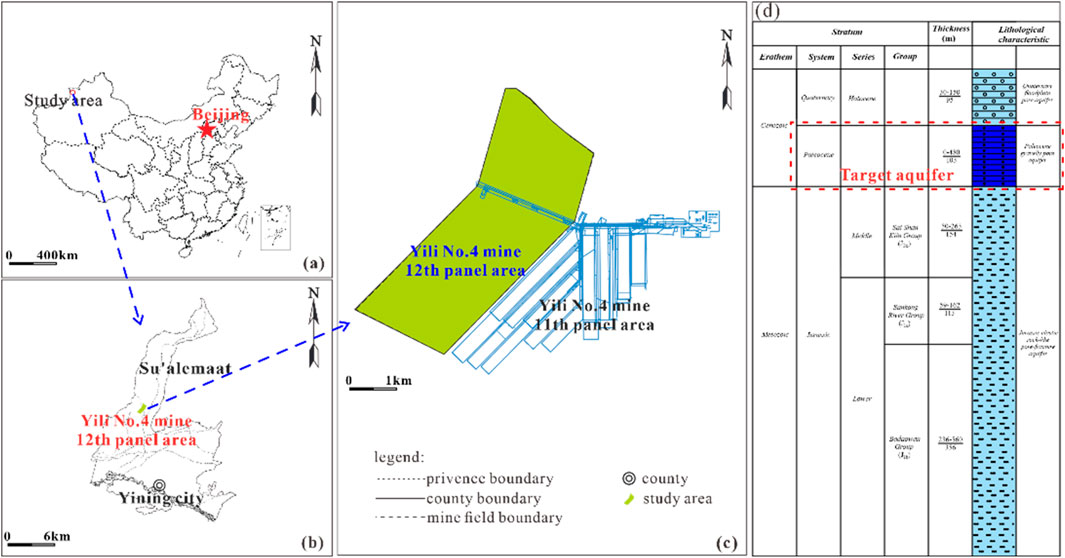
Figure 1. Schematic of the location of the study area. (a) Location of the Yili No.4 colliery; (b) Location of the 12th panel area in the Yili No.4 colliery; (c) Schematic diagram of the 12th panel area; (d) Main aquifers within the 12th panel area.
Based on the related data derived from the geological boreholes, the fracture structure in the mine area is not developed, the groundwater recharge condition is poor, and the hydrogeological boundary is simple. The main aquifers that have a more significant impact on the mine production and ecological environment during mining are the Quaternary alluvial floodplain pore aquifer, the Paleocene conglomerate pore aquifer, and the Jurassic crushed rock pore-fissure aquifer. Groundwater recharge in the region mainly originates from precipitation infiltration, with its quantity controlled by rainfall characteristics, terrain features, and aquifer properties. The long-term average annual precipitation in the mine field is 290.4 mm. In the hilly ridge area, the thick loess layer causes dispersed rainfall runoff, resulting in minimal infiltration recharge. The pore water in the Quaternary and Paleogene systems is primarily recharged by precipitation from the northern mountainous areas and bedrock fissure water, while also receiving surface water recharge in the river valley region. The fissure-pore water in clastic rocks is primarily recharged by precipitation and surface water in the outcrop areas, secondarily by seepage from Quaternary and Paleogene pore water, and locally by water accumulation in goaf areas.
The coal seams are characterized by shallow, large thicknesses with many layers, and the mechanical properties of the overlying stratum are very weak. The main mining coal seams are No.21−1 and No.23−2 coal seams currently. The main water-filling source is now the Paleocene gravel aquifer overlying the coal seams, and the water yield property is extremely uneven vertically and horizontally. It may become the direct and indirect water-filling source for the mining No.21−1 and 23–2 coal seams in the hidden outcrop area, or through the mining-induced fissures. In this study, we mainly analyze the water yield property of the Paleocene aquifer in the 12th panel area.
3 Materials and methods
3.1 Materials
Many factors affect the water yield property of aquifers, and a close relationship exists between the influencing factors. To effectively evaluate the water yield property of aquifers, combined with the previous research and analysis, we select six factors to analyze the aquifer’s water yield property, including the aquifer thickness (AT), the permeability coefficient (PC), the coring rate (CR), the rock brittleness-plastic ratio (RBPR), the equivalent sandstone thickness (EST), and the folds undulation (FU).
The data of the six evaluation factors is derived from drilling, pumping tests, and other operations, but the data is not easy to obtain, and their distribution in the study area is scattered. To get continuous and reliable data from the limited information, the spatial interpolation method is applied for processing, and the Kriging interpolation method is used. Contour maps of each evaluation factor are plotted.
(1) AT
Usually, the thickness of an aquifer is a key indicator of its water storage capacity. Greater AT indicates a larger volume of groundwater and a more water-abundant aquifer. By utilizing borehole data, we can determine the thickness at various boreholes and apply the interpolation method to create a continuous spatial distribution to quantify the aquifer’s water storage potential, as shown in Figure 2a. In the western region of the study area, the aquifer thickness is considerable, averaging around 120 m.
(2) PC
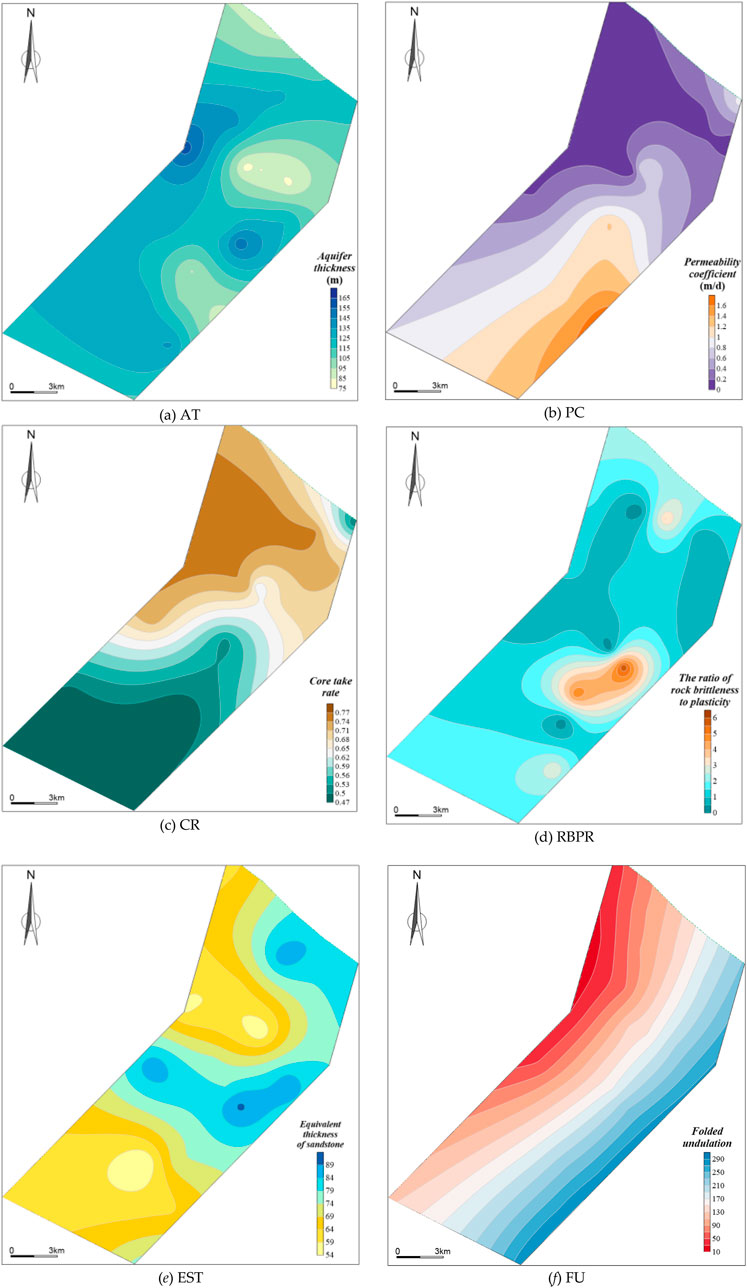
Figure 2. Contour mapping of each indicator in the 12th panel area. (a) AT. (b) PC. (c) CR. (d) RBPR. (e) EST. (f) FU.
The PC reflects the water-conducting capacity of an aquifer and is closely related to the degree of rock fissure development, connectivity, and pore structure. A high PC indicates low resistance to water flow and high groundwater transport efficiency. The PC, as a key parameter for evaluating the hydraulic conductivity of aquifers, can be calculated directly from the field pumping test data. The lithology of the Paleocene aquifer in the 12th panel area consists of coarse sandstone, sandstone conglomerate, and conglomerate, with thin layers of sandy mudstone. According to the existing hydrogeological borehole pumping test data, the PC of the Paleocene aquifer within the 12th panel area decreases from the south to the north, with a PC of 0.05–1.65 m/d, and the permeability grades range from weak to medium, as shown in Figure 2b.
(3) CR
The CR is an indirect measure of the fragmentation of the rock formation, defined as the ratio of the core length extracted to the total number of feet drilled. A low CR suggests the development of fractures within the rock, increasing both the water storage capacity and the pathways for water conduction per unit volume, thereby enhancing the water yield property of the formation. The information can be obtained from drilling logs, which are straightforward to operate and effectively reflect the distribution characteristics of aquifer fractures. In the study area, the CR is estimated to be approximately 0.47∼ 0.77, as shown in Figure 2c.
(4) RBPR
The stratigraphic lithology mainly consists of siltstone, mudstone, fine sandstone, medium to coarse sandstone, and conglomerate. Mudstone and siltstone belong to plastic rocks, while sandstone belongs to brittle rocks. Brittle rocks (e.g., sandstone) are prone to develop fissures, while plastic rocks (e.g., mudstone) inhibit the expansion of fissures. The phenomenon of alternating layers of sandstone and mudstone often occurs in the rock layer at the coal seam roof. The RBPR refers to the ratio of the thickness of brittle rock to that of plastic rock. When the thickness of the aquifer does not change much, and the rock layer is affected by tectonics, the RBPR is high, indicating that the brittle rock layer accounts for a large proportion, which is conducive to the development of fissure networks and the enhancement of water-abundant nature. The sandstone-mudstone interbedded structure of weakly cemented strata is applied to the lithological layering statistical calculation. Analyzing the hydrogeological data, the larger the RBPR, the larger its PC, indicating the more substantial permeability of the aquifer. The sandstone’s thickness in the study area’s southeast side is greater than that of mudstone, so the adequate aquifer thickness in the southeast region of the study area is more prominent, and the water-abundant nature is good. For example, the RBPR is 0.18 in the ZK1206 location, and its PC is 0.053 m/d. The RBPR in the borehole is large, and the water quantity is abundant, as demonstrated in Figure 2d.
(5) EST
The EST is one of the main indices for evaluating aquifers’ water yield property; the more significant its thickness, the stronger the water yield property is. Given the porosity and permeability difference of different sandstones, EST is introduced in this study. The porosity ratio of sandstone is used as the scale factor for sandstone thickness conversion, which is multiplied by the actual thickness of each sandstone type, and the calculation formula is expressed by Equation 1.
Where Meq is equivalent sandstone thickness, m;
By integrating the differences in porosity and permeability of different sandstone types (coarse, medium, and fine sandstone), the actual thickness is normalized to the equivalent thickness by the porosity ratio, which more accurately reflects the sandstone’s contribution to water enrichment. The larger EST in the southeastern region of the study area indicates that the adequate aquifer thickness is larger and the water yield of the aquifer is more water-abundant, as shown in Figure 2e.
(6) FU
The degree of FU characterizes the path of groundwater convergence controlled by the fold structure. Folds in the coalfield, especially the core and sides of the syncline, have developed fissures, and surface water from the two flanks converges in the middle and seeps down to become groundwater, which flows down the layers and slopes to form a catchment space in the syncline, and the syncline structure is favorable to groundwater recharge. Usually, the greater the degree of FU, the better the effect of water catchment and the greater the water abundance. The FU can be quantitatively expressed by Equation 2. After the above analysis, we determined the FU distribution characteristics, as shown in Figure 2f.
Where: Fund is the degree of fold relief;
3.2 Methods
Convolutional neural network (CNN) is an excellent feature search algorithm with strong convolutional ability, but it ignores the intrinsic connection between intermittent data. In contrast, a long-term memory network (LSTM) has good long-term memory properties. It can effectively portray complex correlations in time-series data, but deep mining still has some deficiencies. We study and discuss whether the combination of the two can improve prediction performance.
It has been shown that a multilayer neural network (CNN-LSTM) can be constructed by combining the CNN with LSTM, which can not only mine the intrinsic features of the sequences but also avoid the problem of “lost” information due to long-time sequences to a large extent. It can not only mine the intrinsic features of sequences but also prevent the problem of “lost” information caused by long sequences to a greater extent and ensure the correlation between the pieces.
Compared with traditional models, the use of hybrid deep learning and multi-physical frameworks, as seen in recent geotechnical and soil property modeling efforts (Rizvi et al., 2018; Rizvi et al., 2020; Rizvi et al., 2022), can improve parameter sensitivity and accuracy. A CNN-LSTM hybrid model performs well in aquifer water yield property prediction compared to a single model, but there is still an opportunity for further optimization. As such, an approach that combines CNN and LSTM with an Attention module can substantially improve the prediction performance of neural network models. The workflow of the CNN-LSTM-Attention algorithm is shown in Figure 3. Based on this observation, a hybrid deep learning model based on CNN-LSTM-Attention on water yield property prediction is proposed to solve the issue of relying on evaluation factors. The proposal of this hybrid model provides new insights for predicting the aquifer water yield property.
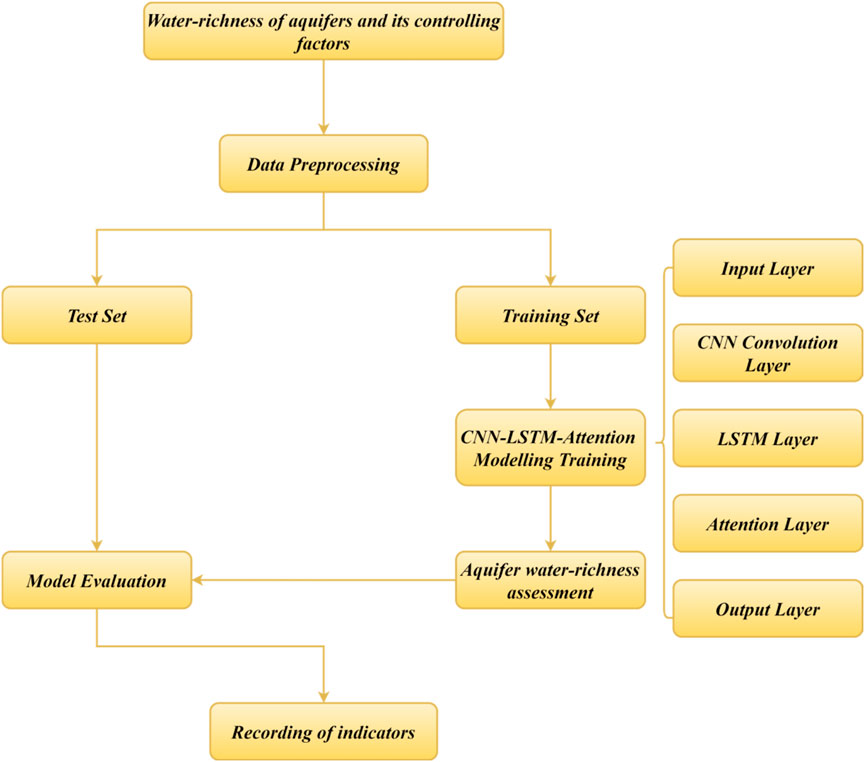
Figure 3. Flowchart of CNN-LSTM-Attention algorithm.
A CNN-LSTM-Attention hybrid model is constructed, and its algorithmic flow is shown in Figure 3. Water yield property and its evaluation factors are normalized, and input into the CNN-LSTM-Attention hybrid model, and a cross-validation strategy was adopted, in which 89% of the data is used for training, and the remaining 11% is used for testing. Through multiple rounds of iterative training, the weights of each layer in the neural network gradually converge to the optimal state. Finally, the hybrid model outputs the water yield property prediction results. Based on the prediction results, the average accuracy and root mean square error (RMSE) are calculated as the evaluation indices for model performance.
In Figure 4, we illustrate the overall architecture of the CNN-LSTM-Attention hybrid model, which consists of five key components. Firstly, in the input layer, a matrix consisting of the main influencing factors of aquifer water yield property is generated based on batching for sliding batch processing. Next, in the CNN layer, which is mainly used to extract spatial features, an approach similarly applied in damage localization and subsurface heterogeneity detection (Moreh et al., 2024a; Moreh et al., 2024b; Moreh et al., 2024c), the input matrix is subjected to one-dimensional convolution and pooling operations with a specific convolution kernel to extract features. In addition, a discarded layer is introduced to enhance the model’s generalization during training and to avoid overfitting. The CNN layer is mainly used to extract spatial features, which is conceptually similar to how CFD models capture spatial pressure and flow field distributions in constrained domains (Haroon et al., 2017). Then, in the LSTM layer, we extract high-level abstract features from the output of the CNN layer to achieve the conversion from the fine-grained features extracted from the front-end to the coarse-grained features, and meanwhile cleverly resolve the key dilemmas in extended sequence learning, i.e., memory retention and gradient diffusion difficulties. Next, the introduced attention module, which dynamically adjusts the weight assignment of each feature, can solve the model’s shortcomings in recognizing feature saliency and ensure that each element receives precise attention. Finally, in the fully connected layer of the output layer, the processed information is converted into the final aquifer unit inflow prediction value and prediction of the aquifer water yield property grades.
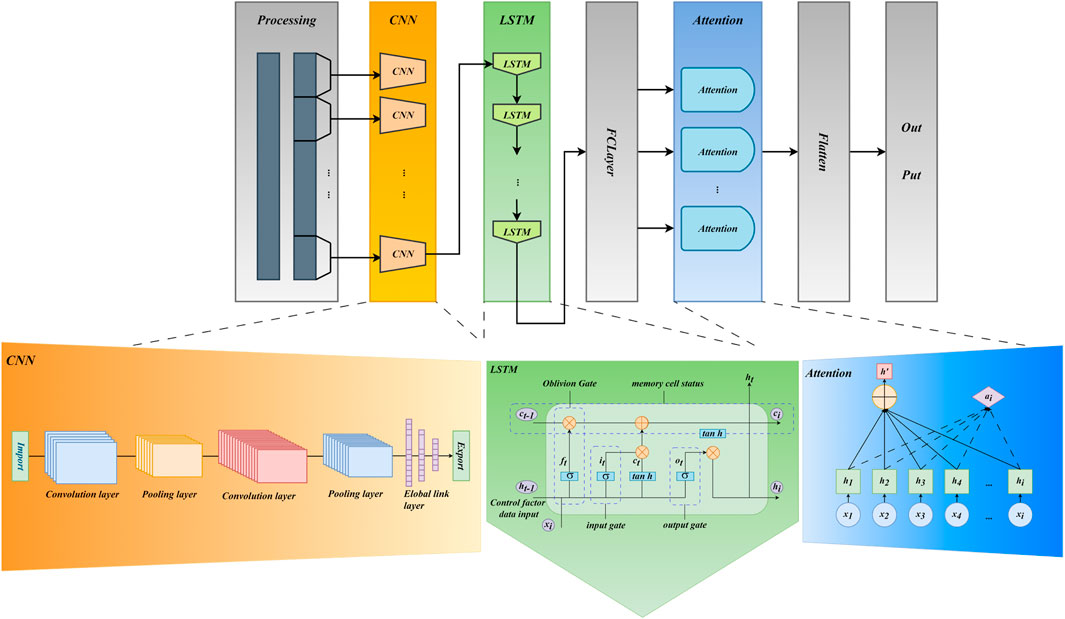
Figure 4. CNN-LSTM-Attention overall architecture.
The processes for each layer in the model are as follows:
(1) Input preprocessing. The preprocessing step is executed for the measured unit surge data and key influence factors. To enhance the training efficiency and the prediction accuracy, data standardization means are adopted to normalize the values. The data processed will be used as inputs to the model, denoted as X = [x1 . .xt-1,xt . .xn]T.
(2) CNN layer. The CNN layer is concerned with the extraction of information features of the data. Its output Hc = [hc1 .hct-1,hct . .hcj]T is represented as follows (Equation 3):
Where C is the output of the convolutional layer, P is the output of the pooling layer, W is the weight, b is the bias, and
(3) LSTM layer. The LSTM layer is constructed to learn the regularity of the CNN layer’s output. The output of the LSTM layer ht is represented as follows (Equation 4):
(4) Fully Connected Layer-Attention Layer. The result of the LSTM is used as input to the Attention layer, and the weights are solved using the probabilistic weighting method. The following (Equation 5) expresses the weighting coefficients of the Attention layer:
Attention layer assigns feature-specific weights to highlight key information. In the prediction of aquifer water yield property, it dynamically adjusts geological parameter weights according to their hydrological significance.
For output layer, its input is the output of the attention layer. The formula (Equation 6) for the output layer is:
where Yt is the output at moment t; Wj is the weight system, and bo is the bias vector.
Overall, the CNN module is utilized to extract features with different weights from the data series of the influencing factors. Based on this, the long-term correlation of the LSTM neural network is used to further enhance the accuracy of water yield property prediction. Finally, the innovative integration of an attention module at the terminal of the LSTM model aims to allow the model to focus on key data features, thereby significantly improving the prediction accuracy.
Aquifer water yield property prediction is divided into five steps: (1) Firstly, the drilling data and geophysical survey data are collected and calculated, and the main controlling factors are selected and analyzed; (2) the data of the main controlling factors of water yield property are statistically calculated by using Kriging interpolation method, and the relevant contour plots are drawn; (3) the aquifer water yield property is predicted by using different neural network models, such as CNN-LSTM-Attention prediction of aquifer water yield property; (4) we derive the accuracy of different models by comparing the predicted and actual values of UWI; (5) Finally, we discuss the zoning of aquifer water yield property by using the predicted UWI and the measured values of CNN-LSTM-Attention model. The research route is shown in Figure 5.
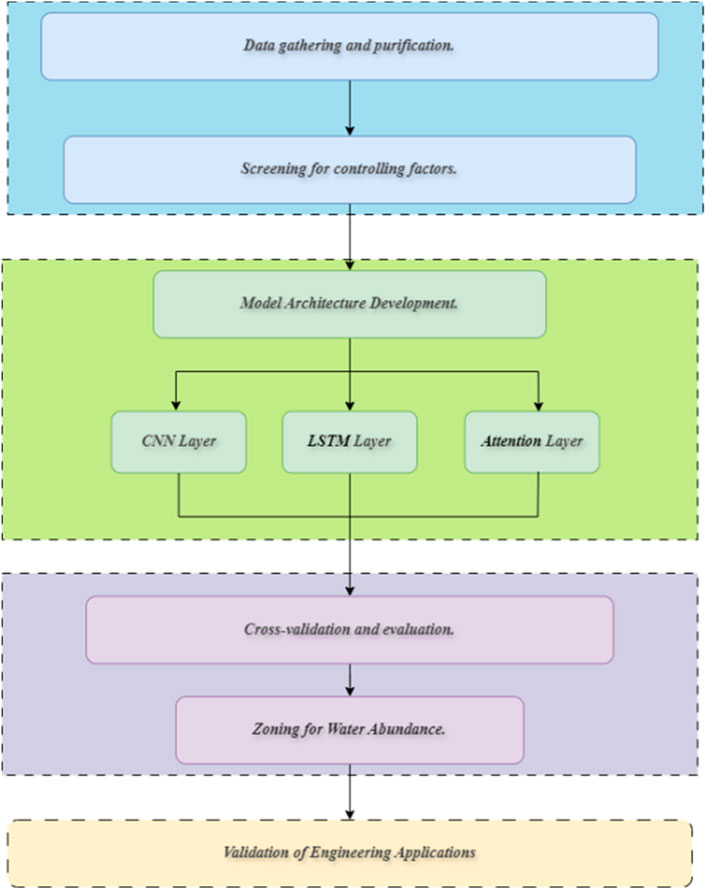
Figure 5. The research workflow chart.
4 Results
4.1 Correlation analysis
Correlation analysis is a statistical analysis method used to determine the degree of correlation between two variables, and the index is the correlation coefficient (r), which ranges from −1.0 to 1.0. The greater the absolute value of the correlation coefficient, the higher the correlation between the two factors. A negative value indicates a negative correlation, and a positive value indicates a positive correlation [24,25].
In this study, the degree of correlation between the two factors of water yield property is evaluated by the Pearson correlation coefficient with the formula (Equation 7):
Where: n is the number of samples;
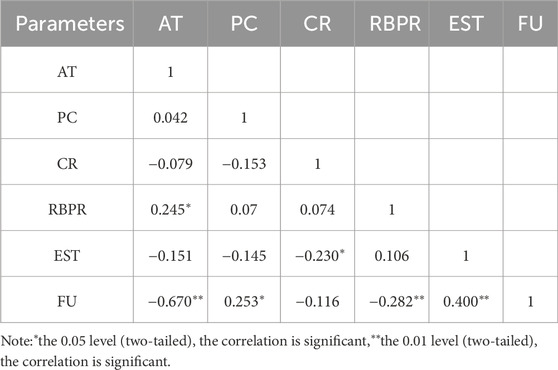
Table 1. Pearson’s correlation coefficients between control factors.
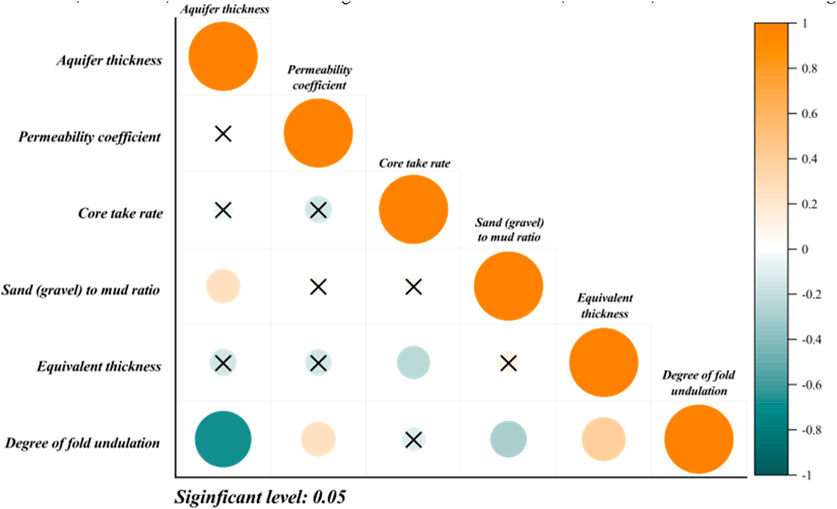
Figure 6. Heat map of Pearson correlation between control factors.
As shown in Figure 6, the higher the correlation between the two factors, the darker the color and the larger the radius. Among them, the absolute value of Pearson’s correlation coefficient between fold undulation degree and aquifer thickness is more significant than 0.6, indicating that they are strongly correlated. The absolute values of Pearson’s correlation coefficients between RBPR and AT, EST and CR, PC, RBPR, EST, and FU range from 0.2 to 0.4, indicating that they are poorly correlated.
When
4.2 Engineering application results
To verify the performance and accuracy of the model selected, the evaluation factors in each group were extracted from the contour plots drawn, five evaluation factors in total. Firstly, the proportion of the training set was defined as 89% of the total dataset. Robustness tests showed that the method proposed—using an 89% training dataset and an 11% test dataset—significantly outperforms conventional splits. Traditional approaches typically involve training set divisions of 80%, 85%, and 90%, corresponding test datasets of 20%, 15%, and 10%, respectively. The proposed method demonstrated a 19.3% reduction in the RMSE for prediction accuracy and a 66% reduction in the JS scatter for distribution consistency. Consequently, we selected a dataset splitting ratio of 89% for the training dataset and 11% for the test dataset to ensure the model maintains sufficient temporal continuity while achieving effective generalization capabilities. Thus, the 89 sets of sample data are selected as the model training dataset, and the remaining 11 sets of sample data (measured data) are treated as the testing dataset.
The study presented encompasses 100 valid data samples, representing a 3.5 km2 area across the 12th panel area in the Yili No.4 colliery. The data’s spatial resolution is set at a 50 m × 50 m grid, resulting in 140 spatial cells. Data collection time came from January 2020 to December 2023, with samples taken monthly, culminating in forty-eight time steps. Each sample comprises six evaluation factors, as detailed in Table 2.
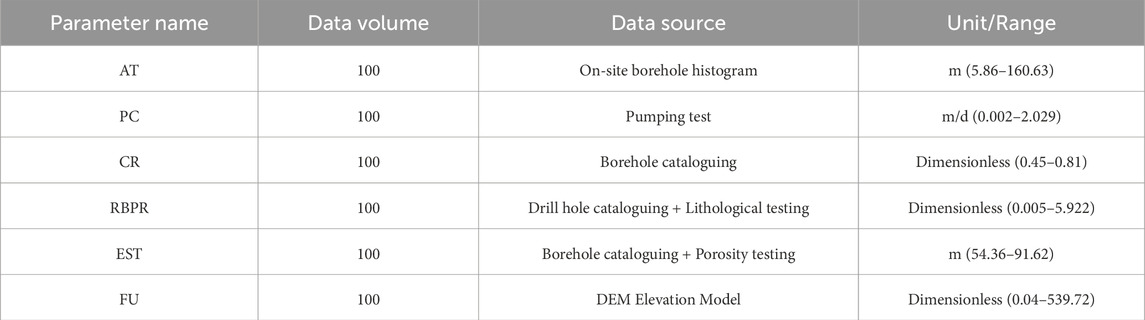
Table 2. Sources and other information of the sample data.
Next, the types of missing values are classified as either missing at random (MAR) or missing not at random (MNAR). Missing values are then filled using methods such as Kriging interpolation and LSTM time-series prediction. Following this, the local outlier detection is performed using an improved version of the Local Outlier Factor (LOF) algorithm. In contrast, global outlier detection utilizes the Mahalanobis Distance Thresholding method to eliminate certain outliers. Finally, the data are normalized by applying Min-Max normalization to the static parameters. The normalized data is then arranged into a four-dimensional array to meet the input requirements of the deep learning model. This four-dimensional array is converted into different cells, each containing one sample’s feature data, completing the raw data’s preprocessing.
The dataset includes both measured field data and interpolated data. It is essential to specify the spatial and temporal characteristics of the data, including the spatial grid structure and time steps. Data preprocessing steps must also be outlined, such as normalization, handling missing information, and transforming the data into a format suitable for model input. The first step in this process involves the hierarchical integration of various data sources. This integration occurs through two layers: the core data layer and the derived data layer, aiming for improved preprocessing accuracy. Measured data is included in the core data layer, such as borehole permeability coefficients and core take rates, along with their corresponding 3D spatial coordinates (x, y, z) and time stamps (t). Continuous field data generated by kriging interpolation is provided in the derived data layer, including the permeability coefficient field and fold undulation contours. The grid resolution in this layer is designed to match the geological body variability scale. Finally, strategies for constructing spatial local correlation and enhancing data are implemented to better meet the requirements of CNNs. This ensures that the dataset is well-suited for the temporal characteristics of the LSTM networks through time series structuring and long-range dependency guarantees.
In the stage of constructing the neural network model, a blank network structure is created using the layer graph function, network layers such as the input layer, sequence folding layer, and convolutional layer are added, respectively, and the connect layers function is used to connect the layers. Among them, the convolutional layer uses a 1 × 1 convolutional kernel, and the number of channels is set to 32 and 64, respectively. The training options function is used to set the training parameters, including the maximum number of iterations, the initial learning rate, the learning rate degradation factor, etc., affecting the stability of the model training and the length of training. The maximum number of iterations (epochs) is set to 100, the initial learning rate is 0.01, the learning rate decreasing factor is 0.5, and the learning rate decreasing period is 700. The dataset is disrupted at the beginning of each epoch, which helps the model generalize when learning and prevents the model from relying on a specific order of the data.
After training, the RMSE of the CNN-LSTM-Attention model are 1.76e−3 and 1.98e−3 for the training and the testing datasets, respectively. The RMSE of the overall datasets is calculated as 1.87e−3, and the fitting result of the training dataset is 0.9725.
5 Discussion
To prove that the water yield property prediction results are better through the CNN-LSTM-Attention model, we compare and analyze the prediction results with other neural network models, including the CNN, LSTM, and CNN-LSTM models.
5.1 Correlation of layers and geological features
When using the CNN-LSTM-Attention model to predict and evaluate the water-richness of aquifers, with the selection of six indicators including aquifer thickness, hydraulic conductivity, core recovery rate, sand-mud ratio, equivalent sandstone thickness, and formation undulation degree, the following analyzes the correlation between different layers/features in the model and specific geological phenomena:
(1) The main function of the CNN layer is to extract local features of the input data. In the problem of predicting the water yield property of aquifers, the CNN layer can extract local features from the six input geological indicators, and these local features are closely related to specific geological phenomena. The CNN can capture the local variation features of the aquifer thickness in space. It can extract the features of high-value or low-value areas of the hydraulic conductivity in a small range. The CNN can capture the local fluctuations of the core recovery rate. The local features of the sand-mud ratio can reflect the changes in the sedimentary environment. The CNN can identify the local changes in the equivalent sandstone thickness. It can extract local features such as the curvature and slope of the formation undulation.
(2) The LSTM layer is mainly used to process sequential data and can capture long-term dependencies in the data. In the prediction of the water yield property of aquifers, it can correlate geological information at different time or spatial positions, which is related to the geological evolution process. By inputting the six geological indicators into the LSTM layer in chronological or spatial order, it can learn the variation rules of the geological indicators over time or space. The LSTM can process the sequential information of geological structural activities.
(3) The function of the Attention layer is to assign different weights to different features and highlight important feature information. In the prediction of the water yield property of aquifers, the Attention layer can dynamically adjust the weights of the geological indicators according to the influence degree of different geological phenomena on the water yield property.
In summary, different layers of the CNN-LSTM-Attention model are associated with specific geological phenomena in aspects such as local feature extraction, sequential information processing, and feature weight assignment in the prediction of the water yield property of aquifers, thus more comprehensively capturing the relationship between geological information and the water yield property of aquifers.
5.2 Comparative analysis
To compare and analyze the superiority of the CNN-LSTM-Attention hybrid model with other neural network prediction models, the same sample dataset as that of the CNN-LSTM-Attention model is selected, with the first eighty-nine sets of sample data as the training set, and the remaining eleven sets of sample data as the test dataset, for CNN, LSTM, and CNN-LSTM models.
Based on the training test results, we plotted the actual value of the test dataset of different methods compared with the predicted value, as shown in Figure 7. The RMSE in the CNN model is 1.29e−2, the RMSE in the LSTM model is 1.19e−2, and the RMSE in the CNN-LSTM model is 2.98e−3. The prediction results from CNN, LSTM, and CNN-LSTM models, compared to the actual UWI, show accuracy rates of 78.9%, 85.7%, and 91.6%, respectively. Compared with the CNN-LSTM-Attention model, the three prediction models have a relatively large error, which quickly causes the wrong classification of water yield property grades. As such, the CNN-LSTM-Attention hybrid model outperforms the other three models in terms of UWI. Although the CNN-LSTM-Attention hybrid model performs well, some limitations remain, particularly in generalizability across variable geological domains, which has been noted in simulation-based assessments of cemented and backfilled geomaterials (Rizvi et al., 2020). In future research, further model optimization and validation under different geological settings are needed. Previous FEM-based studies on subsurface geometry effects (Alsabhan et al., 2021) highlight how structural heterogeneity can influence local stability, a principle relevant to aquifer yield classification.
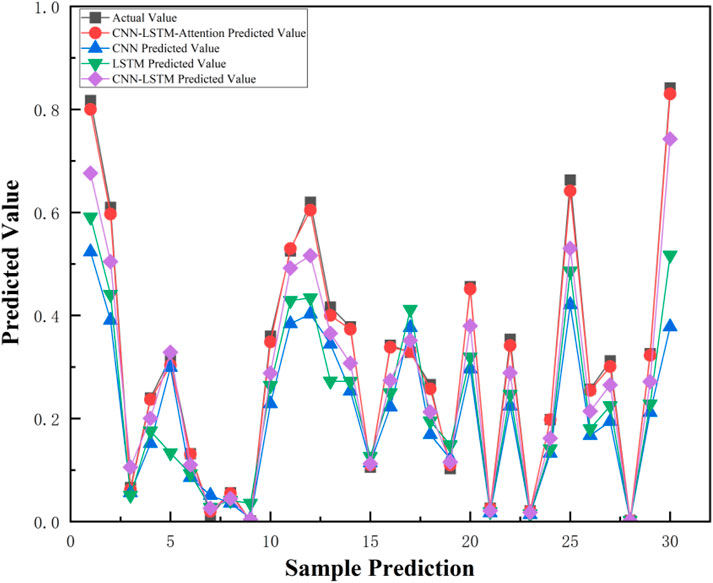
Figure 7. Comparison of predicted results from different models.
5.3 Water yield property zone
In the study, the UWI value predicted by the test dataset of the CNN-LSTM-Attention model is used to discriminate the water yield property zone (WYPZ) of the Paleocene aquifer in the 12th panel area of the Yili No.4 colliery (Figure 8a), with the four classifications (weak, weak-medium, medium, and strong WYPZs). The results are as follows: the stronger water yield property areas are mainly distributed in the southern region of the 12th panel area, and a small region is distributed in the northeastern region. The strong water yield property distribution area coincides with the area that has the highest CR. It aligns with the regions with a more significant PC and FU, indicating that the water yield property of the aquifer positively correlates with these three influencing factors. It conforms to the area with less brittle and plastic rocks and smaller equivalent sandstone thickness, indicating that water yield property negatively correlates with the two factors.
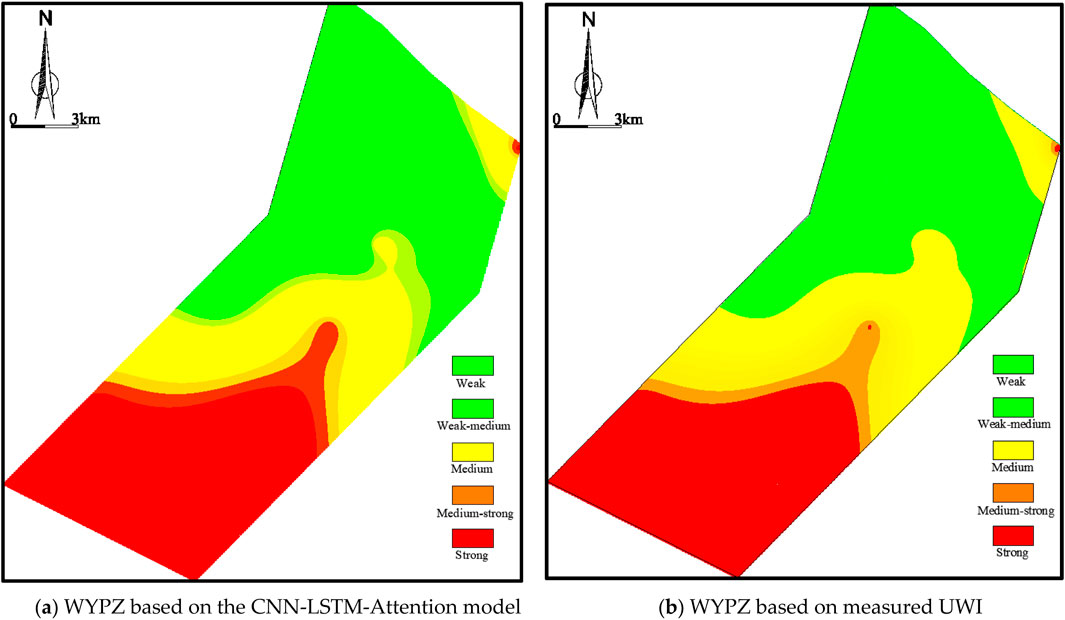
Figure 8. WYPZ of the Paleocene aquifer. (a) WYPZ based on the CNN-LSTM-Attention model. (b) WYPZ based on measured UWI.
To verify the reliability of the CNN-LSTM-Attention hybrid model, we plotted the second WYPZ based on the actual value of the UWI of the Paleocene aquifer, and the classification threshold range of the two methods used for the WYPZ is consistent in this study. The WYPZ based on measured UWI is discriminated, as shown in Figure 8b. By comparing the predicted WYPZ results (Figure 8a) with actual results (Figure 8b), it indicates that the differences between the two zoning results are slight, so the reliability and accuracy of the CNN-LSTM-Attention hybrid model are better.
5.4 Limitations and prospects
In this study, we selected 100 datasets from the hydrogeological exploration of Yili No.4 coal mine in the Western China mining area during 2020–2023. As such, the applicability of the CNN-LSTM-Attention hybrid model in the Eastern China mining area remains to be verified. Besides, constrained by the extent of coal mine hydrogeological exploration, this study employs a relatively small dataset, constituting a machine learning case study with limited samples. It should be noted that the advantages of deep learning algorithms become more pronounced with larger sample sizes. Lastly, relying solely on limited borehole-specific water inflow data within the study area to validate the accuracy of the model’s predictions lacks sufficient persuasiveness. In subsequent research, we will conduct further verification based on geophysical exploration (e.g., transient electromagnetic method, TEM) and actual mining production conditions.
In conclusion, with the emergence and promotion of new exploration techniques and theoretical research methods, studies on the prediction of aquifer water abundance will continue to advance, better serving mine safety production and the protection and utilization of groundwater resources.
6 Conclusion
1. Taking into consideration the geological characteristics in the study area, AT, PC, the rock coring rate, RBPR, EST, and FU are adopted as the main evaluation factors of the roof aquifer to address the problem of water damage. Through correlation analysis, the AT indicator is eliminated, and the four evaluation factors are subsequently analyzed to obtain the UWI of the aquifer, a more accurate index of water yield property.
2. The average accuracy and root mean square error (RMSE) are adopted as model performance evaluation indices. To ensure the robustness and credibility of the prediction, the eighty-nine sets of sample data are used as the training dataset, and the remaining eleven sets of sample data (measured data) are considered as the test dataset, totaling 100 independent data for repeated validation, inputted into a single CNN, a LSTM, and a hybrid CNN-LSTM, respectively, to compare their respective prediction effects. The results show that the prediction model based on the CNN-LSTM-Attention algorithm has higher accuracy and better prediction effect than other comparative models (CNN, LSTM, and CNN-LSTM).
3. The predicted values are highly fitted with the actual values, the average error is only 1.73e-3, and the prediction accuracy is as high as 99.05%. Utilizing the predicted UWI, the water yield property of the Paleocene aquifer is identified. Besides, comparing the WYPZ results based on the predicted UWI with the WYPZ results based on the actual UWI. The results show that the prediction accuracy of the CNN-LSTM-Attention hybrid model is better, and the water yield property zoning coincides with the actual situation.
The innovation of the study is that the evaluation factors can be derived from the geological drilling under the rare hydrogeological exploration, such as pumping tests. And then, an optimized algorithm model is applied to predict the UWI of the aquifer accurately and rapidly, and identify the WYPZ of the target aquifer. Thus, this research can address the cost and time-consuming issues of the hydrogeological exploration. This method is universally applicable to the study of WYPZ evaluation in mines with various geological conditions.
Data availability statement
The original contributions presented in the study are included in the article/supplementary material, further inquiries can be directed to the corresponding author.
Author contributions
JY: Methodology, Software, Writing – original draft, Conceptualization. WL: Writing – review and editing, Formal Analysis, Visualization. JZ: Writing – review and editing, Investigation. DL: Writing – review and editing, Validation, Data curation.
Funding
The author(s) declare that financial support was received for the research and/or publication of this article. The authors disclosed receipt of the following financial support for the research, authorship and/or publication of this article: the National Natural Science Foundation of China (No. 42372316).
Conflict of interest
The authors declare that the research was conducted in the absence of any commercial or financial relationships that could be construed as a potential conflict of interest.
Generative AI statement
The author(s) declare that no Generative AI was used in the creation of this manuscript.
Publisher’s note
All claims expressed in this article are solely those of the authors and do not necessarily represent those of their affiliated organizations, or those of the publisher, the editors and the reviewers. Any product that may be evaluated in this article, or claim that may be made by its manufacturer, is not guaranteed or endorsed by the publisher.
References
Ahmad, S., Rizvi, Z., Arsalan Khan, M., Ahmad, J., and Wuttke, F. (2019). Experimental study of thermal performance of the backfill material around underground power cable under steady and cyclic thermal loading. Mater. Today Proc. 17, 85–95. doi:10.1016/j.matpr.2019.06.404
Ahmad, S., Rizvi, Z. H., Arp, J. C. C., Wuttke, F., Tirth, V., and Islam, S. (2021). Evolution of temperature field around underground power cable for static and cyclic heating. Energies 14, 8191. doi:10.3390/en14238191
Ahmad, S., Rizvi, Z. H., and Wuttke, F. (2025). Unveiling soil thermal behavior under ultra-high voltage power cable operations. Sci. Rep. 15, 7315. doi:10.1038/s41598-025-91831-1
Al-Abadi, A. M., and Shahid, A. (2015). A comparison between index of Entropy and Catastrophe Theory methods for mapping groundwater potential in an arid region. Environ. Monit. Assess. 187, 576. doi:10.1007/s10661-015-4801-2
Alsabhan, A. H., Sadique, M. R., Ahmad, S., Alam, S., and Binyahya, A. S. (2021). The effect of opening shapes on the stability of underground tunnels: a finite element analysis. Int. J. Geomate 21, 19–27. doi:10.21660/2021.87.j2267
Cheng, J., and Wang, H. (2023). Prediction of water yield property of rock formations by transient electromagnetic method in boreholes based on fully convolutional neural network. Coal Geol. Explor. 51, 289–297. doi:10.13225/j.cnki.jccs.YG19.1508
Dai, X., Li, X., Zhang, Y., Li, W., Meng, X., Li, L., et al. (2023). A prediction model of coal seam roof water abundance based on PSO-GA-BP neural network. Water 15, 4117. doi:10.3390/w15234117
Deng, T., Cheng, A., and Han, W. (2019). “Visibility forecast for airport operations by LSTM neural network,” in 11th International Conference on Agents and Artificial Intelligence (ICAART 2019), Prague, Czech Republic, February 19–21, 2019.
Dong, F., Yin, H., Cheng, W., Zhang, C., Zhang, D., Ding, H., et al. (2024). Quantitative prediction model and prewarning system of water yield capacity (WYC) from coal seam roof based on deep learning and joint advanced detection. Energy 290, 130200. doi:10.1016/j.energy.2023.130200
Dong, S., Ji, Y., Wang, H., Zhao, B., and Cao, H. (2020). Water disaster prevention and control technology and application of typical roof of Jurassic coalfield in Ordos basin. J. China Coal Soc. 45, 2367–2375. doi:10.13225/j.cnki.jccs.dz20.0697
Gaur, S., Johannet, A., Graillot, D., and Omar, P. J. (2021). “Modeling of groundwater level using artificial neural network algorithm and WA-SVR model,” in Groundwater resources development and planning in the semi-arid region. Editors C. B. Pande, and K. N. Moharir (Cham: Springer International Publishing), 129–150.
Gong, H., Zeng, Y., and Liu, S. (2018). Evaluation of aquifer water richness based on improved fuzzy hierarchical analysis. Coal Technol. 37, 158–159.
Guo, Y., Tong, X., Xu, X., Liu, S., Feng, Y., and Xie, H. (2022). An anchor-free network with density map and attention mechanism for multiscale object detection in aerial images. IEEE Geoscience Remote Sens. Lett. 19, 1–5. doi:10.1109/lgrs.2022.3207178
Han, C., Pan, X., Li, G., and Tu, J. (2012). Fuzzy hierarchical analysis of aquifer water yield property based on GIS multi-source information integration. Hydrogeological and Eng. Geol. 39, 19–25. doi:10.16030/j.cnki.issn.1000-3665.2012.04.012
Haroon, A., Ahmad, S., and Hussain, A. (2017). “CFD Prediction of loss coefficient in straight pipes,” in Development of water resources in India. Editors V. Garg, V. P. Singh, and V. Raj (Cham: Springer International Publishing), 477–485.
Hochreiter, S., and Schmidhuber, J. (1997). Long short-term memory. Neural Comput. 9, 1735–1780. doi:10.1162/neco.1997.9.8.1735
Hou, E., Ji, Z., Che, X., Wang, J., Gao, L., Tian, S., et al. (2019). Water abundance prediction method of weathered bedrock based on improved AHP and entropy weight method. J. China Coal Soc. 44, 3164–3173. doi:10.13225/j.cnki.jccs.2018.1210
Hu, W., and Tian, G. (2010). Mine water disaster type and prevention and control countermeasures in China. Coal Sci. Technol. 38, 92–96.
Ki, M., Lee, K., and Lee, Y. H. (2020). Visibility data assimilation and prediction using an observation network in South Korea. Pure Appl. Geophys. 177, 1125–1141. doi:10.1007/s00024-019-02288-z
Li, L., Li, W., Shi, S., Yang, Z., He, J., Chen, W., et al. (2022). An improved potential groundwater yield zonation method for sandstone aquifers and its application in Ningxia, China. Nat. Resour. Res. 31, 849–865. doi:10.1007/s11053-022-10021-2
Liu, H. (2021). Research on water retention mining mechanism and classification of extra thick coal seams in weakly cemented strata in Yili. Xuzhou: China University of Mining and Technology.
Lu, Q., Li, X., Li, W., Chen, W., Li, L., and Liu, S. (2018). Risk evaluation of bed-separation water inrush: a case study in the Yangliu coal mine, China. Mine Water Environ. 37, 288–299. doi:10.1007/s10230-018-0535-z
Moreh, F., Hasan, Y., Rizvi, Z. H., Wuttke, F., and Tomforde, S. (2024a). “MCMN deep learning model for precise microcrack detection in various materials,” in 2024 International Conference on Machine Learning and Applications (ICMLA), Miami, FL, USA, 18-20 December 2024 (IEEE), 1928–1933.
Moreh, F., Hasan, Y., Rizvi, Z. H., Wuttke, F., and Tomforde, S. (2024b). “Wave-based neural network with attention mechanism for damage localization in materials,” in 2024 International Conference on Machine Learning and Applications (ICMLA), Miami, FL, USA, 18-20 December 2024 (IEEE), 122–129.
Moreh, F., Lyu, H., Rizvi, Z. H., and Wuttke, F. (2024c). Deep neural networks for crack detection inside structures. Sci. Rep. 14, 4439. doi:10.1038/s41598-024-54494-y
Rizvi, Z. H., Akhtar, S. J., Husain, S. M. B., Khan, M., Haider, H., Naqvi, S., et al. (2022). Neural network approaches for computation of soil thermal conductivity. Mathematics 10, 3957. doi:10.3390/math10213957
Rizvi, Z. H., Mustafa, S. H., Sattari, A. S., Ahmad, S., Furtner, P., and Wuttke, F. (2020). “Dynamic lattice element modelling of cemented geomaterials,” in Advances in computer methods and geomechanics. Editors A. Prashant, A. Sachan, and C. S. Desai (Singapore: Springer), 655–665.
Rizvi, Z. H., Shrestha, D., Sattari, A. S., and Wuttke, F. (2018). Numerical modelling of effective thermal conductivity for modified geomaterial using lattice element method. Heat. Mass Transf. 54, 483–499. doi:10.1007/s00231-017-2140-2
Rizvi, Z. H., Zaidi, H. H., Akhtar, S. J., Sattari, A. S., and Wuttke, F. (2020). Soft and hard computation methods for estimation of the effective thermal conductivity of sands. Heat. Mass Transf. 56, 1947–1959. doi:10.1007/s00231-020-02833-w
Sal, an A. G., and Bayu, K. (2021). Visibility forecasting using autoregressive integrated moving average (ARIMA) models. Procedia Comput. Sci. 179, 252–259. doi:10.1016/j.procs.2021.01.004
Shi, S., Shi, G., and Most-Liang, F. (2023). Prediction of K2 greywacke water-rich zones based on multivariate LSTM network - a case study of Yangquan Boli mining area. Coal Geol. Explor. 51, 155–163. doi:10.12363/issn.1001-1986.22.06.0471
Song, C. (2017). Research and application of fine structural characteristics and deformation damage mechanism of weakly cemented sandstone. Beijing: University of Science and Technology.
Song, C., Ji, H., Liu, Y., and Sun, L. (2016). Influence factors of driving disturbance of adjacent roadway under the condition of weakly cemented surrounding rock. J. Min. Saf. Eng. 33, 806–812. doi:10.13545/j.cnki.jmse.2016.05.007
Sun, L., Ji, H., and Yang, B. (2019). Physical and mechanical property characteristics of weakly cemented strata rocks in a typical mining area in Western China. J. China Coal Soc. 44, 866–874. doi:10.13225/j.cnki.jccs.2018.6039
Sun, Q., Zhang, J., Zhang, Q., and Zhao, X. (2017). Analysis and prevention of geo-environmental hazards with high-intensive coal mining: a case study in China’s western eco-environment frangible area. Energies 10, 786. doi:10.3390/en10060786
Sun, S., Cao, Z., Zhu, H., and Zhao, J. (2020). A survey of optimization methods from a machine learning perspective. IEEE Trans. Cybern. 50, 3668–3681. doi:10.1109/tcyb.2019.2950779
Wang, G. (2016). Research on aquifer water richness based on fuzzy hierarchical analysis. Coal Technol. 35, 209–210. doi:10.13301/j.cnki.ct.2016.08.086
Wang, Q., Wang, H., and Yang, J. (2021). Hydrogeochemical characteristics of water-filled aquifers and comprehensive identification of mine water sources in the Western Jurassic mining area. J. Eng. Geol. 29, 1084–1093. doi:10.13199/j.cnki.cst.2019.02.001
Wang, S., Duan, Z., and Ma, L. (2019). Research status and development trend of geological guarantee technology for green coal development in western China. Coal Sci. Technol. 47, 1–6. doi:10.13199/j.cnki.cst.2019.02.001
Wang, Y., and Gupta, H. V. (2024). Towards interpretable physical-conceptual catchment-scale hydrological modeling using the mass-conserving-perceptron. Water Resour. Res. 60, WR037224. doi:10.1029/2024wr037224
Wu, Q., Fan, Z., and Liu, S. (2011). GIS-based information fusion aquifer water richness evaluation method - water richness index method. J. China Coal Soc. 36, 1124–1128. doi:10.13225/j.cnki.jccs.2011.07.002
Wu, Q., Huang, X., Dong, D., Yin, Z., Li, J., Hong, Y., et al. (2000). “Three-map-Double prediction method” for evaluating water inrush condition of coal seam roof. J. China Coal Soc. 25, 62–67. doi:10.13225/j.cnki.jccs.2000.01.014
Wu, Q., Wang, J., and Liu, D. (2009). A new practical method for evaluating the water breakout of coal bed floor Ⅳ: application of AHP-type vulnerability index method based on GIS. J. China Coal Soc. 34, 233–238. doi:10.13225/j.cnki.jccs.2009.02.025
Wu, Q., Xu, K., and Zhang, W. (2016). Further discussion on the “Three-map-Double prediction method” for predicting and evaluating the risk of water inrush from coal seam roof. J. China Coal Soc. 41, 1341–1347. doi:10.13225/j.cnki.jccs.2015.1210
Xue, S., Li, W., and Guo, Q. (2018). Research on the prediction of water richness of roof bearing aquifer based on FAHP-GRA evaluation method. Metal. Min., 168–172. doi:10.19614/j.cnki.jsks.201804030
Yang, T., Li, J., Wan, L., and Wang, S. (2021). A simulation study on the spatial-temporal characteristics of pore water pressure and roof water inrush in an aquiclude. Shock Vib. 2021, 6643894. doi:10.1155/2021/6643894
Yuan, Y., Zhou, S., Bian, J., Wang, J., Han, W., and Yan, J. (2025). High-resolution geochemical data mapping with swin transformer-convolution-based multisource geoscience data fusion. IEEE J. Sel. Top. Appl. Earth Observations Remote Sens. 18, 3530–3543. doi:10.1109/jstars.2025.3525675
Zhang, J., and Dai, Q. (2022). Latent adversarial regularized autoencoder for high-dimensional probabilistic time series prediction. Neural Netw. 155, 383–397. doi:10.1016/j.neunet.2022.08.025
Zhou, H., Wu, Z., and Zhang, X. (2021). Shear wave prediction method based on LSTM recurrent neural network. Fault-Block Oil and Gas Field 28, 829–834.
Zhu, J., Li, W., Teng, B., Lu, Q., Li, D., and Li, L. (2024). Overburden failure and water–sand mixture outburst conditions of weakly consolidated overlying strata in Dananhu No.7 coal mine. Sci. Rep. 14, 8439. doi:10.1038/s41598-024-59240-y
Zhu, J., Liu, Y., Liu, Q., Yang, S., Fan, J., Cui, Y., et al. (2021). Application and evaluation of regional control technology of limestone water hazard: a case study of the Gubei coal mine, North China. Geofluids 2021, 1–15. doi:10.1155/2021/6661319
Keywords: water yield property, hydrogeological data, CNN-LSTM-attention, prediction performance, unit water inflow
Citation: Yang J, Li W, Zhu J and Li D (2025) Aquifer water yield property prediction based on a hybrid neural network model: a case of yili no.4 colliery, Xinjiang. Front. Earth Sci. 13:1620487. doi: 10.3389/feart.2025.1620487
Received: 29 April 2025; Accepted: 23 July 2025;
Published: 05 August 2025.
Edited by:
Gordon Woo, Risk Management Solutions, United KingdomReviewed by:
Zarghaam Rizvi, GeoAnalysis Engineering GmbH, GermanyPadam Jee Omar, Babasaheb Bhimrao Ambedkar University, India
Copyright © 2025 Yang, Li, Zhu and Li. This is an open-access article distributed under the terms of the Creative Commons Attribution License (CC BY). The use, distribution or reproduction in other forums is permitted, provided the original author(s) and the copyright owner(s) are credited and that the original publication in this journal is cited, in accordance with accepted academic practice. No use, distribution or reproduction is permitted which does not comply with these terms.
*Correspondence: Wenping Li, d2VucGluZ2xpNjVAY3VtdC5lZHUuY24=; Jingzhong Zhu, YWxnemp6MDgwMUAxMjYuY29t