 Xiaochuan Huang
 Jincang Liu
 Ting Yang
 Yun Li
 Lipeng Zhou
- 1Surveying and Mapping Institute Lands and Resource Department of Guangdong Province, Guangzhou, China
- 2Key Laboratory of Natural Resources Monitoring in Tropical and Subtropical Area of South China, Ministry of Natural Resources, Guangzhou, China
- 3Guangdong Science and Technology Collaborative Innovation Center for Natural Resources, Guangzhou, China
A Corrigendum on
Artificial slope deformation monitoring and analyzing based on SBAS technology
by Huang X, Liu J, Yang T, Li Y and Zhou L (2025). Front. Earth Sci. 13:1504304. doi: 10.3389/feart.2025.1504304
In the published article, there were errors in Tables 1–6. During our final review of the manuscript, we identified that all the tables contained data that may require additional confidentiality considerations due to institutional protocols or collaborative agreements. To ensure full compliance with these obligations while preserving the scientific validity of our work, the integers of the longitude and latitude values in the tables have been hidden. The corrected tables and their captions appear below.
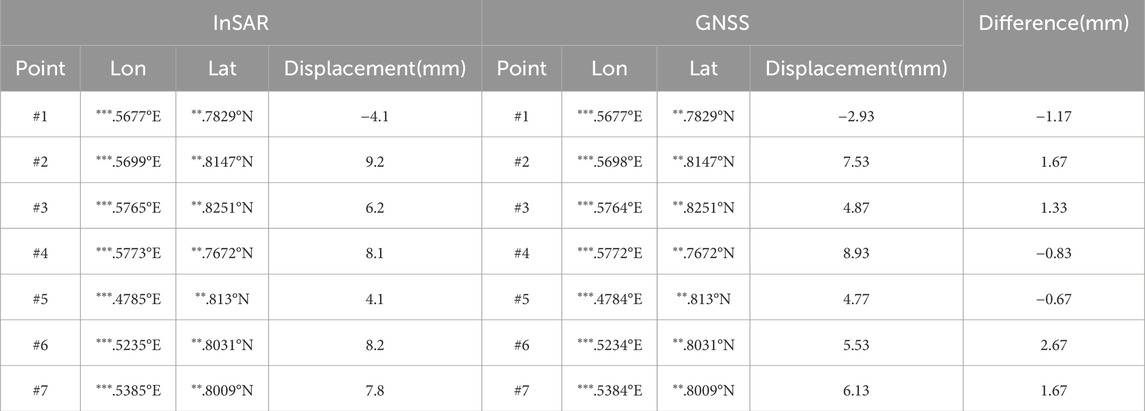
Table 1. Information of InSAR and GNSS points.
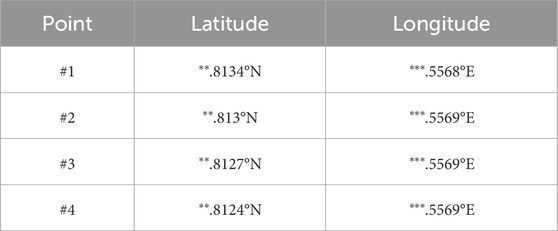
Table 2. Sample point details.
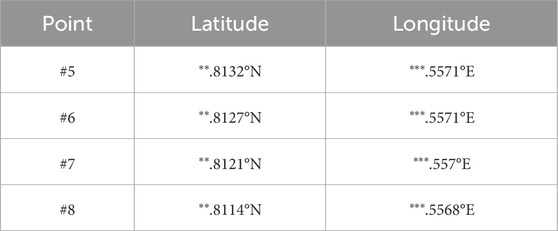
Table 3. Sample point details.
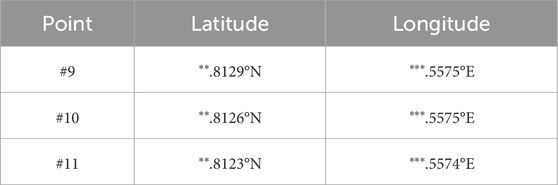
Table 4. Sample point details.

Table 5. Sample point details.
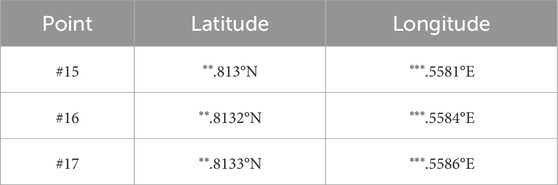
Table 6. Sample point details.
The authors apologize for this error and state that this does not change the scientific conclusions of the article in any way. The original article has been updated.
Publisher’s note
All claims expressed in this article are solely those of the authors and do not necessarily represent those of their affiliated organizations, or those of the publisher, the editors and the reviewers. Any product that may be evaluated in this article, or claim that may be made by its manufacturer, is not guaranteed or endorsed by the publisher.
Keywords: artificial slopes, the risk of geological disasters, slope stability, SBAS-InSAR, Foshan
Citation: Huang X, Liu J, Yang T, Li Y and Zhou L (2025) Corrigendum: Artificial slope deformation monitoring and analyzing based on SBAS technology. Front. Earth Sci. 13:1620908. doi: 10.3389/feart.2025.1620908
Received: 30 April 2025; Accepted: 06 May 2025;
Published: 26 June 2025.
Edited and reviewed by:
Tianming Huang, Chinese Academy of Sciences (CAS), ChinaCopyright © 2025 Huang, Liu, Yang, Li and Zhou. This is an open-access article distributed under the terms of the Creative Commons Attribution License (CC BY). The use, distribution or reproduction in other forums is permitted, provided the original author(s) and the copyright owner(s) are credited and that the original publication in this journal is cited, in accordance with accepted academic practice. No use, distribution or reproduction is permitted which does not comply with these terms.
*Correspondence: Ting Yang, NTgzMjgyNzk4QHFxLmNvbQ==