 Le Zhang1,2
 Mingxia Yuan
 Yanlong Guo
- 1Anhui Cultural Tourism Innovative Development Research Institute, Anhui Jianzhu University, Hefei, China
- 2School of Arts, Anhui Jianzhu University, Hefei, China
- 3Social Innovation Design Research Centre, Anhui University, Hefei, China
- 4Anhui Institute of Contemporary Studies, Anhui Academy of Social Sciences, Hefei, China
Against the backdrop of accelerating environmental pollution driven by rapid urbanisation, understanding the spatial evolution patterns of environmental quality in typical lake basins is crucial for regional sustainable development. This study focuses on the Chaohu region of China (comprising 1 city, 1 district, and 3 counties). Based on the Pressure-State-Response (PSR) model, a multi-dimensional indicator system incorporating both natural and human factors was established. Combining the Entropy Weight-TOPSIS method with ArcGIS, we assessed the spatial environmental quality from 2019 to 2023. The results indicate: 1) During the study period, the spatial environmental quality of the basin showed a fluctuating upward trend, with the relative proximity of spatial environmental quality in the Chaohu region increasing to 0.536, exhibiting significant phased fluctuations. 2) Environmental quality exhibits a spatially differentiated pattern with higher quality in the northwestern region and lower quality in the southeastern region. Among these, Baohe District has the best environmental quality, Feixi County and Feidong County have relatively good environmental quality, while Chaohu City and Lujiang County have relatively poor environmental quality; 3) Comparing the weight coefficients of various indicators, among the 19 indicators in the PSR framework, the five indicators with the highest weight coefficients were annual average sulphur dioxide concentration (P3), per capita disposable income of urban households (S2), added value of the tertiary industry (R2), fiscal expenditure on energy conservation and environmental protection (R4), and gross domestic product (R6). The Chaohu River Basin requires differentiated governance strategies to balance urbanisation and ecological protection—urban areas with dense populations should strengthen pollution control and invest in green infrastructure, while ecologically sensitive areas must strictly adhere to resource consumption red lines. The ‘zonal governance’ strategy proposed in this study provides a reference framework for the governance of similar lake basins.
1 Introduction
In the process of rapid urbanisation, how to achieve a balanced development link environmental quality and economic and social progress amidst rapid urbanization has gained international attention as a hot topic (Shu et al., 2023). According to the United Nations Environment Programme (UNEP), the utilization of the Earth’s resources has more than tripled over the past 50 years and continues to grow at an average rate of more than 2.3 per cent per year. As one of the countries with the fastest urbanisation rates in the world, China’s GDP has jumped from 91.93 trillion yuan in 2018 to 134.91 trillion yuan in 2024 since the reform and opening up. While the urbanisation rate has increased to 67%, China also faces problems such as compressed ecological space, worsening environmental pollution, and excessive resource consumption (Zhao et al., 2022; Liu et al., 2018). In lake basin areas, complex environmental issues such as water eutrophication, habitat fragmentation, and exceeding environmental carrying capacity have become key issues constraining high-quality regional development (Huang et al., 2013). Urban development should not come at the expense of environmental quality; protecting the environment is essential for sustainable urban development. As an important ecological barrier for the Yangtze River Delta urban agglomeration (Ouyang et al., 2014), the evolution of the spatial environmental quality of the Chaohu Lake basin is not only related to the survival and wellbeing of 8 million residents, but also of considerable importance for the economic advancement of the entire Anhui Province and the edifice of modern cities (Wu et al., 2022).
The spatial environment, as a composite system composed of ecological environment and habitat, It serves as both the material foundation for human life and development (Wang and Zhao, 2016), and a crucial metric for assessing regional sustainable development capacity. The region’s sustainability, stemming from the interplay between the natural surroundings and human endeavours, not only illustrates the dynamic connection between the two but also significantly influences the region’s ecological security and its capacity for high-quality development (Jiang et al., 2021; Fa et al., 2020). The influencing factors of spatial environmental quality include biological and human-induced influences. Natural elements encompass vegetation area (Xu et al., 2020), climate alteration (Song et al., 2020) and so on. Anthropogenic factors mainly include urbanisation (Yi et al., 2018), resource use (Hua et al., 2017) and ecological restoration (Zhang et al., 2018). Any single environmental element cannot scientifically and objectively reflect the caliber of the surroundings (Cai et al., 2021; Shi et al., 2020; Zhao et al., 2021; Fang et al., 2021; Zhao et al., 2020; Ahmad and Zhao, 2018; Zhu et al., 2022; Qian et al., 2022). The correlation between urban development and spatial environment has been extensively studied by scholars in various countries (Willis, 2015; Kline et al., 2001; Wang et al., 2019). Yang Yan and his team examined the connection between ecology and society in Meixian County, India. Their findings will help us understand which factors impact environmental quality (Yang Y. et al., 2021). Dong Li and his team are conducting an in-depth investigation into the relationship urbanisation plays in the surrounding regional. Their aim is to highlight the crucial influence factors that stimulate the development of the local environment (Ding et al., 2015).
Currently, research on spatial environmental quality primarily focuses on two aspects. On the one hand, it emphasises the analysis of single environmental factors, such as Robert Owen’s ‘garden city’ theory (Lei et al., 2021) and the environmental Kuznets curve (Caviglia-Harris et al., 2009) theories. On the other hand, it conducts multi-factor research (Berger and Hodge, 1998; Wang et al., 2021; Psomiadis et al., 2020; Zhang et al., 2017; Qureshi et al., 2020; Zhang et al., 2021; Bi et al., 2021; Shan et al., 2019), employing remote sensing technology, the AHP hierarchical analysis method, entropy weight-TOPSIS analysis method, and subjective evaluation methods. Yang Xiuping et al. assessed the ecological security level of 16 cities in Hubei Province (Yang X. et al., 2021) by developing an indicator system using the PSR model. The entropy method was employed to impartially allocate weights to the indicator system in order to examine the temporal and spatial evolution trajectory of regional urban tourist ecological security. Yan Yuxiang et al. analysed the ecological changes in Shanghai using remote sensing (Yan et al., 2021). In terms of constructing a spatial environmental quality indicator system, the academic community has established a mature methodological framework based on the integration of multiple models, primarily employing the PSR model, the multi-system coupling coordination model, and the factor interaction analysis model based on geographic detectors. These models each have distinct focuses depending on the evaluation objectives, data characteristics, and spatial scales. Among them, the PSR model is frequently applied to the assessment of environmental quality in lake basins and urban agglomerations, facilitating the identification of the driving mechanisms behind environmental changes. Liu Yan et al. constructed a PSR model framework to examine the interconnected collaborating among the travel sector and the ecological system in Nagasaki Prefecture, Japan (Wang et al., 2019). Wu Changxue and colleagues developed a thorough assessment index system using the PSR framework. They used this system to evaluate ecological wellbeing of 11 administrative areas in the Weihe River Basin in Northwest China in the years 1980, 2000, and 2020 (Wu et al., 2024).
Despite the significant advancements achieved by researchers domestically and internationally in the evaluation of urban environmental quality, there are still several limitations in the present studies: the case studies are mostly concentrated on developed urban agglomerations, and insufficient attention is paid to ecologically sensitive areas such as lake watersheds. In particular, there has been little research on lake-ringed areas, and the issues that arise in these regions vary due to factors such as geographical location, industrial structure, and ecological carrying capacity. These shortcomings lead to the difficulty of existing theories to effectively guide the precise environmental management of typical areas such as Chaohu Lake. Currently, research on lake regions primarily focuses on individual environmental factors, such as water quality or spatial environmental quality, and lacks comprehensive evaluations of the overall spatial and surrounding urban environmental quality. After reviewing relevant literature, Quan Han et al. assessed changes in water levels and their impact on water quality in Baiyangdian Lake, China, based on climate factors and water level parameters (Han et al., 2022). Panpan Yao et al.took the Qinghai Lake basin as the study object, analysed the spatiotemporal change characteristics of the Qinghai Lake basin from 1986 to 2022, and explored the spatial distribution and driving factors of ecological indices (Yao et al., 2025). This study selected the PSR model to construct indicators, avoiding the one-sidedness of a single indicator system and more comprehensively reflecting the comprehensive impact of human activities on the natural environment, thereby enhancing the targeted and practical nature of the research. The entropy weight-TOPSIS method combines the objectivity of the entropy weight method with the comprehensiveness of the TOPSIS method, enabling more precise assessment of environmental quality levels acrossdifferent regions in the Lake Chaohu area and identifying differentiated influencing factors. Finally, ArcGIS is used to visually present the analysis results in map form, providing a clearer understanding of the distribution and spatial differences in environmental quality across regionsin the Lake Chaohu area. In summary, how to improve regional spatial environmental qualityand propose applicable methods is the key issue that needs to be addressed at preset.
Against the backdrop of rapid urbanisation, the Chaohu region faces multiple environmental challenges, including water pollution, loss of land resources, and difficulties in solid waste disposal. After long-term governance, the water quality of Chaohu Lake and its main tributarieshas continued to improve in recent years, and Chaohu governance has achieved certain results. Affected by the size of cities, industries, and population in the Chaohu basin, the water environment carrying capacity of Chaohu Lake is limited, and Chaohu governance is a long-term and systematic project. Therefore, this study selected the area around Lake Chaohu (including 1 city, 1 district, and 3 counties) as the research area due to its typical characteristics. Based on the above circumstances, this study mainly analyses the following points: 1) This study combines the actual situation of the Chaohu Lake area, takes 1 city, 1 district and 3 counties in the Chaohu Lake area as the research object; 2) By reviewing the Hefei StatisticalYearbook and relevant record platforms, the evaluation index system is established upon the theoretical foundation of the ‘PSR’ model; 3) Using SPASS AU, evaluation and analysis were conducted using the entropy weight-TOPSIS method, and ArcMap 10.7 was used for spatial visualisation of the information; 4) Analyse changes in the spatial environment of the region. Existing problems in the Chaohu area are found, corresponding suggestions are given, and targeted measures are proposed. The purpose is to obtain relatively reasonable and complete evaluation results, and to furnish a scientific foundation for the preservation of the surroundings and superior quality economic advancement of the Chaohu Lake area. At the same time, it provides theoretical support and practical reference for the sustainable development ofsimilar regions.
2 Study area and methodology
2.1 Study area
Chaohu Lake ranks among the five biggest freshwater lakes in China. The basin area is 13,486 square kilometres, with 35 rivers (Zhang et al., 2015). It is one of the national grain and oil production bases, with abundant water resources, which can promote the urban construction and economic development of Hefei. The region has a subtropical climate with a humid monsoon pattern, characterized by mild temperatures and high precipitation levels (Wei et al., 2022). Chaohu Lake is dominated by hilly terrain and is rich in water resources. The hilly terrain is conducive to buildingdiverse landscapes, cultivating agriculture, improving the environment, increasing space for activities and enhancing the standard of living. However rapid economic development and accelerated urbanisation have damaged the local spatial environment.
In 2024, the hydrological integrity of the whole Chaohu Lake remained stable in class IV, and the comprehensive nutrient status index of the whole lake decreased by 1.9 years-on-year, the best in 10 years. The number of cyanobacterial blooms in the whole year of 2024 decreased by 21 years-on-year, and cyanobacteria around the shores of the lake did not gather for 4 years without any obvious odour. Biodiversity has also been gradually enriched, with 826 plant species around Chaohu Lake, 59 species of fish recorded, and an increase of 84 species of birds over the past 10 years to 311 species. In August 2020, General Secretary Xi Jinping visited Anhui Province and clearly pointed out the importance of treating Chaohu Lake, making it the best business card of Hefei. In addition, during his speech, General Secretary Xi Jinping highlighted the value and significance of Chaohu Lake, explaining the relationship between cities and lakes, people and water. He pointed out the direction of spatial environmental management in the Chaohu Lake region to enhance the environmental condition of the Chaohu Lake region.
The study area is the region surrounding Lake Chaohu (as shown in Figure 1), including Baohe District, Chaohu City, Feixi County, Feidong County, and Lujiang County. The selectionof these five regions as research subjects is based on the following reasons: 1) Geographic distribution. These regions are distributed around Chaohu Lake, covering mountainous, plain, and urban areas surrounding the lake. Studying these regions helps to gain a more comprehensive understanding of the environmental characteristics of the lake and its surrounding areas. 2) Economic and industrial structure. These five regions each have unique economic and industrial structures. Feixi County is primarily focused on manufacturing and agriculture; Feidong County is primarily focused on industry and agriculture; Lujiang County is dominated by agriculture and resource-based industries; Chaohu City, as the core area around Chaohu Lake, is primarily focused on aquaculture and tourism; and Baohe District, as part of the main urban area, is centred on services and emerging industries. Due to the differing development models across these regions, researchers should adopt a tailored approach to gain a deeper understanding of the relevant ecological, environmental, and socio-economic factors. Selecting these five regions facilitates a more in-depth analysis of issues, enabling the formulation of moretargeted recommendations to provide crucial support for regional spatial quality protection andsustainable development.
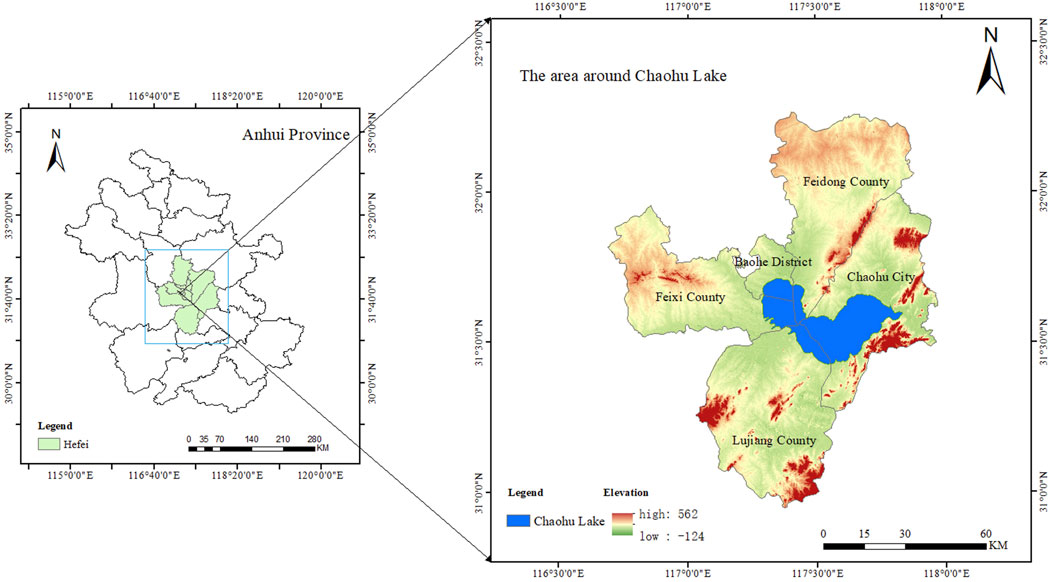
Figure 1. Study area around Chaohu Lake.
2.2 Methodological process
This paper presents a comprehensive framework for an indicator system founded on the PSRmodel. The environmental quality of the Chaohu region is analyzed using the entropy weight-TOPSIS method. The precise procedural flowchart is as follows (Figure 2): First, drawing on existing studies, the indicator system of three dimensions is formulated according to the PSR model. Second, data collection and processing. The research data pertaining to the Chaohu Lake are derived from the Hefei Statistical Yearbook (2019–2023), the statistical yearbooksof cities (counties) (2019–2023), and the statistical report on the economy and societal advancement of the nation (2019–2023) are collected and processed. Thirdly, the thorough assessment of the Chaohu Lake region was conducted by entropy weight-TOPSIS. Analyse the comprehensive analysis between 1 city, 1 district and 3 counties in the circum-Chao Lake region over a 5-year period.
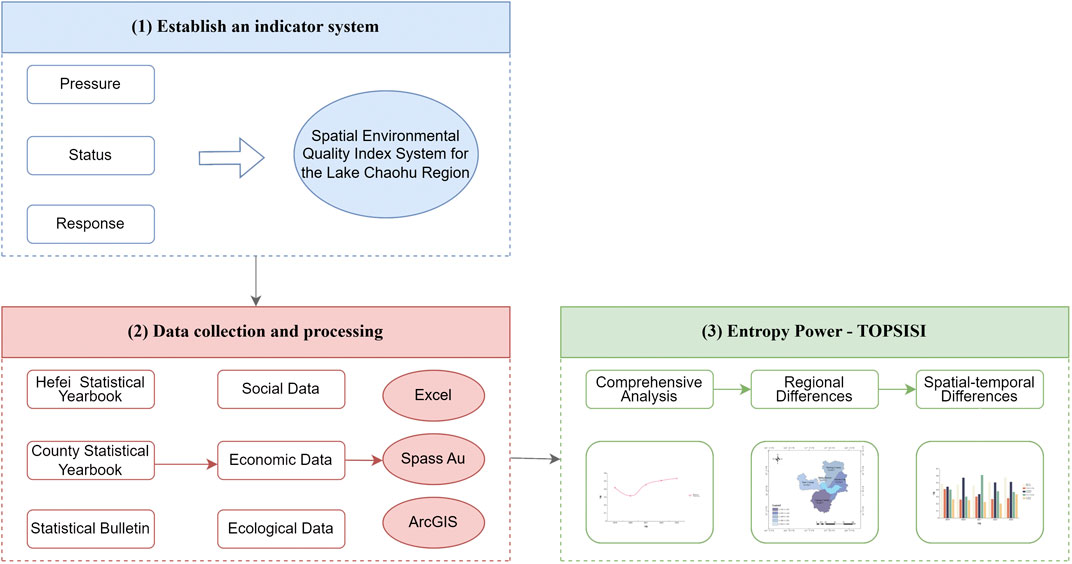
Figure 2. Research method process.
2.3 Research methods
The singular purpose of this investigation isto set up “P-S-R″ indicators utilizing the model, and to comprehensively assess the Chaohu area through entropy weighting method and TOPSIS. Because evaluation indicators include both positive and negative indicators, the SPASSAUsoftware was used to convert negative indicators into positive ones by using reverse indicatornormalisation. The normalisation method was used to quantify and normalise all the evaluation indicators, and to analyse the degree of proximity between the spatial environmental quality and the optimal scenario between the areas around Chaohu Lake.
2.3.1 Pressure-State-Response (PSR) modelling
The PSR model illustrates the connection between humans and the environment and is essential for evaluating enviroment quality. It was initially proposed by a Canadian statistician (Li et al., 2022). The model creates a framework for responding to existing problems based on the pressures and state of the spatial environment as a result of human activities. It can strengthen the correlation between indicators and make the indicator system have a solid theoretical foundation. The text provides a more detailed account of how human activities affect the ecosystem, improves the state of environmental quality, and responds to the environment (Wang et al., 2018).
2.3.2 Entropy weighting method to determine weights
The entropy weight TOPSIS model is an extremely potent methodology that expertly fuses entropy and TOPSIS methods (Shengde and Zhonghua, 2022). The entropy value method determines indicator weights objectively, reflecting their importance in evaluation. The TOPSIS method calculates the difference between the best and worst solutions, and finally the evaluation program determines the ranking of various programs by assessing their closeness to the optimal outcome (Shen and Ren, 2022).
Determining weights using the entropy weighting method is a crucial factor, it can effectively solve the error brought about by subjective factors. To successfully calculate, it is important to follow these steps precisely (Equations 1–5):
Step 1: Possible correlations, both positive and negative, could exist among environmental indicators. Consequently, after the process of collecting raw data is over, it is necessary to reverse the negative indicators.
Step 3: Work out the entropy figure.
Formulas:
Step 4: Calculate indicator weights:
2.3.3 Construction of the TOPSIS model
The main steps in applying the TOPSIS method are as follows Equations 6–11: Step 5: Create a standardized decision matrix labeled as V:
Step 6: Determine both the positive and negative ideal solution.
Step 7: Determine the interval among the positive and negative solution options for every city in various years and compute the distances between them.
The deviation from the forward optimal solution is represented by
Step 8: Calculate the total evaluation score:
2.3.4 Application of Arc GIS system
ArcMap 10.7 is a powerful geographic information system (GIS) software widely used for spatial data analysis, map creation, and visualization. When studying the spatial environmental quality and influencing factors of the region, ArcMap 10.7 can serve the following purposes:By combining the relative proximity data of various regions around Lake Chaohu calculated using the Entropy Weight-TOPSIS model with the administrative division data of the Lake Chaohu region, it can more clearly illustrate the evolution trends and potential issues of the spatial structure. Assisting researchers in intuitively understanding the differences in environmental quality across regions and their spatial distribution characteristics, providing a foundation for subsequent spatial analysis.
3 Data and indicators
3.1 Data sources
The indicator set constructed in this research includes 19 indicators covering the period 2019–2023. The PSR model was combined with scientific principles to improve data feasibility and reduce errors. The primary sources of information for this research are: (1) The Hefei City Statistical Yearbook, statistical yearbooks of cities and counties, and Statistical bulletin provide the statistics, meteorology, water resources, and socio-economic factors (Hefei, 2024; Chaohu, 2024; Feidong, 2024; Feixi, 2024; Lujiang, 2024). (2) Ecological environment data come from the bulletin of ecological environment quality status in each region. All information manipulations were carried out in SPASS AU and ArcGIS software. To improve the promptness, reliability, and precision of the data. This study analyses the state of the surroundings and its determinants of the Chaohu region in the last 5 years (2019, 2020, 2021, 2022 and 2023).
3.2 Indicator establishment
The PSR model is a collaborative framework system designed by the OECD and the UNEP to investigate environmental concerns. It illustrates the interaction between the surroundings and people through the “PSR” framework and has been extensively utilized by numerous scholars both domestically and internationally (Kan et al., 2022).
This research builds an indicator system based on the PSR framework, considering the present condition of the examined region (Table 1). The PSR model takes into consider multiple influencing elements, including social, economic, environmental, resource, and ecological issues. A total of nineteen evaluation indicators were chosen from three different perspectives to create an indicator system consisting of three tiers: Objective level, standard level, and metric level (Table 2). Pressure (P) is typically quantified by the impact factor resulting from human activities. State (S) denotes the state of ecological and socio-environmental changes in the region produced by pressure. Response (R) a set of countermeasures forced upon humans as a result of threats to environmental quality.
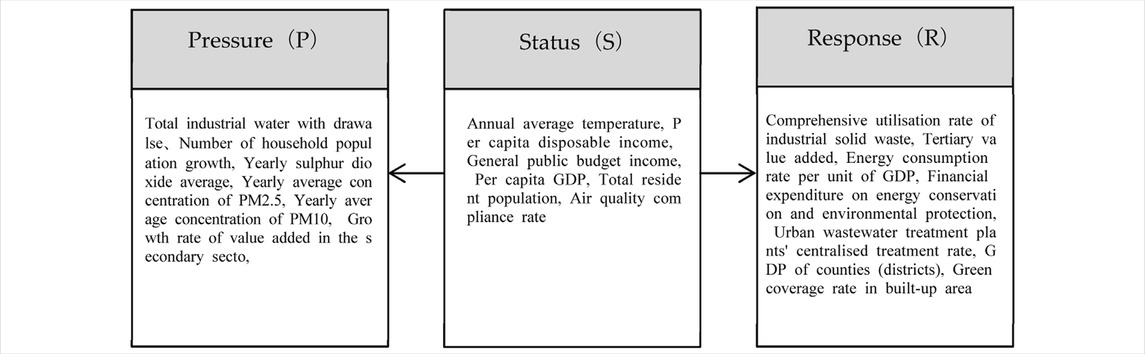
Table 1. PSR model framework.
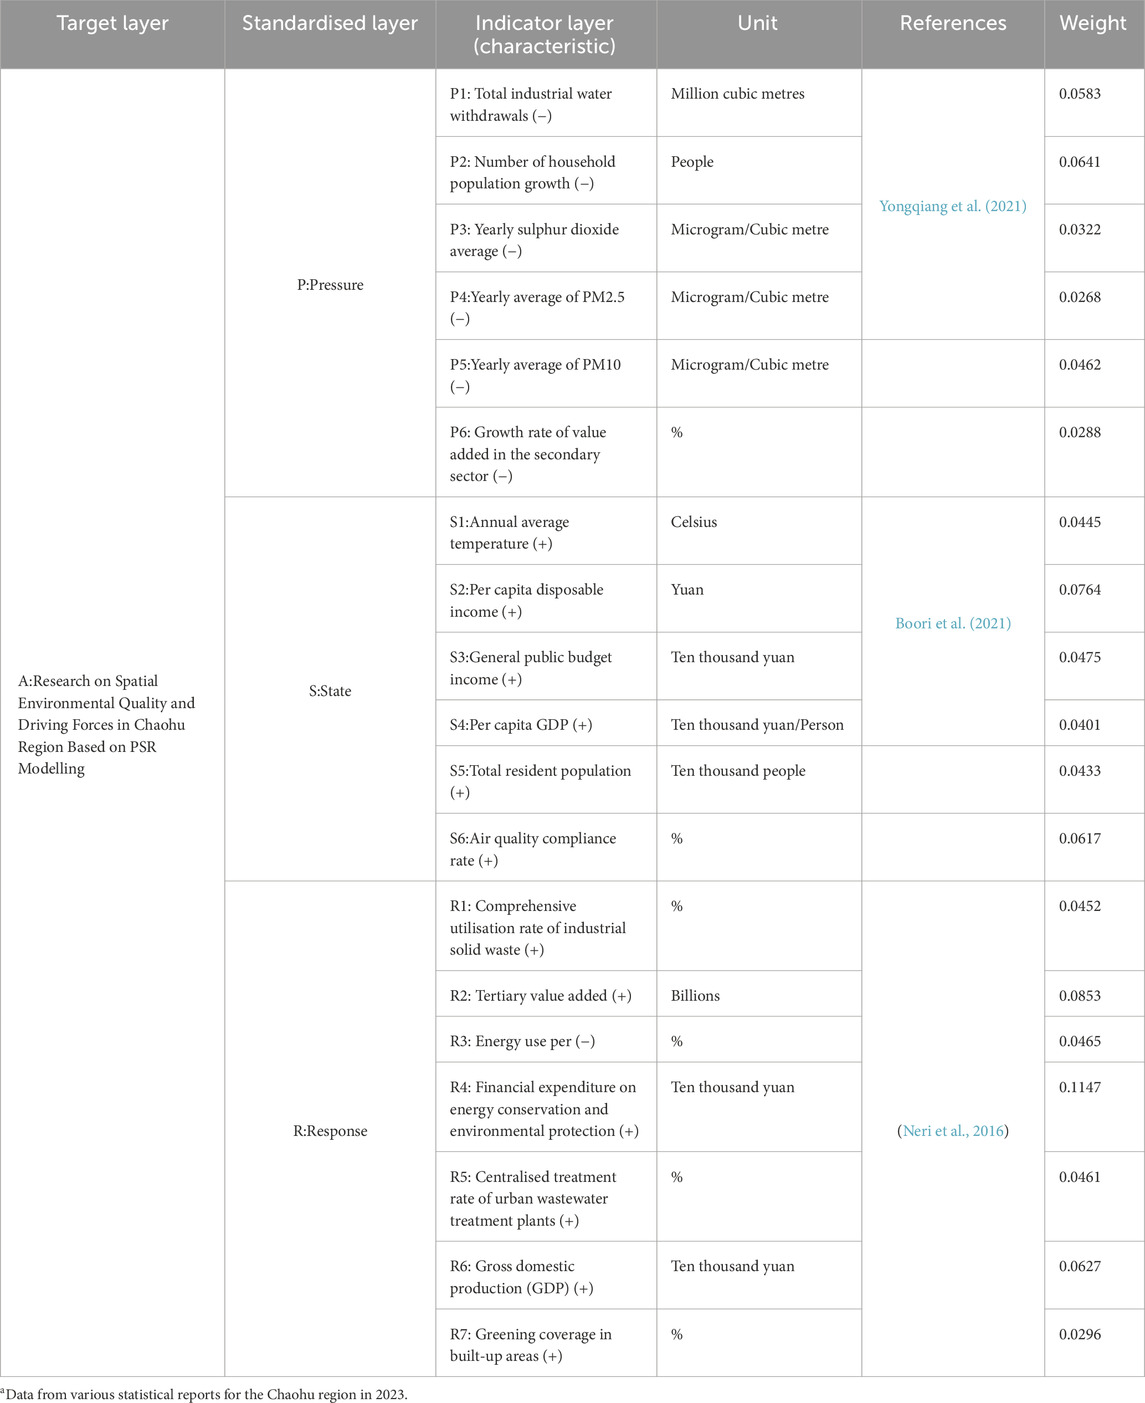
Table 2. Indicator system for the lake Chaohu region.
3.2.1 Selecting pressure indicators
“Pressure” (P) mainly refers to the impact of human activities on the ecological environment. The six selected indicators have clear pressure attributes: total industrial water withdrawal (P1), the number of household population growth (P2), sulfur dioxide concentration (P3), average annual concentration of PM2.5 (P4), average annual concentration of PM10 (P5), and the growth rate of value-added of the secondary industry (P6), respectively. P1 refers to the total amount of water resources that are consumed by the regional industry during production in acertain period of time, and the over-withdrawal of water will affect the aquatic ecosystem and change the conditions of the water environment. The higher P2 represents the higher population density and the higher degree of spatial environmental damage caused by the behavior of human activities. P3, P4, P5 these are typical air pollution indicators, they reflect the pressure of air pollution, and the higher the intensity of the regional waste emission has a significant impact on the pressure of air pollution. P6 represents the comprehensive environmental pressure caused by economic activities. The secondary industry is usually the main sector of resource consumption and pollutant emission, and the increase of its growth rate may lead to greater resource extraction pressure and pollutant emission pressure.
The selection of these indicators covers three types of stressors, namely, resource consumption, pollutant emission and economic drivers, effectively reflecting the main sources of pressure on the environment in the Chaohu region.
3.2.2 Selecting status indicators
“State” (S) refers mainly to measuring the measurability of environmental problems caused by pressure dimensions. Based on existing studies, six indicators were established to reflect the current state of the region at the current stage. They are: average annual temperature (S1), per capita household disposable income (S2), general public budget income (S3), per capita GDP (S4), total resident population (S5), and air quality attainment rate (S6). S1 is an important factor affecting the environmental conditions of the region. Changes in temperature affect the temperature of water bodies, evaporation rates and ecosystem distribution, and are therefore important indicators of environmental conditions. S2 reflects socio-economic carrying capacity and interacts with environmental quality. S3 and S4 can measure the economic base of the region and support the ability to manage the environment. S5 is an important indicator of a place’s comprehensive strength and level of development. The larger the population and thericher the labor force, the larger the market. S6 directly reflects the quality of the atmospheric environment, reflecting the state caused by pressure (pollutant emissions).
These indicators integrate natural ecological and socio-economic conditions, reflecting the comprehensive impact of spatial environmental quality and avoiding the limitations of a purely natural perspective.
3.2.3 Selection of response indicators
“Response” (R) is a series of measures taken by human beings to improve the environment. Based on existing research, seven indicators have been established to show the measures taken by regions to make changes to existing problems. They are: comprehensive utilization rate of industrial solid waste (R1), added value of tertiary industry (R2), energy consumption rate per unit of GDP (R3), financial expenditures on energy conservation and environmental protection (R4), centralized treatment rate of urban sewage (R5), gross domestic product (R6), and greening coverage rate of built-up areas (R7). R1 is a key indicator for assessing the level of industrial pollution control and resource recovery, and is an important indicator of circular economy response measures. R2 is because the tertiary industry is usually ‘greener’ than the secondary industry, and the increase in its value-added can be regarded as an economic response to the adjustment of industrial structure and the alleviation of environmental pressures. R3 reflects the efficiency of energy utilisation, which is an important response indicator for energy conservation and emission reduction. R4 is the direct financial investment of the government in energy saving and environmental protection projects, representing clear response measures. R5 is a key infrastructure indicator for water pollution control, directly reflecting the improvement of the city’s water environment management capacity, and representing important response actions. R6 is the macro-level ‘development response’, a fundamental reference for balancing economic growth with environmental considerations. It also represents the combined response of social systems to various types of pressures and changes in state. R7 constitutes a direct response measure in urban ecological construction. Increasing greening is animportant means to improve urban microclimate, purify air and enhance ecological quality. The four categories of response measures, namely, quality, economic transformation, policy investment, and ecological restoration, clearly reflect the specific actions and investments taken by society to improve the environment or address environmental challenges, forming a multi-level indicator system.
In summary, the indicator system scientifically and systematically selects 19 specific indicators under the PSR framework. It provides a relatively comprehensive quantitative tool for assessing the spatial environmental quality and its influencing factors in the Chaohu Lake area, reflecting a comprehensive research perspective.
4 Result
After applying the entropy weight method to determine the weights of the collected data, theTOPSIS method is used to analyse and evaluate the relative proximity of the evaluation object to the ideal solution. The optimal ideal solution represents a decision scheme where all attribute values reach their maximum values, while the negative ideal solution represents a decision scheme where all attribute values reach their minimum values. Based on the standardised attribute values, the optimal and worst values for each attribute can be determined, and the optimal ideal solution and negative ideal solution can be constructed. By comprehensively considering the weights and relative proximity of each indicator across the five regions, it is possible to provide targeted opinions and strategies for subsequent decision-making.
4.1 Indicator weight analysis
The calculation of indicator weights was performed under the TOPSIS model based on the entropy weight method. The original data were standardised by constructing a standardised evaluation matrix, and then standardised to obtain the standardised matrix. The entropy weight method was used to calculate the weights of each detailed indicator. The calculation results of the weights of each detailed indicator in the spatial environmental quality evaluation indicator system of the Huaihu Lake region are shown in Table 3.
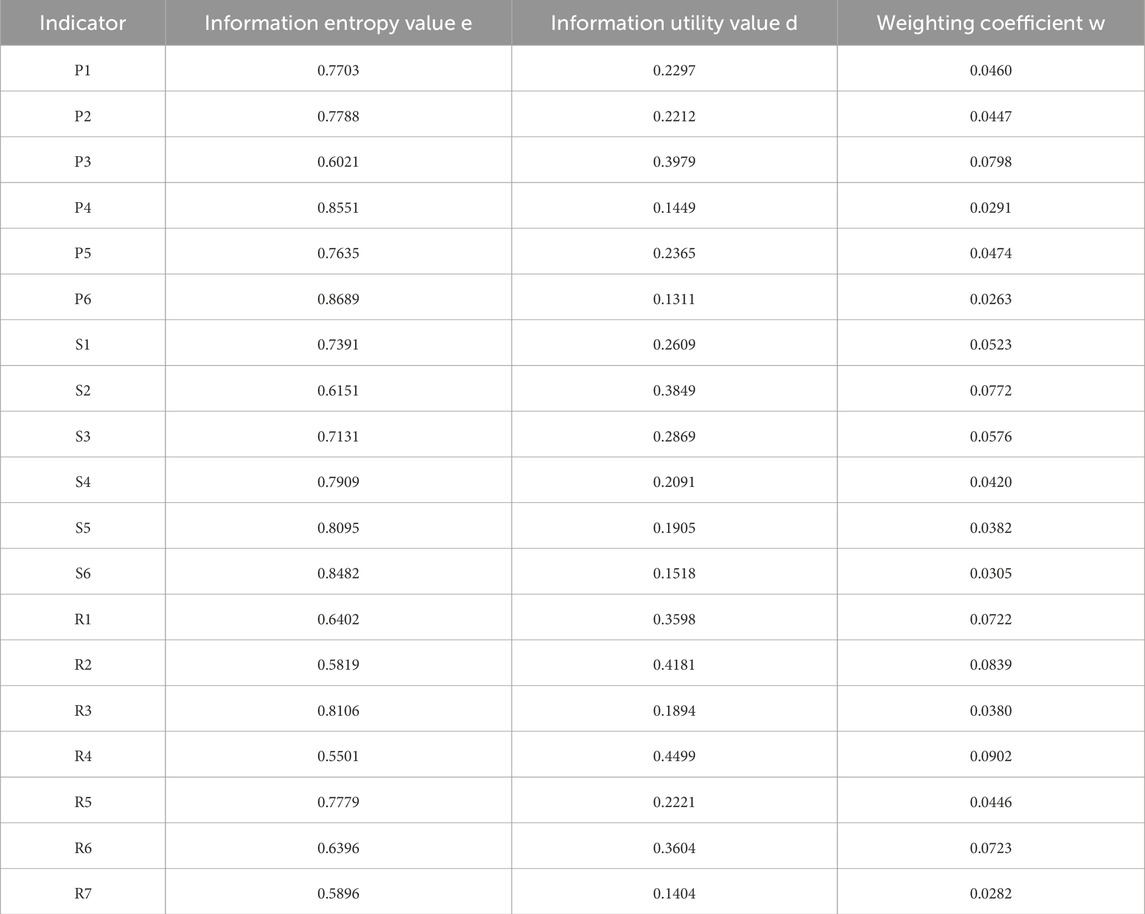
Table 3. Weighting table for indicators in the spatial environmental quality evaluation system for the lake Chaohu region.
From the perspective of indicator weights, the five factors with the greatest influence on the spatial environmental quality of the Huaihu Lake region are annual average sulphur dioxide concentration (P3), per capita disposable income of household residents (S2), added value of the tertiary industry (R2), fiscal expenditure on energy conservation and environmental protection (R4), and gross domestic product (R6), accounting for 0.0798, 0.0772, 0.0839, 0.0902, and 0.0723, respectively. This indicates that environmental pressures, population and economic pressures, and environmental management responses significantly influence the regional spatial environmental quality. These pressure and response factors intertwine to jointly shape the current environmental conditions, indicating that pressure factors remain a core challenge that cannot be avoided in improving regional environmental quality.
Specifically, the annual average concentration of sulphur dioxide (P3) has a high weighting, highlighting that air pollution prevention and control, particularly the air environmental pressure caused by industrial and energy structure, is one of the key issues facing the Lake Chaohu region. Per capita disposable income of household residents (S2) and gross domestic product (R6) have relatively high weightings, reflecting that the living pollution pressure caused by population growth and improved living standards, as well as the impact of economic development models on the environment, cannot be ignored. The high weighting of tertiary industry added value (R2) suggests the significant potential and necessity of industrial structure adjustment for improving environmental quality. The high weighting of fiscal expenditure on energy conservation and environmental protection (R4) indicates that the responsive role of environmental governance investments is crucial for enhancing spatial environmental quality.
4.2 Relative proximity analysis
Based on the calculation results in the table, the TOPSIS model was used to construct an evaluation matrix and calculate the relative proximity values for each year from 2019 to 2023. The results are shown in Table 4.
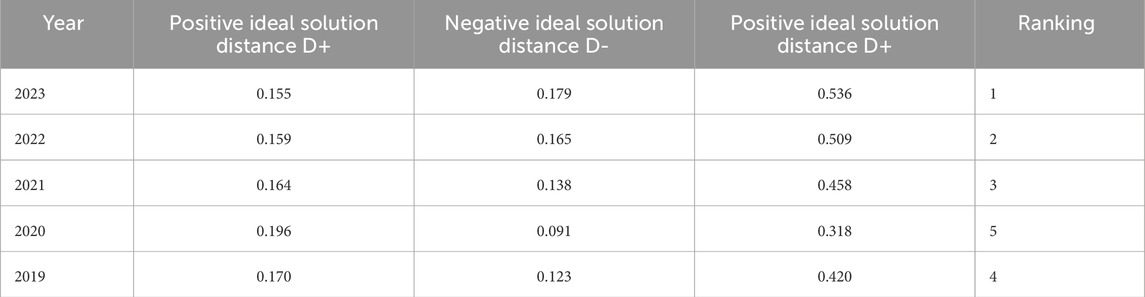
Table 4. Relative proximity of the Chaohu region from 2019 to 2023.
The changes in the relative proximity of the Chaohu Lake region are shown in Table 4: From 2019 to 2023, the relative proximity of the Chaohu Lake region increased from 0.420 to 0.536. The specific values of relative proximity were 0.420, 0.318, 0.458, 0.509, and 0.536, respectively. This indicates that in recent years, due to the implementation of relevant policies, industrial restructuring, and other socio-economic environmental factors, the spatial environmental quality of the Chaohu Lake region has been affected to some extent (Anhui Province Chaohu Lake Administration Bureau, 2025). To analyse the trend more intuitively, we extracted data from key years.
The data shows that, over time, the overall spatial environmental quality of the Chaohu Lakeregion has exhibited a fluctuating upward trend. However, a significant downward trend emerged in 2020, with the value dropping from 0.420 in 2019 to 0.318 in 2020, which may be related to the outbreak of COVID-19. During the pandemic, some environmental protection projects, such as Chaohu Lake wetland restoration and corporate rectification, may have been suspended due to labour shortages or supply chain issues, hindering the progress of ecological improvement. The temporary reduction in transportation and industrial activities during the pandemic may have led to short-term improvements in some environmental indicators. However,as the pandemic subsided and industrial production activities resumed, the rebound effect gradually increased. Starting from 2021, the relative proximity index showed an annual upward trend, rising from 0.458 to 0.536. This indicates that after 2021, as economic activities resumed, there was a greater emphasis on green and low-carbon development, such as promoting new energy and restricting high-energy-consuming industries, thereby avoiding the environmental impact of the economic rebound in 2020. The sustained growth in the added value of the tertiary industry (R2) indicates that the economic structure is shifting toward low-energy consumption and high-value-added sectors, thereby reducing resource consumption intensity. Meanwhile, the steady increase in environmental protection fiscal expenditures (R4) has provided financial support for ecological governance, enhancing environmental carrying capacity (Hefei Municipal Government, 2024).
This trend demonstrates that through systematic, long-term policy implementation and technological innovation, the Chaohu Lake region has successfully achieved synergistic improvementsin environmental quality and economic development, providing a sustainable development model for other regions.
4.3 Regional differences analysis
This study used the entropy-weighted TOPSIS method to calculate the relative proximity values of each city over the 5-year period (Table 5), ranked from highest to lowest as Baohe District (0.576), Feixi County (0.456), Feidong County (0.445), Chaohu City (0.332), and Lujiang County (0.263).
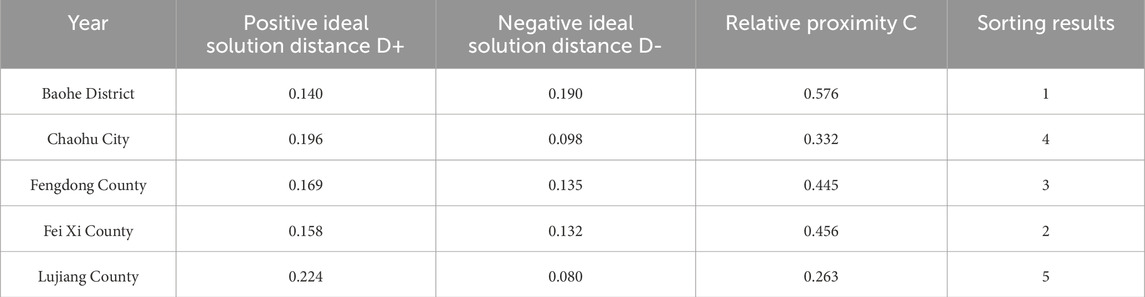
Table 5. Relative proximity of various regions around Lake Chaohu over 5 years.
According to Table 5, the ArcGIS natural breakpoint classification method was used to visualise the spatial differences among five cities in the Chaohu Lake region over the 5-year period from 2019 to 2023. As shown in Figure 3, the overall pattern exhibits a ‘higher core area with decreasing values in surrounding areas’ characteristic. The formation of such differences is closely related to various factors, including the natural environmental conditions, landuse changes, population density, economic development models, and policy orientations of each city and county (Anhui Provincial People’s Government, 2025).
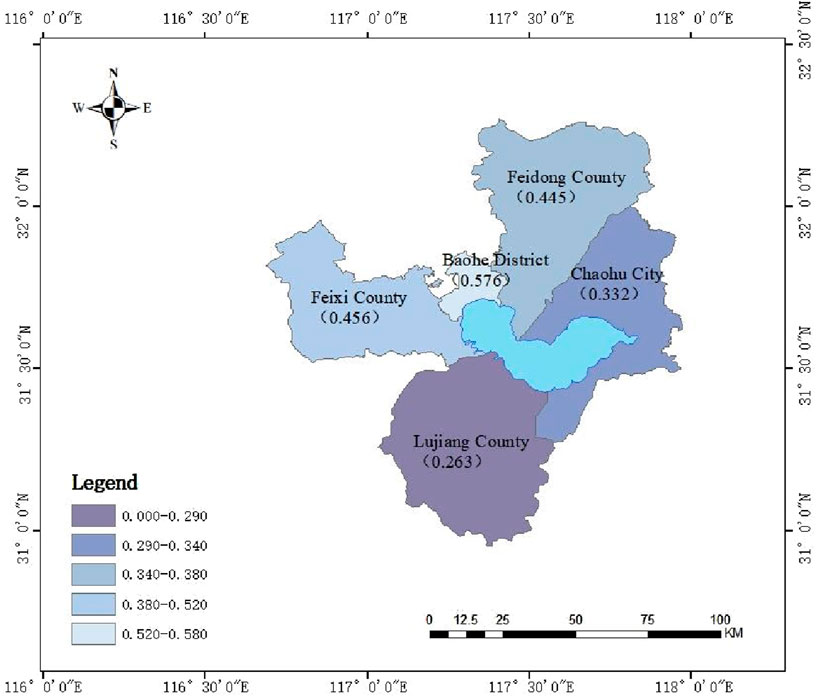
Figure 3. Five-year comprehensive relative proximity of the Lake Chaohu region.
Baohe District, as the central urban area of Hefei City, has the highest relative proximity value in the comprehensive evaluation of spatial environmental quality. This is primarily attributed to industrial structure transformation, ecological space optimisation, high green space coverage, well-developed urban infrastructure, and strong pollution control capabilities. Feixi County follows closely behind with a relative proximity value of 0.456. This indicates that its economic development model is relatively green, environmental support measures are effective, and the coordination level of spatial environmental quality is high. Feidong County’s relative proximity value is 0.445, slightly lower than Feixi County. This indicates that industrial structure adjustment needs to be strengthened, and environmental pressure factors have a more significant impact on its spatial environmental quality. Chaohu City’s relative proximity value is0.332, at a medium-to-low level. This indicates that environmental pressure factors, particularly non-point source pollution, remain significant, and the coordination between environmental support and economic development and social progress needs to be strengthened. Lujiang County has the lowest relative proximity value for spatial environmental quality, at only 0.263. This reflects that its economic development model has a more noticeable impact on the ecological environment space, with relatively weak resource and environmental foundations, environmental pressure factors dominating, and the lowest level of coordination in spatial environmental quality.
4.4 Spatio-temporal difference analysis
Based on the results obtained from the entropy weight-TOPSIS model, the relative proximity of each region around Lake Chaohu was calculated. Using ArcGIS software, the relative proximity index of the spatial environmental quality was divided into five levels, and a map showing the distribution of these levels across the various regions of Lake Chaohu during the study period was created (Figure 4).
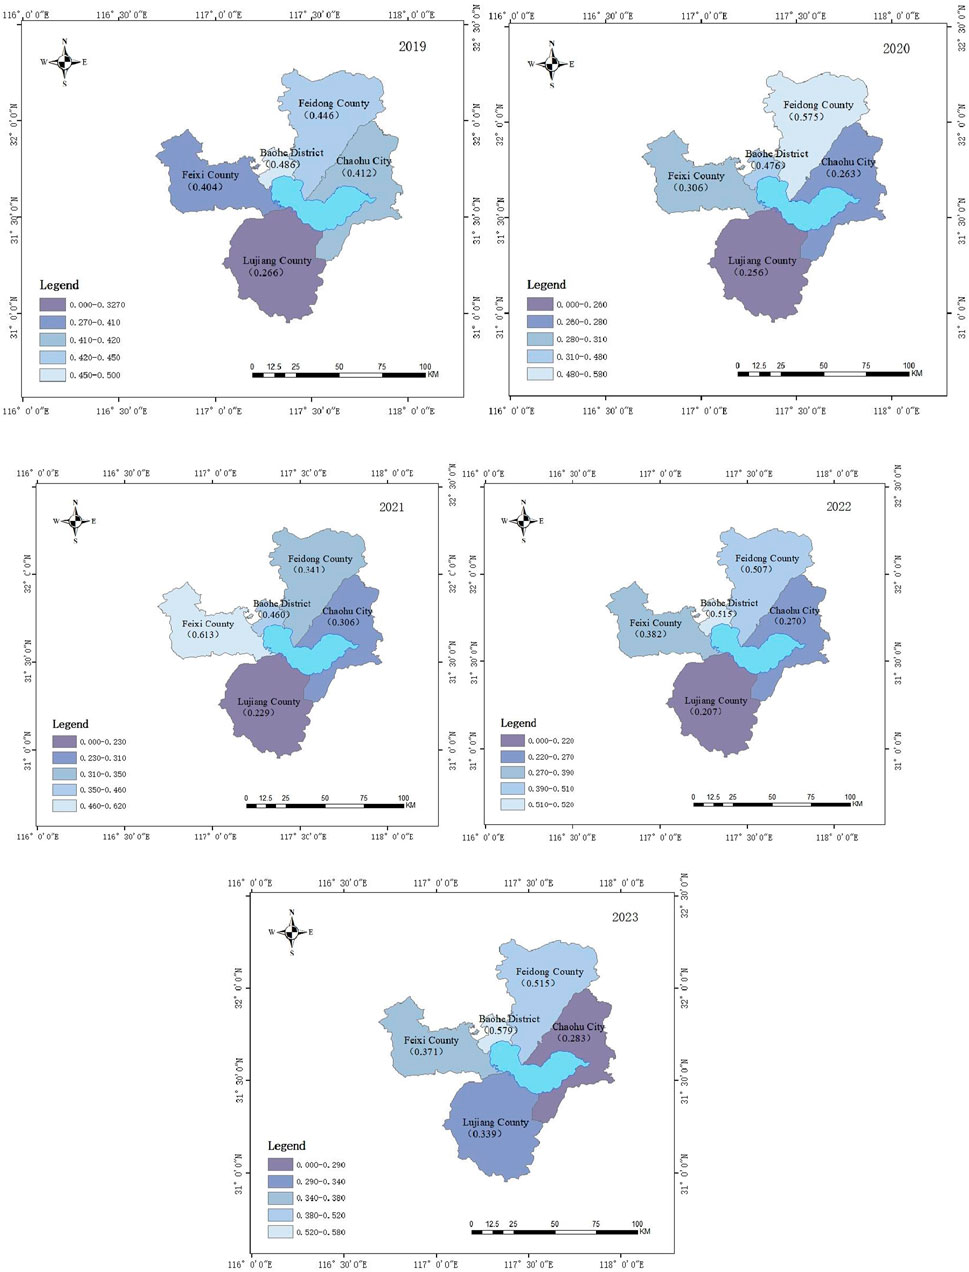
Figure 4. Relative proximity of the Lake Chaohu region from 2019 to 2023.
As shown in Figure 4, Baohe District has exhibited a steady upward trend, with its relative proximity to spatial environmental quality improving from 0.486 in 2019, through minor fluctuations to 0.476 in 2020 and 0.460 in 2021, and then continuing to rise to 0.515 in 2022, ultimately reaching 0.579 in 2023. This indicates that Baohe District has effectively balanced development and protection, consistently investing in environmental protection and pollution control, thereby maintaining a stable and improving trend in spatial environmental quality.
Feidong County, however, exhibits a fluctuating upward trend. Its relative proximity index rose significantly from 0.446 in 2019 to 0.575 in 2020, but then dropped sharply to 0.341 in 2021 before gradually recovering to 0.507 and 0.515 in 2022 and 2023, respectively. This fluctuating upward trend indicates that the improvement process of spatial environmental quality in Feidong County has not been smooth sailing, influenced by factors such as industrial structure adjustments and changes in pollution control investments. Overall, it is still moving in the direction of improvement, but the process involves setbacks and challenges.
The spatial environmental quality in Feixi County has shown a fluctuating downward trend. Its relative proximity index started at 0.404 in 2019, plummeted to 0.306 in 2020, then rebounded sharply to 0.613 in 2021, but fell again to 0.382 in 2022, and finally dropped to 0.371in 2023. This significant fluctuating decline, particularly the sustained decline in the latter 2 years, reflects the demands placed on environmental carrying capacity by the rapid development of emerging industries such as new energy vehicles. Meanwhile, pollution control efforts have failed to keep pace with development, leading to increased environmental pressure and a deterioration in spatial environmental quality.
The spatial environmental quality of Chaohu City shows a trend of initial decline followed by a slight increase in the later period. Its relative proximity index began to decline from 0.412 in 2019, reaching a low of 0.263 in 2020, then slightly rebounded to 0.306 in 2021, but dropped again to 0.270 in 2022, and although it rose slightly in 2023, it only reached 0.283. This ‘first decline, then gradual increase’ pattern is related to its role as a direct recipient of lake-based pollution, facing significant pressures from agricultural non-point source pollution and domestic wastewater in the early stages. Although some measures were taken to address these issues in the later stages, the effects were slow to materialise, or the environmental pressures caused by urban expansion continued to exist, resulting in limited overall improvement.
In contrast, the spatial environmental quality in Lujiang County has shown relatively minor fluctuations. However, its overall relative proximity has exhibited a trend of gradual decline followed by a slight recovery, dropping from 0.266 in 2019 to 0.229 in 2021, then further declining to a low of 0.207 in 2022, before rebounding to 0.339 in 2023. Although the fluctuations are not significant, the overall improvement is limited, indicating that the spatial environmental quality is significantly influenced by structural factors such as a high proportion of industrial land and constrained ecological space, making improvements relatively challenging. Future improvements may benefit from targeted environmental governance measures.
As such, the spatial environmental quality of cities and counties in the Lake Chaohu region did not exhibit a consistent upward trend between 2019 and 2023, but rather showed significant fluctuations or even declines, particularly in certain periods in Feixi County and Chaohu City (Figure 5). This volatility reflects, to some extent, that certain regions failed to effectively address the increased pollutant emissions and intensified resource consumption resulting from economic development or industrial restructuring, thereby hindering improvements in urban spatial environmental quality.
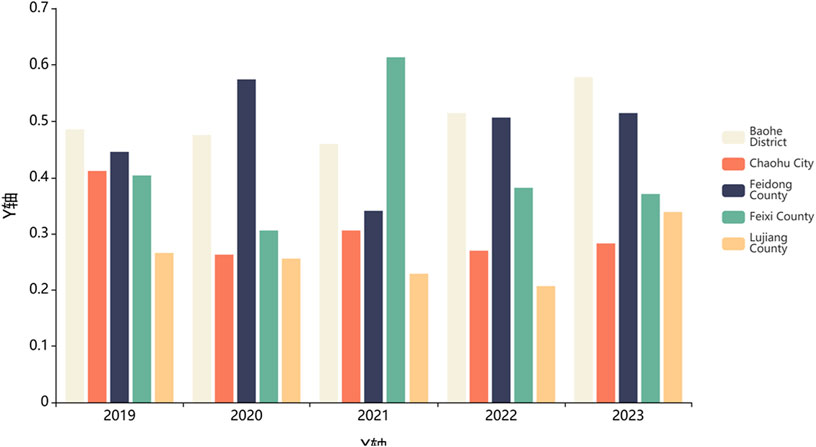
Figure 5. Trends in relative proximity in the Lake Chaohu region from 2019 to 2023.
5 Discussion
5.1 Comprehensive analysis
From the above analysis, it can be concluded that the spatial environmental quality in the Chaohu region exhibits significant spatial variations. This may be attributed to the combined influence of factors such as geographical location, population distribution, industrial structure, level of economic development, and environmental policies (Hefei Municipal People’ sGovernment, 2025).
Baohe District (0.576) has relatively better spatial environmental quality. This is primarily due to its higher level of economic development. As a regional centre, it is able to attract more resources and has stronger investment attraction capabilities. Additionally, its relatively ample fiscal capacity enables it to allocate more funds to address sustainability challenges, including pollution control and environmental infrastructure development.
Feidong County (0.456) and Feixi County (0.456) have similar overall conditions, with both being dominated by the secondary industry. Such regions typically face significant environmental pressures while developing their industries, with relatively moderate spatial environmentalquality. They possess a certain industrial foundation and labour resources, but compared to economic centres, there is still room for improvement in terms of capital accumulation, technological innovation, and refined environmental management. This industrial-dominated model may also impact the improvement of resource and environmental carrying capacity to some extent if environmental management is not prioritised.
Chaohu City (0.332) and Lujiang County (0.263) are regions with relatively abundant ecological and environmental resources. Chaohu City leverages the natural resources and port advantages of Chaohu Lake for rapid economic development but also bears the responsibility of protecting important ecological functional zones. Lujiang County, although blessed with good natural resources, is constrained by its relatively weak county-level economic strength, resulting in limited environmental protection investments and consequently lower spatial environmental quality. In such regions, over-reliance on traditional industries or neglect of environmental protection investments may prevent resource advantages from being effectively converted intocarrying capacity advantages, and may even lead to reduced carrying capacity due to resource extraction or environmental degradation. In summary, regional development strategies must strike a balance between utilising ecological resources and protecting the ecological environment.
5.2 Research comparison
The quality of the spatial environment is a fundamental prerequisite for the existence and advancement of human civilization and is intricately linked to the degree of socio-economic advancement. It is affected by many factors, including the ecological milieu and anthropogenic actions. Scholars in various countries assess the spatial environmental excellence of the research region by obtaining factors such as water resources, land resources, socio-economic development conditions, and ecological environment (Liang and Yang, 2019; Liang et al., 2019; Koomen et al., 2023). Through the assessment of ecological integrity, it is possible to predict its prospective developmental trajectory and understand the influencing factors that influence the progression of environmental quality. At the same time, reasonable protection measures and suggestions can be put forward to provide reference to relevant departments.
For example, Liang et al. used a geographic convergence cross-mapping method to infer the relationship between ecological environment quality and influencing factors (Liang et al., 2024); Liu et al. took the city centre of Xi’an, China, as an example to analyse the impact of 19 factors on changes in urban ecological quality (Liu et al., 2023). The conclusions of this study are consistent with those of the aforementioned studies, namely, that spatial environmental quality is a fundamental condition influencing human social survival and development, and its evaluation must comprehensively consider multiple factors.
However, this study also exhibits uniqueness in its specific methods and findings. First, in terms of theoretical framework, this study explicitly adopted the PSR model. The advantage of this model lies in its ability to systematically reveal the interaction mechanisms between natural ecosystems and socio-economic systems. This differs from the analytical perspectives of Liang et al. and Liu et al., who focused more on the spatial differentiation characteristics at the macro level. The PSR model offers a more structured perspective for understanding the pathways through which human activities impact the environment. Second, in terms of evaluation methods, this study combines the entropy weight method with the TOPSIS model for comprehensive evaluation. The core of this method lies in calculating the degree of proximity between each evaluation unit and the ideal optimal solution, thereby enabling a relative quantitative comparison of spatial environmental quality across different regions within the Lake Chaohu area.
Based on the analysis results, among the various factors influencing spatial environmental quality, specific indicators within the two major criteria layers Pressure (P) and Response (R) and out particularly prominently. Regarding the Pressure layer (P), the annual average concentration of sulphur dioxide (P3) emerges as the primary factor hindering improvements in spatial environmental quality. This reflects the significant pressure exerted by atmospheric pollutantemissions, particularly sulphur dioxide generated by traditional energy activities such as industrial processes, on regional air quality. This indicates that pollution emissions are one of the key contradictions between the mode of economic development and environmental carrying capacity. Secondly, per capita disposable income of household residents (S2), as a social pressure indicator, also has a relatively high weighting. This suggests that the balance between improvements in residents’ living standards and resource consumption and environmental demandshas not yet been fully achieved. This means that in some regions, the pressure on the environment caused by residents’ unreasonable lifestyles during the process of economic development cannot be ignored. Furthermore, gross domestic product (R6), as an economic pressure indicator, indicates that the region’s rapid economic growth model is accompanied by significant resource consumption and environmental costs, and has not yet fully transitioned to a green, low-carbon sustainable development path.
In the environmental response layer (R), the weighting of fiscal expenditures on energy conservation and environmental protection (R4) and the added value of the tertiary industry (R2) is also relatively high. The high weighting of fiscal expenditures on energy conservation andenvironmental protection (R4) indicates that although environmental protection investments areincreasing, their growth rate and scale may still be insufficient to effectively offset the environmental pressures caused by rapid economic development and population growth, and the input-output efficiency of environmental governance investments needs to be improved. The added value of the tertiary industry (R2) suggests that the optimisation and upgrading of industrial structure, particularly the transition to low-energy-consuming, high-value-added services, iscrucial for alleviating environmental pressures and improving spatial environmental quality. However, this transition process may still face challenges, as the influence of traditional industries remains significant.
The identification of these key influencing factors not only confirms that environmental pressures, socio-economic factors, and economic development models are universal factors affecting regional spatial environmental quality. It also highlights the importance of specific indicators such as industrial emissions control, guidance on residents’ lifestyles, economic restructuring,and the efficiency of environmental protection investments in the specific region and timeframe of the Lake Chaohu area. Based on these findings, the study provides differentiated policy recommendations for different regions such as Baohe District, Feidong County, Feixi County, Chaohu City, and Lujiang County. For example, in areas with high sulphur dioxide concentrations, strengthen control over industrial and coal-fired sources; in areas facing significant economic pressure, promote the transformation of industrial structure towards green services; in areas with insufficient environmental protection investments, increase fiscal support and improve the efficiency of such investments. The aim is to provide local governments with more targeted and operational practical guidance.
Overall, this study, while adhering to the general paradigm of environmental quality evaluation research, successfully identified the key factors influencing spatial environmental quality bycombining the PSR model and entropy-weighted TOPSIS method, focusing on the Chaohu Lake region, and thereby proposed conclusions and recommendations tailored to the actual conditions of different regions.
However, this method also has certain limitations. In the analysis of spatial environmental quality in the Lake Chaohu region, only the PSR model and entropy-weighted TOPSIS were employed. In the future, other methods such as the Analytic Hierarchy Process (AHP), remotesensing data, grey correlation analysis, and survey questionnaires could be explored to investigate the relationships among environmental quality influencing factors, ensuring the objectivity of the research.
6 Conclusion
In the present investigation, the PSR model and entropy weight-TOPSIS approach are utilisedto calculate the relative proximity of the natural surroundings around Chaohu Lake in 2019–2023, analyse the influencing factors of the regional spatial environmental quality, and put forward suggestions for the protection of the regional spatial environment. The key points in the results are summarised as follows:
(1) The spatial environmental quality in the Chaohu region exhibits significant variability. Among the five counties and cities studied, Baohe District has maintained relatively stable andcontinuously improving spatial environmental quality, indicating that the region has achieved a good balance between economic development and environmental protection. Feidong Countyand Feixi County have overall moderate spatial environmental quality, showing a trend of slow improvement amid fluctuations. This indicates that environmental governance measures in these two areas are gradually yielding results, but the process is unstable and subject to interference from various factors. In contrast, the spatial environmental quality evaluation results for Chaohu City and Lujiang County are relatively low, indicating that these areas face greaterecological and environmental pressures and higher improvement difficulties. The formation of this disparity is closely related to the different industrial structures, development stages, resources, and intensity of environmental governance investments across the various cities and counties.
(2) From the perspective of influencing factors, the factors affecting changes in the spatial environmental quality of the Chaohu region are diverse and vary in weight. Analysis indicates that five indicators—annual average sulphur dioxide concentration (P3), per capita disposable income of household residents (S2), added value of the tertiary industry (R2), fiscal expenditure on energy conservation and environmental protection (R4), and gross domestic product (R6)—have a particularly significant impact on the overall spatial environmental quality of the region. This reveals that the level of economic development, industrial structure, pollution emission intensity, and the intensity of environmental governance investments are the core forcesjointly shaping the current state of spatial environmental quality in the Chaohu region. In particular, the high weight of the P3 pollution indicator highlights that air pollution prevention and control remains a key link in regional environmental improvement.
(3) The temporal evolution characteristics indicate that the spatial environmental quality of most cities and counties does not improve linearly but instead experiences fluctuations of varying degrees. For example, Feixi County exhibits a fluctuating downward trend, while Chaohu City shows a decline in the early stages followed by a recovery in the later stages. This reflects that in the process of rapid urbanisation, the effectiveness of environmental governance may be offset by new pollution emissions or development demands, or the effects of governance measures may exhibit lagging effects. This volatility indicates that the improvement of spatial environmental quality in the Chaohu Lake region is a dynamic adjustment process filled with challenges, requiring sustained policy attention and governance investments.
In summary, while some progress has been made in improving the spatial environmental quality of the Chaohu region, significant internal disparities exist within the region, and there is a need to balance economic development with environmental protection. Future policy formulation must fully consider this spatio-temporal heterogeneity and implement differentiated, targeted environmental governance strategies tailored to the characteristics of different cities and counties. For areas with poor environmental quality or significant fluctuations, efforts should focus on strengthening pollution source control, such as industrial emissions of air and waterpollutants; optimising industrial structure, such as promoting green and low-carbon transformation; increasing environmental protection investments; and establishing cross-regional and cross-departmental collaborative governance mechanisms to achieve comprehensive improvement and sustainable development of regional spatial environmental quality.
Data availability statement
The original contributions presented in the study are included in the article/supplementary material, further inquiries can be directed to the corresponding author.
Author contributions
LZ: Conceptualization, Funding acquisition, Investigation, Methodology, Project administration, Supervision, Validation, Visualization, Writing – review and editing. MY: Conceptualization, Data curation, Investigation, Methodology, Resources, Software, Validation, Visualization, Writing – original draft, Writing – review and editing. YG: Formal Analysis, Project administration, Software, Validation, Writing – review and editing.
Funding
The author(s) declare that financial support was received for the research and/or publication of this article. This research was supported by the 2022 Director’s Fund Project of Anhui Institute of Culture and Tourism Innovation and Development (Project No. ACTZ2022ZD01), the “Digital Intelligence Rural Culture and Tourism Research and Innovation Team” (Project No. 2022AH010022), the China Postdoctoral Science Fund Project (Project No. 2023M730017), and the Youth Project of Anhui Academy of Social Sciences (Project No. QK202301).
Conflict of interest
The authors declare that the research was conducted in the absence of any commercial or financial relationships that could be construed as a potential conflict of interest.
Generative AI statement
The author(s) declare that no Generative AI was used in the creation of this manuscript.
Publisher’s note
All claims expressed in this article are solely those of the authors and do not necessarily represent those of their affiliated organizations, or those of the publisher, the editors and the reviewers. Any product that may be evaluated in this article, or claim that may be made by its manufacturer, is not guaranteed or endorsed by the publisher.
References
Ahmad, M., and Zhao, Z.-Y. (2018). Empirics on linkages among industrialization, urbanization, energy consumption, CO2 emissions and economic growth: a heterogeneous panel study of China. Environ. Pollut. Res. Int. 25 (30), 30617–30632. doi:10.1007/s11356-018-3054-3
Anhui Province Chaohu Lake Administration Bureau (2025). City-Lake symbiosis: Chaohu Lake ecological governance creates hefei's ‘best calling card. Available online at: https://chglj.hefei.gov.cn/ahschhzzbgs/gzdt/18824553.html (Accessed June, 2025).
Anhui Provincial People's Government (2025). Adhering to planning-led comprehensive governance to make Chaohu Lake the best calling card for Hefei. Available online at: https://www.ah.gov.cn/zwyw/jryw/565436291.html (Accessed June, 2025).
Berger, A. R., and Hodge, R. A. (1998). Natural change in the environment: a challenge to the pressure-state-response concept. Soc. Indic. Res. 44 (2), 255–265. doi:10.1023/A:1006888532080
Bi, X., Chang, B., Hou, F., Yang, Z., Fu, Q., and Li, B. (2021). Assessment of spatio-temporal variation and driving mechanism of ecological environment quality in the arid regions of central asia, xinjiang. Int. J. Environ. Res. Public Health. 18 (13), 7111. doi:10.3390/ijerph18137111
Boori, M. S., Choudhary, K., Paringer, R., and Kupriyanov, A. (2021). Eco-environmental quality assessment based on pressure-state-response framework by remote sensing and GIS. Remote Sens. Appl. Soc. Environ. 23 (100530), 100530. doi:10.1016/j.rsase.2021.100530
Cai, J., Li, X., Liu, L., Chen, Y., Wang, X., and Lu, S. (2021). Coupling and coordinated development of new urbanization and agro-ecological environment in China. Sci. Total Environ. 776 (145837), 145837. doi:10.1016/j.scitotenv.2021.145837
Caviglia-Harris, J. L., Chambers, D., and Kahn, J. R. (2009). Taking the “U” out of Kuznets. Ecol. Econ. 68 (4), 1149–1159. doi:10.1016/j.ecolecon.2008.08.006
Chaohu (2024). Statistical yearbook. Available online at: https://www.chaohu.gov.cn/sjch/tjnj/index.html (Accessed June 6, 2025).
Ding, L., Zhao, W., Huang, Y., Cheng, S., and Liu, C. (2015). Research on the coupling coordination relationship between urbanization and the air environment: a case study of the area of wuhan. Atmos. (Basel) 6 (10), 1539–1558. doi:10.3390/atmos6101539
Fan, W., Wang, H., Liu, Y., and Liu, H. (2020). Spatio-temporal variation of the coupling relationship between urbanization and air quality: a case study of shandong Province. J. Clean. Prod. 272 (122812), 122812. doi:10.1016/j.jclepro.2020.122812
Fang, X., Shi, X., Phillips, T. K., Du, P., and Gao, W. (2021). The coupling coordinated development of urban environment towards sustainable urbanization: an empirical study of shandong peninsula, China. Ecol. Indic. 129 (107864), 107864. doi:10.1016/j.ecolind.2021.107864
Feidong (2024). Statistical bulletin. Available online at: https://www.hefei.gov.cn/public/column/15061?type=4&catId=6998011&action=list (Accessed June 6, 2025).
Feixi (2024). Statistical yearbook. Available online at: https://www.ahfeixi.gov.cn/zwgk/zfsj/tjnj/index.html (Accessed June 6, 2025).
Han, Q., Zhou, L., Sun, W., Wang, G., Shrestha, S., Xue, B., et al. (2022). Assessing alterations of water level due to environmental water allocation at multiple temporal scales and its impact on water quality in Baiyangdian Lake, China. Environ. Res. 212 (Pt C), 113366. doi:10.1016/j.envres.2022.113366
Hefei (2024). Statistical yearbook. Available online at: https://tjj.hefei.gov.cn/tjnj/index.html (Accessed June 6, 2025).
Hefei Municipal People's Government (2025). Government gazette. Available online at: https://www.hefei.gov.cn/xxgk/szfgb/2025/index.html (Accessed June, 2025).
Hefei Municipal Government (2024). Mobilising the entire city to protect the clear watersof the lake Ten wetlands form a chain, attracting rare migratory birds. Available online at: https://www.hefei.gov.cn/ssxw/ztzl/zt/qlzcgjstylcs/110590946.html (Accessed June, 2025).
Hua, W., Chen, H., Zhou, L., Xie, Z., Qin, M., Li, X., et al. (2017). Observational quantification of climatic and human influences on vegetation greening in China. Remote Sens. (Basel). 9 (5), 425. doi:10.3390/rs9050425
Huang, J., Zhan, J., Yan, H., Wu, F., and Deng, X. (2013). Evaluation of the impacts of land use on water quality: a case study in the Chaohu Lake Basin. ScientificWorldJournal 2013, 329187. doi:10.1155/2013/329187
Jiang, L., Liu, Y., Wu, S., and Yang, C. (2021). Analyzing ecological environment change and associated driving factors in China based on NDVI time series data. Ecol. Indic. 129 (107933), 107933. doi:10.1016/j.ecolind.2021.107933
Kan, D., Ye, X., Lyu, L., and Huang, W. (2022). Study on the coupling coordination between new-type urbanization and water ecological environment and its driving factors: evidence from jiangxi Province, China. Int. J. Environ. Res. Public Health. 19 (16), 9998. doi:10.3390/ijerph19169998
Kline, J. D. M. A., Moses, A., and Alig, R. J. (2001). Integrating urbanization into landscape-level ecological assessments. Ecosystems 4 (1), 3–18. doi:10.1007/s100210000056
Koomen, E., van Bemmel, M. S., van Huijstee, J., Andrée, B. P. J., Ferdinand, P. A., and van Rijn, F. J. A. (2023). An integrated global model of local urban development and population change. Comput. Environ. Urban Syst. 100 (101935), 101935. doi:10.1016/j.compenvurbsys.2022.101935
Lei, D., Xu, X., and Zhang, Y. (2021). Analysis of the dynamic characteristics of the coupling relationship between urbanization and environment in kunming city, southwest China. Clean. Environ. Syst. 2 (100018), 100018. doi:10.1016/j.cesys.2021.100018
Li, T., Zhang, Q., Singh, V. P., Zhao, J., Song, J., Sun, S., et al. (2022). Identification of degradation areas of ecological environment and degradation intensity assessment in the yellow River Basin. Front. Earth Sci. 10. doi:10.3389/feart.2022.922013
Liang, L., Song, Y., Shao, Z., Zheng, C., Liu, X., and Li, Y. (2024). Exploring the causal relationships and pathways between ecological environmental quality and influencing factors: a comprehensive analysis. Ecol. Indic. 165 (112192), 112192. doi:10.1016/j.ecolind.2024.112192
Liang, L., Wang, Z., and Li, J. (2019). The effect of urbanization on environmental pollution in rapidly developing urban agglomerations. J. Clean. Prod. 237 (117649), 117649. doi:10.1016/j.jclepro.2019.117649
Liang, W., and Yang, M. (2019). Urbanization, economic growth and environmental pollution: evidence from China. Sustain. Comput. Inf. Syst. 21, 1–9. doi:10.1016/j.suscom.2018.11.007
Liu, M., Ma, M., Liu, J., Lu, X., Dong, Z., and Li, J. (2023). Quantifying impacts of natural and anthropogenic factors on urban ecological quality changes: a multiscale survey in xi’an, China. Ecol. Indic. 153 (110463), 110463. doi:10.1016/j.ecolind.2023.110463
Liu, N., Liu, C., Xia, Y., and Da, B. (2018). Examining the coordination between urbanization and eco-environment using coupling and spatial analyses: a case study in China. Ecol. Indic. 93, 1163–1175. doi:10.1016/j.ecolind.2018.06.013
Lujiang (2024). Statistical yearbook. Available online at: https://www.lj.gov.cn/zjlj/sjlj/index.html (Accessed June 6, 2025).
Neri, A. C., Dupin, P., and Sánchez, L. E. (2016). A pressure–state–response approach to cumulative impact assessment. J. Clean. Prod. 126, 288–298. doi:10.1016/j.jclepro.2016.02.134
Ouyang, H.-L., Wang, Q.-M., He, W., Qin, N., Kong, X.-Z., Liu, W.-X., et al. (2014). Organochlorine pesticides in the dust fall around Lake Chaohu, the fifth largest Lake in China. Environ. Monit. Assess. 186 (1), 383–393. doi:10.1007/s10661-013-3383-0
Psomiadis, E., Papazachariou, A., Soulis, K., Alexiou, D.-S., and Charalampopoulos, I. (2020). Landslide mapping and susceptibility assessment using geospatial analysis and Earth observation data. Land (Basel) 9 (5), 133. doi:10.3390/land9050133
Qian, L., Shen, M., and Yi, H. (2022). Spatio-temporal pattern of coupling coordination between urban development and ecological environment under the “double carbon” goal: a case study in Anhui, China. Sustainability 14 (18), 11277. doi:10.3390/su141811277
Qureshi, S., Alavipanah, S. K., Konyushkova, M., Mijani, N., Fathololomi, S., Firozjaei, M. K., et al. (2020). A remotely sensed assessment of surface ecological change over the gomishan wetland, Iran. Remote Sens. (Basel). 12 (18), 2989. doi:10.3390/rs12182989
Shan, W., Jin, X., Ren, J., Wang, Y., Xu, Z., Fan, Y., et al. (2019). Ecological environment quality assessment based on remote sensing data for land consolidation. J. Clean. Prod. 239 (118126), 118126. doi:10.1016/j.jclepro.2019.118126
Shen, Y., and Ren, Y. (2022). Construction and evaluation of a system to measure the coordinated development of the ecological environment and the economy of the construction industry. Environ. Sci. Pollut. Res. Int. 29 (9), 12648–12660. doi:10.1007/s11356-021-16274-3
Shengde, H., and Zhonghua, L. (2022). Performance analysis of marine ecological environment governance based on DPSIR and entropy weight TOPSIS model. Mob. Inf. Syst. 2022, 1–10. doi:10.1155/2022/9224879
Shi, T., Yang, S., Zhang, W., and Zhou, Q. (2020). Coupling coordination degree measurement and spatiotemporal heterogeneity between economic development and ecological environment ----Empirical evidence from tropical and subtropical regions of China. J. Clean. Prod. 244 (118739), 118739. doi:10.1016/j.jclepro.2019.118739
Shu, C., Du, K., Han, B., Chen, Z., Wang, H., and Ouyang, Z. (2023). Driving forces on the distribution of urban ecosystem’s non-point pollution reduction service. Atmos. (Basel) 14 (5), 873. doi:10.3390/atmos14050873
Song, Y., Lu, Y., Liu, T., Li, H., Yue, Z., Liu, H., et al. (2020). Variation of vegetation fractional coverage and its relationship with climate in a desert steppe: optimization of farmland layout in a farming–pastoral ecotone using the ecological suitability index. Ecol. Eng. 150 (105834), 105834. doi:10.1016/j.ecoleng.2020.105834
Wang, C., and Zhao, H. (2016). The assessment of urban ecological environment in watershed scale. Procedia Environ. 36, 169–175. doi:10.1016/j.proenv.2016.09.028
Wang, D., Li, Y., Yang, X., Zhang, Z., Gao, S., Zhou, Q., et al. (2021). Evaluating urban ecological civilization and its obstacle factors based on integrated model of PSR-EVW-TOPSIS: a case study of 13 cities in jiangsu Province, China. Ecol. Indic. 133 (108431), 108431. doi:10.1016/j.ecolind.2021.108431
Wang, Z., Liang, L., Sun, Z., and Wang, X. (2019). Spatiotemporal differentiation and the factors influencing urbanization and ecological environment synergistic effects within the beijing-tianjin-hebei urban agglomeration. J. Environ. Manage. 243, 227–239. doi:10.1016/j.jenvman.2019.04.088
Wang, Z., Tang, L., Qiu, Q., Chen, H., Wu, T., and Shao, G. (2018). Assessment of regional ecosystem health—a case study of the golden triangle of southern fujian Province, China. Int. J. Environ. Res. Public Health. 15 (4), 802. doi:10.3390/ijerph15040802
Wei, G., Yang, Z., Liang, C., Yang, X., and Zhang, S. (2022). Urban lake scenic protected area zoning based on ecological sensitivity analysis and remote sensing: a case study of Chaohu Lake Basin, China. Sustainability 14 (20), 13155. doi:10.3390/su142013155
Willis, K. S. (2015). Remote sensing change detection for ecological monitoring in United States protected areas. Biol. Conserv. 182, 233–242. doi:10.1016/j.biocon.2014.12.006
Wu, C., Gao, P., Zhou, J., Fan, X., Xu, R., and Mu, X. (2024). Fuzzy evaluation and obstacle factors of urban ecological health changes in the wei River Basin, northwest China. Ecol. Process. 13 (1), 50. doi:10.1186/s13717-024-00529-1
Wu, H., Fang, S., Zhang, C., Hu, S., Nan, D., and Yang, Y. (2022). Exploring the impact of urban form on urban land use efficiency under low-carbon emission constraints: a case study in China’s yellow River Basin. J. Environ. Manage. 311 (114866), 114866. doi:10.1016/j.jenvman.2022.114866
Xu, X., Zhang, D., Zhang, Y., Yao, S., and Zhang, J. (2020). Evaluating the vegetation restoration potential achievement of ecological projects: a case study of yan’an, China. Land Use Policy 90 (104293), 104293. doi:10.1016/j.landusepol.2019.104293
Yan, Y., Yu, X., Long, F., and Dong, Y. (2021). A multi-criteria evaluation of the urban ecological environment in Shanghai based on remote sensing. ISPRS Int. J. Geoinf. 10 (10), 688. doi:10.3390/ijgi10100688
Yang, X., Jia, Y., Wang, Q., Li, C., and Zhang, S. (2021b). Space-time evolution of the ecological security of regional urban tourism: the case of Hubei Province, China. Environ. Monit. Assess. 193 (9), 566. doi:10.1007/s10661-021-09243-3
Yang, Y., Wang, L., Yang, F., Hu, N., and Liang, L. (2021a). Evaluation of the coordination between eco-environment and socioeconomy under the “ecological county strategy” in western China: a case study of meixian. Ecol. Indic. 125 (107585), 107585. doi:10.1016/j.ecolind.2021.107585
Yao, P., Yu, X., Wang, Y., Feng, Y., and Gao, H. (2025). Spatiotemporal changes and driving analysis of ecological environmental quality in the Qinghai Lake Basin. Sustainability 17 (8), 3421. doi:10.3390/su17083421
Yi, L., Chen, J., Jin, Z., Quan, Y., Han, P., Guan, S., et al. (2018). Impacts of human activities on coastal ecological environment during the rapid urbanization process in shenzhen, China. Ocean. Coast. Manag. 154, 121–132. doi:10.1016/j.ocecoaman.2018.01.005
Yongqiang, W., Zhijun, W., Bo, Y., Kai, L., and Feng, H. (2021). Research on ecological environment impact assessment based on PSR and cloud theory in Dari county, source of the yellow river. Water Sci. Technol. Water Supply 21 (3), 1050–1060. doi:10.2166/ws.2020.286
Zhang, D., Jia, Q., Xu, X., Yao, S., Chen, H., and Hou, X. (2018). Contribution of ecological policies to vegetation restoration: a case study from wuqi county in shaanxi Province, China. Land Use Policy 73, 400–411. doi:10.1016/j.landusepol.2018.02.020
Zhang, T., Wang, L., Wang, H., Peng, L., and Luo, C. (2017). Assessment of soil salinization ecological environment change in the manas River Basin using remote sensing technology. Sheng Tai Xue Bao 37 (9), 3009–3018. doi:10.5846/stxb201601310225
Zhang, T., Yang, R., Yang, Y., Li, L., and Chen, L. (2021). Assessing the urban eco-environmental quality by the remote-sensing ecological index: application to tianjin, north China. ISPRS Int. J. Geoinf. 10 (7), 475. doi:10.3390/ijgi10070475
Zhang, Z., Gao, J., and Gao, Y. (2015). The influences of land use changes on the value of ecosystem services in Chaohu Lake Basin, China. Environ. Earth Sci. 74 (1), 385–395. doi:10.1007/s12665-015-4045-z
Zhao, G., Liang, R., Li, K., Wang, Y., and Pu, X. (2021). Study on the coupling model of urbanization and water environment with basin as a unit: a study on the hanjiang Basin in China. Ecol. Indic. 131 (108130), 108130. doi:10.1016/j.ecolind.2021.108130
Zhao, H., Jiang, X., Gu, B., and Wang, K. (2022). Evaluation and functional zoning of the ecological environment in urban space—a case study of taizhou, China. Sustainability 14 (11), 6619. doi:10.3390/su14116619
Zhao, J., Liu, Y., Zhu, Y., Qin, S., Wang, Y., and Miao, C. (2020). Spatiotemporal differentiation and influencing factors of the coupling and coordinated development of new urbanization and ecological environment in the Yellow River Basin. Resour. Sci. 42 (1), 159–171. doi:10.18402/resci.2020.01.16
Keywords: presure-state-response (PSR) model, Chaohu prefecture, Anhui, the spatial environment, entropy weight method-TOPSIS, influencing factors
Citation: Zhang L, Yuan M and Guo Y (2025) Research on spatial environmental quality and driving forces in Chaohu region based on PSR modelling. Front. Earth Sci. 13:1621392. doi: 10.3389/feart.2025.1621392
Received: 01 May 2025; Accepted: 02 July 2025;
Published: 21 July 2025.
Edited by:
Karoly Nemeth, Institute of Earth Physics and Space Science (EPSS), HungaryReviewed by:
Rajiv Ganguly, Harcourt Butler Technical University, IndiaVladyslav Zakharovskyi, Massey University, New Zealand
Copyright © 2025 Zhang, Yuan and Guo. This is an open-access article distributed under the terms of the Creative Commons Attribution License (CC BY). The use, distribution or reproduction in other forums is permitted, provided the original author(s) and the copyright owner(s) are credited and that the original publication in this journal is cited, in accordance with accepted academic practice. No use, distribution or reproduction is permitted which does not comply with these terms.
*Correspondence: Yanlong Guo, MjAxMDZAYWh1LmVkdS5jbg==