 Cheng Liu1,2
 Litao Ma1,2Chengzhen Liu1,2Yangbing Li1,2Ying Huang1,2Jianghao Yang1,2Weiqiang Hu1,2
 Dengke Liu3*
- 1CNOOC EnerTech-Drilling and Production Co., Tianjin, China
- 2CNOOC Energy Technology and Services Limited Key Laboratory for Exploration and Development of Unconventional Resources, Tianjin, China
- 3School of Human Settlement and Civil Engineering, Xi’an Jiaotong University, Xi’an, China
The microscopic characterization of the distribution of formation water in tight gas reservoirs has always been one of the challenges in the industry. The traditional nuclear magnetic resonance method has certain limitations in characterizing the microscopic distribution of formation water. Thermogravimetric analysis can correlate with mass, and combined with nuclear magnetic resonance spectra, it can further optimize the characterization method for the microscopic distribution of formation water. Multiple tight sandstone gas reservoirs are vertically developed in the Shenfu Block of the Ordos Basin. Due to the strong heterogeneity of the reservoir, given the complexity of the characterization of the microscopic occurrence law of formation water, the typical argillaceous tight sandstone reservoirs Qian 5 and Tai 2 members are selected as the research objects. The distribution characteristics of the microscopic formation water of the tight gas reservoir in the Shenfu block were quantitatively characterized by the thermogravimetric method using dry distillation experiment, nuclear magnetic resonance experiment, and displacement experiment. The results show that 35°C is the boundary temperature between free water and microporous water. According to the characterization of various types of water occurrence in clay and tight sandstone by thermogravimetric experiment, free water below 35°C, microporous water (including capillary water and adsorbed water on the surface of mineral particles) in the range of 35°C–427°C, and clay-bound water (crystal water, structural water/carboxyl water) above 427°C. The type of water occurrence in tight sandstone is consistent with that of clay minerals, but the amount of water occurrence and water loss rate are different. From the perspective of water occurrence, microporous water is typically the most abundant form, while in terms of water loss rate, free water generally exhibits the highest rate. The full-scale quantitative study of micro-formation water distribution in tight gas reservoirs based on the thermogravimetric method has important guiding significance for solving the accurate characterization of water saturation logging in tight gas reservoirs, and enriches the understanding of the occurrence characteristics and laws of micro-formation water in tight gas reservoirs.
1 Introduction
Ordos Basin is the first gas-producing basin in China, and unconventional tight gas is the focus of natural gas exploration and development as the main gas-producing layer. The Shenfu area is located in the eastern margin of the Ordos Basin. The exploration practice shows that there are many sets of vertically superimposed tight sandstone gas reservoirs in the Upper Paleozoic strata in this area, and the distribution characteristics of gas and water are complex (Jiang et al., 2015; Tian et al., 2023; Tan et al., 2022). The occurrence of formation water is closely related to the distribution, migration, accumulation, and preservation of natural gas. The relationship between gas and water is a difficult and focused problem in natural gas exploration and development (Zhou et al., 2018; Liu et al., 2013). Tight gas reservoirs have strong heterogeneity, complex rock mineral types and pore structures, and complex micro-occurrence characteristics of formation water. Quantitative characterization of micro-water in pores can improve the accuracy of reservoir water saturation characterization, which has important guiding significance for understanding gas-water relationships and natural gas development (Li et al., 2019). However, the complexity of the microscopic occurrence characteristics of formation water also poses a challenge to the classification, identification, and characterization of formation water types.
From the perspective of the occurrence space of formation water, scholars mostly divide formation water into free water, capillary water, and bound water (Dou et al., 2010; Wang et al., 2025). Based on the comprehensive trial production data, Wu Hao et al., used gas drive water, nuclear magnetic resonance, mercury injection and other analytical methods to systematically study the occurrence characteristics of mountain layer water and the distribution law of gas and water in the northern section of Tianhuan Depression (Wu et al., 2020). Combined with the occurrence state of formation water, formation water can be divided into free water, capillary water, adsorbed water, and clay water (Dou et al., 2010; Wang et al., 2012; Zhang et al., 2011). The occurrence of clay water is more complex, including free water, adsorbed water, and structural water (Wang et al., 2020; Handwerger et al., 2012). The adsorbed water can be divided into strong bound water and weak bound water. The strong bound water is essentially crystalline water. The weak bound water belongs to the adsorbed water on the surface of clay minerals, including water molecules, condensed water, capillary water, and water film that occur in the interlayer spacing, intergranular pores, intercrystalline pores, and particle surfaces of clay minerals (Li et al., 2018). Anisotropy and adsorption deformation also have significant impacts on the microscopic distribution of formation water. However, the relevant research results are mainly concentrated in the field of new energy, while they are relatively scarce in the field of petroleum and natural gas. This also indicates that this research has certain practical significance (Wang et al., 2025).
Wang et al. used thermogravimetric method to quantitatively determine the type, boundary and relative content of bound water in hydrated clay, and compared it with the isothermal adsorption results (Cheng and Heidari, 2017). Handwerger et al. determined the thermal weight loss curve of shale by distillation and thermogravimetric method, and determined the temperature peak range of free water, loosely bound clay water (including capillary/interlayer water), and structural water/hydroxyl water (Handwerger et al., 2012). Meanwhile, clay minerals, especially chlorite, have a significant impact on the properties of rocks. Not only in the petroleum field, but also in the microscopic characterization of porous media, chlorite has achieved certain results, especially in the aspect of the influence of chlorite waste on the properties of magnesium oxychloride cement (Xu et al., 2025). Combining various means, the thermogravimetric method can quantitatively characterize clay water on the basis of full-scale quantitative characterization of formation water, which is of great significance to solve the problem of deviation of water saturation logging characterization in tight gas reservoirs.
In this paper, the tight sandstone reservoirs of the Qian 5 and Tai 2 sections of the Shenfu block in the eastern margin of the Ordos Basin are taken as the research object. Using retorting experiments, nuclear magnetic resonance experiments and displacement experiments, the microscopic formation water distribution of tight gas reservoirs in the Shenfu block is systematically and quantitatively studied to solve the problem of unclear understanding of the microscopic water occurrence characteristics of reservoirs and provide theoretical guidance for the exploration and development of tight sandstone gas.
2 Materials and methods
2.1 Sample information
The samples were taken from the Shiqianfeng Formation and Taiyuan Formation in the Shenfu block of the eastern margin of the Ordos Basin. They belong to the northern part of the Jinxi flexural fold belt, a secondary structural unit of the Ordos Basin. They are located in Shenmu City, Shaanxi Province. The Shenmu gas field is adjacent to east of the Lvliang Mountain, and has the characteristics of complex landforms and structural conditions. There are various types of gas reservoirs, and low-resistivity gas reservoirs are developed (Zhao et al., 2024; Ren et al., 2020). The porosity of 11 fresh tight sandstones is between 3.3% and 7.7%, with an average of 5.7%. The permeability is between 0.0260 mD and 2.528 mD, with an average of 0.811 mD. The overall physical properties of the reservoir are poor. The basic information of the samples is shown in Table 1.
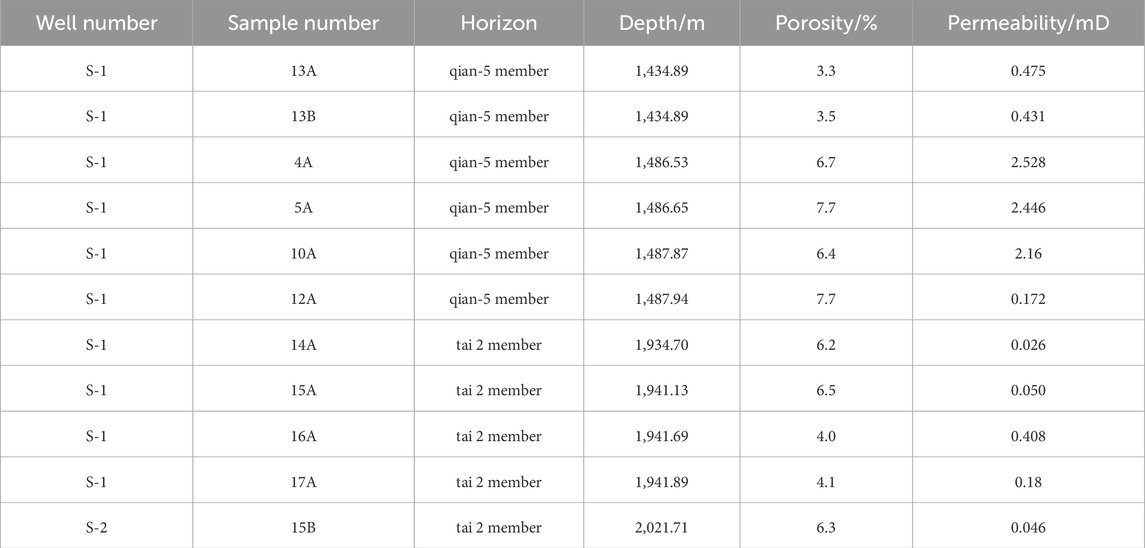
Table 1. Sample properties.
The reservoir sandstone of Shiqianfeng Formation is mainly composed of coarse-grained feldspathic lithic sandstone, and the interstitial material is mainly argillaceous. The Taiyuan Formation is mainly coarse-medium-grained feldspathic lithic sandstone. The interstitial material is mainly siderite, followed by argillaceous and iron calcite. The clay minerals in the two sets of strata are relatively developed. The pore types are mainly intergranular dissolved pores and intragranular dissolved pores. The pores are filled with clay minerals, mainly silk-like illite and scaly kaolinite (Figure 1). Pores and clay minerals are important spaces and places for the occurrence of micro-water in rocks.
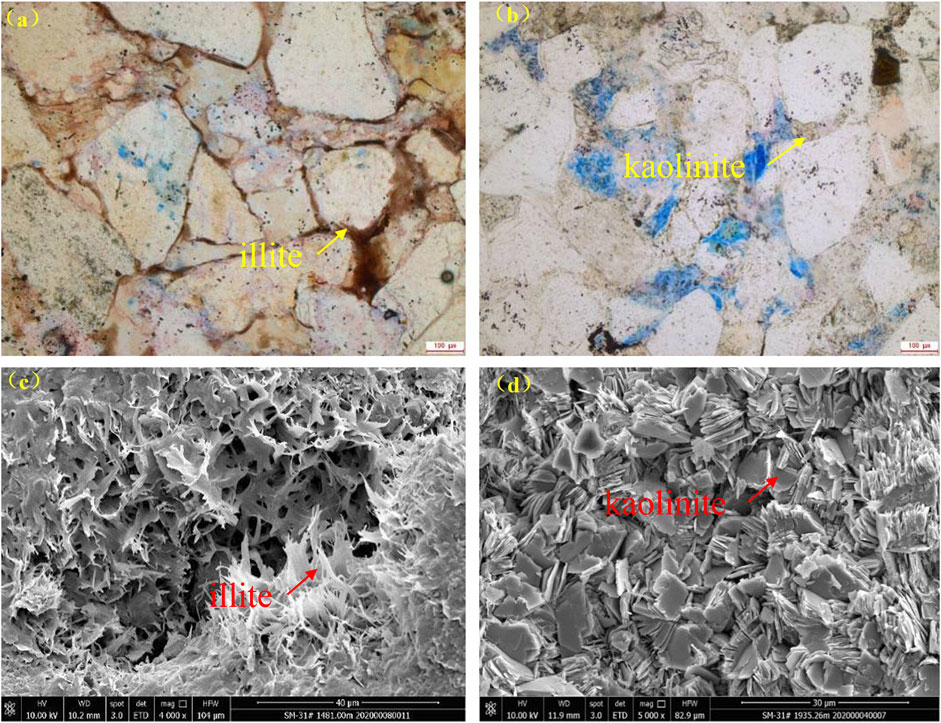
Figure 1. The microscopic characteristics of rocks: (a) 1485.76m, Shiqianfeng Formation, developing intragranular dissolved pores; (b) 1942.02m, Taiyuan Formation, developing intergranular and intragranular dissolved pores; (c) 1481.00 m, Shiqianfeng Formation, inter-granular pores filled with filamentous illite; (d) 1935.26m, Taiyuan Formation, intergranular pores filled with scaly kaolinite.
2.2 Experimental methods
In order to obtain the quantitative distribution characteristics of microscopic formation water in tight gas reservoirs, the retorting experiment, nuclear magnetic resonance experiment, and displacement experiment were used to quantitatively test the microscopic water in different occurrence states of tight sandstone. All experiments were carried out in the CNOOC Energy Technology & Services Limited Key Laboratory for Exploration & Development of Unconventional Resources.
2.2.1 Retorting experiment
The highest test temperature can reach 800°C, and the measurement accuracy can reach 0.001 mL. The experimental temperature is set at 35°C, 40°C, 60°C, 90°C, 116°C, 150°C, 201°C, 260°C, 316°C, 370°C, 427°C, 482°C, 538°C, 649°C, 700°C, and the maximum temperature of clay minerals is set at 1,000°C.
(1) In order to determine the relationship between the weight percentage of rock samples and the retorting time, the experimental steps are as follows:
a. Fresh, tight sandstone samples were selected, and the wet weight of the samples was measured.
b. The experimental temperature was set to 40°C, 60°C, 90°C, 116°C, 150°C, 201°C, 260°C, 316°C, 370°C, 427°C, 482°C, 538°C, 649°C, 700°C.
c. The weight of the sample was measured at 1 h, 2 h, 3 h, 4 h, 5 h, 6 h, 7 h, and 8 h at each temperature.
d. Data processing.
(2) In order to study the variability of the temperature point of movable water saturation, the experimental steps are as follows:
a. First, saturated simulated saturated formation water, weighing the weight of the rock sample after saturation, scanning the nuclear magnetic resonance spectrum in the saturated state, and then creating bound water for the core, weighing the weight of the rock sample in the bound water state, scanning the nuclear magnetic resonance spectrum.
b. The second simulation of saturated formation water is carried out on the rock sample, and the weight of the saturated rock sample is measured.
c. The rock samples were dried at 35°C, 40°C, 60°C, and 90°C, respectively, and the weight of the samples at each temperature point was measured.
d. The formation water saturation and free water saturation are calculated and compared with the results of step a.
2.2.2 Nuclear magnetic resonance experiment
The model of the nuclear magnetic resonance analyzer is MesoMR23-040H-I, the maximum frequency of the RF pulse is 23 MHz, the minimum echo interval is 0.12 m, and the maximum number of echoes is 18,000 times. The nuclear magnetic resonance experiment was used to test the content and occurrence of water in clay minerals and tight sandstone samples at different temperature points and different thermal weight loss states during the retorting experiment.
2.2.3 Displacement experiment
The displacement experiment was carried out on a multifunctional displacement instrument. The displacement gas was nitrogen with a purity of 99.999%. The simulated formation water saturated with the sample was prepared according to the formation water analysis data. In order to avoid the evaporation of water in the process of displacement, the high-purity nitrogen is humidified, and constant temperature control is carried out indoors. Firstly, the rock sample is pretreated, the formation water is saturated, and the saturated wet weight is weighed. Then the rock sample is put into the core holder, and the displacement pressure is set according to the core’s physical properties. The core was taken out every 4 h for weighing until the amount of water expelled by gas no longer increased.
3 Results and discussion
3.1 Quantitative characterization parameters of free water saturation
3.1.1 Free water saturation retorting time
In the experiment, seven fresh tight sandstone rock samples were retorted for 8 h at 40°C to determine the variation characteristics of free water content. From the relationship between the weight ratio of rock samples and the retorting time (Figure 2), it can be seen that after 4 h of retorting, the weight of rock samples decreases slowly, and continues to heat, its weight remains unchanged. From the relationship between the weight ratio of rock samples and the retorting time after retorting of 7 fresh samples at 40°C–700°C (Figure 3), it can be seen that under the conditions of 40°C, 60°C and 90°C, retorting for 8 h, the sample reaches a constant weight state, and under the conditions of 116°C, retorting for 6 h, the sample reaches a constant weight state, and under the conditions of the remaining stable points, retorting for 4 h, the sample reaches a constant weight state. According to the comprehensive experimental results, after 4 h of retorting at each temperature, the decrease in the weight of the rock sample slows down, and the weight of the sample remains unchanged after continuous heating. The retorting time can be used as the basis for the thermal weight loss of the retorting experimental samples under high temperature conditions.
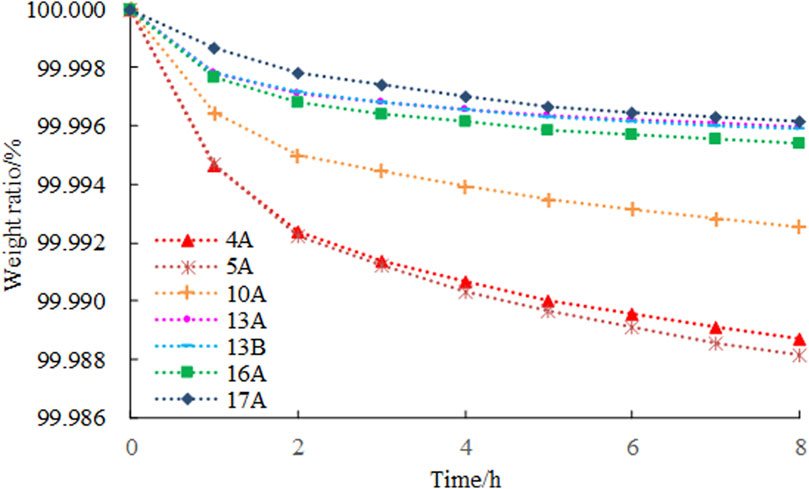
Figure 2. The relationship between weight ratio of sample and time at constant temperature of 40℃.
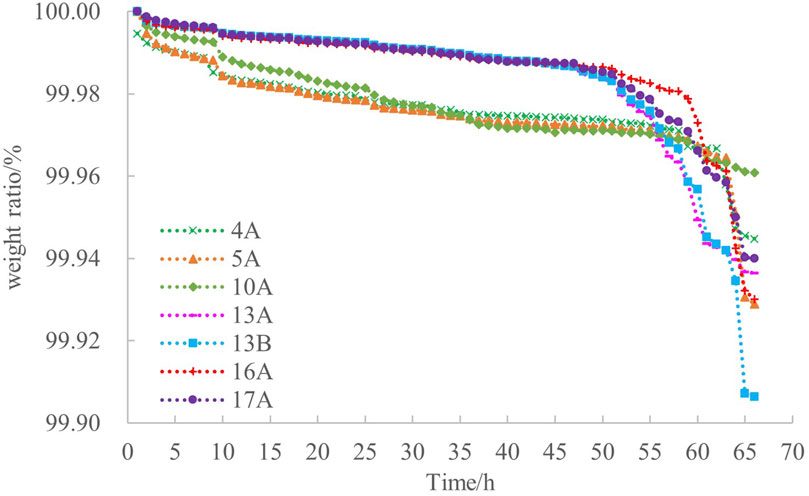
Figure 3. The relationship between weight ratio of fresh tight sandstone and drying time between 40℃ and 700℃.
3.1.2 Free water saturation retorting temperature
Four tight sandstone cores were selected for the free water saturation retorting temperature determination experiment. The comparison between the retorting water saturation and the NMR-displacement water saturation test results at different temperatures showed that (Table 2), the free water saturation tested by the retorting method at 35°C was in good agreement with the free water saturation tested by the NMR-displacement method. The error is between 0.2% and 2.1%, and the average error is 1.1%. Therefore, the free water saturation determined at 35°C is more accurate.
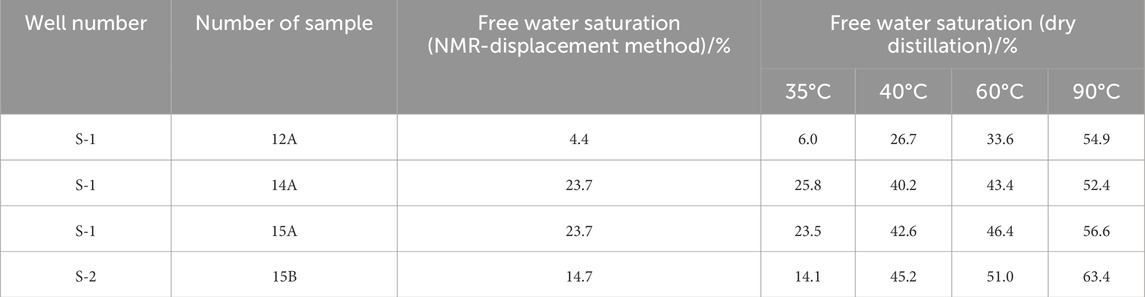
Table 2. Nuclear magnetic resonance-dry distillation free water saturation data.
In order to further verify the reliability of the experimental method, 8 artificial cores without clay minerals were selected to compare the free water saturation of the NMR-displacement method with that of the retorting method. The test results show that the absolute deviation of the free water saturation tested at 35°C is between 0.4% and 3.7% compared with the free water saturation of the NMR-displacement method (Table 3), and the test results are more accurate. The linear fitting results show that the free water saturation measured by the dry distillation method has a good correlation with the permeability (Figure 4), which verifies the rationality of selecting 35°C as the boundary temperature of free water saturation.
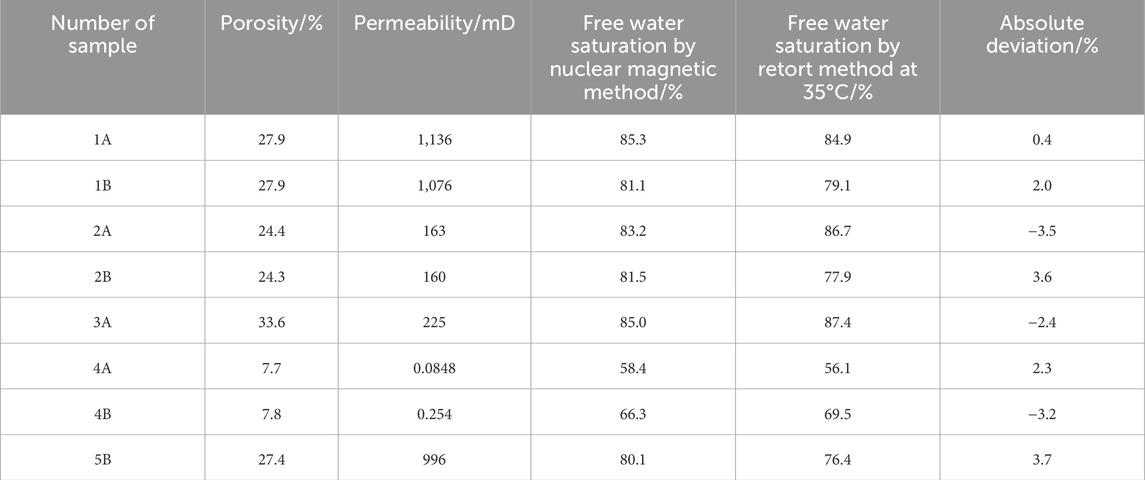
Table 3. Basic physical property data of artificial cores and test results of free water saturation.
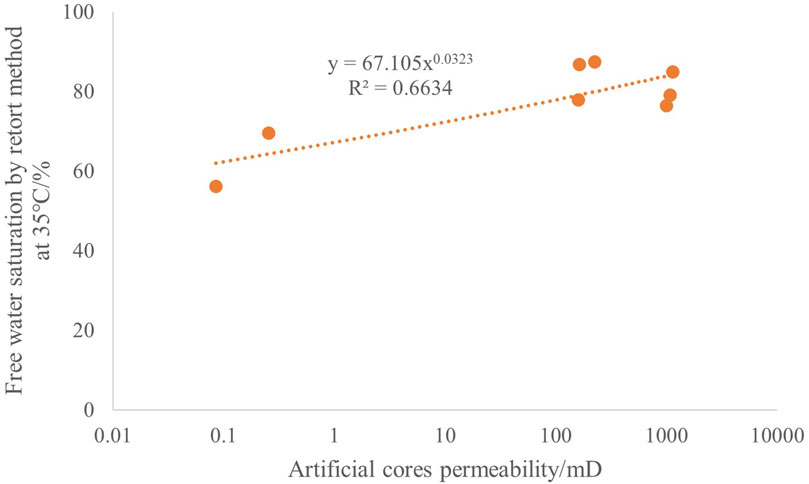
Figure 4. The relationship between free water saturation and permeability of artificial cores.
3.2 Quantitative characterization of thermal weight loss of clay minerals
3.2.1 Thermogravimetric curve characteristics of clay minerals
Tight sandstone gas reservoirs have a certain content of clay minerals, and their formation water occurrence and quantitative test have important reference significance for reservoir water cut characteristics. According to the research results of D.A.Handwerger et al. (2012), 110°C is the temperature boundary point of free water and bound water, 316°C is the temperature boundary point of clay weakly bound water and crystal water, and 537°C is the temperature boundary point of crystal water and structural water/carboxyl water. The content of free water in montmorillonite is high, and the content of free water (including capillary water), bound water, and clay-bound water is equivalent. In illite, kaolinite, and chlorite, the content of clay-bound water is the highest, the proportion can reach more than 80%, and free water is almost negligible (Figure 5). It should be noted that in this study, the loss of water due to the special crystal structure of clay minerals was not taken into account.
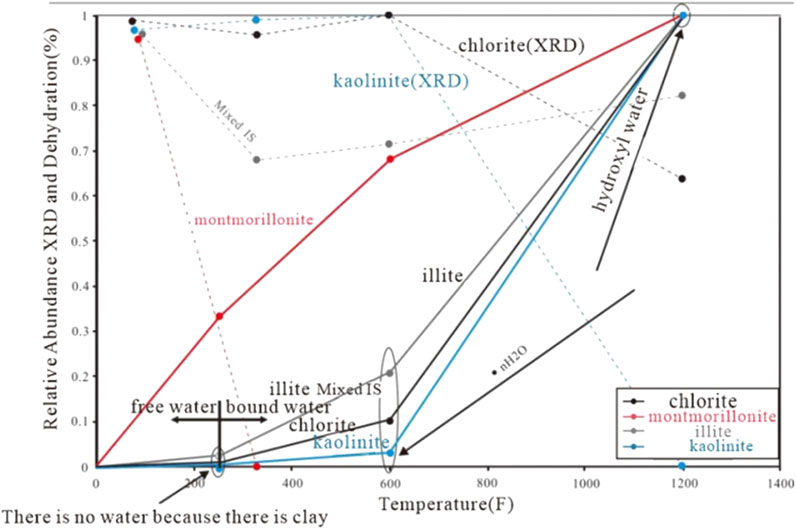
Figure 5. The relative clay content and water loss at different temperatures (Handwerger et al., 2012)
Based on the previous research results on the occurrence characteristics of formation water, the author comprehensively considers the microscopic occurrence state and spatial characteristics of formation water, and divides the formation water in the rock into free water, microporous water (including capillary water, adsorbed water on the surface of mineral particles) and clay bound water (including crystal water, structural water/carboxyl water). Capillary water can flow under certain displacement pressure, and adsorbed water on the surface of mineral particles belongs to the category of bound water (Wang et al., 2024).
Four kinds of pure clay minerals were selected as the research object to carry out the thermogravimetric experiment. Thermogravimetric experiments and nuclear magnetic resonance experiments (Figures 6, 7) showed that the weight loss curves of montmorillonite, illite, chlorite, and kaolinite were significantly different. The total water loss of illite and kaolinite was small, and the weight loss of the sample was less than 2%, about 1.5%. The contribution of water loss was small. The two temperature inflection points were around 90°C and 600°C. There was a certain amount of free water and capillary water in the sample, and the proportion of clay-bound water was large. The nuclear magnetic resonance spectrum showed the same law. There was obvious water loss in the range of 40°C–90°C, and the water loss of the sample between 90°C–600°C was small.
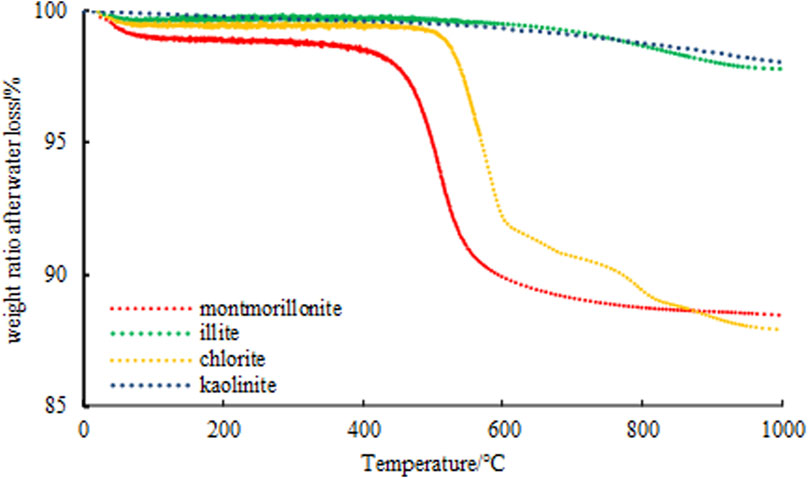
Figure 6. Characteristic curve of thermal loss on clay minerals.
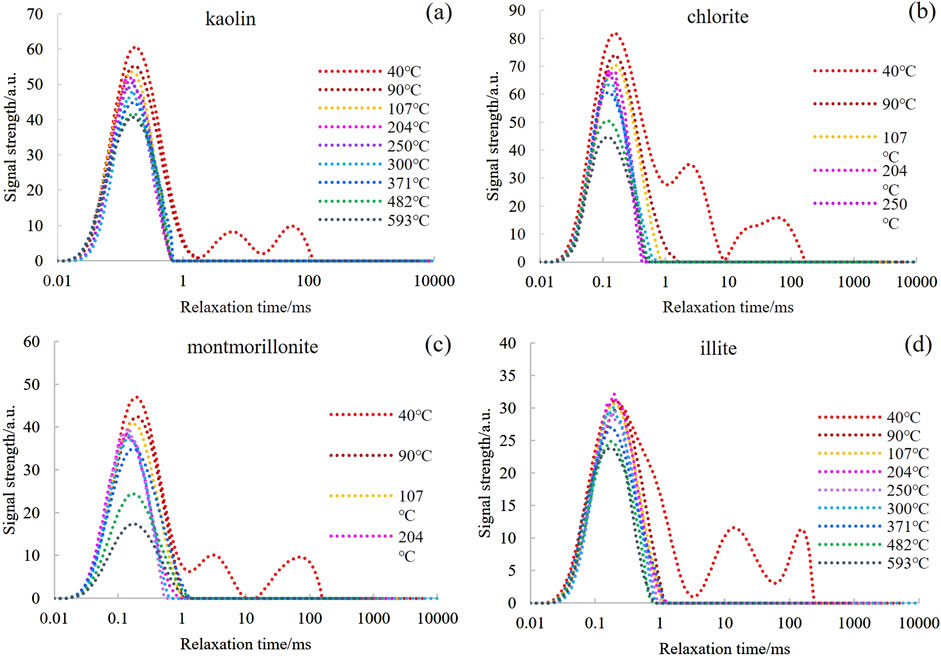
Figure 7. Nuclear magnetic resonance T2 spectra of clay minerals at different temperatures.
The water loss of chlorite and montmorillonite is large, and the curve decreases greatly. The curve can be divided into four intervals and four inflection points (Figure 6). The first inflection point is about 35°C; below 35°C is free water in clay; the second inflection point is about 90°C. The weight of the sample at this point decreases after dehydration, and the curve is gentle, but the overall decrease is small, mainly composed of capillary water. The third inflection points of chlorite and montmorillonite are 500°C and 427°C, respectively, and the fourth inflection points are 600°C and 575°C, respectively. The samples at the second inflection point and the third inflection point almost did not lose water, and there was little adsorbed water on the surface of clay mineral particles in clay, which was related to the little development of pure clay mineral pores. The water loss between the third inflection point and the fourth inflection point is the largest. This part of the water is mainly the crystal water in the clay-bound water, which is the main water loss interval. The water loss of montmorillonite is small after the fourth inflection point, and the water loss of chlorite is obvious after the fourth inflection point. This part of the water is the structural water/carboxyl water in the clay-bound water. The NMR spectra at different temperatures showed that the water loss was consistent with the thermogravimetric curve (Figure 7).
3.2.2 Thermal weight loss law of clay minerals
Based on previous studies, combined with the clay mineral thermogravimetric experiment carried out in this paper, it is considered that the total water loss of illite and kaolinite is small, which has little effect on the water saturation of rock. Chlorite and montmorillonite have an obvious influence on the water saturation of rock. 35°C is the boundary between free water and capillary water, and 90°C is the boundary between clay interlayer water and capillary water in clay. Combined with the curve shape and water loss, 435°C is defined as the boundary between clay adsorbed water and clay-bound water, that is, the temperature boundary between microporous water and clay-bound water. The capillary water content in clay is very small, and the clay-bound water is the main component of water in clay. From the curve shape, 604°C is the boundary between crystalline water and structural water/carboxyl water. According to the classification of water in clay, it is generally consistent with the classification of free water, microporous water (including capillary water, adsorbed water on the surface of mineral particles), and clay-bound water (including crystal water, structural water/carboxyl water) (Liu et al., 2022).
3.3 Quantitative characterization of thermal weight loss of tight sandstone
3.3.1 Thermal weight loss curve characteristics of tight sandstone
Four fresh, tight sandstone samples were selected to carry out thermogravimetric experiments. The results show that the core water loss curve is divided into four intervals and three inflection points (Figure 8). Combined with the nuclear magnetic resonance spectrum (Figure 9), the core is below 35°C. The water lost in the pores is mainly free water, which can flow and volatilize at room temperature. When the rock is above 35°C, the water loss rate of the rock decreases. It can also be seen from the nuclear magnetic resonance spectrum that the water saturation in the pores is the same as the irreducible water saturation under the condition of 35°C. In the range of 35°C–90°C, the water loss rate of rock is higher than that of the post-heating stage and lower than that of the movable water stage, but the proportion of water loss is the largest. When the temperature reaches 90°C, the spectral peak of the macropore part in the T2 spectrum almost disappears. This part of water mainly occurs in the capillary of the rock and can be produced from the core under greater pressure. It mainly occurs in capillary pores or micropores, which are capillary water and belong to microporous water. When the temperature of the dry distillation experiment is in the range of 90°C–427°C, the water loss rate of the rock is lower than that of the previous stage. At this stage, there is almost no water loss in clay, but there is still a certain amount of water content in rock pores. It can also be seen from Figure 9 that there is obvious water loss in this stage. The water in this stage is mainly water molecules adsorbed on the surface of mineral particles, which can be called adsorbed water on the surface of mineral particles, and it is also a kind of microporous water. When the temperature of the retorting experiment is above 427°C, the water loss curve of the rock shows a significant downward trend, and the water loss rate is obvious. From Figure 9, the peak area of the T2 spectrum in this stage is small, the peak value is low, and the water content is small. When the temperature continues to rise, the carboxyl water in the clay is difficult to characterize by the nuclear magnetic resonance T2 spectrum (Chen et al., 2020).
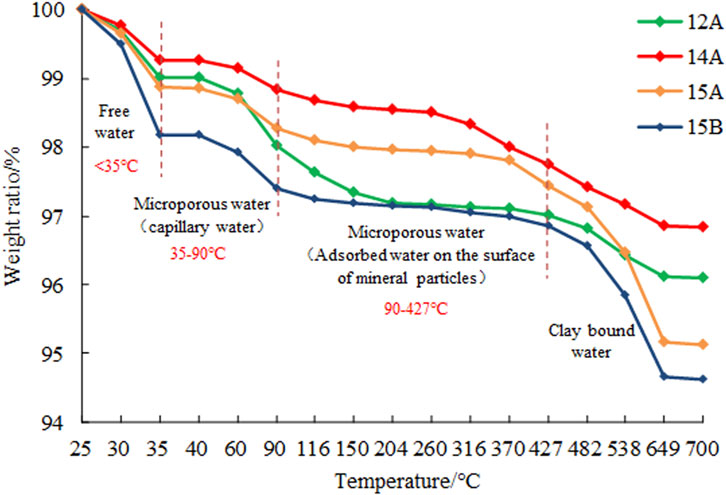
Figure 8. Thermal gravimetric experiment results of tight sandstone samples.
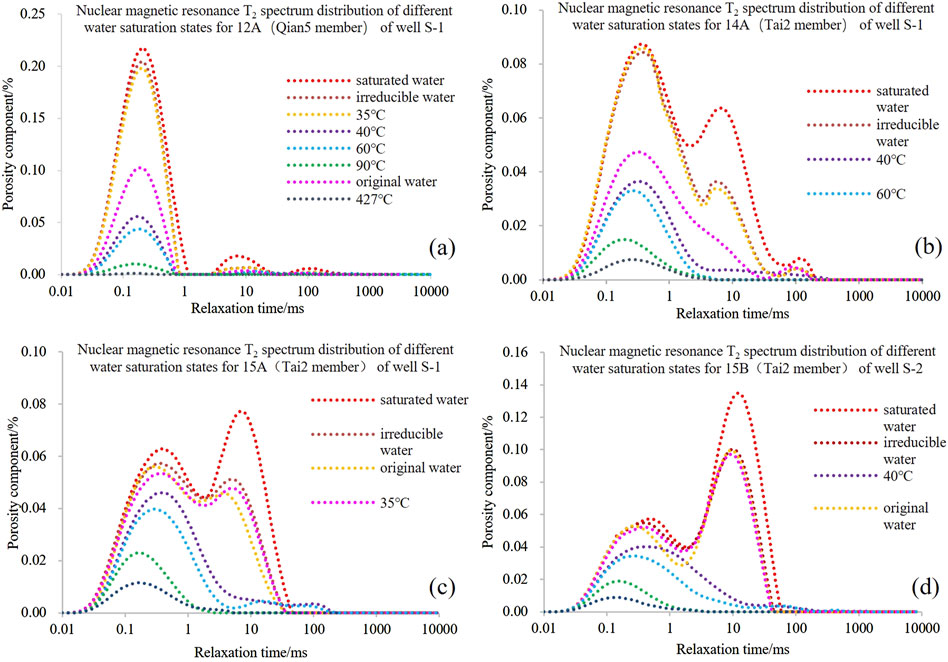
Figure 9. NMR T2 spectra of tight sandstone samples at different temperatures.
3.3.2 Thermal weight loss law of tight sandstone
There is a high degree of consistency in the water loss law of different tight sandstone samples under the condition of thermal weight loss. The temperature inflection point and the curve decline trend interval are obvious, the water loss range is large, and the water loss is large, which indicates that the tight sandstone is in the whole temperature stage or a different occurrence space. From the quantitative distribution of formation water types, microporous water is higher than free water, and free water is higher than clay water. From the perspective of water loss rate, free water is greater than clay water, and clay water is greater than microporous water.
According to the results of the thermogravimetric experiment of clay minerals, when the experimental temperature is above 427°C, the water loss rate and water loss of clay minerals are large, which is consistent with the characteristics of the water loss curve of the rock at this stage. This shows that the water content in the rock measured in the temperature range above 427°C is mainly clay bound water content.
In a word, the study did not fully account for the impact of clay minerals’ unique crystal structures (e.g., chlorite’s high-temperature dehydration) on thermogravimetric results. Experimental samples (pure minerals and limited cores) inadequately represented real reservoir complexities like mixed clay assemblages and pore structures. NMR characterization also failed to detect carboxyl water above 427°C. In the future, corrective models for structural water effects will be developed. Experiments will expand to reservoir-realistic samples with mineral heterogeneity. Advanced characterization techniques will be integrated to overcome high-temperature water detection limitations. Ultimately, quantitative links between thermogravimetric parameters and reservoir properties will be established for improved logging interpretation.
4 Conclusion
(1) The quantitative characterization of free water revealed a temperature-dependent dehydration mechanism: retorting durations significantly decreased with increasing temperature (8 h below 90°C, 6 h at 116°C, and 4 h at ≥ 150°C), governed by the kinetics of water desorption and bond dissociation.
(2) The total water loss of illite and kaolinite is small, and the total water loss of chlorite and montmorillonite is large. According to the characterization of various types of water occurrence in clay and tight sandstone by thermogravimetric experiment, free water below 35°C, microporous water (including capillary water and adsorbed water on the surface of mineral particles) between 35°C and 427°C, and clay bound water (crystal water, structural water/carboxyl water) above 427 °C.
(3) Optimal free water saturation measurement requires retorting at 35°C. This temperature yields results most consistent with NMR-displacement method data, with minimal error (average 1.1%, range 0.2%–3.7%). Validation across natural and artificial cores confirms 35°C as the reliable boundary temperature for accurate free water quantification in tight sandstones.
(4) The occurrence type of water in tight sandstone is consistent with clay minerals, but the occurrence and loss of water are different. From the perspective of water occurrence, microporous water is higher than free water, and free water is higher than clay water. From the perspective of water loss rate, free water is greater than clay water, and clay water is greater than microporous water.
Data availability statement
The original contributions presented in the study are included in the article/Supplementary Material, further inquiries can be directed to the corresponding author.
Author contributions
CgL: Conceptualization, Data curation, Writing – original draft. LM: Formal Analysis, Funding acquisition, Investigation, Writing – original draft. CzL: Formal Analysis, Writing – original draft. YL: Methodology, Writing – original draft. YH: Data curation, Writing – original draft. JY: Validation, Writing – review and editing. WH: Conceptualization, Writing – review and editing. DL: Supervision, Writing – review and editing.
Funding
The author(s) declare that financial support was received for the research and/or publication of this article. The research is funded by the China National Offshore Oil Corporation Research Condition Platform Construction Project “Construction of Unconventional Oil and Gas Exploration and Development Experimental Platform (Phase II)” (No. CNOOC-KJ PT GCJS 2021–01). The funder was not involved in the study design, collection, analysis, interpretation of data, the writing of this article, or the decision to submit it for publication.
Acknowledgments
The authors appreciate Dazhong Ren from Xi’an Shiyou University for valuable advice.
Conflict of interest
Authors CgL, LM, CzL, YL, YH, JY, and WH were employed by CNOOC EnerTech-Drilling & Production Co. and CNOOC Energy Technology and Services Limited Key Laboratory for Exploration and Development of Unconventional Resources.
The remaining author declares that the research was conducted in the absence of any commercial or financial relationships that could be construed as a potential conflict of interest.
Generative AI statement
The author(s) declare that no Generative AI was used in the creation of this manuscript.
Publisher’s note
All claims expressed in this article are solely those of the authors and do not necessarily represent those of their affiliated organizations, or those of the publisher, the editors and the reviewers. Any product that may be evaluated in this article, or claim that may be made by its manufacturer, is not guaranteed or endorsed by the publisher.
References
Chen, Z., Liu, X., Yang, J., Little, E., and Zhou, Y. (2020). Deep learning-based method for SEM image segmentation in mineral characterization, an example from Duvernay Shale samples in Western Canada Sedimentary Basin. Computers and Geosciences 138, 104450.
Cheng, K., and Heidari, Z. (2017). Combined interpretation of NMR and TGA measurements to quantify the impact of relative humidity on hydration of clay minerals. Applied Clay Science 143, 362–371.
Dou, Y., Yang, S., Liu, Z., Clift, P. D., Shi, X., Yu, H., et al. (2010). Provenance discrimination of siliciclastic sediments in the middle Okinawa Trough since 30 ka: constraints from rare earth element compositions. Marine Geology 275(1-4), 212–220.
Handwerger, D. A., Willberg, D., Pagels, M., Rowland, B., and Keller, J. F. (2012). Reconciling retort versus Dean Stark measurements on tight shales. SPE Annual Technical Conference and Exhibition. San Antonio, TX.
Jiang, Z., Li, Z., Li, F., Pang, X., Yang, W., Liu, L., et al. (2015). Tight sandstone gas accumulation mechanism and development models. Petroleum Science 12 (4), 587–605.
Li, J., Chen, Z., Li, X., Wang, X., Wu, K., Feng, D., et al. (2018). A quantitative research of water distribution characteristics inside shale and clay nanopores. China Sci. Tech. Sci. 48 (11), 1219–1233. doi:10.1360/n092017-00137
Liu, G., Sun, M., Zhao, Z., Wang, X., and Wu, S. (2013). Characteristics and accumulation mechanism of tight sandstone gas reservoirs in the Upper Paleozoic, northern Ordos Basin, China. Petroleum Science 10 (4), 442–449
Liu, C., Ma, L., Liu, X., Li, Y., Zhang, B., Ren, D., et al. (2022). Study and choice of water saturation test method for tight sandstone gas reservoirs. Front. Phys. 10, 833940. doi:10.3389/fphy.2022.833940
Ren, D., Yang, F., Li, R., Li, Y., and Liu, D. (2020). The influential factors and characteristics of tight sandstone gas reservoir: a case study in Ordos Basin in China. Geofluids 2020 (1), 6690043.
Tan, X., Jia, C., Liu, J., Liu, G., Zheng, R., Wang, S., et al. (2022). Gas and water distribution in the tight gas sands of the northwestern daniudi gas field, ordos basin, China: impact of the shale barrier. Fuel 317, 122782.
Tian, W., Zhao, S., Tian, F., Huo, W., Zhong, G., Li, S., et al. (2023). Symbiotic combination and accumulation of coal measure gas in the Daning–Jixian Block, eastern margin of Ordos basin, China. Energies 16(4), 1737.
Wang, L., Duan, R., Liu, J., Yang, S., Gu, J., and Mu, B. (2012). Molecular analysis of the microbial community structures in water-flooding petroleum reservoirs with different temperatures. Biogeosciences 9 (11), 4645–4659.
Wang, H., Qian, H., Gao, Y., and Li, Y. (2020). Classification and physical characteristics of bound water in loess and its main clay minerals. Engineering Geology 265, 105394.
Wang, R., Shi, B., Wang, T., Lin, J., Li, B., Fan, S., et al. (2024). Multiscale qualitative–quantitative characterization of the pore structure in coal-bearing reservoirs of the Yan’an formation in the Longdong area, Ordos basin. Processes 12 (12), 2787.
Wang, L., Zhang, W., Cao, Z., Xue, Y., and Xiong, F. (2025). Coupled effects of the anisotropic permeability and adsorption-induced deformation on the hydrogen and carbon reservoir extraction dynamics. Phys. Fluids 37 (6), 066608. doi:10.1063/5.0270765
Wu, S., Yang, Z., Pan, S., Cui, J., Lin, S., Bale, H., et al. (2020). Three-dimensional imaging of fracture propagation in tight sandstones of the Upper Triassic Chang 7 member, Ordos Basin, Northern China. Marine and Petroleum Geology 120, 104501.
Wu, K., Chen, D., Zhang, W., Yang, H., Wu, H., Chen, X., et al. (2022). Movable fluid distribution characteristics and microscopic mechanism of tight reservoir in Yanchang Formation. Front. Earth Sci. 10, 840875. doi:10.3389/feart.2022.840875
Xu, P., Guo, Y., Ding, Y., Li, H., Chen, T., and Wang, H. (2025). Effect of polymeric aluminum chloride waste residue and citric acid on the properties of magnesium oxychloride cement. J. Build. Eng. 101 (101), 111864. doi:10.1016/j.jobe.2025.111864
Zhang, S., Su, J., Wang, X., Zhu, G., Yang, H., Liu, K., et al. (2011). Geochemistry of Palaeozoic marine petroleum from the Tarim Basin, NW China: part 3. Thermal cracking of liquid hydrocarbons and gas washing as the major mechanisms for deep gas condensate accumulations. Organic Geochemistry 42 (11), 1394–1410.
Zhao, Z., Xu, W., Zhao, Z., Yi, S., Yang, W., and Zhang, Y.(2024). Geological characteristics and exploration breakthroughs of coal rock gas in Carboniferous Benxi Formation, Ordos Basin, NW China. Petroleum Exploration and Development 51(2), 262–278.
Keywords: clay minerals, tight sandstone, thermogravimetric method, free water, microporous water, clay bound water
Citation: Liu C, Ma L, Liu C, Li Y, Huang Y, Yang J, Hu W and Liu D (2025) Quantitative study of microscopic formation water distribution in tight gas reservoirs based on the thermogravimetric method. Front. Earth Sci. 13:1627768. doi: 10.3389/feart.2025.1627768
Received: 13 May 2025; Accepted: 17 July 2025;
Published: 24 October 2025.
Edited by:
Muhsan Ehsan, Bahria University, PakistanReviewed by:
Zhengzheng Cao, Henan Polytechnic University, ChinaXiangrong Nie, Xi’an Shiyou University, China
Copyright © 2025 Liu, Ma, Liu, Li, Huang, Yang, Hu and Liu. This is an open-access article distributed under the terms of the Creative Commons Attribution License (CC BY). The use, distribution or reproduction in other forums is permitted, provided the original author(s) and the copyright owner(s) are credited and that the original publication in this journal is cited, in accordance with accepted academic practice. No use, distribution or reproduction is permitted which does not comply with these terms.
*Correspondence: Dengke Liu, bGl1ZGVuZ2tlQHhqdHUuZWR1LmNu