 Jared M. Long-Fox
 Sui Tung2
- 1Department of Physics, University of Central Florida, Orlando, FL, United States
- 2Department of Geosciences, Texas Technological University, Lubbock, TX, United States
- 3Department of Geology and Geological Engineering, South Dakota School of Mines and Technology, Rapid City, SD, United States
The eruption cycle of a volcano is controlled by the subsurface migration and storage of magma. The specific characteristics of the magma migration and spatial distribution of material properties produce a specific deformation signature on the Earth’s surface. Inverse analyses of geodetic data are used to optimize characteristic geometric and mechanical parameters of the volcanic system and hence provide information on the subsurface magmatic system. This study uses interferometric synthetic aperture radar data from a 1997 co- and post-eruptive interval for Okmok volcano to estimate the location of the magma reservoir and constrain finite element-based viscosity models of a thermally-weakened viscoelastic rind surrounding the reservoir. For the first time, approximately 10 years of pre-and post-eruption interferometric synthetic aperture radar data are analyzed to recover a magma reservoir pressurization history using both purely elastic and coupled elastic-viscoelastic models. The findings show that low viscosities surrounding the magma reservoir relax stresses rapidly enough to allow prediction of the more realistic viscoelastic pressurization histories to be calculated as a scaled version of the relatively simple but computationally efficient elastic models which allows for quick analysis of volcano hazards while maintaining fidelity to the actual physical system. This offers insights into how the shallow rheologic structure of magmatic systems can influence the predictions of transient deformation and estimates of the time-dependent magma budget.
1 Introduction
Magma migration and storage in an active volcanic setting produce deformation of the Earth’s surface. The specific distribution of elastic and rheologic material properties and details of the magma migration control this deformation field (Del Negro et al., 2009; Masterlark et al., 2016). Geodetic data, such as Interferometric Synthetic Aperture Radar (InSAR) and global navigation satellite systems (GNSS) can be used to measure this deformation in space and time. To understand the internal mechanical structure of a volcano, arrays of seismic instruments may be deployed to measure the distribution of elastic material properties in the subsurface of the volcano and surrounding area. Numerical models allow the definition of a quantitative relationship between predicted movement and storage of magma and observed surface deformation. These numerical impulse-response experiments may be performed to compare observed deformation to model predictions (the response) given a magma intrusion or volcanic event (the impulse). Imaging volcanic sources through deformation is strongly affected by the chamber geometry/location and material properties configured in numerical model [e.g., 2, 3] so care must be taken to honor the real, physical system with as high fidelity as possible. With the ability to compare predicted and observed deformation, we estimate key parameters that describe the complex domain and magma reservoir (i.e., location of the magma reservoir and any associated thermal weakening) of the volcanic system through inverse methods.
Volcano deformation modeling customarily uses analytical methods that estimate pressurization or volumetric changes for magma source geometries such as spheres (Mogi, 1958), ellipsoids (Yang et al., 1988), and dikes or sills (Okada, 1992) embedded in homogeneous elastic half-space (HEHS) domains. These analytical solutions require minimal computational power and time, so they are commonly used in inverse analyses of ground deformation data, particularly for the estimation of nonlinear parameters. Though computationally efficient, the HEHS assumptions poorly approximate the naturally complex systems of volcanoes (including the exclusion of topography and the assumption of material homogeneity), and as such, result in unreliable predictions and parameter estimations (Masterlark, 2007; Trasatti et al., 2003; Manconi et al., 2010), such as unrealistic magma reservoir locations (Masterlark et al., 2012) and unrealistic rheologic partitioning (Trasatti et al., 2003; Manconi et al., 2010). Several studies specifically address this problem for the case of Okmok volcano (Masterlark et al., 2016; Masterlark, 2007; Masterlark et al., 2012; Masterlark et al., 2018).
Numerical methods are not limited by the HEHS assumptions and are able to provide a better approximation of the complex system of a volcano (Masterlark et al., 2012). The numerical models used here are specifically finite element models (FEMs) which were developed in the 1940s (Courant, 1943) and were first applied to volcano deformation modeling in the 1970s (Dieterich and Decker, 1975). These models provide a numerical method of describing an arbitrary model domain geometry as a piecewise formulation of elements with independent material properties and arbitrary boundary, loading, and initial conditions. FEMs are the best-known family of mathematical models that are capable of simulating elastic, viscoelastic, and thermal equations for an arbitrarily shaped deformation source embedded in such an arbitrary domain. FEMs have significantly advanced interpretations of deformation over those of traditional analytical methods by allowing for arbitrary domain geometries and material property heterogeneity that describes the rich mechanical complexity of magmatic systems (Masterlark et al., 2012; Newman et al., 2006; Masterlark et al., 2010). Specifically, the FEM capability to model viscoelastic materials is a key advancement over analytical models and purely elastic FEMs but has rarely been incorporated in high-fidelity volcano deformation modeling studies. As such, many studies have turned to the use of FEMs to incorporate various types of spatially variable data, such as seismic tomography and the thermomechanical effects of a magma chamber in the Earth’s crust (Newman et al., 2006; Masterlark et al., 2010), resulting in marked improvements in simulating the complexity of active volcanoes. This study introduces a novel FEM-based optimization of viscoelastic response by inverting geodetic data and follows with a new transient deformation analysis methodology using the optimized model.
The site chosen for this study is Okmok volcano, Alaska. Okmok volcano is located on Umnak Island in the Aleutian volcanic arc, which extends from Alaska, United States, to Kamchatka Peninsula, Russia. This volcanic arc system hosts more than 40 active volcanoes (Figure 1a; Begét et al., 2005) and was formed from tectonic and volcanic activity resulting from the Pacific Plate subducting beneath the North American Plate (Finney et al., 2008). Rock compositions along the arc are split into relatively mafic and silicic groups to the west and east, respectively (Miller et al., 1998). Umnak Island, located in the central Aleutian Arc, is primarily mafic in composition, and is underlain by a basement of oceanic crust. The island is comprised of two volcanic lobes that are aligned southwest-northeast. The southwest lobe is occupied by Vsevidof and Recheshnoi stratovolcanoes. Okmok volcano occupies the northeast lobe of Umnak Island and is one of the largest volcanic shields in the Aleutian volcanic arc (Burgisser, 2005). Figure 1b illustrates the study area location and model domain used in this study.
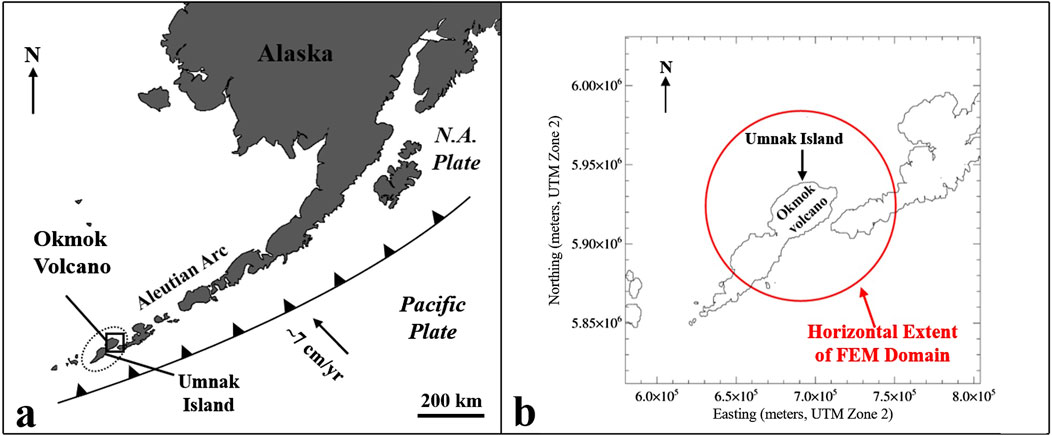
Figure 1. Map of (a) Regional tectonic setting of Okmok volcano and (b) Umnak Island with the 60-km radius problem domain used in this study.
Okmok volcano is chosen for this study because it is a relatively well-studied and well-understood volcano with a semi-regular decadal eruption cycle. The geologic history of Okmok is given by others (Begét et al., 2005; Miller et al., 1998; Larsen et al., 2007). The current physiography of Okmok is dominated by a roughly circular caldera with a diameter of approximately 10 km with recent eruptions in 1997 and 2008, though only the 1997 eruption is analyzed here. The erupted material from the most recent eruption at Okmok has been geochemically analyzed and is consistent with primitive magma from depth and brief storage in shallow reservoirs (Larsen et al., 2013). This means that the material is genetically related to parental magma rising from depth and undergoing various magmatic processes (Finney et al., 2008). Parameters obtained from these thermal and petrologic studies are the temperature of the erupted products at depth as well as the temperature and depth of the Moho. The many studies performed on Okmok allow it to be treated as a natural laboratory with a wealth of information for petrologic and geophysical constraints, calibration, verification, and post-audits. However, the past studies have not systematically considered the temperature-dependent viscosities of the region surrounding the magma reservoir and have not leveraged the time-dependence viscoelastic rheology imposes on ground deformation resulting from subsurface magma migration. This study fills that gap.
2 Methods
2.1 Data
Constraining data, such as seismic tomography data and topography/bathymetry, are treated as a priori information built into models. Topography and bathymetry define the geometry of the model free surface (the Earth’s surface), while ambient noise tomography and regional velocity models dictate the distribution of elastic material properties throughout the model domain. Rheologic partitioning is performed in accordance with thermal models that incorporate thermal and petrologic information. InSAR data serve as calibration targets used in inverse analyses to estimate characteristic parameters describing the position and pressurization of the deformation source as well as the temperature-dependent viscosity of the viscoelastic rind surrounding the magma reservoir.
2.1.1 Topographic and bathymetric data
Lu et al. (2003) used InSAR to develop a digital elevation model (DEM) for the lobe of Umnak Island dominated by Okmok volcano. Originally, the DEM had a 5-m pixel resolution and vertical uncertainty of 10 m. This DEM is resampled (downsampled, coarser topographic resolution) to correspond to the 40-m pixel resolution of the 1997 co-eruption InSAR image described later in this work. This DEM is combined with low resolution (1-min) topography and bathymetry data available from the National Oceanographic and Atmospheric Administration (NOAA) National Geophysical Data Center to construct a DEM describing the geometry of Earth’s surface, both onshore and offshore (NOAA, 2019). This DEM is used to define the geometry of the model free-surface, introducing the irregular geometry of topography and bathymetry.
2.1.2 Seismic tomography data
Ambient noise tomography (ANT) from Masterlark et al. (2010) reveal a complex internal structure for Okmok volcano. The same study provided a detailed analysis of the ANT data used in this study though a summary is given here. ANT reveals two low-velocity zones (LVZs) in the subsurface structure of Okmok. The shallow LVZ fills the caldera from the land surface to a depth of ∼1,000 m bsl. A deeper (∼4,000 m bsl) LVZ suggests the presence of an active magma reservoir. The shallow LVZ strongly influences the estimated depth of the magma reservoir, while the deep LVZ confirms the estimated depth of the magma chamber (Masterlark et al., 2012), which is significantly deeper than estimates based on HEHS models (Masterlark et al., 2016; Masterlark et al., 2012). To account for the complex mechanical structure of Okmok, these seismic tomography data are ingested into the model via Nearest Neighbor and Laplacian interpolation schemes (Masterlark et al., 2016; Masterlark et al., 2012).
2.1.3 Thermal and petrologic information
Thermal and petrologic studies provided boundary conditions for the thermal model of Okmok produced in this study. Petrologic data suggest a minimum temperature of 1,015°C for the magma from the 1997 eruption of Okmok (Izbekov et al., 2005), so this temperature is taken as the magma reservoir wall temperature (solidus) in the thermal model. The 750°C isotherm surrounding the magma chamber in the thermal model defines the edge of the viscoelastic rind in coupled elastic-viscoelastic deformation models, as this isotherm represents the brittle-ductile transition for diabase at approximately 3–5 km depth (Hirth et al., 1998; Winter, 2001). In this thermal model, the Moho is fixed a depth of 30 km (based on seismic velocity studies) with a fixed temperature of 600°C, as estimated from geothermal studies (Stern, 2002). This information is used in a steady-state thermal model that is consistent with the expected thermal regime at Okmok.
2.1.4 Ground deformation data
Deformation data from InSAR are used to estimate magma reservoir location, optimize thermomechanical properties of the region around the reservoir, and invert for a history of cumulative pressurization that results in the InSAR-observed ground deformation. Ground deformation data used in this study are the same data used in Lu et al. (2005). Here, 39 InSAR images spanning arppoximately a decade (∼1993–2002) of Okmok’s deformation history are used, giving an excellent overview of the transient properties of the deformation cycle of an active volcano. An initial set of 77 InSAR images is pared down for analysis based on image acquisition start dates. If any InSAR images had the same initial acquisition date or started within 10 days of each other, only one of the images is selected to be used in this study based on the difference between initial and final acquisition dates, with preference given to InSAR images with a shorter duration. This preference for InSAR images representing shorter times is given due to InSAR images naturally losing coherence with a longer time between initial and final acquisition dates. Supplementary Table S1 in the Supplementary Material lists the temporal index of each InSAR image used, the corresponding image name as given in Lu et al. (2005), and average line-of-sight (LOS) vector. A plot of selected InSAR image acquisition dates is given in Figure 2.
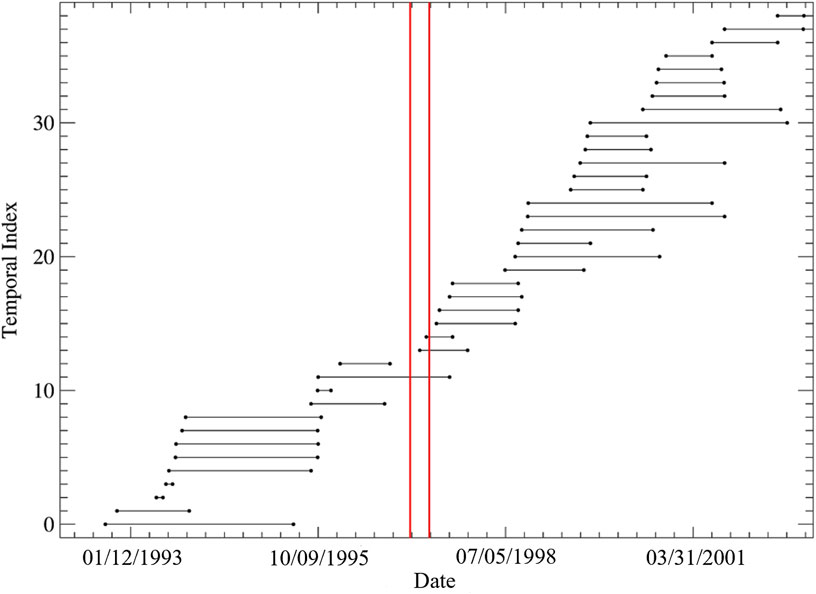
Figure 2. InSAR images used in this study sorted by initial acquisition date with the 1997 eruption interval of Okmok bounded by red vertical lines. For LOS vectors of each InSAR image, see Supplementary Table S1 in Supplementary Material.
Parameters describing the location of the magma reservoir and viscosity of the viscoelastic rind surrounding the magma reservoir are calibrated through nonlinear optimization based on the 1997 co-eruption InSAR image for Okmok. This InSAR image has acquisition dates of 9 October 1995 and 9 September 1997 (Image ID 66 from Lu et al. (2005)). The average LOS vector is L = [0.3456540, −0.0813906, 0.9348260]. The deformation field is strongly symmetric about a vertical axis coinciding with the caldera center, with a maximum co-eruption LOS displacement of approximately −1.4 m (subsidence) near center of the caldera. The 1997 co-eruption image for Okmok is used in model parameter estimations characterizing the location of the magma chamber, as well as the surrounding viscosity for several reasons. First, these InSAR data have a high signal-to-noise ratio and the overall pattern of the deformation field is well predicted by relatively simple models simulating pressurization of a spherical deformation source (Masterlark, 2007; Masterlark et al., 2012). Second, the InSAR data from the 1997 eruption are well-studied and this provides a wealth of data to verify and compare results (Masterlark et al., 2016; Masterlark, 2007; Masterlark et al., 2012; Masterlark et al., 2010; Lu et al., 2005; Lu et al., 2000; Mann et al., 2002). Masterlark et al. (2010) successfully optimized the viscous properties of the viscoelastic rind during this co-eruption interval, but did not estimate the uncertainties. Furthermore, that study assumed magma reservoir depth based on the deep LVZ alone that is inconsistent with the co-eruption InSAR data (Masterlark, 2007; Masterlark et al., 2012). The study here used FEMs that account for the deep LVZ and estimate viscosity and location of the chamber, based on the co-eruption InSAR data. Once the location and rheologic parameter values are estimated, the pressurization history is calculated over the period spanned by the InSAR data for the calibrated models simulating both elastic and viscoelastic domains. Evaluating the nonlinear time-dependence of the magma chamber location and viscosity simultaneously with the pressurization history would require exploration of a hyperdimensional nonlinear parameter space that is beyond the scope of this study.
2.2 Model domain and mesh configuration
The active magmatic system at Okmok implies mechanical, thermal, and chemical complexities throughout the area surrounding the volcano that are expected at all other volcanoes and require complex modeling to capture. For example, Okmok has significant topographic relief that contradicts the flat land surface assumption of HEHS models (Cayol and Coronet, 1998), as do the mechanical heterogeneities implied by seismic tomography. Given the limitations of HEHS techniques to simulate Okmok, the finite element method is used to simulate the expected irregular geometry, mechanical complexity, and thermal regime in an effort to provide better informed predictions and interpretations for the deformation of Okmok volcano. The finite element method includes domain design and then tessellation of the domain into an assembly of finite elements. Integration over these elements, along with the initial, boundary, and loading conditions, minimizes the Principle of Virtual Work (Abaqus, 2012) and approximates a solution to the governing equations.
FEMs in this study use various data types to constrain model configurations, parameters, and solutions. The initial FEM mesh is created in the Abaqus 6.12 graphical user interface, Abaqus/CAE (Abaqus, 2012), with subsequent FEM analyses performed using the open-source FEM package, CalculiX 2.8 (Dhondt and Wittig, 2015). All process automation and FEM data analyses were performed in IDL 8.2.2 (IDL, 2012) and Python 2.7 (Python Software Foundation, 2010). Figure 3 provides conceptual representation of our methods, such as the domain and mesh partitioning that is essential to the Pinned Mesh Perturbation method (Masterlark et al., 2012) that estimates the deformation source (pressurized magma chamber) location in this study. In this study, FEMs are constructed to solve for surface displacements and temperature over the problem domain. See Table 1 for the various FEM configurations in this work. The initial, elastically homogeneous model, HOM, is the FEM mesh of Okmok from which all subsequent models in this study are built. HET is an FEM that accounts for seismic tomography (three-dimensional material property distribution) data of Okmok and is used in estimation of the magma reservoir location. The thermal FEM in this study is used to define the outer boundary of the thermally-weakened viscoelastic rind surrounding the location-optimized magma reservoir from HET. VISCO is an FEM that is built using the material property distribution and mesh from the optimized HET model, with coupled elastic-viscoelastic material properties in the region surrounding the magma reservoir to account for thermal weakening as defined by the thermal model. VISCO is used to optimize the temperature-dependent viscosity in the viscoelastic rind. Once viscosity optimization is completed, a model representing Okmok’s thermomechanical behavior with a best-fit deformation source location is formed and is used to construct a magma reservoir pressurization history for Okmok volcano. A general overview of the modeling workflow established in this study is presented in Figure 4.
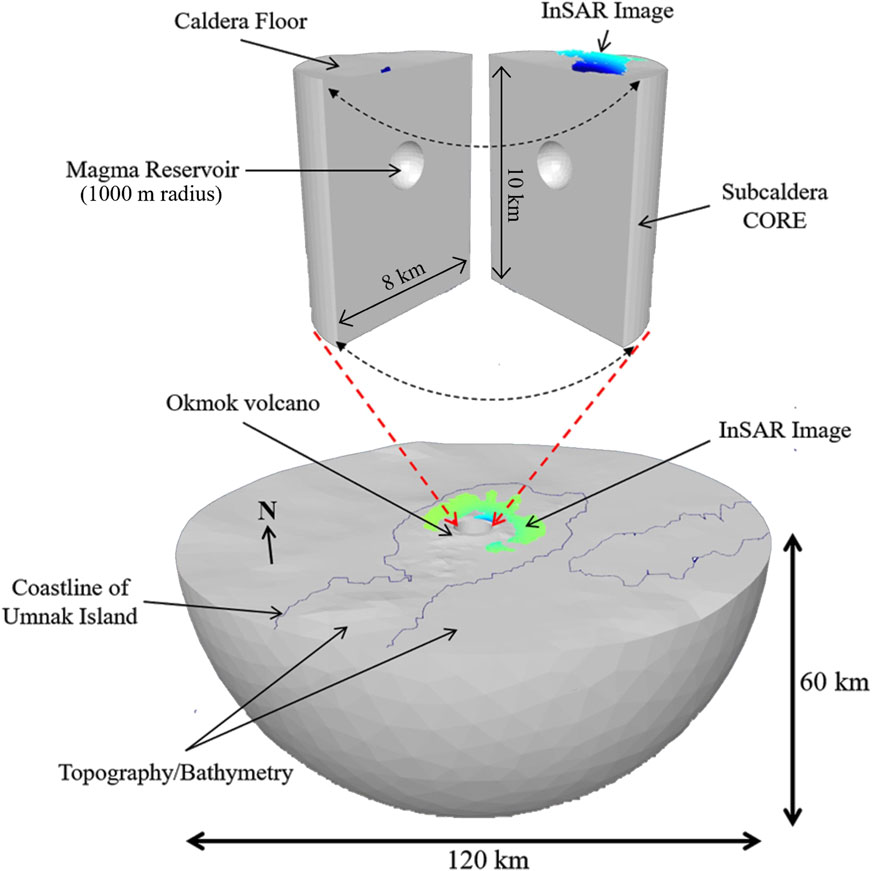
Figure 3. Conceptual representation of the hemispherical problem domain and methods used in this study. All models account for topography and bathymetry from digital elevation models on the free-surface (top) of the model. FEM-generated Green’s functions, or unit impulse responses, are calculated and used in inversion with respect to InSAR data. The far-field boundaries of the models have zero displacement boundary conditions that exceed the reach of the deformation resulting from magma intrusion, as later demonstrated by the validation analysis.

Table 1. FEM configuration specifications and associated references for each aspect.
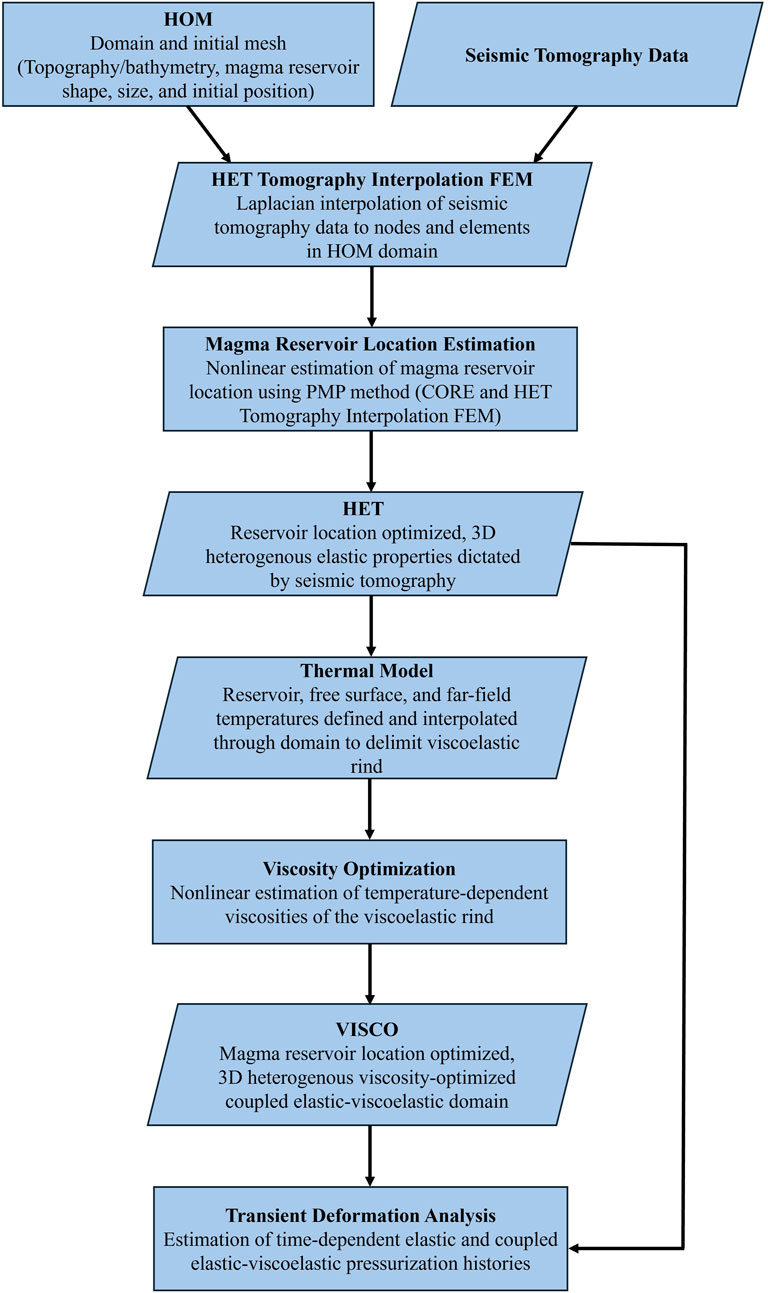
Figure 4. Flowchart describing the general workflow of this study. Each step and model used is described in greater detail throughout the text.
We apply pressure (ΔP) magma reservoir loading rather than prescribing a volume change (ΔV), as this approach avoids imposing specific wall displacements that are not directly constrained by observations. Pressure-driven loading aligns naturally with finite element methods and accommodates the uncertainty in how magma reservoirs actually deform, which depends on factors like magma compressibility and system connectivity. Using ΔP loading provides a flexible and physically grounded way to model deformation without assuming a specific magmatic plumbing structure.
2.3 Linear analysis of volcanic source pressurization
In this study, it is assumed that the net LOS displacement, uLOS, for the ith InSAR pixel is a linear combination of contributions from the pressurized magma chamber, plane-shift, and noise:
where PS is the unit impulse (ΔP0) multiplied by the scaling pressure; a, b, and c are the coefficients of a plane to account for horizontal displacement of the range gradients attributed to mismodeled orbital effects (Massonnet and Feigl, 1998); the superscript T denotes the matrix transpose operator. The matrix u is the displacement generated by PS applied to the magma reservoir, as calculated with an FEM. Row i of u is a three-component vector of predicted displacements for position i. This formulation has 4 linear parameters, and the forward model and matrix expression of Equation 1 is given in Equation 2:
where G is a matrix of Green’s functions; m is the parameter vector; d is a column vector of the InSAR data, having corresponding pixel locations given by column vectors x and y; 1 is a column unity vector. All least squares optimizations in this study linearized the problem by randomly sampling the location of the magma reservoir or viscous material properties surrounding the magma reservoir, and solving for linear parameters, PS, a, b, and c for each sample of magma chamber location or viscosities. The least squares linear inverse solution for Equation 2 is
First, initial values and bounds on the nonlinear parameter space are specified. A random sample of the nonlinear parameters is obtained using this initial value as the mean of a normal distribution with the standard deviation (controls search width) selected to provide adequate sampling of the parameter space. For each random sample of the set of parameters, error and SSE is calculated between model predicted displacements and displacement data. In this study, 500 samples of the parameter space are taken 10 times, and the set of parameter values resulting in the lowest error (in the current set of 500 samples or otherwise) are set as the mean (center) of the sampling distribution for the following set of samples, or adaptation. Each successive adaptation has a decreased search distribution standard deviation, resulting in quick convergence to a solution and resistance to local error minima traps. Once MCMC sampling is complete and the best-fit parameter values are found, we use F tests to calculate confidence intervals for each parameter. Each nonlinear, MCMC-based optimization performed here is described in greater detail in the corresponding section.
2.4 Homogenous and heterogenous model configurations
The first step is constructing a suitable FEM mesh for Okmok. This initial mesh approximates a 60,000 m radius hemisphere with the top of the model having an irregular surface defined by topography and bathymetry data from digital elevation models (Figure 3). This stress-free surface represents the Earth’s surface. The far-field boundaries of the model are seeded with elements with a size of ∼6,000 m and have zero-displacement boundary conditions on all far-field nodes to effectively approximate zero displacement at infinity. The spherical magma reservoir is initially centered at model coordinates (0, 0, −3,500 m), seeded with elements with a size of ∼150 m along the surface of a pressurized cavity that represents the magma reservoir. Elements near the magma reservoir are much smaller than those at the far-field boundaries to adequately approximate larger deformation gradients near the deformation source. In order to validate the initial FEM mesh used in this study, a separate, purely elastic FEM with the identical domain bounds and seeding specifications as HOM, excluding surface topography and bathymetry (flat free surface) is created. Material properties in this validation model are homogeneous throughout the domain and are consistent with the material properties and geometric configuration that are input into a Mogi (1958) (Mogi, 1958) model used to validate the FEM mesh.
To account for the real-Earth complexities surrounding Okmok, we construct an FEM of Okmok that honors seismic tomography data for use in the estimation of the magma reservoir location that is carried forward in all subsequent analyses. The distribution of material properties in this study is estimated from ANT data from Masterlark et al. (2010). The inclusion of a realistic distribution of material properties, such as elastic properties obtained from seismic tomography, more accurately modulates how magma reservoir pressurization translates to surface deformation and results in a more accurate estimated deformation source location for Okmok volcano (Masterlark et al., 2012). HET inherits the domain mesh from HOM. Seismic tomography data are propagated over the domain via Nearest Neighbor (NN) interpolation which maps each tomography data point to the nearest node in the FEM (being careful not to assign more than one tomography value to an element). Once the NN interpolation is complete, Laplacian interpolation is used to populate the entire domain since the tomography data occupy a smaller spatial extent than the FEM. First, the tomography data are converted from wave velocity to Young’s moduli (E) (Menke, 2012), and the centroid of each tomographic cell is mapped to the nearest-neighbor node of the FEM as a Dirichlet boundary condition. The far-field edges of the FEM are assigned material property boundary conditions based on wave velocity values from the initial layered model used to build the tomographic model in Masterlark et al. (2010). Using the tomography data as boundary conditions in the model allows Laplacian interpolation to be performed over the model domain to estimate material properties at all nodes in the model. These nodal calculations are then interpolated to element centroid locations, giving a distribution of E over the domain. We assume constant representative values for density (2,900 kg/m3) and Poisson’s ratio (0.29) for the bulk of the domain (Jaeger et al., 2007). The shallow LVZ within the caldera is assigned a density of 2,400 kg/m3 and a Poisson’s ratio of 0.15 to account for the weak and fluid-saturated materials (Wang, 2000) as suggested by previous studies (Masterlark et al., 2016; Masterlark et al., 2012; Lu et al., 2005; Larsen et al., 2009; Johnson et al., 2010).
The governing equations of elastic materials used in this study, expressed in index notation for a heterogeneous and isotropic material using Einstein summation are given in Equation 3:
where G is shear modulus; u is displacement; x is a spatial component of coordinate frame x; λ is Lame’s parameter; δ is the Kronecker delta; and indices i and j span the three orthogonal spatial coordinates 1, 2, and 3. Here, the subscript k implies summation over i and j, and x1, x2, and x3 are equivalent to Cartesian coordinates, x, y, and z.
2.5 Nonlinear estimation of volcanic source location
The location for the center of a spherical magma reservoir (the deformation source) must be estimated once a realistic material property distribution has been ingested into the model. To estimate magma reservoir position, the Pinned Mesh Perturbation (PMP) method is used (Masterlark et al., 2012). The PMP method uses an auxiliary FEM to perform geometric perturbations to the initial FEM mesh. The auxiliary FEM, called CORE, is obtained as a portion of the initial model and has zero displacement boundary conditions on all edges of the FEM (pinned) and the magma reservoir within CORE has non-zero displacement (perturbation) specifications (see Figure 5). In this study, a bounding, maximum magnitude of perturbation of 1,000 m from the original position of the magma reservoir is imposed to maintain validity of the FEM mesh. The PMP method used in this study is described in detail in the Supplementary Material.
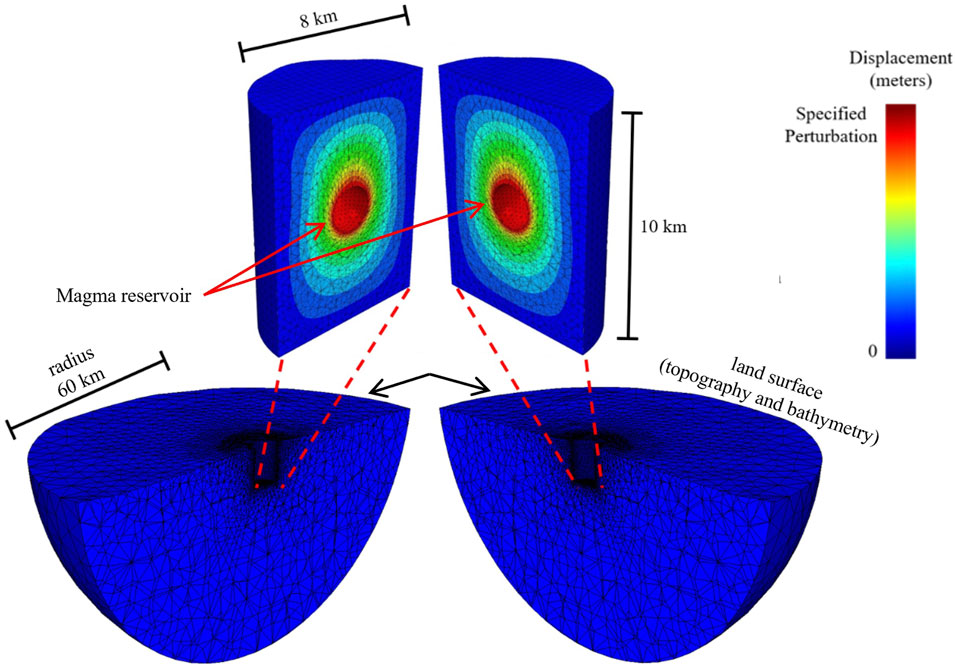
Figure 5. Diagram of a perturbation to the position of the magma reservoir in the PMP method used to estimate deformation source location. This exploded view reveals the optimal shift in the magma chamber location from the location in HOM. There is zero displacement along the walls of the sub-caldera CORE that houses the magma chamber within HET, a key aspect of the PMP method.
2.6 Thermal model for rheologic partitioning
Once the best-fit magma reservoir location is estimated, a thermal model is constructed to be consistent with the expected thermal regime of Okmok and define the edge the viscoelastic rind (brittle-ductile transition; Figure 6). This thermal model has the same mesh as the best-fit model found from the PMP method. This thermal model has the following specifications: the land surface has a specified temperature of 0°C, and there is no heat flux along the far field boundary of the model. The temperature of the magma reservoir wall is 1,015°C, the estimated minimum magma temperature suggested by Press et al. (2007). The Moho is placed at a depth of 30 km with a fixed temperature of 600°C based on regional thermal models (Winter, 2001). The far field boundaries of the model have an estimated temperature distribution (geothermal gradient) calculated from steady-state heat flow modeling of the domain with the prior specifications and a zero source term as given by Equation 4:
where T is temperature. This thermal model is used to define the region of the coupled elastic-viscoelastic model with viscoelastic material properties. The 750°C isotherm surrounding the magma reservoir is used to define the edge of the viscoelastic rind, as this isotherm represents the brittle-ductile transition for diabase at approximately 3–5 km depth (Hirth et al., 1998; Winter, 2001). Elements in the model mesh that lie outside of the 750°C isotherm are set to behave elastically, while elements that are enveloped by the isotherm behaved viscoelastically.
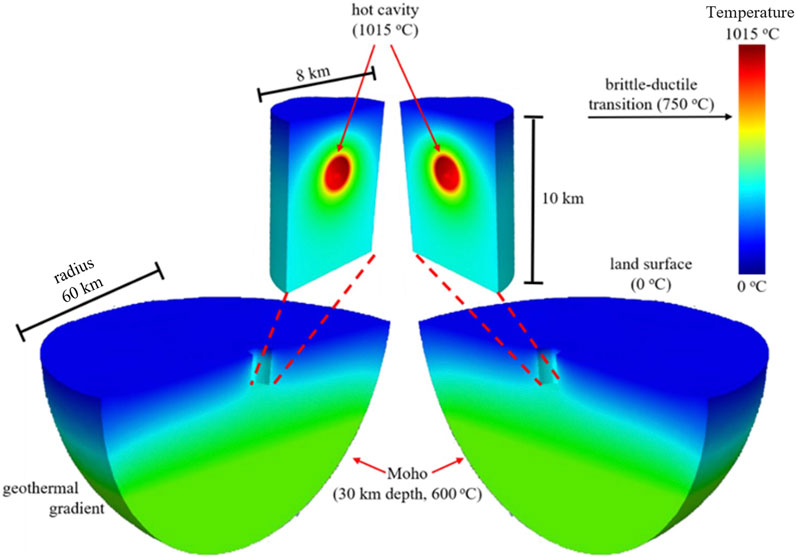
Figure 6. A rendering of the thermal model generated by the magma chamber within Okmok Volcano, Alaska, and the configuration in Table 1.
2.7 Viscosity optimization and transient deformation analysis
To date, very little work has been done to calibrate the temperature-dependent rheologic properties of an active volcano and leverage the inherent time dependence in deformation analyses to better understand pre-eruption inflation and post-eruption magma recharge. The novel transient deformation analysis developed here closes this gap. This novel method first requires the temperature-dependent viscosity of the thermally-weakened viscoelastic rind (determined by thermal model) to be optimized. The model with optimized deformation source location superimposed with optimized viscoelastic rind properties is referred to as VISCO. VISCO represents the entire viscoelastic rind as 5 partitions surrounding the hot magma reservoir in the model. Each of these partitions has viscosity optimized using the 1997 co-eruptive InSAR image (Temporal Index 11) as the calibration targets. A full description of this model is provided in Supplementary Material. The viscoelastic properties of rocks surrounding active magma chambers remain poorly constrained, and current models are necessarily theoretical. We adopt Maxwell viscoelasticity as a simple yet effective framework that captures essential time-dependent stress relaxation without introducing speculative rheological complexity. While Maxwell materials can exhibit unbounded deformation under sustained loading, this is not a concern here due to the wide far-field model boundaries and the relatively short volcanic timescales of interest, especially considering the low viscosities expected surrounding the magma reservoir. This approach balances physical realism with computational efficiency and follows established practice in volcanic deformation modeling.
Once the optimized, coupled elastic-viscoelastic model is generated through PMP and the viscosities of the viscoelastic rind are calibrated, transient deformation is analyzed for both a purely elastic (HET) and coupled elastic-viscoelastic (VISCO) case. The investigation here used a library of transient deformation Green’s functions caused by a 1 MPa pressurization of the spherical reservoir in the calibrated HET and VISCO models, with displacements calculated in 10-day increments for the duration of the magma reservoir pressurization history (from the beginning of the first InSAR image to the end of the last). This novel algorithm is described in full here, and a generalized flowchart of the transient deformation analysis is given in Figure 7.
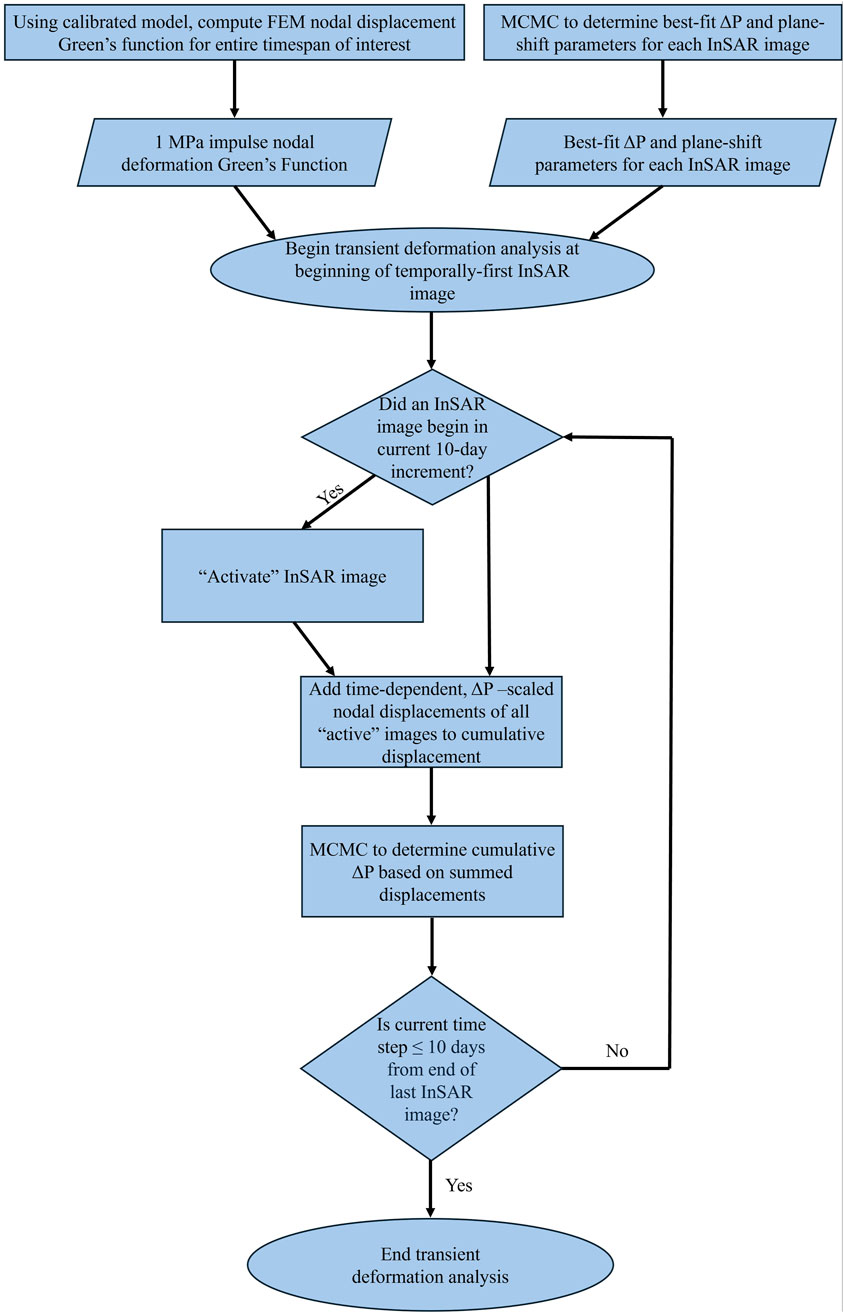
Figure 7. Flowchart describing the general steps of the transient deformation analysis method introduced here. This process applies to both the static elastic (HET) and coupled elastic-viscoelastic (VISCO) analyses described in this work.
First, all InSAR images to be used in the analysis (Supplementary Table S1; Figure 2) are individually run through an MCMC-based linear inversion algorithm to determine best-fit pressurization and plane-shift parameters (with associated uncertainties) relative to the calibrated models HET and VISCO. To do this, the Green’s function matrix of FEM-generated nodal displacements that represents the same duration as the InSAR image being analyzed is multiplied by an MCMC-generated random number that represents a sample magnitude of pressurization. If the InSAR image did not span the 1997 eruption interval, the MCMC sample pressurization is forced to be a positive value, with the sampling distribution initially being centered around P = 0. The enforcement of positivity in samples of pressurization eliminates the need for regularization to stabilize the transient pressurization history. If the InSAR image spanned the 1997 eruption interval, the MCMC sample pressurization is allowed to be positive or negative. The physical interpretation of these assumptions is that magma supply is depleted during eruptions and re-generated in post-eruption intervals. The resulting error matrix is then calculated by taking displacements that were interpolated to the InSAR image pixels from the original, unwrapped InSAR image and subtracting them from the InSAR image being analyzed. This error matrix represented error that is explained by neglecting the plane-shift parameters of the image, so plane-shift parameters are then solved for using linear inverse methods. Then, SSE is calculated for the MCMC sample of pressurization. The SSE value obtained after plane-shift removal represents the error that cannot be explained by either pressurization or plane-shift parameters. This cycle of MCMC sampling repeated for a total of 10 adaptations of 500 samples on each InSAR image being used, with the cooling schedule of the pressurization search being the exponential schedule given in Supplementary Material and the initial mean of the search distribution being P = 0 MPa for all except the co-eruption InSAR image. For the co-eruption image, the initial mean of the pressurization search is set to the best-fit pressurization value for HET or VISCO, depending on if the elastic (HET) or viscoelastic (VISCO) time series is being calculated. The value of σ0 is set to 100 MPa regardless of being the co-eruption image or not. Through this sampling method, pressurization uncertainties are calculated for each InSAR image. After the InSAR images had pressurization and plane-shift parameters estimated, a matrix of FEM-generated nodal displacement Green’s functions is scaled by the best-fit pressurization for that image relative to both the HET- and VISCO-predicted pressurization values. Plane-shift parameters are not used to scale the nodal displacement Green’s functions because they are a property of InSAR images used to reconcile orbital uncertainties with InSAR displacement data, and do not apply to purely FEM-based LOS nodal displacement-based pressurization estimates.
Once all relevant InSAR images are analyzed and scaled nodal displacement Green’s function matrices are created, transient addition of predicted nodal displacements is performed by taking advantage of the linearity of Maxwell viscoelasticity and applying linear superposition (Massonnet and Feigl, 1998), as follows. This analysis iterated through time from the beginning of the temporally first beginning of InSAR image acquisition to the end of the temporally last end of InSAR image acquisition dates in steps of 10 days. During each 10-day period, we check to see if an InSAR image began during those 10 days. If an InSAR image did start within those 10 days, the corresponding scaled nodal displacement Green’s function is deemed “active”. The now active, scaled Green’s function is truncated based on the number of 10-day time steps that have occurred since the image started, and these summed displacement values are added to any other active, truncated nodal displacement Green’s functions. These model-calculated, summed displacements are then used in an MCMC analysis of 10 adaptations of 500 samples to determine the best-fit pressurization of the magma reservoir relative to the current magnitude of the summed nodal displacements for the current time step. The cooling schedule of this pressurization search is the exponential cooling schedule given in Supplementary Material, with σ0 = 100 MPa and the initial search distribution center (mean) is the best-fit pressurization value for HET or VISCO (depending on elastic or viscoelastic time series analysis) for the co-eruption image and 0 MPa for all other images. This method of stepping through time and adding pressure-scaled nodal displacements is identical in both the HET- and VISCO-based analysis of transient deformation. Once the pressurization histories are calculated for both HET and VISCO, the pressurization magnitudes and SSE for each InSAR image are compared via F tests to check for significant differences between the HET- and VISCO-based pressurization estimates and their corresponding errors.
3 Results
3.1 Mesh validation
When validation FEM displacement results are compared to displacement results obtained from the analytical solution of Mogi (1958), it can be graphically seen that results are nearly identical (Supplementary Figure S1 in the Supplementary Material). The SSE of the validation FEM relative to the analytical model is 3.51 × 10⁻⁷ m2 and 5.34 × 10⁻⁷ m2 for the radial and vertical predictions of deformation, respectively. The average prediction error for the radial component of deformation is ∼1.24 × 10⁻⁵ m and the average prediction error for the vertical component of deformation is ∼1.15 × 10⁻⁵ m. Residuals between the FEM and analytical solution are less than 2.5% of the total deformation signal for both radial and vertical components of deformation predicted by the analytical model, indicating that the FEM is doing a suitable job of approximating the governing equations over the finite domain configuration and that the mesh is valid.
3.2 Deformation source location estimation
The best-fit magma reservoir location discovered from integrating the PMP method in MCMC analysis of the 1997 co-eruption InSAR image of Okmok relative to the origin given in Table 1 is:
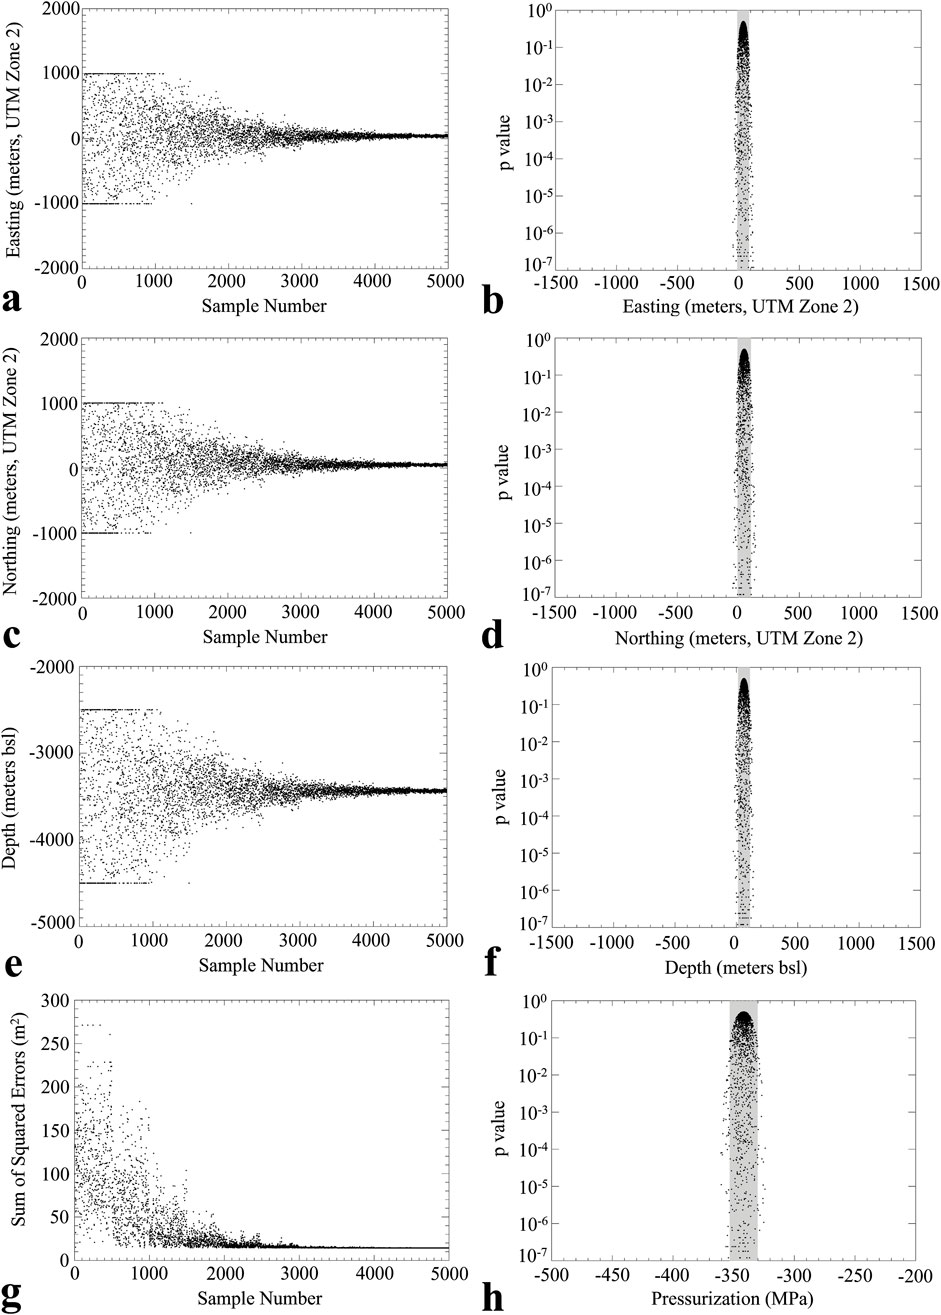
Figure 8. HET model MCMC parameter convergence and PDFs. Each black dot represents results from a MC sampling for a single suite of parameters. (a) Convergence of the x-coordinate (easting) and (b) the corresponding MCMC-calculated PDF. (c) Convergence of the y-coordinate (northing) and (d) the corresponding MCMC-calculated PDF. (e) Convergence of the z-coordinate (depth in meters bsl) and (f) the corresponding MCMC-calculated PDF. (g) Convergence of SSE to a minimum value through the MCMC-based PMP implementation used in this study. (h) PDF of the HET-generated co-eruption pressurization estimate. Grey regions in PDFs denote the 95% confidence intervals.
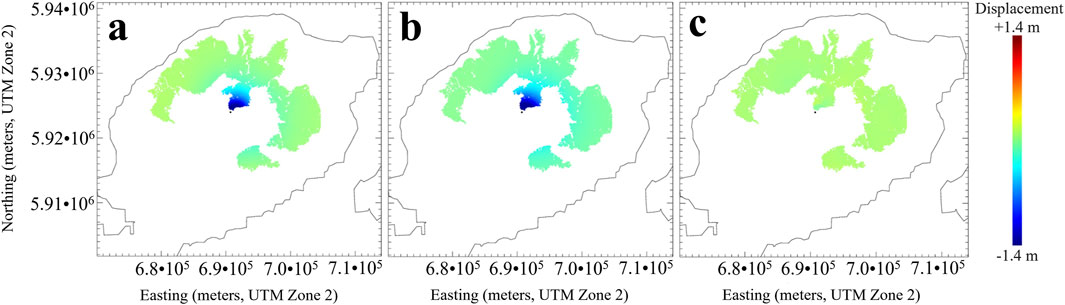
Figure 9. (a) The 1997 co-eruption InSAR image of Okmok volcano (Temporal Index 11 in Supplementary Table S1; Figure 2); (b) best-fit, HET-predicted model predicted ground deformation; (c) prediction error between InSAR-observed ground deformation and best-fit HET model simulated ground deformation. The coastline of Umnak Island is contoured in each image for spatial context. The black dot in the central region of the images is the coordinate origin for this study.
3.3 Viscosity optimization
The best fit viscosities found through MCMC analysis of five concentric partitions of the viscoelastic rind, from farthest from the magma reservoir to nearest to the magma reservoir (Viscosities 1–5; see Supplementary Material), respectively are estimated to be:
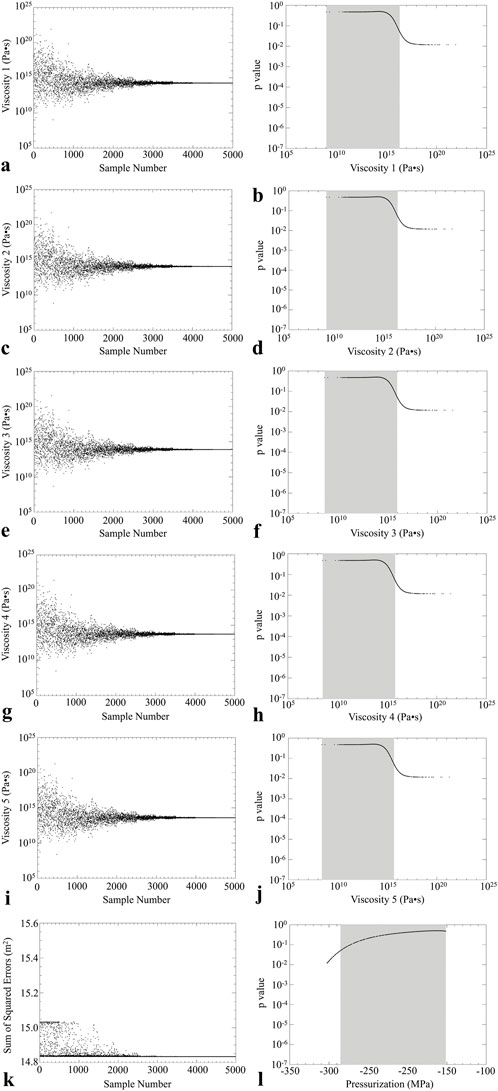
Figure 10. VISCO model MCMC parameter convergence and PDFs. Each black dot represents results from a MC sampling for a single suite of parameters. (a) Convergence of Viscosity 1 and (b) the corresponding MCMC-calculated PDF. (c) Convergence of Viscosity 2 and (d) the corresponding MCMC-calculated PDF. (e) Convergence of Viscosity 3 and (f) the corresponding MCMC-calculated PDF. (g) Convergence of Viscosity 4 and (h) the corresponding MCMC-calculated PDF. (i) Convergence of Viscosity 5 and (j) the corresponding MCMC-calculated PDF. (k) Convergence of SSE to a minimum value through the MCMC-based viscosity optimization used in this study. (l) PDF of the VISCO-generated co-eruption pressurization estimate. Grey regions in PDFs denote the 95% confidence intervals.
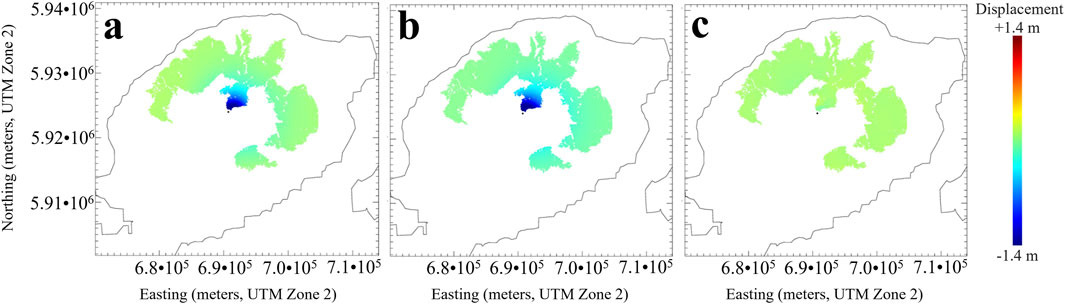
Figure 11. (a) The 1997 co-eruption InSAR image of Okmok volcano (Temporal Index 11 in Supplementary Table S1; Figure 2); (b) best-fit, VISCO-predicted model predicted ground deformation; (c) Prediction error between InSAR-observed ground deformation and best-fit VISCO model simulated ground deformation. The coastline of Umnak Island is contoured in each image for context. The black dot in the central region of the images is the coordinate origin for this study.
3.4 Transient deformation analysis
The best-fit pressurization, SSE, and uncertainties, relative to HET (purely elastic) and VISCO (coupled elastic-viscoelastic) for each of the InSAR images used in this study are provided in Supplementary Tables S3, S4, respectively. F tests comparing the pressurizations estimated and given in Supplementary Table S3 (HET) and Supplementary Table S4 (VISCO) give p = 1.58 × 10⁻⁴, and the F tests of the SSEs in Supplementary Tables S3, S4 give p = 0.33. The purely elastic model of Okmok, HET, is subjected to the same transient deformation analysis as the coupled elastic-viscoelastic model, VISCO. Results of the transient deformation analysis using HET can be seen in Figure 11, and the results of the same analysis using VISCO can be seen in Figure 12. Figure 13 shows a comparison of the pressurization histories obtained from HET and VISCO.
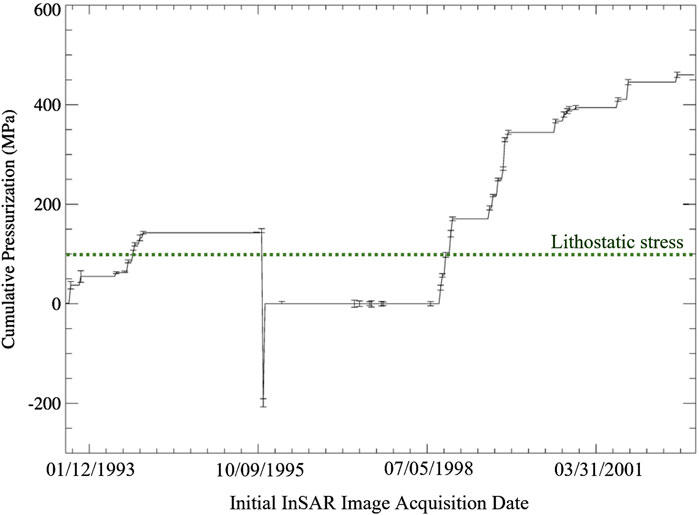
Figure 12. Pressurization history of Okmok volcano constructed using the static elastic deformation signature obtained from the calibrated purely elastic model, HET. 95% error bars are shown for the pressurization estimates of each InSAR image obtained through a HET-based MCMC analysis. Note that pressurization changes over the entire InSAR image are plotted to at the date of the initial InSAR image acquisition (see Figure 2). Because of this, the 1997 co-eruption depressurization is plotted at the initial acquisition date of Image ID 11 in Supplementary Table S1 and Figure 2, well before the 1997 eruption activity began. Lithostatic stress at the depth of the best-fit magma reservoir centroid is given by a green dotted line.
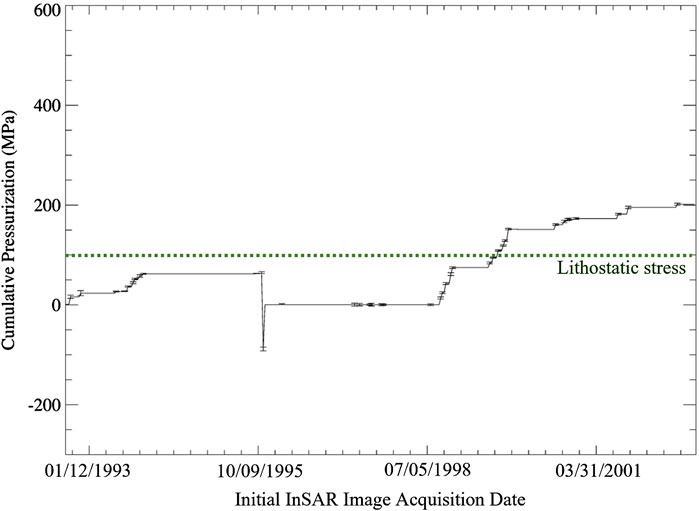
Figure 13. Pressurization history of Okmok volcano constructed using the transient, viscoelastic deformation signature obtained from the calibrated, coupled elastic-viscoelastic model, VISCO. 95% error bars are shown for the pressurization estimates of each InSAR image obtained through a VISCO-based MCMC analysis. Note that pressurization changes over the entire InSAR image are plotted to at the date of the initial InSAR image acquisition (see Figure 2). Because of this, the 1997 co-eruption depressurization is plotted at the initial acquisition date of Image ID 11 in Supplementary Table S1 and Figure 2, well before the 1997 eruption activity began. Lithostatic stress at the depth of the best-fit magma reservoir centroid is given by a green dotted line.
4 Discussion
The best-fit location for the magma reservoir determined in this study is in good agreement (within a couple of hundred meters at most) with the results of previous studies of Okmok volcano that account for the distribution of elastic material properties imaged by seismic tomography (Masterlark et al., 2016; Masterlark et al., 2012). For comparison, Lu et al. (2005) used Mogi (1958) deformation models to analyze these same InSAR images. Results differed from those of this study in three different ways. First, the HEHS configuration of Lu et al. (2005) (Lu et al., 2005) estimated magma chamber depths are considerably shallower than estimated depths of this study. This difference is explained by the HEHS vs. HET domain configurations (Masterlark et al., 2016; Masterlark et al., 2012). Second, we represent the magma system in terms of dynamics (pressure), rather than kinematics (volume). This allows us to interpret results within the framework of lithostatic constraints (Figures 11, 12). Third, these analyses allows for more refined time dependent behavior with Δt = 10 days versus the annual-scale time steps that better characterizes the timing of the InSAR pair acquisitions.
We combine the optimized location of the deformation source and viscoelastic rind characteristics to better understand the impact of rheology on both the geometric and loading parameters of a volcanic system. It should be noted that both the HET and VISCO pressurizations often exceed lithostatic constraints, which is unrealistic but a common and noted issue in volcano deformation modeling studies (analytical and FEM-based). The best-fit temperature-dependent viscosities found by performing MCMC analysis on the 5 concentric partitions of the viscoelastic rind and corresponding pressurization estimates are poorly constrained with uncertainty estimates spanning orders of magnitude. However, viscosities within the range of 109 Pa∙s and 1015 Pa∙s resulted in nearly identical deformation signatures in a pressure-loaded volcanic setting. This implies that the time-dependent viscoelastic relaxation is similar across these ranges and that above ∼109 Pa∙s (for this study), the stress is relaxed sufficiently quickly to nullify any time dependence on rheology over the span of the co-eruption InSAR image the viscosities were optimized to. It should also be noted that the data tend towards a low viscosity as opposed to a very high viscosity. The time constants for Maxwell viscoelastic relaxation calculated using the best-fit viscosity and average Young’s modulus for each partition of the viscoelastic rind are small in magnitude, and hence, the stress in the viscoelastic rind induced by magma migration, viewed here as changes in pressurization, relax more quickly than a system with relatively higher viscosity. Masterlark et al. (2010) investigated the rheologic properties of Okmok volcano using an unoptimized magma reservoir location based on seismic tomography data and used a mass flux loading strategy. While the magma reservoir location and loading strategies between this study and that of Masterlark et al. (2010) vary and that study failed to quantify uncertainties of the viscosity of the rheologically partitioned domain (hence results are not directly comparable), their estimates lie well within the confidence interval for viscosities obtained in this study. The work presented here is limited to 5 different values of viscosity in the viscoelastic rind based on the median temperature of each partition; future models should base viscoelastic material properties on an element-by-element basis for increased model fidelity to the actual system at an active volcano. However, this suggested higher spatial resolution will likely generate more uncertainty unless the system is regularized via a Bayesian MC sampling strategy. In order to obtain a better understanding of why these viscosities are so highly uncertain, another InSAR image with a different duration and a high signal-to-noise ratio, such as an InSAR image spanning the 2008 co-eruption interval of Okmok, could be used in a similar analysis.
The MCMC method used to stochastically determine the best-fit pressurization of each InSAR image used in this study showed that a model that incorporates rheologic partitioning consistently required a lower magnitude of pressurization to achieve the same amount of deformation as a purely elastic system (see Supplementary Tables S3, S4), with a significant difference found between the HET and VISCO pressurization histories via F tests (p = 1.58 × 10⁻⁴). The SSE and uncertainties of HET and VISCO for each InSAR image are quite similar (p = 0.33), but the viscoelastic system (VISCO, Supplementary Table S4) tended to have slightly lower error than the elastic system (HET, Supplementary Table S3). The transient deformation analyses performed using a HET-based Green’s function and a VISCO-based Green’s function revealed very similar patterns in their estimated pressurization history for Okmok. The low viscosities of the viscoelastic rind in VISCO gave rise to a rapid relaxation of stresses in the rind, and as such, the lag in deformation through time caused by magma intrusion in the viscoelastic system is barely present as ongoing deformation ceased quickly. In a higher viscosity system, the lag would be more exaggerated since the induced stresses will relax more slowly. The seemingly flat appearance of the viscoelastic pressurization history in Figure 12 is a result of these short relaxation times. This signals that Okmok has a sufficiently hot and persistent magma reservoir, causing the hosting countryrock to be weaked significantly (low viscosities).
The resulting nearly static nature of the viscoelastic deformation model, explained by the short relaxation times caused by low viscosities, implies that if the relaxation times are much shorter than the time spanned by the InSAR images being analyzed, it is possible to approximate the viscoelastic transient deformation by scaling the results from the elastic transient deformation analysis by a constant such as the ratio of the co-eruption VISCO-predicted magma reservoir pressurization to the HET-predicted, elastic co-eruption reservoir pressurization. In this study, many of the pressurization values obtained from both elastic and viscoelastic transient deformation analyses have the same ratio as the co-eruption pressurization values for HET and VISCO (∼0.48). This factor is used to scale the elastic pressurization history, as illustrated in Figure 13. The good fit of the scaled elastic pressurization history to the viscoelastic pressurization history indicates that, with the assumption of low viscosities in the region surrounding the magma reservoir, it is possible to estimate the viscoelastic pressurization history from the elastic pressurization history by scaling by the ratio of pressurization estimates for one InSAR image as predicted by elastic and coupled elastic-viscoelastic models. This eliminates the need for the relatively complex transient deformation analysis presented here. It should be noted that the ratio of 0.48 may not be unique to the case presented here. Future studies of viscoelastic volcano deformation should consider characterizing the relationship between the pressurization magnitudes of their respective viscoelastic and elastic deformation models to determine appropriate scaling. If the viscosities estimated through a viscosity optimization algorithm, such as the one performed here, are high enough, scaling the elastic pressurization history by a constant to estimate the coupled elastic-viscoelastic pressurization history is discouraged, as relaxation times for higher viscosity materials are much longer and the nature of deformation will have a stronger time dependency when compared to transient deformation of a system with low viscosities. During the accumulation of pressure in the magma reservoir following the 1997 eruption of Okmok, the scaled elastic history deviates from the VISCO-predicted pressurization history (Figure 13), indicating that the time-dependence of the viscoelastic model is important during this large inflation episode.
5 Conclusion
The novel methods presented here allow the combination of nonlinear inverse methods with the advanced capabilities of FEMs to simulate complex, three-dimensional deformation systems with arbitrary geometries (e.g., topography/bathymetry) and distributions of material properties. Specifically, the first-of-their-kind FEM-based methods here satisfy the primary objectives of this study, which are to investigate the impact of rheologic partitioning (e.g., viscoelastic rind) on the magnitude and pattern of magma reservoir pressurization history (e.g., Figures 12–14), giving insights into magma budget and magma supply dynamics.
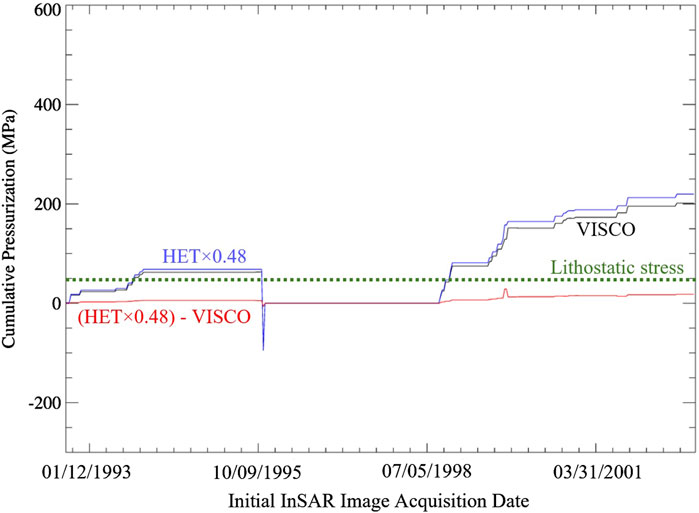
Figure 14. Pressurization history comparison. The black curve represents the pressurization history of Okmok volcano constructed using the transient, viscoelastic deformation signature obtained from the calibrated, coupled elastic-viscoelastic model, VISCO. The blue curve represents the pressurization history obtained from HET scaled by the ratio of VISCO-predicted co-eruption pressurization to HET-predicted co-eruption pressurization (∼0.48). The red curve represents the difference in the scaled pressurization history (blue) curve and the VISCO-predicted pressurization history (black) curve. Note that pressurization changes over the entire InSAR image are plotted to at the date of the initial InSAR image acquisition (see Figure 2). Because of this, the 1997 co-eruption depressurization is plotted at the initial acquisition date of Image ID 11 in Supplementary Table S1 and Figure 2, well before the 1997 eruption activity began. Lithostatic stress at the depth of the best-fit magma reservoir centroid is given by a green dotted line.
We confirm that thermal loading from an active magma reservoir generates a spatial distribution of rheologic properties at Okmok volcano through integration of site-specific petrologic and thermal information into a thermal model of Okmok. This thermal model accounted for best-fit magma reservoir location determined through the PMP method. In this thermal model, the brittle-ductile transition temperature defined the boundaries of viscoelastic and elastic material properties in the model (the viscoelastic rind).
This study also showed that rheologic structure controls how an injection impulse of magma translates to the surface deformation response in space and time (e.g., sensitivity to order of magnitude differences in viscosity shown graphically in Figure 10). In the case of a coupled elastic-viscoelastic system, a lower magnitude of pressurization is required to achieve the same amount of deformation as a static elastic system with a similar (generally lower) error. Here, the stresses induced by magma migration relaxed very quickly due to low viscosities in the viscoelastic rind. With relatively higher magnitudes of viscosity, the time-dependence of deformation on rheologic structure would become more pronounced, but given enough time, low- and high-viscosity systems would achieve the same amount of deformation. However, in this work, the data favored lower viscosities (Figure 11) which makes intuitive sense given the high temperatures involved and the basaltic composition of the Okmok system.
The results obtained in this work also showed that the time-dependent magma budget is a function of rheologic structure (e.g., Figure 14). This can be seen through comparison of the pressurization histories of HET and VISCO in Figures 11–13. In the elastic system of HET (Figure 11), it is seen that much higher magnitudes of magma reservoir pressurization are required to provide a nearly identical fit (Supplementary Tables S3, S4) to InSAR data when compared to a rheologically partitioned system, VISCO (Figure 12). Through the creation, analysis, and optimization of elastic and coupled elastic-viscoelastic volcano deformation models, it was seen that magma budget inferences can be highly influenced by the rheologic structure of the volcanic system, as elastic pressurization estimates are nearly double the pressurization estimates of a coupled elastic-viscoelastic system.
This study also revealed that with the assumption of low viscosities in the viscoelastic rind surrounding the magma reservoir, it is possible to scale the elastic pressurization estimates by a constant to estimate the viscoelastic pressurization history. Invoking the assumption of a suitably low viscosity eliminates the need for complex, transient deformation analysis and allows for estimates of pressurization for all the InSAR images being analyzed to be performed using only the purely elastic model. It should also be noted that during large inflation episodes, the time-dependence introduced through incorporating viscoelasticity becomes important and scaled elastic models will not account for this time-dependence.
It is proposed that future analyses of deformation at Okmok volcano, Alaska include forward and inverse models that simultaneously optimize magma reservoir location and viscosity of the rheologically partitioned domain using more advanced thermal models that account for sophisticated thermal processes such as magma mixing and convection within the magma reservoir, as calculated using thermally-driven computational fluid dynamics models. Further, investigation of mineral zoning may give insight into magma migration history at Okmok volcano and would allow for comparison of the transient deformation analysis performed here and the information gained from a mineral zoning analysis. Note that the analysis method presented here solely used a pressurization loading mechanism when a mass flux loading strategy should also be investigated using the same methods given in this study to better understand magma supply dynamics at Okmok volcano.
Data availability statement
The datasets presented in this study can be found in online repositories. The names of the repository/repositories and accession number(s) can be found below: 10.5281/zenodo.13823716, 10.5281/zenodo.13823739, 10.5281/zenodo.13823753.
Author contributions
JL-F: Data curation, Software, Writing – original draft, Investigation, Visualization, Formal Analysis, Conceptualization, Writing – review and editing, Methodology. ST: Writing – review and editing, Investigation, Writing – original draft, Methodology, Visualization, Software, Data curation, Conceptualization, Formal Analysis. TD: Formal Analysis, Visualization, Software, Writing – review and editing, Methodology. TM: Visualization, Formal Analysis, Project administration, Resources, Methodology, Writing – review and editing, Supervision, Software, Writing – original draft, Conceptualization.
Funding
The author(s) declare that financial support was received for the research and/or publication of this article. This material is based upon work supporting TM in part by the National Science Foundation under Grant No. 2136809 and NASA Earth Surface and Interior 16-ESI16-0037. The work of ST was partially supported by NSF award #2326785, NSF sub-award #S001463 and SCEC award #24192.
Acknowledgments
There is no real or perceived conflict of interest for any author relevant to the work presented here. Special thanks are given to Gokce Ustunisik for her thoughtful discussions on petrology and how magmatic systems are interpreted from a geochemical perspective that helped guide this work and ensured fidelity of the models developed here to realistic thermal/geochemical systems.
Conflict of interest
The authors declare that the research was conducted in the absence of any commercial or financial relationships that could be construed as a potential conflict of interest.
Generative AI statement
The author(s) declare that no Generative AI was used in the creation of this manuscript.
Publisher’s note
All claims expressed in this article are solely those of the authors and do not necessarily represent those of their affiliated organizations, or those of the publisher, the editors and the reviewers. Any product that may be evaluated in this article, or claim that may be made by its manufacturer, is not guaranteed or endorsed by the publisher.
Supplementary material
The Supplementary Material for this article can be found online at: https://www.frontiersin.org/articles/10.3389/feart.2025.1630931/full#supplementary-material
References
Abaqus (2012). Version 6.12, unified FEA. Vélizy-Villacoublay, France: Dassault Systèmes Simulia. Available online at: www.3ds.com.
Begét, J. E., Larsen, J. F., Neal, C. A., Nye, C. J., and Schaefer, J. R. (2005). Preliminary volcano-hazard assessment for Okmok volcano, Umnak island, Alaska, DGGS rep. of invest., 2004-3. Anchorage: Alaska Dep. of Nat. Resour., 32.
Burgisser, A. (2005). Physical volcanology of the 2,050 BP caldera-forming eruption of Okmok volcano, Alaska. Bull. Volcanol. 67, 497–525. doi:10.1007/s00445-004-0391-5
Cayol, V., and Coronet, F. H. (1998). Effects of topography on the interpretation of the deformation field of prominent volcanoes—application to Etna. Geophys. Res. Lett. 25 (11), 1979–1982. doi:10.1029/98GL51512
Christensen, N. I. (1996). Poisson’s ratio and crustal seismology. J. Geophys. Res. 101, 3139–3156. doi:10.1029/95JB03446
Courant, R. (1943). Variational methods for the solution of problems of equilibrium and vibrations. Bull. Am. Math. Soc. 49, 1–23. doi:10.1201/b16924-2
Del Negro, C., Currenti, G., and Scandura, D. (2009). Temperature-dependent viscoelastic modeling of ground deformation: application to Etna volcano during the 1993–1997 inflation period. Phys. Earth Planet. Interiors 172, 299–309. doi:10.1016/j.pepi.2008.10.019
Dhondt, G., and Wittig, K. (2015). “CalculiX,” in Version 2.8. Available online at: www.calculix.de/.
Dieterich, J. H., and Decker, R. W. (1975). Finite element modeling of surface deformation associated with volcanism. J. Geophys. Res. 80, 4094–4102. doi:10.1029/JB080i029p04094
Finney, B., Turner, S., Hawkesworth, C., Larsen, J., Nye, C., Grorge, R., et al. (2008). Magmatic differentiation at an island-arc caldera: Okmok volcano, Aleutian islands, Alaska. J. Petrology 49 (5), 857–884. doi:10.1093/petrology/egn008
Hirth, G., Escartin, J., and Lin, J. (1998). “Rheology of the lower oceanic crust: implications for lithospheric deformation at mid-ocean ridges,” in Faulting and magmatism at mid-ocean ridges. Editor W. R. Buck (Washington, D. C: AGU), 106, 291–303.
IDL (2012). “Exelis visual information solutions,” in Version 8.2.2. Available online at: www.exelisvis.com.
Izbekov, P. F., Larsen, J., and Gardner, J. (2005). Petrological and experimental constraints on the recent magma plumbing system at Okmok Volcano, Alaska, USA. AGU Fall Meet. Abstr.
Jaeger, J. C., Cook, N. G. W., and Zimmerman, R. W. (2007). Fundamentals of rock mechanics. 4th edn. Malden, Mass: Blackwell, 475.
Johnson, J. H., Prejean, S., Savage, M. K., and Townend, J. (2010). Anisotropy, repeating earthquakes, and seismicity associated with the 2008 eruption of Okmok volcano, Alaska. J. Geophys. Res. 115, B00B04. doi:10.1029/2009JB006991
Larsen, J. F., Neal, C. A., Schaefer, J. R., Beget, J. E., and Nye, C. J. (2007). “Late pleistocene and holocene caldera-forming eruptions of Okmok caldera, aleutian islands, Alaska,” in Volcanism and subduction: the Kamchatka region. Editors E. G. J. Eichelberger, P. Izbekov, M. Kasahara, and J. Lees, 343–363.
Larsen, J., Neal, C., Webley, P., Freymueller, J., Haney, M., McNutt, S., et al. (2009). Eruption of Alaska volcano breaks historic pattern. Eos Trans. AGU 90, 173–174. doi:10.1029/2009EO200001
Larsen, J. F., Śliwiński, M. G., Nye, C., Cameron, C., and Schaefer, J. R. (2013). The 2008 eruption of Okmok Volcano, Alaska: petrological and geochemical constraints on the subsurface magma plumbing system. J. Volcanol. Geotherm. Res. 264, 85–106. doi:10.1016/j.jvolgeores.2013.07.003
Lu, Z., Mann, D., Freymueller, J. T., and Meyer, D. J. (2000). Synthetic aperture radar interferometry of Okmok volcano, Alaska: radar observations. J. Geophys. Res. 105 (10), 10791–10806. doi:10.1029/2000JB900034
Lu, Z., Fielding, E., Patrick, M. R., and Trautwein, C. M. (2003). Estimating lava volume by precision combination of multiple baseline spaceborne and airborne interferometric synthetic aperture radar: the 1997 eruption of Okmok volcano, Alaska. IEEE Trans. Geosci. Remote Sens. 41, 1428–1436.
Lu, Z., Masterlark, T., and Dzurisin, D. (2005). Interferometric synthetic aperture radar study of Okmok volcano, Alaska, 1992–2003: magma supply dynamics and postemplacement lava flow deformation. J. Geophys. Res. 110. doi:10.1029/2004JB003148
Manconi, A., Walter, T. R., Manzo, M., Zeni, G., Tizzani, P., Sansosti, E., et al. (2010). On the effects of 3-D mechanical heterogeneities at Campi Flegrei caldera, southern Italy. J. Geophys. Res. 115, B08405. doi:10.1029/2009JB007099
Mann, D., Freymueller, J., and Lu, Z. (2002). Deformation associated with the 1997 eruption of Okmok volcano, Alaska. J. Geophys. Res. 107 (B4), 2072. doi:10.1029/2001JB000163
Massonnet, D., and Feigl, K. (1998). Radar interferometry and its application to changes in the Earth’s surface. Rev. Geophys. 36, 441–500. doi:10.1029/97RG03139
Masterlark, T. (2007). Magma intrusion and deformation predictions: sensitivities to the Mogi assumptions. J. Geophys. Res. 112. doi:10.1029/2006JB004860
Masterlark, T., Haney, M., Dickinson, H., Fournier, T., and Searcy, C. (2010). Rheologic and structural controls on the deformation of Okmok volcano, Alaska: FEMS, InSAR and ambient noise tomography. J. Geophys. Res. 115. doi:10.1029/2009JB006324
Masterlark, T., Feigl, K. L., Haney, M. M., Stone, J., Thurber, C. H., and Ronchin, E. (2012). Nonlinear estimation of geometric parameters in FEMs of volcano deformation: integrating tomography models and geodetic data for Okmok volcano, Alaska. J. Geophys. Res. 117. doi:10.1029/2011JB008811
Masterlark, T., Donovan, T., Feigl, K. L., Haney, M., Thurber, C., and Tung, S. (2016). Volcano deformation source parameters estimated from InSAR: sensitivities to uncertainties in seismic tomography. J. Geophys. Res. 121, 3002–3016. doi:10.1002/2015JB012656
Masterlark, T., and Tung, S. (2018). “Numerical models of volcano deformation,” in Volcanoes. Editor G. Aiello (London, United Kingdom: Intech Open Access books), 153–173.
Miller, T. P., McGimsey, R. G., Richter, D. H., Riehle, J. R., Nye, C. J., Yount, M. E., et al. (1998). Catalog of the historically active volcanoes of Alaksa. U.S. Geol. Surv. Open File Rep. 98-582, 104.
Mogi, K. (1958). Relations between the eruptions of various volcanoes and the deformations of the ground surface around them. Bull. Earthq. Res. Inst. Univ. Tokyo 36, 99–134.
Newman, A. V., Dixon, T. H., and Gourmelen, N. (2006). A four-dimensional viscoelastic deformation model for Long Valley Caldera, California, between 1995 and 2000. J. Volcanol. Geotherm. Res. 150, 244–269. doi:10.1016/j.jvolgeores.2005.07.017
NOAA (2019). National centers for environmental information. Available online at: http://www.ngdc.noaa.gov.
Okada, Y. (1992). Internal deformation due to shear and tensile faults in a half-space. Bull. Seismol. Soc. Am. 82, 1018–1040. doi:10.1785/bssa0820021018
W. H. Press, S. A. Teukolsky, W. T. Vetterling, and B. P. Flannery (2007). Numerical recipes: the art of scientific computing. 3rd ed. (New York: Cambridge University Press), 1235.
Python Software Foundation (2010). “Python language reference,” in Version 2.7. Available online at: www.python.org.
Trasatti, E., Giunchi, C., and Bonafede, M. (2003). Effects of topography and rheological layering on ground deformation in volcanic regions. J. Volcanol. Geotherm. Res. 122, 89–110. doi:10.1016/s0377-0273(02)00473-0
Wang, H. F. (2000). Theory of linear poroelasticity: with applications to geomechanics. Princeton, N. J: Princeton Univ. Press, 287.
Winter, J. D. (2001). An introduction to igneous and metamorphic petrology. Englewood Cliffs, N. J: Prentice Hall, 697.
Keywords: volcano deformation, pressurization, viscoelastic, finite element models, transient deformation, InSAR
Citation: Long-Fox JM, Tung S, Donovan T and Masterlark T (2025) Rheology-dependent magma reservoir pressurization history constrained by the deformation cycle of Okmok volcano, Alaska. Front. Earth Sci. 13:1630931. doi: 10.3389/feart.2025.1630931
Received: 18 May 2025; Accepted: 28 July 2025;
Published: 13 August 2025.
Edited by:
Nibir Mandal, Jadavpur University, IndiaReviewed by:
Madison Myers, Montana State University, United StatesAmelia A. Bain, University of Edinburgh, United Kingdom
Copyright © 2025 Long-Fox, Tung, Donovan and Masterlark. This is an open-access article distributed under the terms of the Creative Commons Attribution License (CC BY). The use, distribution or reproduction in other forums is permitted, provided the original author(s) and the copyright owner(s) are credited and that the original publication in this journal is cited, in accordance with accepted academic practice. No use, distribution or reproduction is permitted which does not comply with these terms.
*Correspondence: Jared M. Long-Fox, amFyZWQubG9uZy1mb3hAdWNmLmVkdQ==; Timothy Masterlark, bWFzdGVybGFya0BzZHNtdC5lZHU=