 G. A. Córdoba
 A. Costa
 D. M. Rodriguez
 J-C. Thouret
 R. A. Criollo
 D. A. Guerrero1,4
- 1Grupo de Investigación en Riesgos, Amenazas y Medio Ambiente GRAMA, Universidad de Nariño, Department of Engineering, Pasto, Colombia
- 2Istituto Nazionale di Geofisica e Vulcanologia (INGV), Sezione di Bologna, Rome, Italy
- 3Université Clermont- Auvergne, Laboratoire Magmas et Volcans, Centre National de la Recherche Scientifique, Observatoire de Physique du Globe de Clermont-Ferrand, Institut de Recherche pour le Développement, Aubière, France
- 4Consejo Superior de Investigaciones Científicas, Ministerio de Ciencia e Innovación, Madrid, Spain
Volcanic activity can cause severe damage to buildings, transport networks, ecosystems, and critical infrastructure, making quantitative approaches that integrate hazard, exposure, and vulnerability essential for informed decision-making. This study introduces the Volcanic Risk Metric (VRM), a systematic framework for volcanic risk quantification, aligned with the National Guide for Risk Analysis and the Sendai Framework for Disaster Risk Reduction, and applies it to La Florida Municipality, Colombia, part of which lies within the high-hazard zone of Galeras Volcano. Probabilistic hazard curves were generated for each pixel of a digital elevation model and combined with vulnerability curves tailored to buildings, road networks, and ecosystems. For each hazard–asset pair, a risk curve was calculated and multiplied by the replacement cost of the asset to estimate expected physical loss. By identifying, for each pixel, the maximum risk value among all hazards, an integrated volcanic risk map was developed, highlighting zones of greatest expected loss, particularly in areas with dense infrastructure and population within the volcano’s high-hazard zone. This map provides valuable information for planning, mitigation, and emergency response in La Florida Municipality, and the VRM approach is transferable to other volcanic regions, offering a practical tool for risk-informed land-use planning and enhancing disaster resilience.
1 Introduction
Galeras volcano, one of the world’s most active volcanoes, located in southern Colombia, experienced a 1989-1994 eruptive cycle that led to successive official versions of volcanic hazard maps (Cepeda, 1990; Hurtado and Cortéz, 1997) to mitigate the risk to nearby communities. However, communication breakdowns, contradictory authorities, and other complexities (Sheridan and Cordoba, 2010) resulted in challenging social issues. Over 8,000 people reside in the “high hazard volcanic zone” (ZAVA in Spanish), declared a disaster area in 2005, prompting a relocation decision. Despite various factors, including communication and socio-economic disparities, the relocation of all at-risk people has been hindered (Delgado, 2018). Currently, the risk management of Galeras volcano’s influence area focuses solely on volcanic hazard, deviating from the United Nations’ recommendation for a risk analysis (UNISDR, 2015; 2017). Given the low efficiency of hazard-based decisions, the Colombian Constitutional Court ordered municipalities and the National Risk Management Office to develop a Risk Management Plan based on a detailed Risk Analysis (Corte Constitucional, 2015). A Risk Analysis for the entire Galeras volcano influence area was conducted and published in 2022 (Ingeniar, 2022). However, a Risk Management Plan based on a detailed risk analysis has not been proposed yet. The current Plan (UNGRD, 206) is based on the fourth version of the hazard zoning instead of the risk, and hazard is presented semi-qualitatively.
In 2017, the Municipality of La Florida, Nariño, Colombia, and Universidad de Nariño collaborated to provide a quantitative risk analysis. This analysis assessed risk levels for exposed elements within the municipality, considering volcanic risk of buildings, road networks, ecosystem services, and crops. The exposed elements at risk of the ecosystem that provides benefits to humans within the municipality are limited in this study to forest, pasture and crops. This paper presents a method for a quantitative probabilistic volcanic risk analysis applied to La Florida. We focus on physical risk, though recent studies have explored integrating hazard, exposure, vulnerability, and resilience in volcanic environments (e.g., Aspinall and Blong, 2015; Bonadonna et al., 2021; Guimaraes et al., 2021; Nieto-Torres et al., 2021). Most of these works focus on resilience concepts like coping capacity, which are beyond the scope of this study.
As reported by Birkmann (2013), the term ‘risk’ is defined differently by various disciplines. In natural hazard and disaster risk reduction research, risk is the result of the interaction of a hazard and the vulnerability of the system or element exposed, including the probability of the hazard occurrence. However, the United Nations Office for Disaster Risk Reduction defines risk as the potential loss of life, injury, or damaged assets that could occur to a system, society, or community in a specific period, determined probabilistically as a function of hazard, exposure, vulnerability, and capacity. See Supplementary Definitions SM1 in the Supplementary Material for the definitions of technical terms used in the text.
This paper aims to assess the physical risk of individual buildings, road network and ecosystem services due to volcanic hazards, focusing on a municipality near Galeras volcano. A quantitative probabilistic risk analysis is the best approach to cope with uncertainties, such as geological and historical records, physics, and model limitations. To improve the sampling from geological records, computer-generated events can be used. As (UNDRR, 2023) states, risk management involves preparing and scoping, conducting risk analysis, and using results for disaster risk reduction and decision-making. Since the first and third stages are beyond the scope, we focus on the ‘physical’ risk assessment. The paper organizes as follows: in Section 2 we describe the geological and geomorphological setting of Galeras volcano; in Section 3 we present the used methods for: probabilistic volcanic hazards assessment (3.1); determining exposure and vulnerability of elements at risk (3.2); and the integration of hazards, exposure, and vulnerability for risk assessment (3.3); in Section 4 we discuss the results obtained for the hazards related to each volcanic phenomenon (4.1), those for exposure and vulnerability of the elements present in the study area (4.2), and finally the results of the risk assessment for buildings, road network, and ecosystem services (4.3). A flowchart of the applied methodology is shown in the Supplementary Figure SF1. Conclusively, in Section 5 we discuss the results obtained from both hazards and risks analyses, highlighting that the adopted approach has broader relevance beyond the case of Galeras, offering insights applicable to volcanic regions such as Montserrat, Sakurajima, Nevado del Ruiz, and others worldwide. By addressing the integration of risk analysis into land-use planning and decision-making, and by balancing geological and historical data with probabilistic approaches, our results contribute to improving risk management strategies across a range of volcanic settings with varying eruptive behaviours and hazards.
2 Geological and geomorphological setting
2.1 Galeras volcano
The zone of study is on the slopes of Galeras volcano, which is located in South America, Colombia country (1° 13′43.8″North and 77° 21′33.0″West), Figure 1a, with its summit at 4,276 m above sea level. It is a dominantly andesitic stratovolcano with a large breached caldera located immediately west of the city of Pasto and one of Colombia’s most frequently active volcanoes (Smithsonian Institution, 2017). Galeras volcano is part of the Galeras Volcanic Complex (Calvache, 1995; Calvache et al., 1997), which has shown several eruptive stages, the last one corresponds to Galeras volcano edifice. A few published articles suggest that the most recent Galeras volcano stage has an age of about 4,500-5,000 years (Calvache, 1990; 1995; Calvache et al., 1997). Nevertheless, recent studies performed by the Colombian Geological Survey have shown that the most recent Galeras volcano Stage has an age of less that 900 years (Pulgarín et al., 2024). According to Smithsonian Institution (2023) Galeras volcano experienced 36 confirmed Holocene eruptive periods and the main eruptions with their VEI are summarized in the Supplementary Table ST1. Sandri et al. (2021), collating data from the Colombian Geological Survey and the Smithsonian Institution, observed a trend of events clustering into six eruptive cycles since 1820. They were able to define an inter-cluster mean return time of about 36 years.
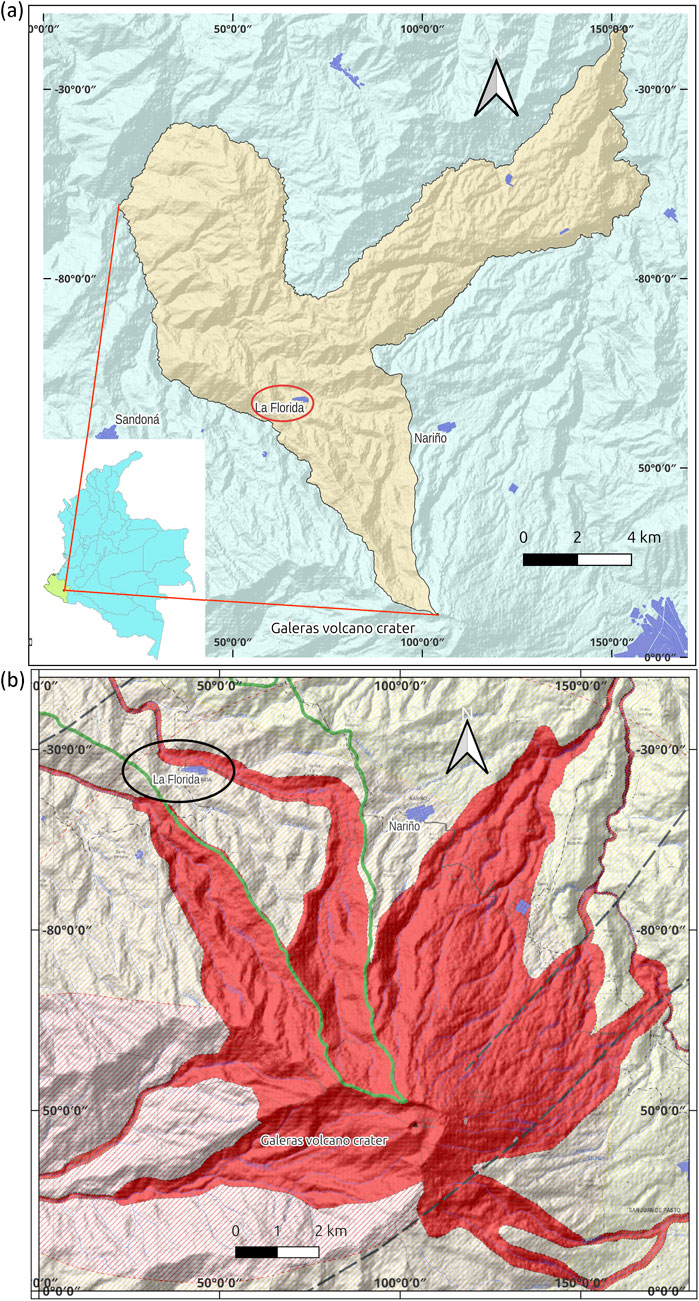
Figure 1. (a) Location of La Florida Municipality. Galeras volcano crater is shown at the bottom. (b) Galeras volcano hazard-zone Map. Scale: 1:30.000. The location of La Florida town has been highlighted by a bold ellipse. The blue dashed line shows the Barranco river catchment divide line. The main fault system is shown. After SGC (2015).
2.2 Galeras volcano hazards
From different types of deposits that have been identified at Galeras volcano including tephra-fall, lava, pyroclastic density current (PDC), debris-avalanche, and lahar deposits (Calvache, 1990; Calvache and Williams, 1992; Banks et al., 1997; Calvache et al., 1997), and the shock wave hazard historical evidence (Espinosa, 2012; Cepeda, 2020), the Colombian Geological Survey developed the Third version of the “Galeras volcano Hazard Map” (Hurtado and Cortéz, 1997; Ingeominas, 1997), which was adjusted in 2015. The 2015 hazard map (Figure 1b shows the high hazard zone in red) was inferred mainly by PDC deposits.
2.3 La Florida municipality geological and geomorphological setting
The La Florida municipality, about
Additionally, interviews done during this research project with local people reported that shock waves from the eruption of the 2 January 2010 (Ingeominas, 2010) affected a few houses located toward the top of that basin by opening doors and breaking glass, showing the importance of this hazard in this geomorphological context (see Ingeominas, 1997 as well). Geological records of Galeras volcano point to few low-runout lava flows in North-East direction of very viscous lavas originated from fissures of the crater from the 1866 eruption. None of the records, however, show lava flows within the Barranco river basin (see details on Galeras volcano lava flows in Calvache (1990); Hurtado and Cortéz (1997); Banks et al. (1997)).
3 Methods and data
In order to quantify the risk to which the municipality of La Florida is exposed to, probabilistic hazard assessment has been performed, which was later combined with the vulnerability to obtain the Specific Risk (Rs) (Ortiz, 1996; Llinares et al., 2004; van Westen, 2011), see Supplementary Definitions SM1 in the Supplementary Material, through Equation 1, which yields a number between 0 and 1. The Physical Risk (
In Equation 1 H is the probabilistic hazard, E is the exposure of the elements, V is the vulnerability of the exposed elements, while in Equation 2 C accounts for the cost of the assets and capacity.
The Total Risk can be obtained by the physical risk (
Equation 3 defines Total Risk through the aggravating factor F. In this way, the Total Risk assessment becomes probabilistic as well, accounting for a probabilistic approach to the hazard.
In the following subsections we explain the methods used to assess the hazard, exposure, vulnerability, and finally risk.
3.1 Volcanic hazards
Here we present the methods used for probabilistic hazard assessment for each of the main volcanic hazards of Galeras volcano, namely, Tephra-Fall (TF), Ballistics (Ba), Pyroclastic Density Currents (PDC), Lahars (Lh) and Shock Waves (ShW).
For such an assessment we adopt a Bayesian methodology. To illustrate this, as one can see in Supplementary Figure SF3, considering the locations A and B, they can be impacted by a hazardous phenomenon only if the event was generated at the source O. This means that the events are not independent. In terms of conditional probability (Dekking et al., 2005; Gut, 2013) the probability of both A or B and O (
The same for
On the other hand, it may happen that a location A can be reached from more than one source (for example, sources S1 and S2 in the Supplementary Figure SF3), as high energetic mass flows, like PDCs and sometimes even lahars, can surmount topographic barriers (Valentine, 1987; Andrews and Manga, 2011; Hinton et al., 2019). In order to account for that possibility we use a Bayesian approach (Ferson, 2005; Link and Barker, 2010; Ding and Liu, 2012) to estimate the probability of an event occurring based on a combination of prior knowledge and new information. This method uses the Bayes theorem shown in Equation 5:
where P(Si|A) is the posterior probability of the hypothesis of (Si) given the observed data at (A). This represents the updated probability of the hypothesis based on the new evidence. By manipulating Equation 5 we obtain the probability that the flow affects A given that a flow originates in any source Si.
Probabilistic hazard assessment combines geological data, recorded eruptive history, sampling, and simulations of potential volcanic hazards. Computer simulations of hazardous gravity-driven flows are run over a GeoSAR Digital Elevation Model with 3-m pixels. Recorded distance, magnitude/frequency, and impact of hazards constrain input data ranges, assessing all possible initial combinations. However, each hazard has unique initial conditions and uncertainties. For probabilistic purposes, a representative sampling of the infinite set of initial conditions is needed. The classic Monte Carlo (MC) method requires thousands of combinations, infeasible for modelling natural processes. We chose the stratified random Orthogonal Latin Hypercube Sampling (OLHS), which reduces sample requirements by at least 90% (Stein, 1987; Dalbey et al., 2008; Matala, 2008; Baalousha, 2009; Sheridan et al., 2010). Following Dalbey et al. (2008), we generated a minimum of 128 OLHS samples for each hazard, resulting in a sampling error of
The probabilistic hazard assessment is performed for the whole Galeras volcano area of influence for most the hazardous phenomena. However, the lahar assessment is restricted to the Barranco River across La Florida municipality only.
A summary of the eruptive scenario parameters and model input is reported in Supplementary Table ST3. The specific methodology for each volcanic hazard is as follows.
3.1.1 Tephra fallout
The probabilistic assessment of tephra fallout was carried out analysing the past events of the Galeras volcano and using the tephra dispersal model Hazmap (Macedonio et al., 2005; Sandri et al., 2016) for simulating the fallout of volcanic particles from a sustained eruptive column. To define the volcanological initial conditions (mainly fallout volume and column height) we used the code Parfit (Macedonio and Costa, 2014), which is a computational tool aimed to solve an inverse problem, to reconstruct the deposit data reported by the Colombian Geological Survey (Gomez, 2018) for the most recent events (1989-2012). The Total Grain Size Distribution (TGSD) was estimated from the characterization of eruptions of analogous volcanoes based on relationship of TGSD with magma viscosity and eruption intensity (Costa et al., 2016). To characterize meteorological variability, we used wind data from 1988 to 2016 obtained from the European Center of Medium-Range Weather Forecast (ECMWF) and compared them with those acquired by the Colombian National Institute of Hydrology and Meteorology (IDEAM) (http://dhime.ideam.gov.co/atencionciudadano/). See Supplementary Table ST3 for the eruptive scenario parameters and model input. Once the boundary and initial conditions and all the input parameters for the eruption scenarios were defined, the tephra transport model Hazmap (Macedonio et al., 2005; Macedonio and Costa, 2016) was used to simulate a statistical number of events in the probabilistic mode, covering also the meteorological variability.
3.1.2 Pyroclastic density currents (PDCs)
PDCs are gravity-driven flows resulting from the collapse and spreading of particle-laden mixtures from explosive volcanic eruptions (Dufek et al., 2015). We account for the basal and companion cloud parts of PDCs, as rare phenomena like column fountains and lateral blasts have not been observed in the Galeras volcano’s history (Calvache, 1990; Banks et al., 1997; Espinosa, 2012; Cepeda, 2020). The dense basal part of PDCs is modelled using Titan2D (Patra et al., 2005), which accurately predicts pyroclastic flow extent and runout (Patra et al., 2005; Sheridan et al., 2005; Galas et al., 2007; Capra et al., 2011; Ogburn and Calder, 2017). Titan2D has been used to model pyroclastic flows in Galeras volcano (García et al., 2011). The companion ash cloud is modelled with the Energy Cones method (Sheridan, 1980; Malin and Sheridan, 1982), but adapted from Ogburn and Calder (2017), who proposed a relationship H/L vs. Volumes (Vol) for companion clouds, where H is the height difference of the column (at which the collapse can happen) and the elevation of the topography intersected by the PDC downstream, Vol is the flow volume and L is the runout distance. We acknowledge the current debate on the limitations of the H/L-Vol relationship and the application of Titan2D for PDC modelling and associated epistemic uncertainty (Gueugneau et al., 2021; Aravena et al., 2022). As computational resources increase, more complete physics-based modelling, currently computationally prohibitive, can be adopted for PDC hazard assessments in the future.
TITAN2D requires the starting flow location, volume (collapse elevation), and friction factors. These factors are unknown and highly variable, posing significant uncertainties (García et al., 2011; Stefanescu et al., 2012). To address the latter, a random distribution of potential PDC origins was used, as in Stefanescu et al. (2012) (see Cordoba et al., 2024 for details). Geological studies of pyroclastic flows at Galeras volcano determined the ranges required by the OLHS sampling method. For instance, the location of flow initiation was limited by a ring whose maximum radius was defined based on the farthest limit of column collapses at Galeras volcano (Ingeominas, 1997; Gomez, 2018). Figure 2 shows the distribution of 640 sampled origins at a radial distance xo from the crater. The collapse altitude H was determined using the relationship H/xo = 3, proposed by Doyle et al. (2008), where xo is the radial distance from the crater to the flow starting point where the collapsing column intersects the upper slope of the summit caldera. The volume ranges were assessed based on previous studies by Calvache (1990), García et al. (2011). A minimum volume of
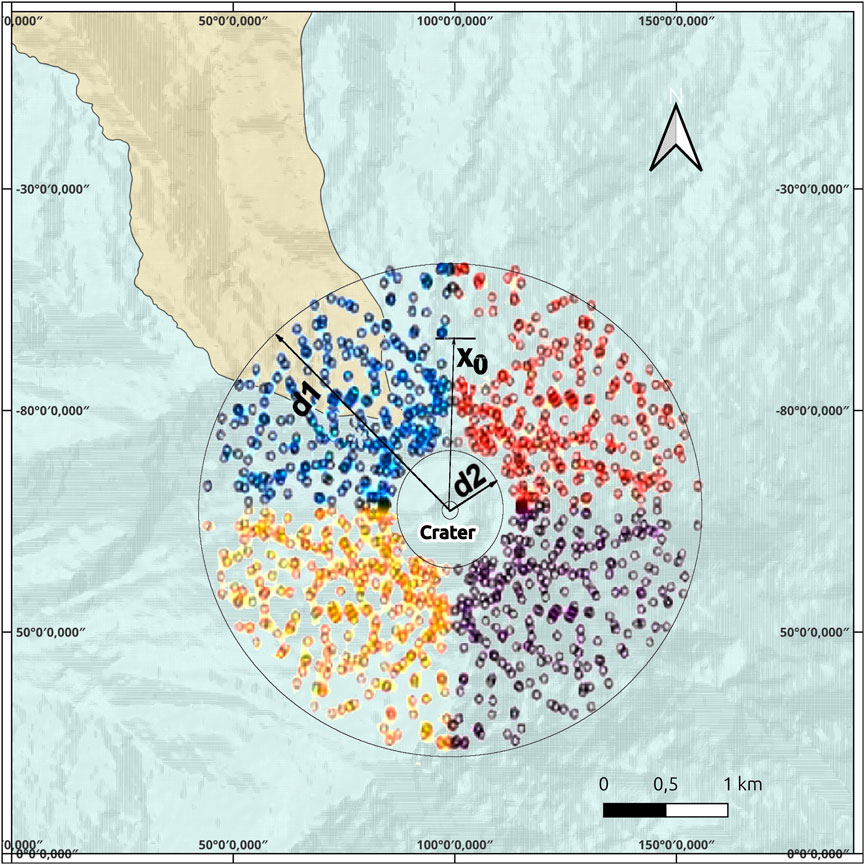
Figure 2. Ring where the OLHS samples of initial starting places of PDCs are located. The distance d1 is 1,200 m and d2 is 650 m. There are 4 quadrants and the inner circle, each one with 128 samples. The
3.1.3 Ballistics
Impact of ballistics was analysed by solving the classic ballistic equation system for different initial conditions and material proprieties (e.g., Alatorre-Ibargüengoitia et al., 2006; 2012). In particular the Matlab™ programming script by Connor (2015) was adapted to be used with the Octave mathematical programming package, together with the system of ballistic equations proposed by Alatorre-Ibargüengoitia et al. (2006). Instead of random shots from the crater, we discretized the initial conditions considering several trajectory lines each one separated by five degrees. Topographic profiles at each of the trajectory “lines” was projected. The uncertainties in initial conditions of the shooting at each trajectory line are related to the density and diameter of the ejected block, the angle of ejection, and its initial velocity. A statistically representative sampling for the potential combination of all of those initial conditions was performed through the OLHS sampling method. We use the ranges of initial conditions that fit the geological record of ballistics left by Galeras volcano from the eruptive cycles 1989-1994 and 2010-2018 (Hurtado and Cortéz, 1997). Frequency analysis allowed us to assess the probability of impacts with energies of interest (corresponding to overpressures ranging from 0.4 MPa to 6 MPa) according to the vulnerability analysis (Section 3.2). A summary of the model input is reported in Supplementary Table ST3.
3.1.4 Lahars
The bi-phase mixture of water and volcanic solids that constitutes a lahar has been modelled using the program Titan2F (Córdoba et al., 2018). In this case, the main unknown parameters are the starting location (x and y coordinates), the initial volume and the volumetric concentration of solids and of the flow. We assumed a fixed starting location placed in fixed coordinates at the main stream of the river, which results in an initial velocity uncertainty. Cautiously we assume the velocity ranges between zero and the velocity resulting in case that the flow starts at the very upper part of the basin. Following Iverson (1978)’s method, the maximum velocity resulted in about 11 m/s, which is typical and within the peak velocity range reported by Waythomas et al. (2013) and Muñoz-Salinas and Manea (2007) for lahars worldwide. As there are no studies of the lahar types generated at Galeras volcano, the range for volumetric solid concentrations θ is assumed to correspond to typical lahar concentrations, which range from θ = 0.2 for muddy flows to 0.5 for granular flows, respectively (Pierson, 1980; Helens and Pierson, 1985; Pierson and Scott, 1985; Sandri et al., 2024). The total volume depends on both the amount of available solid material and the amount of water supplied to the flow by the catchment. The amount of water corresponds to the maximum capability of the basin deduced from an hydrological analysis assuming a saturated condition for the soil, as in Guerrero et al. (2019). The total maximum water volume resulted in
As for the case of lahars, probabilities for different intensities (e.g., 0.1, 0.5, 1, 1.5, 2 m-deep flows) can be given at each pixel, resulting in intensity-probability curves for each hazardous phenomenon at each grid point. For instance, the Supplementary Figure SF3 illustrates the distribution of probabilities of a 0.5 m-deep lahar affecting the campus of the Universidad de Nariño, Colombia.
Concerning La Florida, Supplementary Figure SF5 shows intensity-probability curves for impacting lahars at two arbitrary locations in the Barranco river basin, which lies within the Municipality. The dots in Supplementary Figure SF5 are extracted from data layers for relevant intensities (e.g., lahar impacting dynamic pressures of 0.1, 5, 10, 15, 20, etc., kPa).
3.1.5 Shock waves
The main uncertain variable to assess the intensity-probability relationship is the initial release energy. As volcanic shock waves do not leave geological records, the range of such an initial energy needs to be assessed from historical data. The shock waves were modelled in 3D using the software package OpenFoam (Greenshields, 2017; Zicanov, 2019), which allows us to account for the three dimensional effects of topography on the supersonic wave. The criteria for the minimum overpressure has been inferred the initial overpressure capable of knocking down people in Consacá town, as reported by. In this case overpressure was estimated to be in the range of 10–15 kPa (Glasstone and Dolan, 1977). The maximum overpressure was inferred from the needed overpressure to break typical glass windows (3 mm thickness and 0.5
3.2 Exposure and vulnerability
Exposure involves the number of people and assets in an area at risk of a natural hazard event (Cardona et al., 2012; UNISDR, 2017). An inventory of exposed buildings and ecosystem services was conducted, along with a survey of the number of people living and using these buildings and official data (DANE, 2019). Buildings were grouped based on construction quality from a survey across La Florida Municipality.
The model assesses exposure (e.g., impact intensity, influenced by distance, angle, and topographic protections) by accounting for the impact on individual buildings (e.g., tephra-fall load, PDC dynamic pressure, lahar inundation depth, dynamic pressure) (Bonadonna et al., 2021; Nieto-Torres et al., 2021). For each building, the average number of inhabitants (3.6 persons for a typical house at La Florida Municipality) was considered, based on survey data and official databases (e.g., DANE, 2019).
In this work, the ‘Physical’ Risk (Equation 2) is assessed without considering systemic dimensions (accessibility, interdependency, etc.) or individual and social components (like in Sekajugo et al., 2024). This is a first step towards understanding downstream impacts on the population and environment (see UNISDR, 2017). Vulnerability is assessed using the Mean Damage Relationship (MDR) (Ghesquiere et al., 2006), which is the ratio between repair cost and replacement cost (Quan Luna et al., 2011; Ciurean et al., 2017). Thus, V lies between 0 (no need of repair) and 1 (repair cost equals replacement cost). MDR represents the percentage of expected damage due to a phenomenon of a certain intensity.
The expected level of damage from dynamic pressures exerted by impacting lahars, shock waves, and tephra fall load was assessed using methods like those of Valentine (1998), Spence et al. (2004), Zuccaro et al. (2008), Torres-Corredor et al. (2017). PDC impact was considered totally destructive (USGS, 2023). A ballistic impact of 106 J, corresponds to the energy needed to destroy a typical concrete roof (Ortiz, 1996; Alatorre-Ibargüengoitia et al., 2006; 2012; Williams et al., 2017), thus impacts exceeding 106 J is assumed as totally destructive. In the case of lahars, buildings can also be buried and damaged by hydrolithostatic pressure, which was accounted for by Quan-Luna et al. (2011).
To account for volcanic phenomena on La Florida municipality’s road network, a PDC impact is considered totally destructive, while a lahar impact of over 10 kPa and a tephra fall of over 20 cm are also considered totally damaging. Volcanic shock waves would not presumably affect the roads.
To assess the vulnerability of exposed buildings to volcanic phenomena, we surveyed 3,958 buildings in La Florida. Using survey data, we classified buildings into three types valid for the La Florida sector. This classification was based on local building characteristics, unlike general approaches like Prieto et al. (2018). Table 1 describes the categories and their characteristics. Official reports (DANE et al., 2024) provided average values for each type: Types I, II, and III cost about US$ 30,000, US$ 40,000, and US$ 50,000, respectively.
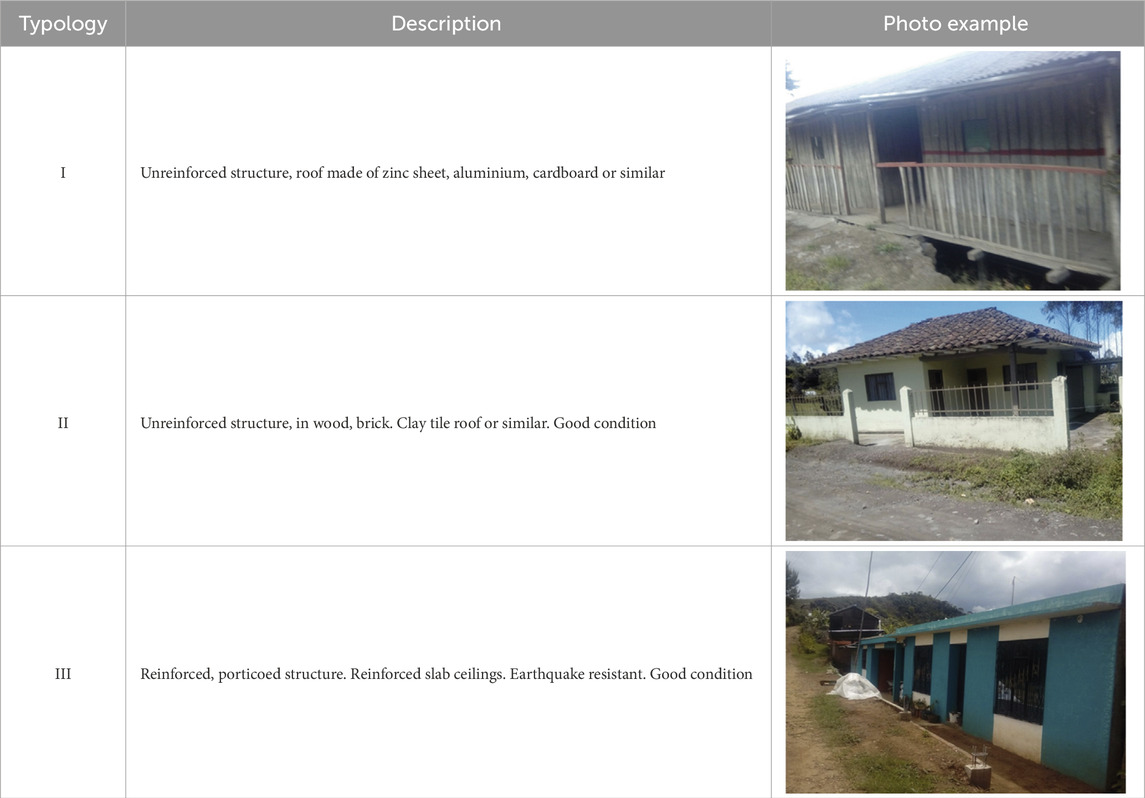
Table 1. Typology for the buildings surveyed in the municipality of La Florida. These types are valid for La Florida municipality only.
Damage vs intensity curves were built for each building type and hazard. Ecosystem service exposure is assessed by identifying and mapping the agronomic vocation of the soil and actual land use. Ballistics, PDCs, and lahars are assumed to be totally destructive. Tephra fallout thickness of 5 mm results in unproductive crops, while tephra-fall deposits thicker than 5 cm result in total crop loss. Shock waves do not affect ecosystem services presumably due to the expected maximum energy not being sufficient to destroy crops and forests.
3.3 Risk
3.3.1 Specific risk
Volcanic risk can be defined as the loss caused to a set of elements exposed with a given vulnerability during a certain period of exposure to a phenomenon of volcanic origin (see Equation 1). Using the obtained probabilistic hazard and vulnerability curves, the specific risk (van Westen, 2011) is obtained for each of the exposed elements according to its typology using the methodology proposed by. Figure 3 shows the probabilistic hazard curves together with the vulnerability curves whose multiplication leads to the specific risk curve for the respective exposed element.
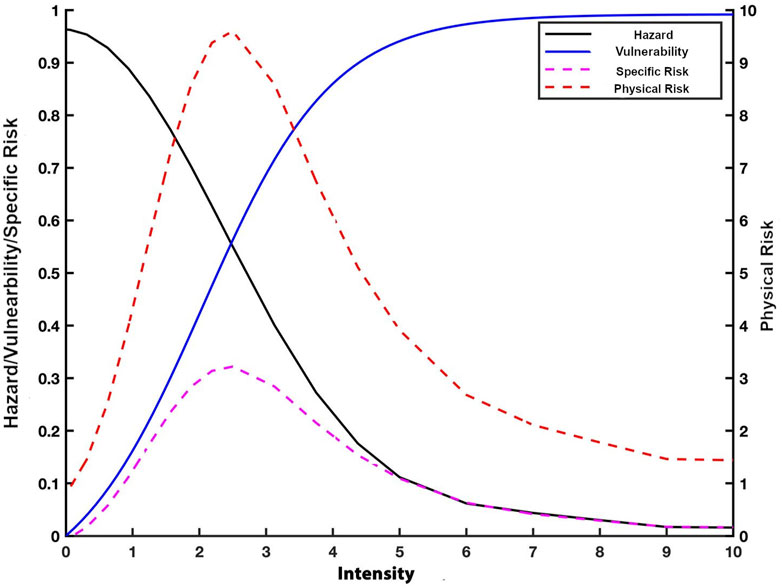
Figure 3. Schematic representation of typical curves of hazard, vulnerability, Specific and Physical Risk. The area under the curve of physical risk corresponds to the total expected losses. The shown scale for physical risk is arbitrary.
3.3.2 Physical risk
The Physical Risk is an important concept useful for a balanced and safe planning before for natural disasters. It is determined by accounting for all the expected losses, that are not only economic, but also social and cultural (Ramli et al., 2019). In this study, for practical purposes, we will consider only the physical risk according to Equation 2. Future works will be devoted to calculating the Total Risk (Equation 3).
To assess expected losses in terms of economic costs, we estimate both the cost of replacing the exposed asset and the cost of the ecosystem services potentially affected by a volcanic eruption. Using Equation 2 with the specific risk information and costs, the economic losses were determined (Figure 3) for each of the exposed elements and for each of the volcanic hazards.
The cost in the case of ecosystem services was assessed by accounting services lent by the forest and crops seed for economic purposes like pastures, following the Bustamante and Ochoa (2014) guide. In addition, we have taken into account the timber trees average age, the presence of plants, scrubs, as well as their effects on hydrologic basins, landscape, recreation and potential tourism. Ecosystem services devoted for direct economic use like pasture for cattle raising and fruit trees, as well as coffee trees, were taken into account separately.
Finally, among the five physical risk curves, we selected the one that gives the maximum loss at each exposed element. In this way we consider the envelop of the maximum risk related to any of the considered hazards (for example, if an element weakly exposed to lahar but more exposed to tephra load, the latter will be chosen as predominant). In order to facilitate the mapping of the risk, it was classified according to ranges of expected losses.
4 Case study results
The methodology shown in Section 3 is applied to the case of La Florida municipality in Colombia. Results of hazard assessment, exposure, vulnerability, and risk are shown as follows.
4.1 Volcanic hazards assessment
4.1.1 Tephra fallout
The results obtained with the Hazmap model were used to assess the probabilities for several relevant tephra-fall loads according to the types of buildings found by means of our exposure surveys (see Section 4.2). Those load levels were 0.5, 1, 5, 10, and 50 kg/m2 which, given the typical average density of recently deposited wet tephra fall (see Supplementary Table ST3), correspond to 0.1, 0.2, 1.5, 3, and 15 cm-thick tephra deposits. As an example, Figure 4a shows the exceedance probability of 10 kg/m2 affecting the whole Galeras volcano influence area. In that particular case, the exceedance probability of 10 kg/m2 load affecting the La Florida town is about 10%, whenever the volcano erupts. Such a low threshold represents a relatively negligible impact, although it could affect road network, electricity distribution and air quality.
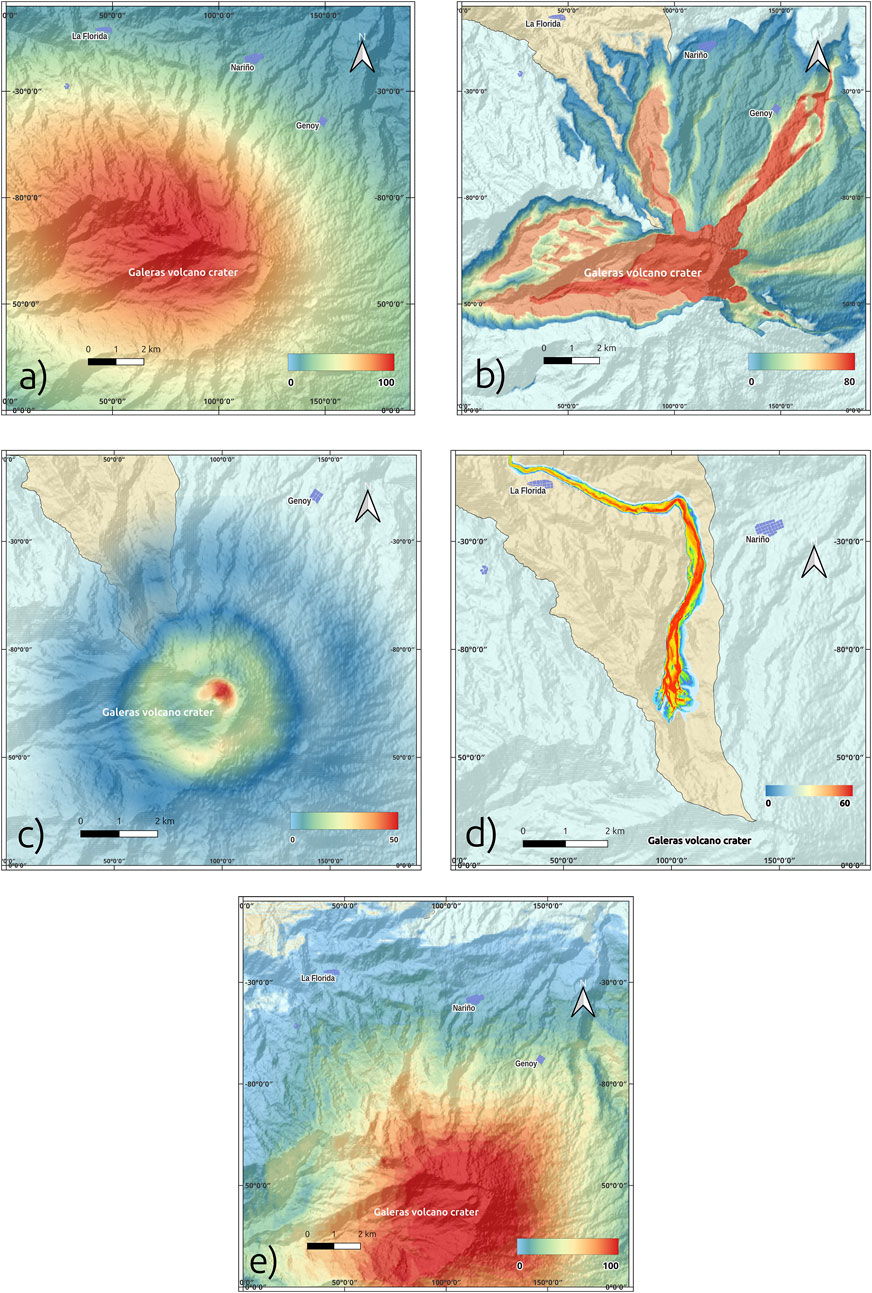
Figure 4. Examples of the assessed exceedance probabilities of (a) 10 kg/m2 load of tephra-fall, (b) PDC impact, (c) Impact of 106 J energy ballistic projectiles, (d) 0.5 m thickness lahar inundation, (e) 1 kPa shock wave dynamic pressure.
4.1.2 Pyroclastic density currents
As pointed out in Section 3.1.2, the combination of X and Y coordinates, volume, and collapse elevation of the source are given through the OLHS sampling, resulting in 640 combinations (Figure 3). The locations resulted scattered around the crater, from which the 640 hypothetical cases of PDCs were simulated. As PDCs can surmount barriers and reach the same place (pixel) from two or more initial locations, the respective probabilities of PDCs reaching such a place are estimated using the Bayesian approach (Section 3.1). Figure 4b shows the resulting probabilities of the flow exceeding a depth of 20 cm (García et al., 2011). For the case of La Florida, the Bayesian probability of PDCs reaching the town is basically negligible. This is supported by our own geological surveyed
4.1.3 Ballistics
As explained in Section 3.1, 128 OLHS combination samples were modelled at each of the trajectory lines. The probability of exceedance of the impacting energies of interest (
4.1.4 Lahars
Lahars were modelled only for the Barranco river as other rivers of the municipality that originate in the slopes of the volcano do not significantly threat the population of the municipality of La Florida. As many as 128 OLH samples were simulated, each one of them with a different combination of initial volume, velocity, and concentration, as required by Titan2F. As the used software provides information on resulting dynamic pressure and inundation levels at each pixel (Cordoba et al., 2018) for each of the samples, among other pieces of information, we extract relevant physical data according to the damage levels to structures (Valentine, 1998; Spence et al., 2004; Zanchetta et al., 2004), flooding damage (Ciurean et al., 2017), and those that can be dangerous to people (Glasstone and Dolan, 1977; NATO, 1993). The dynamic pressures accounted for are 5, 10, 15, 20, 30, and 35 kPa, while the relevant inundation depths range from 25, 50, 75, 100, 125–150 cm depth for flooding. As an example, Figure 4d shows the exceedance probability of a 0.5 m deep lahar along the channel of Quebrada Barranco.
4.1.5 Shock waves
As there is only one degree of freedom (initial energy, see Supplementary Table ST3) regarding the hazardous shock waves, we modelled 30 scenarios randomly sampled, from which probabilistic distribution maps were obtained for different overpressure scenarios; these were established according to the effects that the shock wave can exert on windows and structures (Mercx et al., 1991; Valentine, 1998; Saito et al., 2001; Saito and Takayama, 2005). The overpressure cases evaluated were: 0.2 kPa, 1 kPa, 2 kPa, 10 kPa, 15 kPa, 20 kPa, 25 kPa, 30 kPa, and 35 kPa. As example, Figure 4e shows the exceedance probability for 1 kPa dynamic pressure, which is capable of breaking most of 3 mm-thick glass windows (Mercx et al., 1991). For this case, La Florida town shows an exceedance probability of being impacted by a 1 kPa dynamic pressure of less than 10% in case of an explosive eruption of Galeras volcano.
4.2 Assessing exposure and structural vulnerability
We constrain the vulnerability analysis to the municipality of La Florida assessing both buildings and ecosystem services as exposed elements.
4.2.1 Vulnerability of buildings
Once we identified locations and types (Figure 5a), we developed damage-intensity curves based on building susceptibility to hazards for each of the assessed volcanic hazards and for each of the building types (Figures 6a–e).
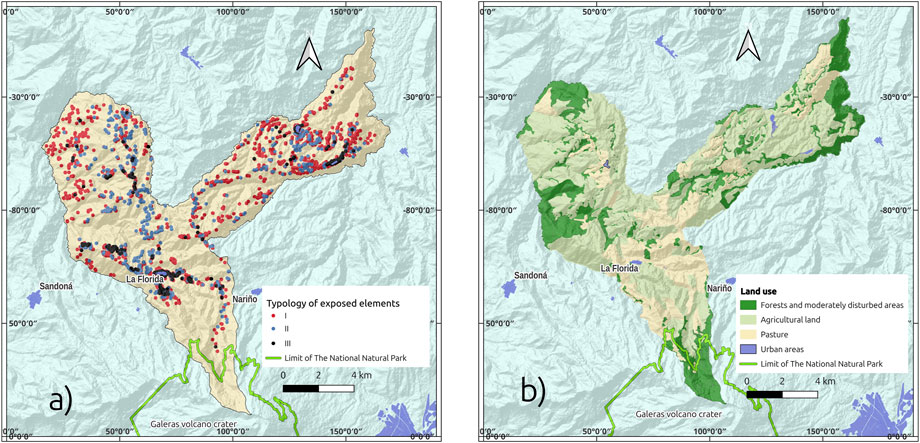
Figure 5. Exposed elements. (a) surveyed individual buildings, (b) Ecosystem services based on land use. Source: this research project. Topographic base: OpenStreetMap (OSM).
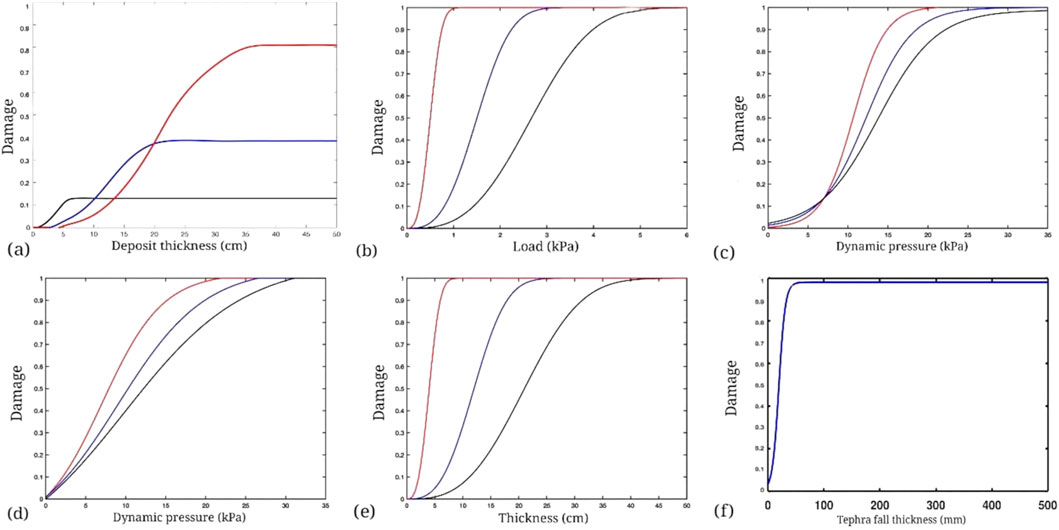
Figure 6. Intensity-Damage curves. In the case of buildings, the respective curves for the three types of buildings are shown (Type I in red, Type II in blue, Type III in black). (a) damage on the overall building due to tephra-fall deposit, (b) damage to roofs due to tephra-fall load, (c) damage due to dynamic pressure by shock waves, (d) damage due to dynamic pressure from lahars, (e) damage due to burial by lahars, (f) damage on crops by tephra-fall deposit thickness. Sources: after Valentine (1998), Spence et al. (2004), Zuccaro et al. (2008), Quan-Luna et al. (2011), Torres-Corredor et al. (2017), and Wild et al. (2019).
PDCs are the most destructive volcanic phenomena, though some structures can withstand their impact and temperature (USGS, 2023). Titan2D provides the velocity field, allowing us to deduce the impacting dynamic pressures and use vulnerability approaches proposed by Valentine (1998). However, the combined damage from impact, burial, and high temperatures (e.g., Dellino et al., 2008; 2021) can lead to irreparable damage, resulting in total loss and V = 1 for all exposed elements.
4.2.2 Ecosystem services
In this case we assessed the actual land use. From the 149 km2 area of the municipality of La Florida (Alcaldía de La Florida, 2016), 4.68 km2 belong to the natural national park “Santuario de Flora y Fauna del Volcán Galeras” (SFFG) (Parques Nacionales Naturales de Colombia, 2015), an environmentally highly protected zone where a permission is needed to enter. The rest of the surface is devoted to agricultural and grazing services, with exception of few remnants of the original forest located near ravines and El Barranco. Figure 5b shows the ecosystem services in terms of land use in the municipality, showing the SFFG, pasture and agricultural use land dedicated for commercial purposes as crops. Following Jenkins et al. (2015) and Wild et al. (2019), we developed, by interpolation, an intensity-damage curve for agricultural crops (Figure 6f). The value per hectare of forest is estimated of about US$ 520/Ha and the agricultural crops are estimated to be of the order of US$ 720/Ha (Gasparinetti et al., 2022).
4.3 Risk assessment
Once we obtained the data of probabilistic hazard and vulnerability for each exposed element (buildings and ecosystem service elements) using Grass-GIS (Hofierka et al., 2002; Obadowiski, 2017), we multiplied the hazard and damage levels for each impacting intensity (e.g., lahars: 10 kPa, 20 kPa, 30 kPa, 35 kPa) to build the specific risk curve (magenta colour curve in Figure 3) for each hazard and exposed element. Then, we chose the peak risk value from all hazards for each exposed element (pixel in the case of ecosystem services) to obtain the maximum specific risk. We assess the Physical Risk by multiplying the maximum specific risk for each element by its value (as seen in Table 2).
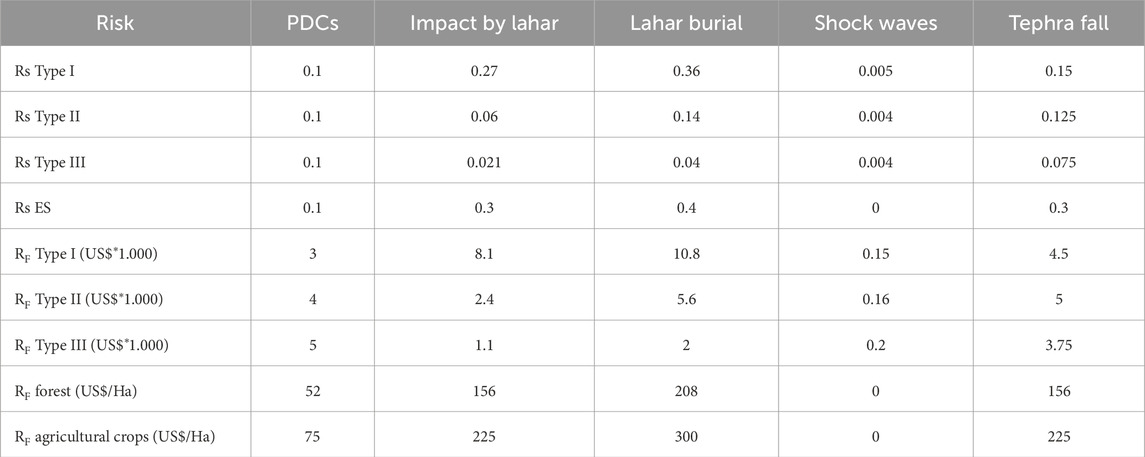
Table 2. Example of Specific Risk (Rs) and Physical Risk (RF) for each of the buildings types, and ecosystem services (ES), for each of the hazards that can affect an exposed element located at point 1 in Supplementary Figure SF5.
Our survey indicates an average of 3.6 inhabitants per house. For simplicity, we assume the total fatalities expected from PDCs and ballistics due to their high impacting energy and temperature. For lahars and shock waves, the total fatalities are assumed for dynamic pressures exceeding 35 kPa. For tephra fall, the loads exceeding 4 kPa are considered. Note that La Florida has no exposed buildings at risk of ballistic volcanic ejecta due to the long distance (>5 km from the vent).
We assess the human loss by taking the representative economic cost of a house’s inhabitants stopping producing in case of death (Woo, 2008; 2015; Marzocchi and Woo, 2009). Using the Gross Domestic Product for Colombia (Banco Mundial, 2022), the expected human loss per house is about US$ 170,000.
Finally, we chose the maximum expected loss for each exposed element. If an event’s destruction exceeds another event’s impact, there is no reason to double-count the loss. For example, a hypothetical house classified as type II at point 1 in the Supplementary Figure SF5 has an expected loss of US$5,600. If the element is forest, the expected loss is US$208/Ha.
This gives us information on the Physical Risk in terms of expected loss at each DEM pixel. Figure 7a shows the Physical Risk for the surveyed buildings in La Florida. The ranges of expected loss correspond to what could be a high, medium or low loss in terms of monetary value according to the Gross Domestic Income of La Florida Municipality, which is in average US$2.600 (Banco Mundial, 2022). Figure 7b shows the road network of La Florida municipality. The ranges account for the repair cost of roads in Colombia. Figure 7c shows the expected loss for the ecosystem services. The showed ranges were set by taking into account the relationship between the value of the ecosystem services (Section 4.2.2) and the cost of reforestation and/or farming (Gasparinetti et al., 2022).
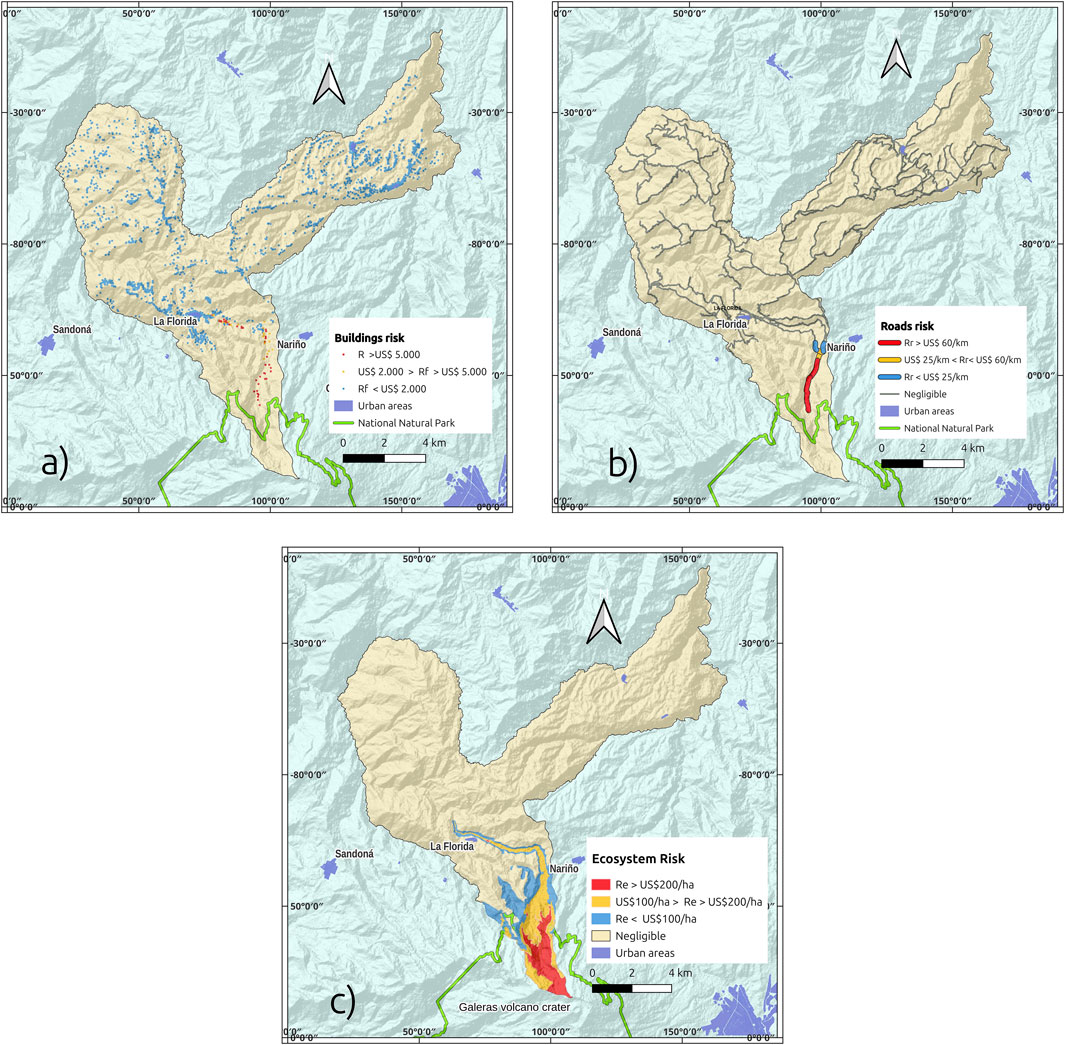
Figure 7. Physical Risk within the municipality of La Florida. (a) Exposed buildings. Red dots indicate expected loss exceeding US$5,000. Yellow dots indicate expected loss between US$2,000 and US$5,000. Blue dots indicate expected loss under US$2,000. (b) Exposed roads. In red the expected loss exceeding US$60/km. Orange indicate roads with expected loss between US25/km and US$60/km. Yellow indicate road sectors with expected loss under US$25/km. Roads in black indicate negligible risk. (c) Risk for the ecosystem services in terms of expected losses (here quantified in monetary terms). The red area indicates where the expected losses are greater than US$200/Ha, orange indicates expected losses between US$100/Ha and US$200/Ha, blue indicates expected losses up to US$50/Ha, and green areas suggest where no significant loss is expected. Topographic base: OpenStreetMap (OSM).
From this assessment, the number of buildings and people exposed to different levels of physical risk (Figure 7a) were estimated, as shown in Table 3.

Table 3. Number of buildings and number of people according to the expected loss level at which they are exposed.
The three maps shown here can be implemented in a single one classifying the risk as high, medium and low risk. However, this criterion could introduce confusion with hazard levels among decision makers, stakeholders and government officials. To avoid any potential confusion, it would be worth to use one of the main strengths of risk analysis as it provides tools for the establishment of risk acceptability levels as in Woo (2015), which is beyond of the scope of this paper. Meanwhile, using the results shown in Figure 7 we can classify the risk in terms of High, Medium, and Low Expected Loss, as shown in Figure 8.
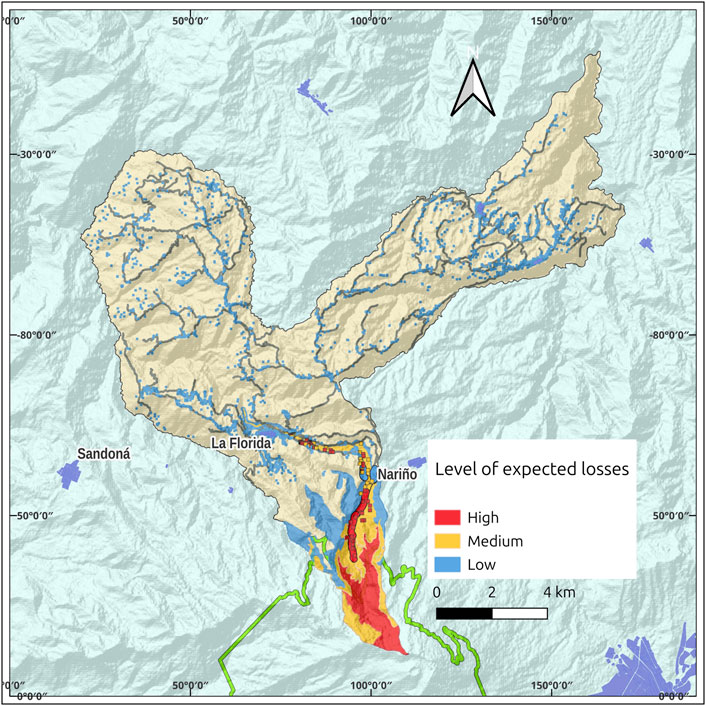
Figure 8. Integration of the assessed risks for buildings, roads and ecosystem services, in terms of expected losses. Colour thresholds are set as in Figure 7 considering, on each pixel, the maximum among all the volcanic risks.
5 Discussion
We present a comprehensive probabilistic risk assessment for La Florida, a municipality extending on the proximal slopes of Galeras volcano. By applying a quantitative approach, we address gaps in previous qualitative hazard assessments, providing a more detailed understanding of the physical risks posed by volcanic hazards to buildings, ecosystems, and indirectly human populations.
Volcanic probabilistic risk assessment is crucial for effective risk management. It quantifies multiple hazards and potential damage and loss to establish hazard zones, detailed risk curves for specific assets, vulnerability, and exposure. Our approach shows similarities and differences compared to similar studies in volcanic regions like Montserrat (Wadge and Aspinall, 2014), Sakurajima (Iguchi, 2021), and parts of Latin America. Like Montserrat, our study emphasizes the importance of integrating risk analysis into decision-making and land-use processes. However, unlike Sakurajima, whose continuous volcanic activity requires constant updates and real-time monitoring, Galeras’s relatively infrequent yet potentially hazardous events require a balanced approach considering historical data and probabilistic scenarios. On the other hand, also volcanoes such as Nevado del Ruiz (SGC, 2025), with significantly less frequent eruptive activity, pose a high risk due to the presence of a glacier that can trigger hazardous lahars even without the risk of an imminent eruption. However, since our approach accounted for all potential volcanic hazards, once that the relative likelihood and frequency are determined, the method can be applied to several volcanoes worldwide.
This study’s implications for risk management are significant. We identified and classified buildings, roads and ecosystem services exposed to different risk levels (Figures 7, 8; Table 3). The shift from hazard-based to risk-based planning provides local authorities with a rational framework for short-term and long-term crisis mitigation. For instance, cost-benefit analyses of relocation strategies versus maintaining high-risk populations offer policy decisions. Probabilistic risk maps prioritize mitigation efforts, such as reinforcing vulnerable buildings or conserving critical ecosystems.
However, the approach has limitations. Robust probabilistic models rely on assumptions about volcanic hazard behaviour and exposed elements. Uncertainties in input data, like volcanic event records or building material properties, could affect potential loss estimates. Further work should refine these models and constrain uncertainties.
Relocating populations from high-risk areas within the ZAVA presents complex social and logistical challenges (Correa, 2011). A cost-benefit analysis (Woo, 2008; 2015) that accounts for economic and social impacts could assess Total Risk (Equation 3) and help determine acceptable risk levels (Rausand, 2011; UNISDR, 2017). Comparing La Florida’s situation to other relocation efforts worldwide, such as those in response to Merapi in Indonesia (Gertisser et al., 2023), the Armero tragedy in Colombia (Voight, 1990), or the communities around Fuego volcano in Guatemala, emphasizes the need for a comprehensive approach that balances risk reduction with community needs and sustainable development.
proposed a method to approach functional and social vulnerability and interdependency with the economic and social system. To calculate Total Risk, and to take account of the impact factor F (Equation 3) as well, based on aggravating factors related to socio-economic fragility and lack of resilience, requires further socio-economic studies, which are beyond our scope focused on physical risk. Future works could quantify these disaster risk indicators.
6 Conclusion
This study has provided a detailed, probabilistic assessment of volcanic risk in the municipality of La Florida, Colombia. By combining hazard, exposure, and vulnerability data, we have quantified the specific and physical risks to buildings, ecosystem services, and agricultural assets within the municipality. Our findings indicate that a few areas, particularly those along the channel of the Barranco River and on the proximal, upper slopes of the catchment, face significant risks from lahars and pyroclastic flows, while tephra fallout poses a widespread but generally lower risk across the region.
One of the most important outcomes of this work is the identification of key risk factors that should guide future risk management efforts. The identification of the number of people exposed to different risk levels could help decision makers to establish mitigation counter-measurements and evacuation policies. Cost-benefit analysis of potential relocation from high-risk areas, for example, can be conducted based on any future work.
The methodologies developed in this study have broader implications for other populated regions facing similar volcanic hazards. The integration of geological data and probabilistic modelling with cost-benefit analysis offers a replicable framework that can be adapted to different volcanic contexts, providing a valuable tool for policymakers and disaster risk managers globally. Additionally, the focus on ecosystem services as part of the risk assessment highlights the importance of considering environmental as well as human impacts in volcanic risk management.
In conclusion, this study has not only advanced our understanding of volcanic risk in La Florida but also provided a model for other communities facing similar hazards. A comprehensive, quantitative approach to risk assessment is essential for making informed decisions that protect both people and the environment in volcanic regions.
Data availability statement
The original contributions presented in the study are included in the article/Supplementary Material, further inquiries can be directed to the corresponding author.
Author contributions
GC: Conceptualization, Formal Analysis, Funding acquisition, Investigation, Methodology, Project administration, Resources, Software, Supervision, Validation, Visualization, Writing – original draft, Writing – review and editing. AC: Conceptualization, Formal Analysis, Funding acquisition, Investigation, Methodology, Resources, Software, Validation, Visualization, Writing – original draft, Writing – review and editing. DR: Conceptualization, Formal Analysis, Investigation, Methodology, Software, Visualization, Writing – original draft. J-CT: Formal Analysis, Funding acquisition, Investigation, Resources, Validation, Writing – review and editing. RC: Conceptualization, Data curation, Investigation, Resources, Software, Visualization, Writing – review and editing. DG: Formal Analysis, Investigation, Methodology, Software, Writing – original draft.
Funding
The author(s) declare that financial support was received for the research and/or publication of this article. This research was supported by the Universidad de Nariño-Municipality of La Florida, Colombia, agreement 2017000277; Universidad de Nariño, Colombia, research grant 1889/2019. GC and AC thank the grant Progetto INGV Pianeta Dinamico (code CUP D53J19000170001) funded by Italian Ministry MIUR (“Fondo Finalizzato al rilancio degli investimenti delle amministrazioni centrali dello Stato e allo sviluppo del Paese,” legge 145/2018). J-CT work was partly supported also by the research grant 1889/2019, and by the I-Site Programme.
Acknowledgments
We want to thank all the team that was involved in the Universidad de Nariño-Municipality of La Florida, Colombia, agreement 2017000277; to Ivan Gustín, mayor’s office of La Florida municipality of the period 2016-2020, and Juan Carlos Mora, former director of the Risk Management Office of La Florida municipality, Colombia. We thank the personnel of the LMC14 and Laboratoire Magmas et Volcans of Université Clermont-Auvergne, France, for the dating of the collected samples. We would like to thank the very useful comments by the reviewers that helped to significantly improve the paper.
Conflict of interest
The authors declare that the research was conducted in the absence of any commercial or financial relationships that could be construed as a potential conflict of interest.
Generative AI statement
The author(s) declare that no Generative AI was used in the creation of this manuscript.
Publisher’s note
All claims expressed in this article are solely those of the authors and do not necessarily represent those of their affiliated organizations, or those of the publisher, the editors and the reviewers. Any product that may be evaluated in this article, or claim that may be made by its manufacturer, is not guaranteed or endorsed by the publisher.
Supplementary material
The Supplementary Material for this article can be found online at: https://www.frontiersin.org/articles/10.3389/feart.2025.1632282/full#supplementary-material
References
Alatorre-Ibargüengoitia, M. A., Delgado-Grabados, H., and Farraz-Motes, I. A. (2006). “Hazard zoning for ballistic impact during volcanic explosions at Volcán de Fuego de Colima (México),” in Neogene-Quaternary Continental Margin Volcanism: a perspective from México. (Boulder, CO: Geological Society of America), 195–202. doi:10.1130/SPE402
Alatorre-Ibargüengoitia, M. A., Delgado-Granados, H., and Dingwell, D. B. (2012). Hazard map for volcanic ballistic impacts at Popocatépetl volcano (Mexico). Bull. Volcanol. 74, 2155–2169. doi:10.1007/s00445-012-0657-2
Alcaldía de La Florida (2016). Actualización del Plan de Uso Eficiente y Ahorro del Agua del municipio de La Florida - nariño.
Andrews, B. J., and Manga, M. (2011). Effects of topography on pyroclastic density current runout and formation of coignimbrites. Geology 39, 1099–1102. doi:10.1130/G32226.1
Aravena, A., Bevilacqua, A., Michieli Vitturi, M., Esposti Ongaro, T., and Cioni, R. (2022). Calibration strategies of PDC kinetic energy models and their application to the construction of hazard maps. Bull. Volcanol. 84. 29. doi:10.1007/s00445-022-01538-8
Aspinall, W. P., and Blong, R. J. (2015). “Volcanic risk management. In H. Sigurdsson (Ed.),” in The encyclopedia of volcanoes., (Academic Press), 1215–1234.
Baalousha, H. (2009). Using orthogonal array sampling to cope with uncertainty in ground water problems. Ground Water 47, 709–713. doi:10.1111/j.1745-6584.2009.00576.x
Banco Mundial (2022). PIB per cápita (US$ a precios actuales) - colombia. Available online at: https://datos.bancomundial.org/indicator/NY.GDP.PCAP.CD?locations=CO.
Banks, N. G., Calvache V, M. L., and Williams, S. N. (1997). 14C ages and activity for the past 50 ka at Volcán Galeras, Colombia. J. Volcanol. Geotherm. Res. 77, 39–55. doi:10.1016/S0377-0273(96)00085-6
Birkmann, J. (2013). “Risk,” in Encyclopedia of Earth sciences series. Editor P. T. Bobrowsky (Dordrecht: Springer Nature), 856–862.
Bolaños-Cabrera, G., Murcia, H. F., Llano-Montenegro, D., Thouret, J.-C., Córdoba, G., Botero-Gómez, L. A., et al. (2024). New evidence of Holocene pyroclastic density currents at Galeras volcano, Colombia. J. Volcanol. Geotherm. Res. 455, 108203. doi:10.1016/j.jvolgeores.2024.108203
Bonadonna, C., Pistolesi, M., Guobadia, D., Gattuso, A., Riccardi, A., Christiani, C., et al. (2021). Integrating hazard, exposure, vulnerability and resilience for risk and emergency management in a volcanic context: the ADVISE model. J. Appl. Volcanol. 10, 7. doi:10.1186/s13617-021-00108-5
Bustamante, M., and Ochoa, E. (2014). Guía práctica para la valoración de servicios ecosistémicos en Madre de Dios. Available online at: https://wwflac.awsassets.panda.org/downloads/guia_practica_valoracion_servicios_ecosistemicos.pdf.
Calvache, M. (1990). Geology and volcanology of the recent evolution of Galeras Volcano. Colombia: Louisiana State University.
Calvache, M. (1995). The geological evolution of Galeras Volcanic Complex. Tempe, AZ: Arizona State University.
Calvache, M. L., and Duque-Trujillo, J. F. (2016). “Geomorphological features of the Galeras volcanic complex,” in Landscapes and landforms of Colombia. Editor M. Hermelin (Cham: Springer International Publishing), 193–202. doi:10.1007/978-3-319-11800-0_16
Calvache, M. L., and Williams, S. N. (1992). Lithic-dominated pyroclastic flows at Galeras volcano, Columbia - an unrecognised hazard. Geol. Boulder 20, 539–542. doi:10.1130/0091-7613(1992)020<0539
Calvache, M. L., Cortés, G. P., and Williams, S. N. (1997). Stratigraphy and chronology of the Galeras volcanic complex, Colombia. J. Volcanol. Geotherm. Res. 77, 5–19. doi:10.1016/S0377-0273(96)00083-2
Capra, L., Manea, V. C., Manea, M., and Norini, G. (2011). The importance of digital elevation model resolution on granular flow simulations: a test case for Colima volcano using TITAN2D computational routine. Nat. Hazards 59, 665–680. doi:10.1007/s11069-011-9788-6
Cardona, O. D., Van Aalst, M. K., Birkmann, J., Fordham, M., Mc Gregor, G., Rosa, P., et al. (2012). Determinants of risk: exposure and vulnerability. Manag. Risks Extreme Events Disasters Adv. Clim. Change Adapt. Spec. Rep. Intergov. Panel Clim. Change, 65–108. doi:10.1017/CBO9781139177245.005
Cepeda, H. (1990). “Memorias del Mapa preliminar de amenaza volcánica potencial del Volcán Galeras,” in Conferencia de riesgos Geológicos del Valle de Aburra (Medellín, Colombia: Servicio Geológico Colombiano), 111–116.
Cepeda, H. (2020). in Quinientos años de documentación histórica de actividad del volcán Galeras: escenarios eruptivos. Servicio geológico colombiano. Editor C. Hernández (Bogotá, Colombia). doi:10.32685/9789585279421
Ciurean, R. L., Hussin, H., van Westen, C. J., Jaboyedoff, M., Nicolet, P., Chen, L., et al. (2017). Multi-scale debris flow vulnerability assessment and direct loss estimation of buildings in the Eastern Italian alps. Nat. Hazards 85, 929–957. doi:10.1007/s11069-016-2612-6
Connor, C. B. (2015). PERL script for motion projectile motion with drag. Available online at: http://131.247.211.166/tiki/tiki-index_raw.php?page=Ballistics.
Córdoba, G. A., Sheridan, M. F., and Pitman, B. (2018). Titan2F code for lahar hazard assessment: derivation, validation and verification. Bol. Soc. Geol. Mex. 70, 611–631. doi:10.18268/bsgm2018v70n3a3
Cordoba, G., Villarosa, G., and Guerrero-Lopez, A. (2018). “Probabilistic lahar hazard assesment by modeling: the case of Villa La Angostura, provincia de Neuquén, Argentina,” in Hazard and risk mapping the Arequipa-El Misti case study and other threatened cities (Clermont, France: Presses Universitaries Bñlaise Pascal), 79–82.
Cordoba, G., Costa, A., Rodriguez, D., Thouret, J. C., Guerrero López, D. A., and Criollo, R. A. (2024). Riesgo volcanico probabilistico con ejemplo de aplicación. Pasto, Colombia: universidad de Nariño. Available online at: https://sired.udenar.edu.co/15699/.
Correa, E. (2011). “Populations at risk of disaster: a resettlement guide,” in The international bank for reconstruction and development. Washington, D.C. The Word Bank.
Corte Constitucional (2015). Sentencia T-269 de 2015 de la Corte Constitucional. Available online at: https://www.corteconstitucional.gov.co/RELATORIA/2015/T-269-15.htm.
Costa, A., Pioli, L., and Bonadonna, C. (2016). Assessing tephra total grain-size distribution: insights from field data analysis. Earth Planet. Sci. Lett. 443, 90–107. doi:10.1016/j.epsl.2016.02.040
Costantini, L., and Thierry, P. (2012). “Introduction to volcanic risk,” in Handbook for volcanic risk management. Editors C. Bignami, V. Bosi, L. Costantini, C. Cristiani, F. Lavigne, and P. Thierry, Orleans, France: MIAVITA).
Dalbey, K., Patra, A. K., Pitman, E. B., Bursik, M. I., and Sheridan, M. F. (2008). Input uncertainty propagation methods and hazard mapping of geophysical mass flows. J. Geophys. Res. Solid Earth 113, 2006JB004471–16. doi:10.1029/2006JB004471
DANE (2019). “Resultados del Censo Nacional de Población y Vivienda 2018,” in Departamento Administrativo Nacional de Estadística (Bogotá, Colombia). Available online at: https://sitios.dane.gov.co/cnpv/#!/.
DANE (2024). Índice de Precios de la Vivienda Nueva. Bogotá, Colombia: departamento Administrativo Nacional de Estadística. Available online at: https://www.dane.gov.co/index.php/estadisticas-por-tema/precios-y-costos/indice-de-precios-de-la-vivienda-nueva-ipvn.
Dekking, F. M., Kraaikamp, C., Lopuhaa, H. P., and Meester, L. E. (2005). A modern introduction to probability and statistics. London, UK: Springer.
Delgado, V. (2018). Reasentamiento En La Zona de Amenaza Volcánica Alta Del Volcán Galeras, 2008 - 2010. doi:10.2307/j.ctv1pbwvqw
Dellino, P., Mele, D., Sulpizio, R., La Volpe, L., and Braia, G. (2008). A method for the calculation of the impact parameters of dilute pyroclastic density currents based on deposit particle characteristics. J. Geophys Res-Solid Ea. 113. doi:10.1029/2007jb005365
Dellino, P., Dioguardi, F., Isaia, R., Sulpizio, R., and Mele, D. (2021). The impact of pyroclastic density currents duration on humans: the case of the AD 79 eruption of Vesuvius. Nat. Sci. Rep. 11, 4959. doi:10.1038/s41598-021-84456-7
Ding, D., and Liu, X. (2012). “Bayesian methods with application in risk analysis,” in National conference on information technology and computer science. Editors B. Chen, V. Hu, and D. Kong (Springer Nature), 788–791. Available online at: https://www.atlantis-press.com/proceedings/citcs-12/articles.
Doyle, E. E., Hogg, A. J., Mader, H. M., and Sparks, R. S. J. (2008). Modeling dense pyroclastic basal flows from collapsing columns. Geophys. Res. Lett. 35, 2007GL032585–5. doi:10.1029/2007GL032585
Dufek, J., Esposti Ongaro, T., and Roche, O. (2015). “Pyroclastic density currents: processes and models,” in The encyclopedia of volcanoes (Academic Press), 617–629. doi:10.1016/B978-0-12-385938-9.00035-3
Espinosa, A. (2012). “Enciclopedia de Desastres Naturales Históricos de Colombia,” in F. y N. Academia Colombiana de Ciencias Exactas. Quindio, Colombia: universidad del Quindio. Available online at: http://accefyn.metabiblioteca.org/cgi-bin/koha/opac-detail.pl?biblionumber=16817&shelfbrowse_itemnumber=14300.
Ferson, S. (2005). Bayesian methods in risk assessment. Adv. Nucl. Sci. Technol. 13, 415–465. doi:10.1016/B978-0-12-029309-4.50010-6
Galas, S., Dalbey, K., Kumar, D., and Patra, A. (2007). “Benchmarking Titan2D mass flow model against a sand flow experiment and the 1903 frank slide,” in The 2007 international forum on landslide disaster management, 899–917.
García, A. M., Murcia, H. F., Cortés, G. P., and Laverde, C. A. (2011). Simulación de flujos Piroclásticos en el Volcán Galeras con el Código TiTAN2D. Geol. Colomb. 36, 135–161. doi:10.15446/gc
Gasparinetti, P., Brandão, D. O., Mandingo, E. V., Khan, A., Cabanillas, F., Farfan, J., et al. (2022). Economic feasibility of tropical Forest restoration models based on non-timber Forest products in Brazil, Cambodia, Indonesia, and Peru. Forest 13, 1878. doi:10.3390/f13111878
Gertisser, R., del Marmol, M. A., Newhall, C. G., Preece, K., Charbonnier, S. J., Andreastuti, S., et al. (2023). “Geological history, chronology and magmatic evolution of merapi,” in Merapi Volcano: geology, eruptive activity, and monitoring of a high-risk Volcano. Editors R. Gertisser, V. R. Troll, T. R. Walter, I. G. M. A. Nandaka, and A. Ratdomopurbo (Springer Nature), 137–193.
Ghesquiere, F., Mahul, O., and Jamin, L. (2006). “Earthquake Vulnerability Reduction Program in Colombia A probabilistic cost-benefit analysis,”. Washington, D.C: World Bank Group. doi:10.1596/1813-9450-3939
Glasstone, S., and Dolan, P. J. (1977). “The effects of nuclear weapons,” in Department of defense. Third edition (United States: Department of Energy). doi:10.2172/6852629
Gomez, D. (2018). Datos depósitos de caída volcán Galeras. 23 febrero 2018. Pasto, Colombia: Servicio Geológico Colombiano.
Greenshields, C. (2017). OpenFoam user guide. Available online at: https://www.openfoam.com/documentation/user-guide.
Guerrero, D. A., Criollo, R. A., Córdoba, G. A., and Rodríguez, D. M. (2019). A modeling approach for lahar hazard assessment: the case of tamasagra sector in the City of pasto, Colombia. Ing. Cienc. 15, 7–31. doi:10.17230/ingciencia.15.30.1
Gueugneau, V., Charbonnier, S. J., Esposti-Ongaro, T., Vitturi, M., Peruzzetto, M., Mangeney, A., et al. (2021). Synthetic benchmarking of concentrated pyroclastic current models. Bull. Volcanol. 83. 75. doi:10.1007/s00445-021-01491-y
Guimaraes, L. F., Nieto-Torres, A., Bonadonna, C., and Frieschknecht, C. (2021). A new inclusive volcanic risk ranking, part 2: application to Latin America. Front. Earth Sci. 9, 757742. doi:10.3389/feart.2021.757742
Helens, M. S., and Pierson, T. C. (1985). Geological Society of America Bulletin Initiation and flow behavior of the 1980 Pine Creek and Muddy River lahars. Geol. Soc. Am. Bull. doi:10.1130/0016-7606(1985)96<1056
Hinton, E. M., Hogg, A. J., and Huppert, H. E. (2019). Interaction of viscous free-surface flows with topography. J. Fluid Mech. 876, 912–938. doi:10.1017/jfm.2019.588
Hofierka, J., Mitasova, H., and Mitas, L. (2002). “GRASS and modeling landscape processes using duality between particles and fields,” in Proceedings of the Open source GIS - GRASS users conference, (Trento, Italy), 11.
Hurtado, A. D., and Cortéz, G. P. J. (1997). Third version of the hazard map of Galeras Volcano, Colombia. J. Volcanol. Geotherm. Res. 77, 89–100. doi:10.1016/S0377-0273(96)00088-1
Iguchi, M. (2021). “Volcano emergency planning at Sakurajima volcano,” in Forecasting and planning for volcanic hazards, risks, and disasters (Elsevier), 635–668. doi:10.1016/B978-0-12-818082-2.00018-4
Ingeniar (2022). “Estudios detallados de riesgo por corrientes de densidad piroclástica, flujos de lodo, flujos de escombros volcánicos y caídas de piroclastos en los municipios del área de influencia del volcán Galeras: evaluación del riesgo,” in Producto 6. Bogotá, Colombia: unidad Nacional Para la Gestión del Riesgo de Desastres.
Ingeominas (2010). Resumen de actividad del volcán Galeras del 29 de diciembre de 2009 al 4 de enero de 2010. Pasto: Instituto Colombiano de Geología y Minería.
Jenkins, S., Wilson, T., Loughlin, S., Sparks, S., Brown, S., Jenkins, S., et al. (2015). “Volcanic ash fall hazard and risk,” in Global volcanic hazards and risk, 173–222. doi:10.1017/CBO9781316276273
Jenkins, S. F., Biass, S., Williams, G. T., Hayes, J. L., Tennant, E., Yang, Q., et al. (2022). Evaluating and ranking Southeast Asia’s exposure to explosive volcanic hazards. Nat. Hazards Earth Syst. Sci. 22, 1233–1265. doi:10.5194/nhess-22-1233-2022
Link, W., and Barker, R. J. (2010). Bayesian Inference: with ecological applications. Boston, United States: Academic Press.
Llinares, A., Ortiz, R., and Marrero, J. M. (2004). “Riesgo volcánico,” in España: ministerio del Interior.
Macedonio, G., and Costa, A. (2014). Parfit-2.1 A tool for the parametrization of volcanic ash deposits. Italy. Istituto Nazionale di Geofisica e Vulcanologia.
Macedonio, G., and Costa, A. (2016). HAZMAP 2.4.4 User Manual. Available online at: http://datasim.ov.ingv.it/models/hazmap.html.
Macedonio, G., Costa, A., and Longo, A. (2005). A computer model for volcanic ashfallout and assessment of subsequent hazard. Comput. Geosci. 31, 837–845. doi:10.1016/j.cageo.2005.01.013
Malagón, D., and Pulido, C. (2000). “Suelos del páramo colombiano,” in COLOMBIA Diversidad Biótica III: La región paramuna, eds. R. Churio, J. Orlando, L. Castillo, E. Leonardo, B. Betancur, J Uribeet al. (Bogotá, DC: Universidad Nacional de Colombia, Instituto Alexander Von Humboldt), 37–84.
Malin, M. C., and Sheridan, M. F. (1982). Computer-Assisted mapping of pyroclastic surges. Science 217, 637–640. doi:10.1126/science.217.4560.637
Marzocchi, W., and Woo, G. (2009). Principles of volcanic risk metrics: theory and the case study of Mount Vesuvius and Campi Flegrei, Italy. J. Geophys. Res. 114, B03213. doi:10.1029/2008JB005908
Massaro, S., Stocchi, M., Montesinos, B. M., Sandri, L., Selva, J., Sulpizio, R., et al. (2023). Assessing long-term tephra fallout hazard in southern Italy from Neapolitan volcanoes. NHESS 23, 2289–2311. doi:10.5194/nhess-23-2289-2023
Matala, A. (2008). Sample Size Requirement for Monte Carlo simulations using Latin Hypercube Sampling. Helsinki: Helsinki University of Technology.
Mercx, W. P. M., Weerheijm, J., and Verhagen, Th. L. A. (1991). “Some considerations on the damage criteria and safety distances for industrial explosions,” in Institution of chemical engineers symposium series (Rijswijk, Netherlands), 255–275.
Muñoz-Salinas, E., Manea, V. C., Palacios, D., and Castillo-Rodriguez, M. (2007). Estimation of lahar flow velocity on Popocatépetl volcano (Mexico). Geomorphology 92, 91–99. doi:10.1016/j.geomorph.2007.02.011
NATO (1993). Health service support in a nuclear, biological, and chemical environment’ headquarters. Washington, DC: North Atlantic Treaty Organization.
Nieto-Torres, A., Guimaraes, L. F., Bonadonna, C., and Frieschknecht, C. (2021). A new inclusive volcanic risk ranking, part 1: methodology. Front. Earth Sci. 9. 697451. doi:10.3389/feart.2021.697451
Obadowiski, B. L. (2017). GRASS: a free and open source solution for hydrographic body analysis. Nativa 5, 24–30. doi:10.5935/2318-7670.v05n01a04
Ogburn, S., and Calder, E. S. (2017). The relative effectiveness of empirical and physical models for simulating the dense undercurrent of pyroclastic flows under different emplacement conditions. Front. Earth Sci. 5, 83–23. doi:10.3389/feart.2017.00083
Ortiz, R. (1996). Riesgo Volcánico. Servicio de publicaciones del Exmo. Cabildo Insular de Lanzarote.
Parques Nacionales Naturales de Colombia (2015). Plan de Manejo Santuario de Flora y Fauna Galeras, 67, 217.
Patra, A. K., Bauer, A. C., Nichita, C. C., Pitman, E. B., Sheridan, M. F., Bursik, M., et al. (2005). Parallel adaptive numerical simulation of dry avalanches over natural terrain. J. Volcanol. Geotherm. Res. 139, 1–21. doi:10.1016/j.jvolgeores.2004.06.014
Pierson, T. C. (1980). Erosion and deposition by debris flows at Mt Thomas, North Canterbury, New Zealand. Earth Surf. Process. 5, 227–247. doi:10.1002/esp.3760050302
Pierson, T. C., and Scott, K. M. (1985). Downstream dilution of a lahar: transition from debris flow to hyperconcentrated streamflow. Water Resour. Res. 21, 1511–1524. doi:10.1029/WR021i010p01511
Prieto, J. A., Journeay, M., Acevedo, A. B., Arbelaez, J. D., and Ulmi, M. (2018). Development of structural debris flow fragility curves (debris flow buildings resistance) using momentum flux rate as a hazard parameter. Eng. Geol. 239, 144–157. doi:10.1016/j.enggeo.2018.03.014
Pulgarín, B., Tamayo, M., Rayo, L., Zuluaga, I., Castilla, S., Cruz, Y., et al. (2024). “Geología y estratigrafía del Complejo volcánico Galeras,” in Servicio geológico colombiano.
Quan Luna, B., Blahut, J., Westen, C. J., Sterlacchini, S., Asch, T., and Akbas, S. O. (2011). Machine learning modelling for predicting soil liquefaction susceptibility. Nat. Hazards Earth Syst. Sci. 11, 1–9. doi:10.5194/nhess-11-1-2011
Ramli, M. W. A., Alias, N. E., Yusop, Z., and Taib, M. (2019). Disaster risk index: a review of local Scale concept and methodologies. Earth Environ. Sci. 479, 012023. doi:10.1088/1755-1315/479/1/012023
Rausand, M. (2011). Risk assessment: theory, methods, and applications. 1st Edn. Hoboken, NJ: Wiley.
Saito, T., and Takayama, K. (2005). Applying shock-wave research to volcanology. Comput. Sci. Eng. 7, 30–35. doi:10.1109/mcse.2005.8
Saito, T., Eguchi, T., Takayama, K., and Taniguchi, H. (2001). Hazard predictions for volcanic explosions. J. Volcanol. Geotherm. Res. 106, 39–51. doi:10.1016/s0377-0273(00)00265-1
Sandri, L., Costa, A., Selva, J., Tonini, R., Macedonio, G., Folch, A., et al. (2016). Beyond eruptive scenarios: assessing tephra fallout hazard from Neapolitan volcanoes. Sci. Rep. 6, 24271–13. doi:10.1038/srep24271
Sandri, L., Garcia, A., Costa, A., Guerrero Lopez, A., and Cordoba, G. (2021). Stochastic modeling of explosive eruptive events at Galeras Volcano, Colombia. Front. Earth Sci. 8, 583703. doi:10.3389/feart.2020.583703
Sandri, L., Vitturi, M., Costa, A., Di Vito, M. A., Rucco, I., Doronzo, D. M., et al. (2024). Lahar events in the last 2000 years from Vesuvius eruptions – part 3: hazard assessment over the Campanian Plain. Solid earth. 15, 459–476. doi:10.5194/se-15-459-2024
Sekajugo, J., Kagoro-Rugunda, G., Mutyebere, R., Kabaseke, C., Mubiru, D., Kanyiginya, V., et al. (2024). Exposure and physical vulnerability to geo-hydrological hazards in rural environments: a field-based assessment in East Africa. Int. J. Disaster Risk Reduct. 102, 104282. doi:10.1016/j.ijdrr.2024.104282
SGC (2025). “Volcán Nevado del Ruiz: conocerlo es la clave para proteger la vida,” in Serv. Geológico colomb. Available online at: https://www2.sgc.gov.co/Temas-destacados/Paginas/Volcan-Nevado-del-Ruiz-conocerlo-es-la-clave-para-proteger-la-vida.aspx (Accessed October 7, 2025).
Sheridan, M. F. (1980). Pyroclastic block flow from the September, 1976, eruption of La Soufrière volcano, Guadeloupe. Bull. Volcanol. 43, 397–402. doi:10.1007/BF02598040
Sheridan, M. F., and Cordoba, G. (2010). Residents, decision makers, and scientists discuss volcanic hazard in Colombia: knowledge sharing and Collaboration in volcanic risk mitigation at Galeras Volcano, Colombia; pasto, Colombia, 6–11 July 2009. Eos Trans. Am. Geophys. Union 91, 46. doi:10.1029/2010eo050009
Sheridan, M. F., Stinton, A. J., Patra, A., Pitman, E. B., Bauer, A., and Nichita, C. C. (2005). Evaluating Titan2D mass-flow model using the 1963 little Tahoma peak avalanches, Mount Rainier, Washington. J. Volcanol. Geotherm. Res. 139, 89–102. doi:10.1016/j.jvolgeores.2004.06.011
Sheridan, M. F., Patra, A. K., Dalbey, K., and Hubbard, B. (2010). “Probabilistic digital hazard maps for avalanches and massive pyroclastic flows using TITAN2D,” in Stratigraphy and Geology of Volcanic Areas. eds. G. Groppelli, and L. Viereck-Goette (Boulder, CO: Geological Society of America). doi:10.1130/2010.2464(14)
Smithsonian Institution (2017). Galeras. Available online at: https://volcano.si.edu/volcano.cfm?vn=351080.
Smithsonian Institution (2023). Active volcanoes. Available online at: https://volcano.si.edu/faq/index.cfm?question=activevolcanoes.
Solow, A. R. (2001). An empirical bayes analysis of volcanic eruptions. Math. Geol. 33, 95–102. doi:10.1023/A:1007514410745
Spence, R., Baxter, P. J., and Zuccaro, G. (2004). Building vulnerability and human casualty estimation for a pyroclastic flow, a model and its application to Vesuvius. J. Volcanol. Geotherm. Res. 133 (1), 321–343. doi:10.1016/s0377-0273(03)00405-0
Stefanescu, E. R., Bursik, M., Cordoba, G., Dalbey, K., Jones, M. D., Patra, A. K., et al. (2012). Digital elevation model uncertainty and hazard analysis using a geophysical flow model. Proc. R. Soc. Math. Phys. Eng. Sci. 468, 1543–1563. doi:10.1098/rspa.2011.0711
Stein, M. (1987). Large sample properties of simulations using Latin hypercube sampling. Technometrics 29, 143–151. doi:10.2307/1269769
Torres-Corredor, R. A., Ponce-Villarreal, P., and Gómez-Martínez, D. M. (2017). Vulnerabilidad física de cubiertas de edificaciones de uso de ocupación normal ante caídas de ceniza en la zona de influencia del volcán Galeras. Rev. Bol. Geol. UIS 39, 67–82. doi:10.18273/revbol.v39n2-2017005
UNDRR (2023). Strengthening risk analysis for humanitarian planning. Geneve: united Nations office for disaster risk reduction. Available online at: https://www.undrr.org/publication/strengthening-risk-analysis-humanitarian-planning#downloads.
UNISDR (2015). Sendai framework for disaster risk reduction 2015 - 2030. Geneva: United Nations Office for Disaster Risk Reduction.
UNISDR (2017). National disaster risk assessment: Governance System, methodologies, and use of results. Geneva: United Nations Office for Disaster Risk Reduction.
USGS (2023). Pyroclastic flows move fast and destroy everything in their path. Available online at: https://www.usgs.gov/programs/VHP/pyroclastic-flows-move-fast-and-destroy-everything-their-path.
Valentine, G. A. (1987). Stratified flow in pyroclastic surges. Bull. Volcanol. 49, 616–630. doi:10.1007/BF01079967
Valentine, G. A. (1998). Damage to structures by pyroclastic flows and surges, inferred from nuclear weapons effects. J. Volcanol. Geotherm. Res. 87, 117–140. doi:10.1016/S0377-0273(98)00094-8
van Westen, C. L. (2011). “Risk analysis,” in Multi-hazard risk assessment (Netherland: United Nations University).
Voight, B. (1990). The 1985 Nevado del Ruiz volcano catastrophe: anatomy and retrospection. J. Volcanol. Geotherm. Res. 42, 151–188. doi:10.1016/0377-0273(90)90075-Q
Wadge, G., and Aspinall, W. P. (2014). “A review of volcanic hazard and risk-assessment praxis at the Soufrière Hills Volcano, Montserrat from 1997 to 2011,” in Memoirs (London, UK: Geological Society Publications), 439–456.
Waythomas, C. F., Pierson, T. C., Major, J. J., and Scott, W. E. (2013). Voluminous ice-rich and water-rich lahars generated during the 2009 eruption of redoubt Volcano, Alaska. J. Volcanol. Geotherm. Res. 259, 389–413. doi:10.1016/j.jvolgeores.2012.05.012
Wild, A. J., Wilson, T. M., Bebbington, M. S., Cole, J. W., and Craig, H. M. (2019). Probabilistic volcanic impact assessment and cost-benefit analysis on network infrastructure for secondary evacuation of farm livestock: a case study from the dairy industry, Taranaki, New Zealand. J. Volcanol. Geotherm. Res. 387, 106670. doi:10.1016/j.jvolgeores.2019.106670
Williams, G. T., Kennedy, B. M., Wilson, T. M., Fitzgerald, R. H., Tsunematsu, K., and Teissier, A. (2017). Buildings vs. ballistics: quantifying the vulnerability of buildings to volcanic ballistic impacts using field studies and pneumatic cannon experiments. J. Volcanol. Geotherm. Res. 343, 171–180. doi:10.1016/j.jvolgeores.2017.06.026
Woo, G. (2008). Probabilistic criteria for volcano evacuation decisions. Nat. Hazards 45, 87–97. doi:10.1007/s11069-007-9171-9
Woo, G. (2015). “Cost-Benefit analysis in volcanic risk,” in Volcanic hazards, risks, and disasters (Elsevier Inc). doi:10.1016/B978-0-12-396453-3.00011-3
Zanchetta, G., Sulpizio, R., Pareschi, M., Leoni, F., and Santacroce, R. (2004). Characteristics of May 5–6, 1998 volcaniclastic debris flows in the Sarno area (Campania, southern Italy): relationships to structural damage and hazard zonation. J. Volcanol. Geotherm. Res. 133 (1), 377–393. doi:10.1016/s0377-0273(03)00409-8
Keywords: volcanic hazards, vulnerability, environment, land use planning, physical risk
Citation: Córdoba GA, Costa A, Rodriguez DM, Thouret J-C, Criollo RA and Guerrero DA (2025) Assessing probabilistic hazard and risk for building, road network, and ecosystems: the case study of La Florida municipality, Galeras Volcano, Colombia. Front. Earth Sci. 13:1632282. doi: 10.3389/feart.2025.1632282
Received: 20 May 2025; Accepted: 24 July 2025;
Published: 26 August 2025.
Edited by:
Manoj Khandelwal, Federation University Australia, AustraliaReviewed by:
Carmen Jaimes Viera, National Autonomous University of Mexico, MexicoThomas Poulose, American Society of Civil Engineers, United States
Copyright © 2025 Córdoba, Costa, Rodriguez, Thouret, Criollo and Guerrero. This is an open-access article distributed under the terms of the Creative Commons Attribution License (CC BY). The use, distribution or reproduction in other forums is permitted, provided the original author(s) and the copyright owner(s) are credited and that the original publication in this journal is cited, in accordance with accepted academic practice. No use, distribution or reproduction is permitted which does not comply with these terms.
*Correspondence: A. Costa, YW50b25pby5jb3N0YUBpbmd2Lml0