 Lin-Feng Wang
 Xing-Fu Zhang
- 1School of Economics and Management, Anhui Jianzhu University, Hefei, Anhui, China
- 2School of Finance and Economics, Anhui Technical College of Industry and Economy, Hefei, China
Agriculture is an industry highly sensitive to geographical environments and their variations. Thus, geographical environments and variations also exert significant impacts on agricultural efficiency. Meanwhile, enhancing agricultural production efficiency is of paramount importance for ensuring food security and promoting sustainable rural development. This study employs a robust three-stage Data Envelopment Analysis (DEA) framework integrated with the Malmquist index to evaluate the agricultural efficiency of 16 cities in Anhui Province, China. By utilizing panel data spanning 2017 to 2021, the research systematically decomposes efficiency into pure technical, scale, and environment-adjusted components. Specifically, in the second stage, stochastic frontier analysis (SFA) is applied to isolate input slack variables influenced by external factors, including irrigation water consumption, rural household disposable income, and industrialization level, thereby refining DEA estimates to reflect true production efficiency. The findings reveal that after environmental adjustment, the average comprehensive efficiency increases from 0.827 in the first stage to 0.835 in the third stage, highlighting overestimation of efficiency in cities such as Bengbu, where the comprehensive technical efficiency (Crste) declines from 1.000 to 0.977, and underestimation in regions like Suzhou, where it rises from 0.890 to 1.000. Environmental factors exhibit heterogeneous impacts: rural disposable income is significantly negatively correlated with input slack at the 0.01 level, indicating that higher income motivates labor participation and planting expansion; industrialization is significantly positively correlated with input slack at the 0.01 level, suggesting that industrial development may crowd out agricultural resources. Irrigation water use demonstrates a geographic gradient, with higher consumption in rice-growing areas in the south than in wheat-growing areas in the north. Dynamic analysis shows that total factor productivity (TFP) grows at an average annual rate of 3.1 percent from 2017 to 2021, primarily driven by technological progress with an index of 1.017 (increased by 1.7%), while pure technical efficiency chang (pech) with an index of 1.004 (increased by 0.4%) and scale efficiency chang (sech) with an index of 1.010 make limited contributions. TFP peaks at 1.157 (increased by 15.7%) in 2019 and declines to 0.978 (decreased by 2.2%) from 2020 to 2021 due to global economic slowdowns. These findings lay the foundation for regional and national agricultural management initiatives and policies to enhance agricultural efficiency.
1 Introduction
Food security stands as a cornerstone of global stability and economic sustainability, with agricultural efficiency serving as a pivotal determinant of sustainable food production (Ma et al., 2021; Hu and McAleer, 2005; Liu et al., 2021; Valjarević et al., 2025). In recent years, the United Nations World Food Program has issued many reports, warning that the world is facing the most serious food security crisis in modern times. Wang et al. (1996) In China, where agriculture underpins the livelihoods of millions and ensures national food sovereignty. Currently, the issues of “non-agricultural conversion” and “non-grain production conversion” of cultivated land remain prominent in China. Concurrently, degradation of cultivated land quality persists in certain regions, coupled with uneven distribution of water resources. The growing demand for feed grains (such as corn and soybeans) and insufficient domestic production capacity constitute an urgent contradiction to be addressed. Additionally, the increasing frequency of extreme weather events poses significant threats to the stability of grain production. So enhancing production efficiency has become particularly urgent amid challenges such as shrinking arable land, environmental degradation, and rapid industrialization (Pan et al., 2021; Lu et al., 2022; Vlontzos et al., 2014; Liu et al., 2025). This study takes Anhui Province as a case to investigate agricultural production efficiency and its influencing factors, aiming to provide valuable references for subsequent research on agricultural efficiency. The findings contribute to the academic discourse on agricultural productivity by offering a replicable framework for identifying key drivers of efficiency and informing evidence-based policy formulations.
Located in the heart of East China, adjacent to the sea and along the Yangtze River, Anhui Province lies in the transition zone between northern and southern climates, serving as one of the birthplaces of agricultural civilizations in the Yangtze and Huaihe River basins in China. Anhui Province is geographically partitioned by the Huaihe River and the Yangtze River into three distinct regions with clear locational definitions: Northern Anhui, Southern Anhui, and the Jianghuai region. Northern Anhui refers to the area north of the Huaihe River, while Southern Anhui is defined as the region south of the Yangtze River. The Jianghuai region serves as a transitional zone lying between the Yangtze and Huaihe Rivers, acting as a geographic and climatic buffer between the northern and southern parts of the province. Its unique geographical position has made Anhui a convergence and integration zone for northern dry farming culture and southern paddy rice culture, endowing its agricultural civilization with the compatibility of both cultural systemsPolicy (2025). For instance, northern Anhui predominantly cultivates dry crops such as wheat and corn, while southern Anhui focuses on rice planting. This disparity exemplifies the collision and integration of northern and southern agricultural cultures in Anhui, providing a typical sample for studying the exchange and development of different agricultural cultures (Ying-Liang and Jiao-E, 2010; Liu et al., 2025). Anhui features a complex and diverse topography, with plains, hills, and mountains each accounting for one-third of its territory (Su and He, 2024; Liu et al., 2024). The Yangtze River and Huaihe River flow through Anhui for 416 km and 430 km, respectively. Such varied terrain has given rise to distinct agricultural production modes and landscapes. The vast plains in northern Anhui are suitable for large-scale mechanized dry farming, while the mountainous areas in southern Anhui and the hilly regions of Jianghuai—characterized by interlaced mountains, rivers, and lakes—have developed diverse agricultural types, including mountain forestry, paddy rice farming, and fishery in rivers and lakes. Anhui has a mean annual temperature of 14 °C–17 °C, annual precipitation of 700–1,700 mm, and a frost-free period of 200–250 days. However, as a transitional zone between northern and southern climates, it frequently experiences natural disasters such as floods, droughts, windstorms, hailstorms, and low-temperature freezing disasters. Essentially, the uniqueness of Anhui’s agriculture represents a human-land relationship sample shaped by both geography and climate, making it a natural laboratory for studying regional differentiation of agriculture, technological adaptation, and ecological compensation in China (Kepei and Baijun 2010). This regional disparities has fostered diversified agricultural production models, positioning Anhui as an ideal research subject for exploring regional efficiency disparities and their driving mechanisms.
Efficiency evaluation model is one of the research hotspots in academic circles (Zhu et al., 2018). Farrell was the first scholar who used linear programming to measure the efficiency of agricultural production, and he first proposed the prototype of DEA (Farrell, 1957). After that, Charnes, an operational scientist, formally put forward a DEA model to compare and contrast the performance of similar divisions (Charnes et al., 1978). The CCR model was their debut creation. This model is useful for studying production departments with many inputs and multiple outputs from the standpoint of the production function. But the CCR model presupposes a constant rate of return with increasing scale. In 1984, the BCC model, developed by Banker et al. (1984), was predicated on the idea that there are varied returns to scale. Since then, based on research into a concept of productive efficiency, the academic circles have further set off a research upsurge of agricultural production efficiency. Using super-efficient DEA model and the Malmquist index, Hou and Feng (2019), examined the agricultural production efficiency of 29 Chinese provincial areas from 1990 to 2016. Based on the results of the experiment, eastern regions have higher agricultural production efficiency than central and western regions, which both perform below the national average. Jiao (2013) employed the three-stage DEA model to assess the scale, technical purity, and overall efficiency of agricultural production in 17 cities around Shandong Province in 2011. The results showed that Shandong Province had a low rate of agricultural productivity as a whole, and scale efficiency was the main constraint. Based on this, some recommendations are made in order to increase Shandong Province’s agriculture output effectiveness. Song et al. (2008) take 31 provinces in China as samples, and use DEA dominant efficiency model and inferior efficiency model to evaluate agricultural production efficiency. After calculation, the ranking of agricultural comprehensive efficiency in each region is obtained. Through cluster analysis, the agricultural production efficiency is classified, compared and graded. Qi et al. (2015) used the field survey data of Jiangsu Province and the DEA-Tobit model to examine in depth how farmland movement affects the effectiveness of agricultural production. The research shows that farmland circulation is a useful strategy for increasing the productivity of agricultural enterprises.
This study employs a three-stage DEA model combined with the Malmquist index to evaluate agricultural efficiency in Anhui’s 16 cities. Unlike traditional approaches, the three-stage framework isolates the effects of environmental variables (irrigation water use, rural disposable income, and industrialization) through SFA, thereby enabling a more accurate assessment of “true” technical and scale efficiencies (Fried et al., 2002). Additionally, the Malmquist index is utilized to analyze dynamic changes in TFP from 2017 to 2021, providing insights into temporal trends and the drivers of efficiency growth.
The research objectives are threefold: (1) To measure agricultural efficiency in Anhui’s cities using a robust, environmentally adjusted DEA framework. (2) To identify the impact of key environmental factors on input slack and efficiency disparities. (3) To assess temporal changes in TFP and decompose them into technical progress and efficiency improvements.
By integrating static and dynamic analyses, this study aims to provide empirical evidence for policymakers to design region-specific strategies that enhance agricultural efficiency and sustainability in Anhui Province. The research not only offers a scientific basis for formulating new agricultural policies to improve policy-making rationality but also provides a replicable methodological framework for regions with similar geographical diversity. These contributions hold significant reference value for scholars engaged in agricultural efficiency research, facilitating the generalization of findings to broader contexts and supporting evidence-based decision-making in agricultural management.
2 Methods and data of research
2.1 Three-stage DEA model
By integrating DEA and SFA in three stages, as recommended by Fried et al., random chance or the influence of outside forces are removed from the efficiency value, leading to more precise measurement findings Fried et al. (2002). The model’s detailed steps are depicted in Figure 1.
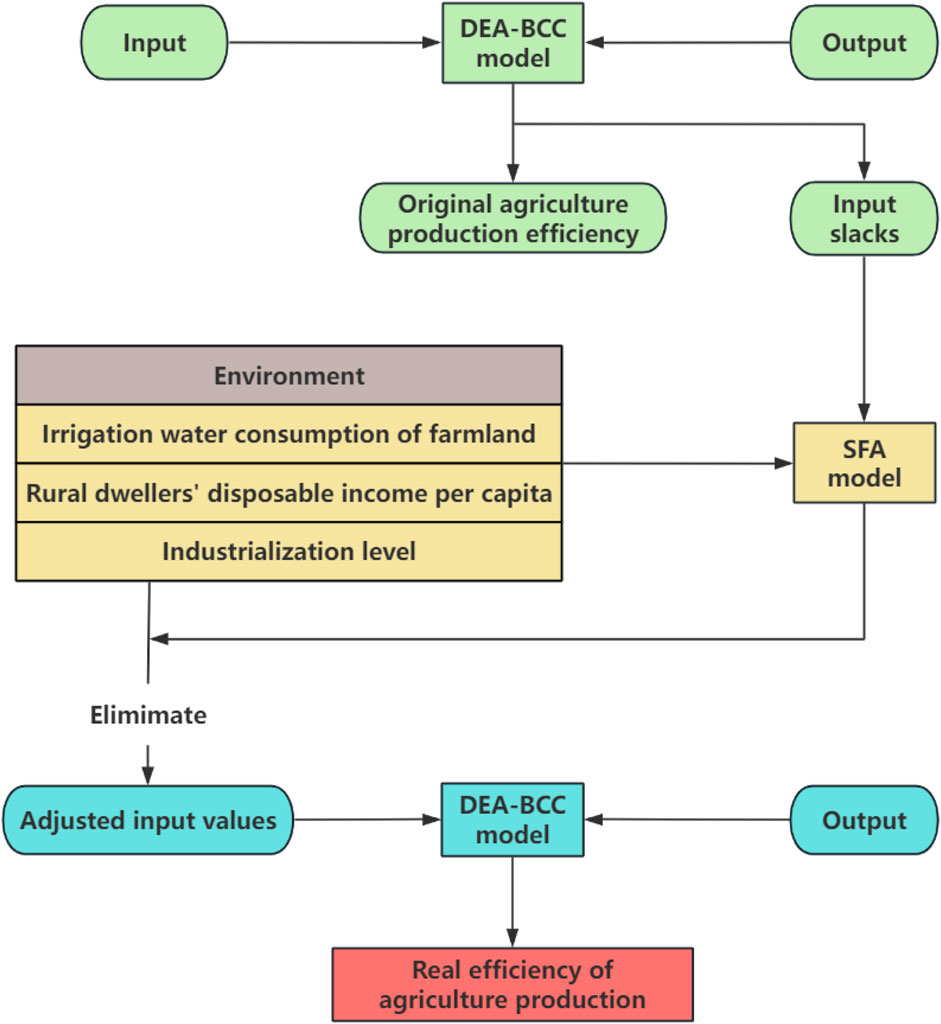
Figure 1. Methodological framework of the evaluation of agricultural production.
2.2 The first stage
The input-oriented BCC model is represented as Equations 1–5.
In this model, the decision-making unit is represented by
2.3 The second stage
At the outset, the agricultural production efficiency score and the intended value for each input can be obtained, so that the relaxation value of each input can be calculated (Fuentes et al., 2016; Song et al., 2020). Taking environmental variables as explanatory variables and input relaxation values as explained variables,the SFA model is constructed. According to Fried et al. (2002), specifying the model with a half-normal distribution is more appropriate, as it better aligns with the current data characteristics and result requirements. The function is expressed as Equation 6.
This is an example of a quote.
where the relaxation value for the
The following formula can be used for further calculations.
where
In Equation 7,
2.4 The third stage
At this stage, we utilize the adjusted input-output variables to reassess the efficiency scores of DMUs through the one-stage DEA model. Comparative analysis demonstrates that the efficiency estimates generated in this phase exhibit significant improvements in both validity and reliability when compared to the initial DEA results. This enhancement is attributed to the effective control of external environmental variables and stochastic disturbances, which is achieved through the following procedures: First, homogeneous adjustments are made to the input quantities of all DMUs based on environmental impact coefficients; subsequently, the adjusted input variables are reintroduced into the DEA model for re-evaluation. This approach effectively isolates exogenous interferences, enabling the efficiency measurements to more accurately reflect the managerial performance of DMUs. Consequently, it provides a more robust empirical foundation for subsequent policy analysis.
2.5 Malmquist index model
Solely relying on static DEA to assess efficiency scores fails to capture dynamic trends (Coelli and Rao, 2005; Zhang et al., 2015). To provide a more comprehensive and intuitive assessment of agricultural development in Anhui Province, this study incorporates the Malmquist index approach alongside static analysis (Thrall, 2000; Afsharian and Ahn, 2015). By examining intertemporal changes in efficiency scores, this method enables in-depth analysis of agricultural performance, facilitating the derivation of specific remedial measures to promote the healthy development of Anhui’s agriculture. The Malmquist index primarily focuses on total factor productivity change (tfpch), which is decomposed into two components: technical efficiency change (effch) and technical progress change (techch). Specifically, tfpch is the product of effch and techch, allowing for a granular decomposition of productivity growth into efficiency improvements and technological advancements. Tfpch measures the comprehensive change in productivity across periods, effch reflects the alteration in “technical efficiency” of production units from period
The Malmquist index is described by
In Equation (8),
As shown as Equation 9, the first term represents the technical efficiency change index (TEC), which mainly represents the utilization efficiency of the decision-making unit to the current technology. The second item represents the technical progress change index (TPC). If the TEC value is larger than 1, then DMU is on the cutting edge of manufacturing, and technical effectiveness has increased. If TEC is less than 1, it means that the DMU is not ideal for the current technology utilization effect. Among them, TEC is made up of two components: PECH and SECH (Hou and Feng, 2019).
2.6 Indicator selection and data sources
2.6.1 Indicator selection
According to the consistency and availability of index selection, this paper finally decided to take the total output value of farms, forests, livestock, and fisheries (10,000 yuan) as the output index to measure agricultural production efficiency. Secondly, considering the factors that affect agriculture output efficiency and synthesizing the existing research, the employees in the farming, forestry, livestock, and fishing industries (people), the planting area of grain crops (hectares) and the combined output of farm equipment (10,000 kW) are selected as input variables from the perspectives of manpower, land and material resources Färe and Zelenyuk (2021). Studies have shown that grain production occupies a core position in the agricultural structure of Anhui Province, with its land use scale accounting for a significant proportion of the total agricultural land. This agricultural pattern based on grain production enables the planting area of grain crops to, to a large extent, reflect the overall scale and utilization intensity of agricultural land, and it has a strong correlation with the overall resource input in agricultural production (such as labor and agricultural machinery). Secondly, grain production has a close resource linkage with fishery and animal husbandry. The planting of grain crops not only directly contributes to agricultural output, but their products (e.g., feed grains) also provide key raw materials for animal husbandry, indirectly supporting the development of fishery and animal husbandry. Therefore, the planting area of grain crops in the input indicators can indirectly reflect the development of fishery and animal husbandry.
From a study carried out by Wang Lei et al., environmental variables significantly impact how well agriculture is produced (Wang et al., 2019). Considering the study literature now in use and the current state of particular locations in Anhui Province, In this paper, three indicators (irrigation water consumption (100 million cubic meters), per capita disposable income of rural residents (yuan) and industrialization level
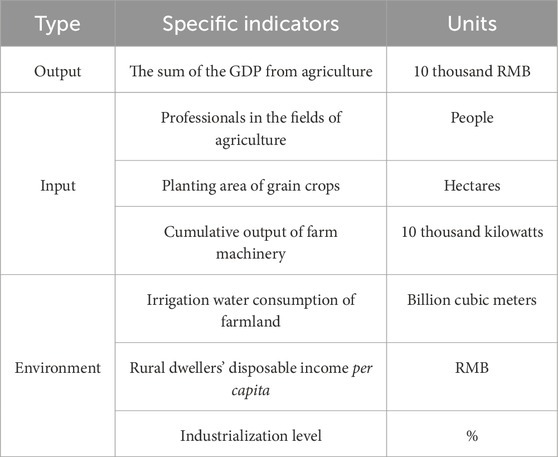
Table 1. Index.
3 Empirical results and analysis
3.1 The first stage DEA analysis
The effectiveness of agricultural output in 16 cities of Anhui Province from 2017 to 2021 is measured by DEAP 2.1 software, and the influence of circumstance and chance are not taken into consideration at this stage. Through calculation, the crste, pure technical efficiency (vrste) and scale efficiency (scale) of the first stage are obtained, where crste = vrste
As can be observed within Table 2 and Figure 2, the province of Anhui’s agricultural production has an average scale efficiency of 0.915, a mean pure technical efficiency of 0.910, and an average Crste of 0.827. At the same time, it can be seen that four regions have reached the optimal efficiency, and the other 12 regions still have room for improvement, indicating that these regions have problems of low efficiency and unreasonable resource input. However, the initial step of the DEA model analysis does not completely account for the effects of random and environmental factors. As a result, it’s hard to provide a reliable depiction of the efficiency with which each city in Anhui Province produces agricultural goods. So, the SFA regression analysis is performed in a second stage. In Table 2, the symbols
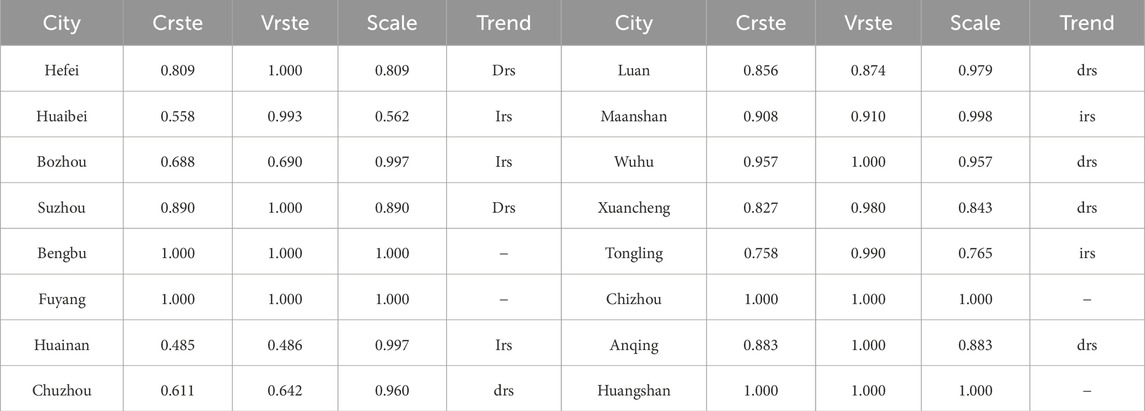
Table 2. Variables for measuring agricultural productivity.

Figure 2. Histogram of agricultural production efficiency in the first stage.
3.2 Analysis of SFA regression results in the second stage
Using the three chosen environmental variables as explanatory variables, and the input relaxation variables obtained from the first stage DEA model as explained variables (Gan et al., 2022; Zhang et al., 2021. The SFA regression analysis was carried out with Frontier4.1 (Zhou and Yu, 2021). The outcomes are displayed in Tables 3–5.
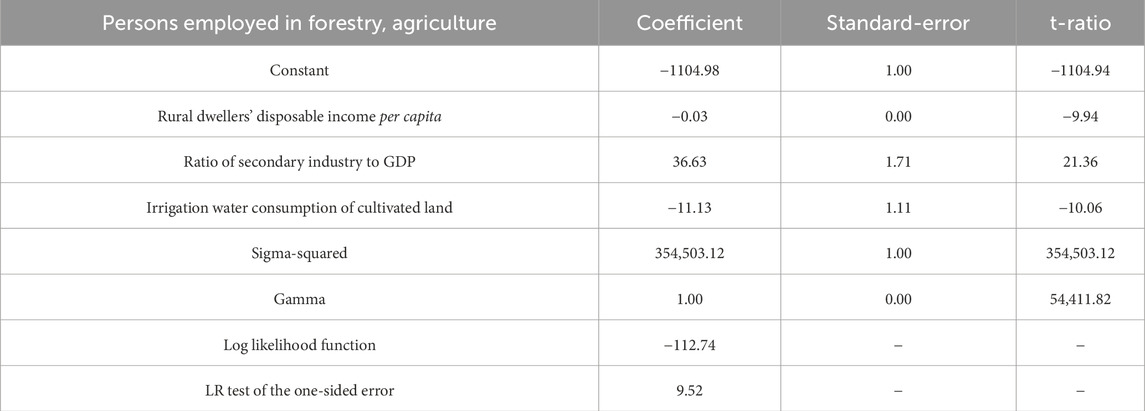
Table 3. Input 1 SFA regression results.
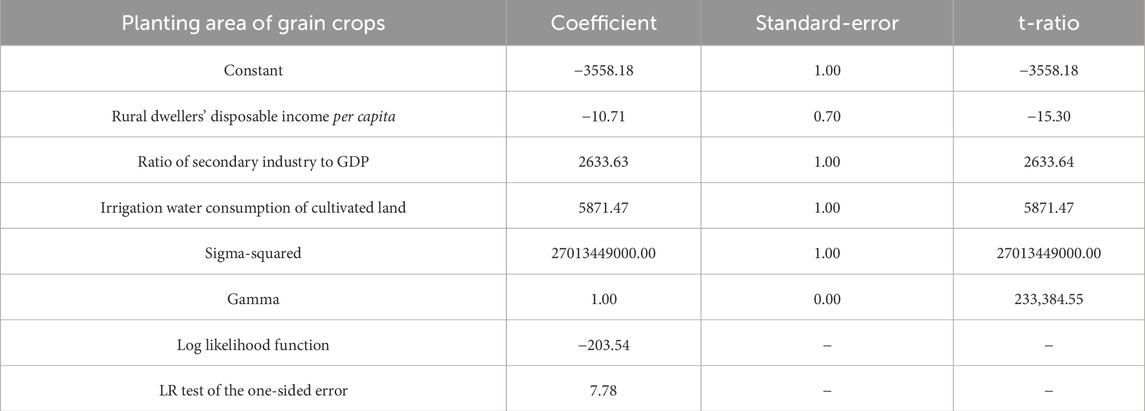
Table 4. Input 2 SFA regression results.
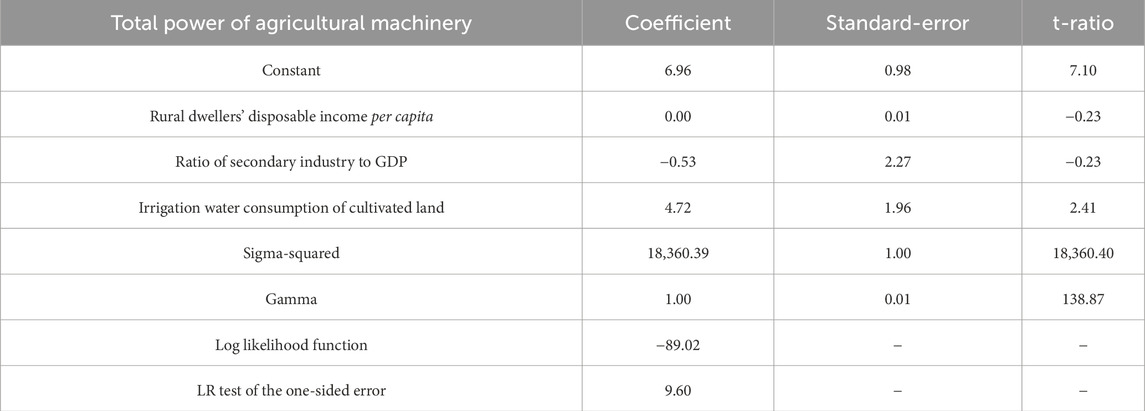
Table 5. Input 3 SFA regression results.
As can be observed, the gamma value is quite close to 1, which suggests that each ideal input is affected by environmental influences outside of the system. All of the LR values have passed the unilateral likelihood ratio test of 10%, indicating that external factors have affected the production efficiency in agriculture across Anhui Province’s many regions to varying degrees, which shows the necessity of the second SFA regression (Huang et al., 2023). Secondly, the correlation coefficient between various environmental variables and input relaxation variables shows environment’s impact on input variables, and the positive coefficient shows that a rise in environmental variables causes a rise in input relaxation value, which will reduce efficiency. The negative coefficient indicates that the input relaxation value decreases as environmental variables rise, that is, the increase of environmental value will be beneficial to agricultural production. Next, we discuss the SFA regression results of the three input variables one by one.
3.2.1 Impact of rural per capita discretionary income on input slack variables
From Tables 3–5, it is clear that rural residents’ per capita disposable income passed the significance tests of 2.5% for the number of employees in the agricultural, forestry, animal-rearing, and fishing industries, as well as 1% for the area planted with grain crops, but failed the test for the combined output of farm equipment. On the whole, the coefficient of this variable to the relaxation variable of employed farmers, foresters, animal farmers, and fishermen and the number of grain crops planted area is negative, which shows that the increase of remote inhabitants’ average annual disposable income can enhance citizens’ fervor for production to a certain extent, the total number of people working in agriculture increases, and the area of grain crops planted increases, which is conducive to improving agricultural production efficiency.
3.2.2 Industrialization level’s impact on input slack variables
According to Tables 3–5, The percentage of the population engaged in tree planting, crop cultivation, fisheries, and livestock raising, as well as the consumption of irrigation water for cultivated land, has been found to be statistically significant at the 1% level, but it is not significant with other relaxation variables. Irrigation water consumption of cultivated land is affected by local rainfall and geographical location. The coefficient of grain crop planting area is positive, which shows that excessive irrigation water consumption will lead to the reduction of grain planting area to a certain extent, which is one of the reasons for planting rice in the south of Huaihe River and wheat in the north of Huaihe River, which is consistent with the current circumstances. The coefficient of the relaxation variable of employment in horticulture, forestry, livestock, and fishing is negative, indicating that there are more people engaged in agricultural production in areas with abundant rainfall.
3.2.3 Effect of cultivated land irrigation water consumption on various input relaxation variables
According to Tables 3, 4, we can see that the irrigation water consumption of cultivated land is statistically significant at the 1% level for the number of employed people in farming, forestry, livestock and fishery as well as agricultural land used for growing cereals, but it is not significant with other relaxation variables. Irrigation water consumption of cultivated land is affected by local rainfall and geographical location. The coefficient of grain crop planting area is positive, which shows that excessive irrigation water consumption will lead to the reduction of grain planting area to a certain extent, which is one of the reasons for planting rice in the south of Huaihe River and wheat in the north of Huaihe River, which accords with the current state of affairs. As shown by the negative coefficient of the relaxation variable for employment in agriculture, forestry, animal husbandry and fisheries, more people are employed in agricultural production in regions with high rainfall.
3.3 Efficiency analysis after adjusting input during the third phase
Reuse the modified input variables from the second phase with DEAP 2.1. Table 6 and Figure 3 displays the effectiveness score determined by the DEA-BCC model calculation. In Table 6, the symbols
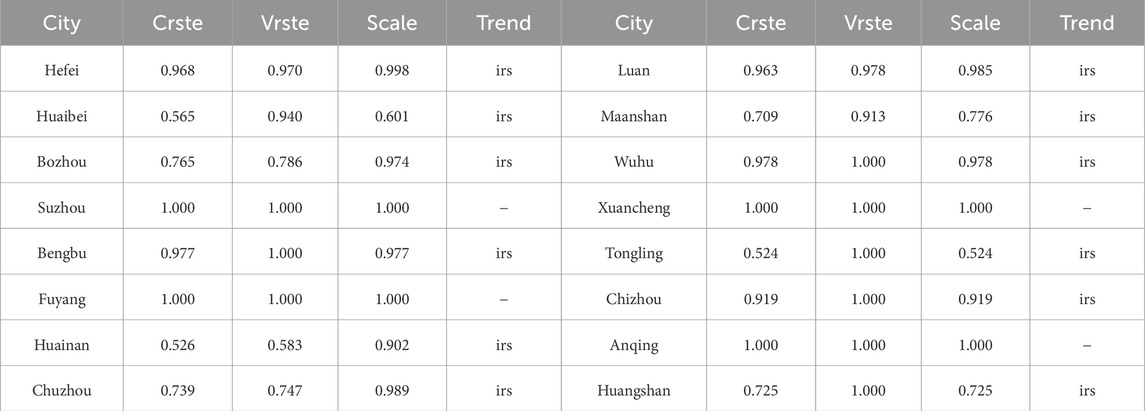
Table 6. Variables for measuring agricultural productivity.
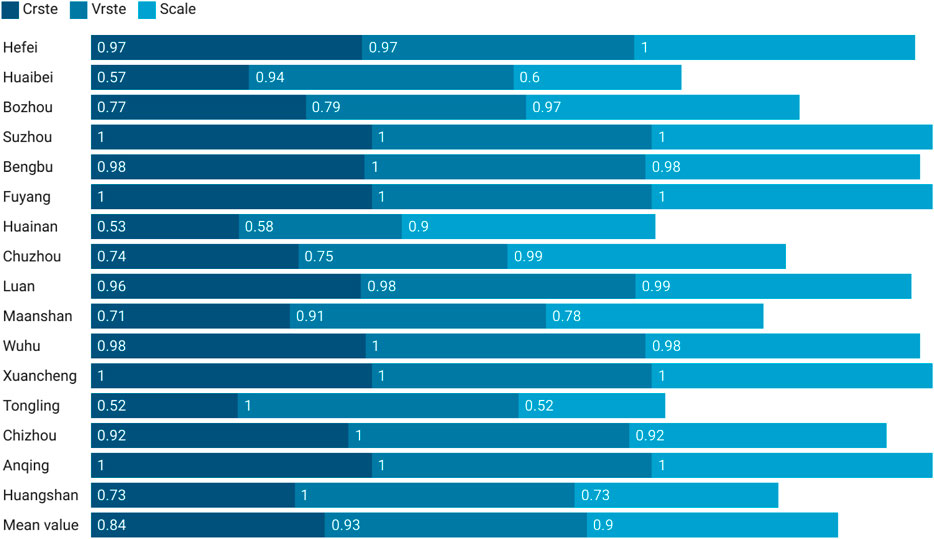
Figure 3. Histogram of agricultural production efficiency in the third stage.
By comparing Tables 3, 6, it is evident that, on the whole, after excluding environmental factors and random factors, the comprehensive efficiency value, pure technical efficiency and scale efficiency of each city in Anhui Province have changed to varying degrees. In addition, there is a correlation between the efficiency rating of each prefecture-level city in Anhui Province and the influence of both environmental factors and random elements. Comparing each city’s efficiency scores, it is evident that the efficiency values of most regions have declined. In the first stage, some areas have reached the frontier of production efficiency, but after eliminating environmental and random factors in the second stage, these areas have not reached the frontier of production, such as Bengbu, Chizhou and Huangshan. It shows that the effectiveness of agricultural output is overestimated in the first stage. Fuyang has reached the production frontier in the first and third stages of DEA, which shows that the city has reached the real optimal efficiency. In the third stage, Suzhou, Xuancheng and Anqing reached the optimal agricultural production efficiency, showing that the first stage’s estimate of their efficiency was too low. The pure technical efficiency increased from the first to the third stage from 0.91 to 0.932, while the scale efficiency went down from 0.915 to 0.897 and the overall efficiency rose to 0.835. It shows that the province of Anhui’s purely technological efficiency as a whole is underestimated in the first stage. Generally speaking, agricultural production efficiency is closely related to agricultural technology input, resource utilization and agricultural production scale.
Taking the efficiency value of 0.9 as the critical point of superior performance, in light of the distinction of scale efficiency and pure technological efficiency, the agricultural production efficiency of Anhui can be divided into four types. The scale efficiency and pure technical efficiency of the first type, which is known as the double high type, are both above 0.9, including Suzhou, Fuyang, Xuancheng and Anqing, which are at the forefront of technical efficiency, in addition to Hefei, Bengbu, Lu’an, Wuhu and Chizhou, where the agricultural production level is higher and the improvement is smaller. Most of these areas are located in the plains, which is more conducive to agricultural cultivation. The second type is pure technical efficiency type, that is, pure technical efficiency is greater than 0.9, while scale efficiency is less than 0.9, such as Huaibei, Ma’anshan, Tongling and Huangshan, whose agricultural production efficiency should be improved in the direction of scale efficiency, and the primary goals of the reform are to increase the scale of agricultural production and implement centralized resource allocation. The third type is scale efficiency type, that is, pure technical efficiency is below 0.9 but scale efficiency is above 0.9, such as Bozhou, Huainan and Chuzhou, which should highlight enhancement of pure technical efficiency and technical management level in the follow-up development. It is also related to the region that the pure technical efficiency in these areas is not effective. The topography of southern Anhui is mainly mountainous and hilly, which is not conducive to the cultivation of crops compared with the plain. The fourth kind is doubly low, which means that both pure technical efficiency and pure scale efficiency are less than 0.9. Agricultural production conditions in these areas are often poor, agricultural labor productivity and land output rate are low, so in the direction of improving agricultural production efficiency, we should not only improve the state of agricultural production technology and science, but also strengthen the cultivation of new professional farmers. Prioritize expanding agricultural output. There are no such cities in this study. Finally, according to the map of Anhui Province, we can see that geographical location has little effect on the effectiveness of prefecture-level cities’ agricultural production in Anhui Province. Fuyang, which is also located to the north of the Huaihe River, has advanced to the forefront of agricultural production, but Bozhou is inefficient. See Figures 4, 5 for details. In Figure 5, the first half of the abscissa indicates the first stage and the second half represents the third stage. From the calculation results of the past years, the provincial agricultural efficiency changes are still very large, and the gap between the municipalities is also very large, which has great research value. Therefore, it is also very informative for the government and and society to compute the data, providing important references when formulating relevant policies.
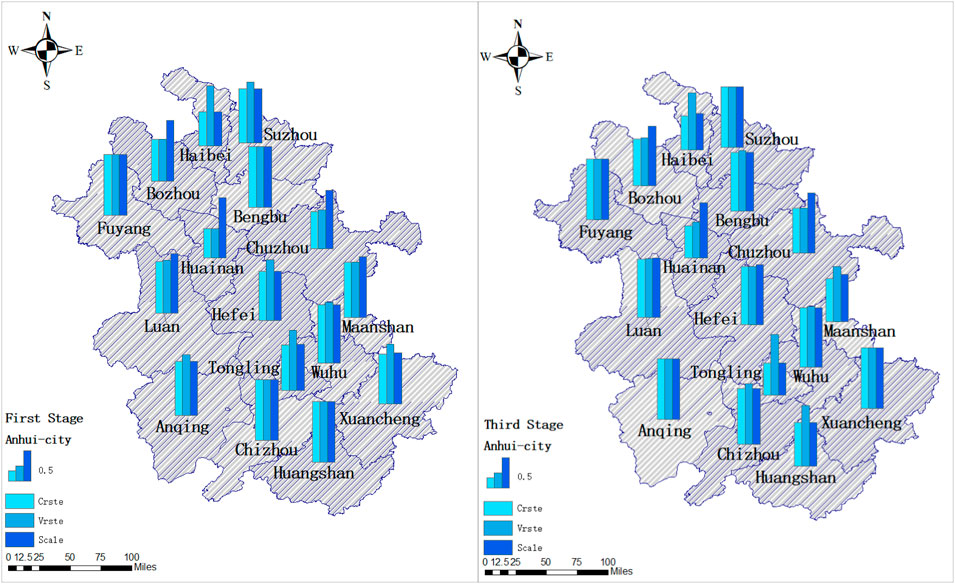
Figure 4. Efficiency comparison of the first and third stages in Anhui regions.
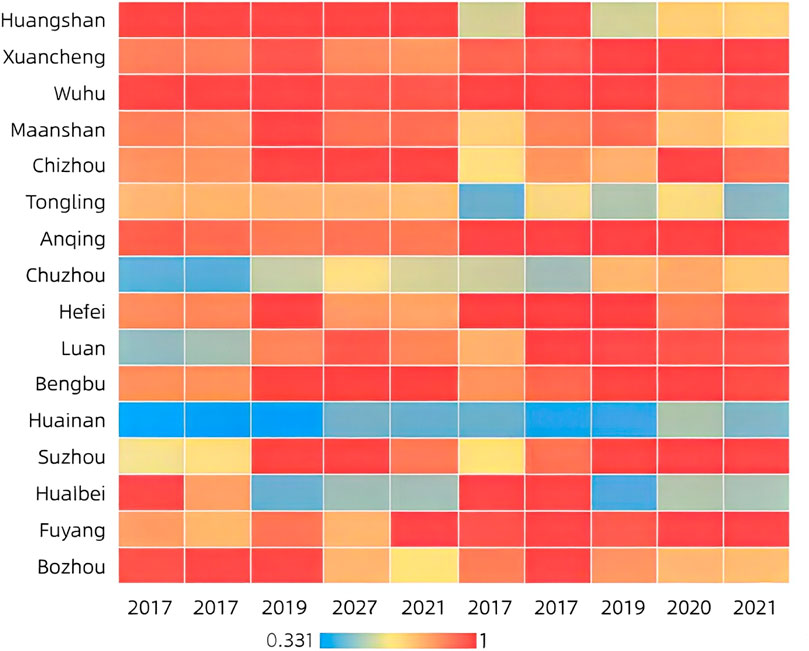
Figure 5. The detailed efficiencies for Anhui Province during 2017–2021.
Overall, environmental and random variables have different impacts on the cities in Anhui Province, but they do have some effect on the economy of agriculture in some ways. This further illustrates the need to examine the efficiency of urban agricultural production in Anhui Province using the three-stage DEA model.
3.4 Malmquist index analysis
DEA static analysis can not show continuous dynamic changes. In order to clearly and actively reflect the overall development of agriculture in the province from 2017 to 2021, the efficiency value is dynamically analyzed in this work using the Malmquist index approach, and directional solutions are then provided.
As displayed in Tables 7, 8, the change ranges of effch, techch, sech, tpch and just techch estimated by the traditional model are 0.26, 103.753, 0.147, 0.215 and 104.834, respectively. The change ranges of the parameters calculated by the three-stage model are 0.23, 0.101, 0.109, 0.201 and 0.283, respectively. By comparison, techch and tfpch both change rapidly, indicating that random and environmental factors affect these two measures significantly. When the pech is more than 1, it is evident that the advancement of technical level has been the primary factor in recent efficiency increase. When the change rate of scale efficiency is greater than 1, it may be associated with the composition of the economy’s industrial base and the state of its development.
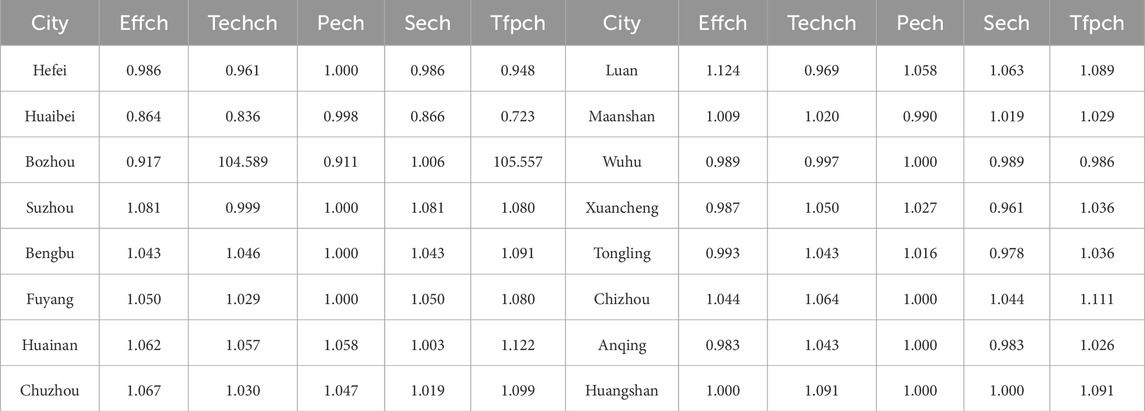
Table 7. Variables for measuring agricultural productivity.
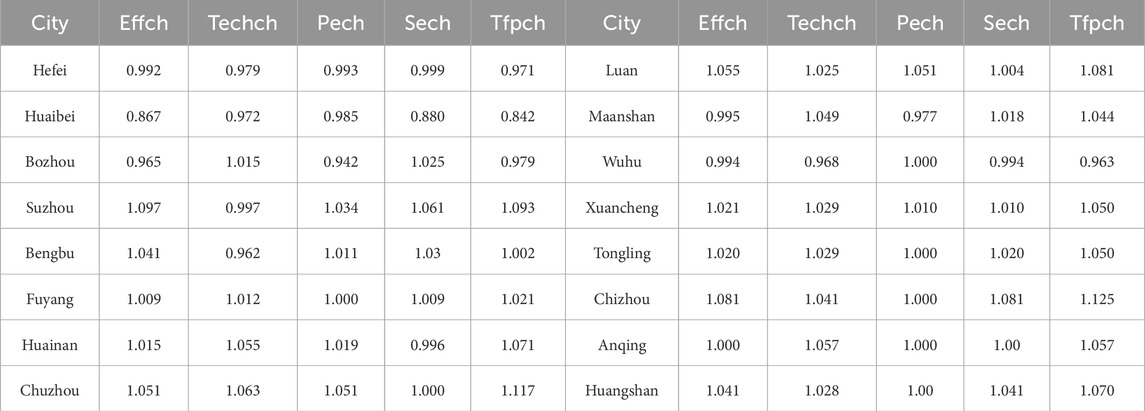
Table 8. Malmquist index of overall agricultural production efficiency in Anhui province after adjustment, 2017–2021.
From Tables 9, 10, it’s obvious that the average comprehensive change rate of agricultural production in Anhui Province has increased by 0.003. And that average of the five change rate is greater than 1 both in the first and third stages. Thus, to sum up, the values of these five change rates before and after the change are all higher than the optimal frontier, but the rate of change in technical effectiveness and total factor output are obviously unreasonable in the first stage, which illustrates the importance of the SFA regression stage. For details, please refer to Figure 5. The first stage is represented by a line chart, and the third stage is represented by a bar chart. In the third stage, as depicted in Figure 6, in the third stage, the tfpch values from 2017 to 2021 were 0.981, 1.018, 1.157, and 0.978, respectively. The effch values during the same period remained relatively stable at 1.115, 0.933, 1.046, and 0.971. In contrast, both techch and tfpch exhibited more pronounced fluctuations, with their trends showing a high degree of congruence. This indicates that the tfpch index is significantly influenced by technological factors. After 2019, both the techch and tfpch values increased notably but experienced a decline again between 2020 and 2021. This fluctuation can be attributed to the slowdown in global economic growth in recent years, which has led to reduced investment growth and consequently dampened technological progress. The techch values from 2017 to 2021 were 0.88, 1.09, 1.106, and 1.008, respectively, with only the 2017–2018 period registering a value less than 1. This suggests an overall upward trajectory in technological capabilities in recent years.

Table 9. Malmquist index before adjustment, 2017–2021.
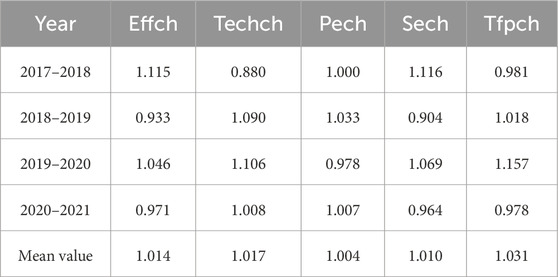
Table 10. Malmquist index after adjustment, 2017–2021.
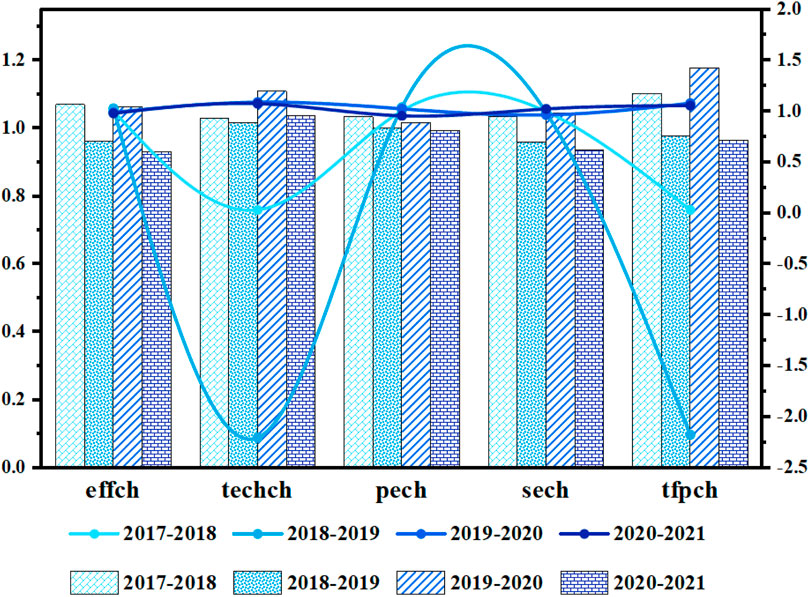
Figure 6. Comparison chart of dynamic changes in the first and third stage.
Taking 1 as the boundary, 16 cities are divided into four categories according to pech and sech, as depicted in the scatter diagram of Figure 7. The first type of city is the high category, which means that the pech and sech of the region are in excess of 1. From the efficiency results of the third stage, the high category cities include Suzhou, Bengbu, Fuyang, Chuzhou, Lu’an, Xuancheng, Tongling, Chizhou, Anqing and Huangshan. The second category of cities is high and low category. When outside factors and noise are taken into account, Huainan and Wuhu enter the high and low category. There is a need to increase the scale efficiency of these urban areas. “Double low” cities are the third category, falling short of the ideal frontier in terms of both pure technical efficiency and scale efficiency. This type of cities only include Hefei and Huaibei. The fourth category of cities is low-high category, which includes Bozhou and Ma’anshan. The scale efficiency of the fourth type of cities has reached the efficiency effective line, but in terms of bare technical efficiency, there is still potential for development. According to the map of Anhui Province, the cities north of the Huaihe River are Fuyang, Suzhou, Bozhou and Huaibei. Hefei, Bengbu, Huainan, Chuzhou and Lu’an are located on the border of the Huaihe River. Xuancheng and Huangshan are located south of the Huaihe River. It can be seen that the difference of geographical location is not the main factor affecting the low agricultural output effectiveness in a few cities of Anhui Province. For example, Fuyang and Huaibei, which are all located in the north of Huaihe River. Fuyang have excellent agricultural production performance, while there is space for growth in Huaibei’s technological and scale efficiencies.
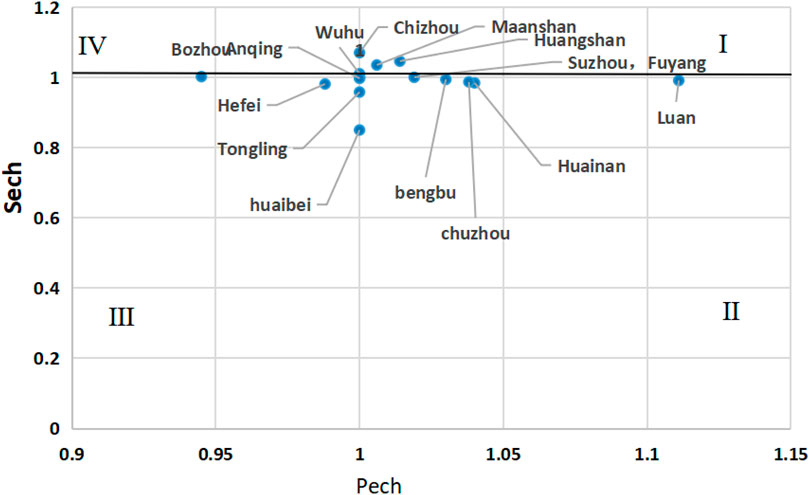
Figure 7. Comparison chart of Pech and Sech.
4 Conclusions and policy recommendations
4.1 Conclusions
This research aims to conduct an empirical examination to determine how well the cities of Anhui Province are doing when it comes to agricultural output, which depending on the three-stage DEA model, and draws the following conclusions.
Firstly, through the second stage of SFA regression analysis, we can see that remote inhabitants’ median disposable income, utilization of irrigation water on agricultural land and the degree of industrialization can affect the number of workers in forestry, fisheries, agriculture, and animal husbandry and the area of grain planting to a certain extent. In a particular sense, rural people’ ardour for production can be boosted by more per capita disposable income, which can also lead to more agricultural workers being employed, and increase the planting area of grain crops, which favors enhancing the effectiveness of agricultural production. Excessive irrigation water consumption will lead to the reduction of grain planting area to a certain extent, which is also one of the reasons why rice is planted in the south of the Huaihe River and wheat is planted in the northern Huaihe River. As the level of industrialization rises, fewer workers will be needed to harvest crops and raise livestock, which is not conducive to agricultural production.
Secondly, in general, in the third stage of the DEA model, each city in Anhui Province has experienced a dramatic shift in its efficiency value from the first stage, with both the comprehensive efficiency value and the pure technical efficiency decreasing to varied degrees, which more truly and accurately reflects each city’s ability to produce food in the province of Anhui. Thus it also shows the importance and necessity of SFA regression in the second stage.
Thirdly, in Huaibei, Ma’anshan, Tongling and Huangshan, the agricultural production efficiency is not DEA effective mainly because the scale efficiency is not optimal. While in Bozhou, Huainan and Chuzhou, agricultural production efficiency falls short of the production frontier mostly due to subpar pure technical efficiency. And in Suzhou, Fuyang, Xuancheng and Anqing, it is DEA effective. Combined with the geographical location of these cities, we can see that some cities at the prefecture level have low agricultural efficiency not primarily due to geography or natural precipitation.
Finally, the agricultural TFP value was dynamically analyzed in Anhui Province from 2017 to 2021 using the Malmquist index method. Considering the trend in efficiency evolution, how effectively technology is developing is the core factor to promote the rise of agricultural TFP value, and technical efficiency has become the key factor to restrict its development. Therefore, the core of agricultural development in the whole province lies in technical efficiency, and technical input should be increased in the later development. Strengthen the scientific and technological foundations of agriculture, compensate for the shortcomings and weaknesses of development, and then give a strong impetus to agriculture’s advancement in the province.
Using the aforementioned conclusions, it can be seen that the gap between agricultural regional productivity in Anhui Province is obvious, and the problems of imbalance and inadequacy are more prominent. To improve agricultural production efficiency across different Anhui Province regions, we need to adjust measures to local conditions, make up for its shortcomings and strengthen its weaknesses according to the differences of agriculture among regions.
The theoretical contributions of this study are as follows: by combining the three-stage DEA model with the Malmquist index, it effectively isolates the impacts of environmental factors and stochastic disturbances on agricultural efficiency through SFA, thereby improving the methodological framework for evaluating agricultural production efficiency. In particular, it provides a referential analytical paradigm for studying the differentiation of agricultural efficiency in geographical and climatic transition zones (such as the Jianghuai region of Anhui Province) and enriches the theoretical connotation of the dynamic evolution of agricultural total factor productivity under resource constraints. The practical value is reflected in clarifying the actual levels of agricultural efficiency and constraining factors in different cities, which provides precise basis for formulating region-specific policies. Meanwhile, it reveals the impacts of rural income improvement and moderate industrialization on agricultural resource allocation, offering empirical support for coordinating the relationship between industry and agriculture and ensuring food security. The limitations of the study mainly include: the selection of environmental variables is still limited, failing to incorporate key factors such as extreme weather and agricultural policies; the spatial spillover effects of agricultural efficiency among cities are not considered, which may ignore the impacts of regional linkage; the time span is relatively short, making it difficult to reflect structural changes in long-term trends. Future research can expand the dimension of environmental variables, introduce spatial econometric methods to analyze regional correlations; extend the observation period and combine panel models to explore long-term driving mechanisms; and attempt to integrate machine learning algorithms to improve the accuracy of efficiency evaluation, so as to provide more detailed theoretical support and policy references for agricultural sustainable development.
4.2 Policy recommendations
First of all, according to the analysis of empirical results, the water consumption of irrigated farmland in 16 cities in Anhui Province negatively affects the area where grain crops are planted. Therefore, cities near the Huaihe River and the Yangtze River Basin should develop a variety of agricultural products according to local conditions Chen et al. (2017). The level of industrialization will make the input relaxation variable bigger, which is not helpful for increasing the effectiveness of agricultural production. Therefore, the government should rationally allocate resources, fully consider external factors, rationally introduce science and technology, optimize the agricultural investment structure, and actively introduce talents, so as to achieve the ongoing increase in agricultural production effectiveness.
Secondly, according to the research, raising the per capita disposable income in rural areas might encourage more people to launch enterprises in their hometowns and inspire farmers to raise production, both of which are beneficial for raising agricultural output efficiency. Therefore, authorities need to reasonably formulate policies on talent subsidies and incentives for talents to contribute to the countryside, encourage the younger generation not to forget their family roots, and the residents staying in the countryside to actively participate in farming activities, and at the same time consider environmental factors to jointly improve the per capita disposable income (Wang et al., 2015).
Thirdly, natural conditions in some areas are not conducive to agricultural planting, such as hilly areas in central Anhui, so agricultural production efficiency in some cities in this area is low, such as Huainan, Chuzhou and Tongling. Governments in these areas should encourage residents to plant more crops suitable for hilly and lake environments, such as rice and freshwater aquaculture. Northern Anhui has a large number of plains, which are better suited for agricultural planting, hence its agricultural output efficiency is relatively greater. However, it is also located in northern Anhui, although Huaibei’s agricultural production efficiency is not perfect, Fuyang’s has surpassed it in terms of production efficiency. With similar geographical location and natural conditions, cities with poor agricultural production should take the initiative to learn from cities with high agricultural production efficiency. For example, Huaibei government should refer to Fuyang’s agricultural production policy and improve its own shortcomings.
Last but not least, some cities, such as Huangshan and Xuancheng, have low agricultural production efficiency, which may be affected by the flood period. In these cities, a series of flood control and disaster reduction measures should be actively taken, such as building water conservancy projects and improving water storage systems, so as to lessen the harm and economic losses from flood disasters in agriculture. Next, the causes of local floods should be taken into consideration by the authorities, find out the rules and time of floods in each basin, and make preparations in advance, thus reducing the damage and losses caused by the next flood to agriculture. In the meantime, after the flood, it is best to plant rice in these areas. Since rice is a crop with very high water requirement, fertilizer can be fixed on the land to prevent loss, and at the same time, rice can purify water quality and help soil restoration.
Data availability statement
The original contributions presented in the study are included in the article/Supplementary Material, further inquiries can be directed to the corresponding author.
Author contributions
L-FW: Writing – review and editing, Formal Analysis, Software, Data curation, Writing – original draft. X-FZ: Resources, Investigation, Writing – original draft, Funding acquisition, Project administration.
Funding
The author(s) declare that financial support was received for the research and/or publication of this article. This article is supported by the Quality Engineering Project of Anhui Provincial Colleges and Universities, project number: 2023hxkc085.
Conflict of interest
The authors declare that the research was conducted in the absence of any commercial or financial relationships that could be construed as a potential conflict of interest.
Generative AI statement
The author(s) declare that no Generative AI was used in the creation of this manuscript.
Any alternative text (alt text) provided alongside figures in this article has been generated by Frontiers with the support of artificial intelligence and reasonable efforts have been made to ensure accuracy, including review by the authors wherever possible. If you identify any issues, please contact us.
Publisher’s note
All claims expressed in this article are solely those of the authors and do not necessarily represent those of their affiliated organizations, or those of the publisher, the editors and the reviewers. Any product that may be evaluated in this article, or claim that may be made by its manufacturer, is not guaranteed or endorsed by the publisher.
Supplementary material
The Supplementary Material for this article can be found online at: https://www.frontiersin.org/articles/10.3389/feart.2025.1633859/full#supplementary-material
References
Afsharian, M., and Ahn, H. (2015). The overall malmquist index: a new approach for measuring productivity changes over time. Ann. Operations Res. 226, 1–27. doi:10.1007/s10479-014-1668-5
Arnade, C. (1998). Using a programming approach to measure international agricultural efficiency and productivity. J. Agric. Econ. 49, 67–84. doi:10.1111/j.1477-9552.1998.tb01252.x
Banker, R. D., Charnes, A., and Cooper, W. W. (1984). Some models for estimating technical and scale inefficiencies in data envelopment analysis. Manag. Sci. 30, 1078–1092. doi:10.1287/mnsc.30.9.1078
Charnes, A., Cooper, W. W., and Rhodes, E. (1978). Measuring the efficiency of decision making units. Eur. J. Operational Res. 2, 429–444. doi:10.1016/0377-2217(78)90138-8
Chen, L., Wang, Y., Lai, F., and Feng, F. (2017). An investment analysis for china’s sustainable development based on inverse data envelopment analysis. J. Clean. Prod. 142, 1638–1649. doi:10.1016/j.jclepro.2016.11.129
Coelli, T. J., and Rao, D. P. (2005). Total factor productivity growth in agriculture: a malmquist index analysis of 93 countries, 1980–2000. Agric. Econ. 32, 115–134. doi:10.1111/j.0169-5150.2004.00018.x
Färe, R., and Zelenyuk, V. (2021). On aggregation of multi-factor productivity indexes. J. Prod. Analysis 55, 107–133. doi:10.1007/s11123-021-00598-w
Farrell, M. J. (1957). The measurement of productive efficiency. J. R. Stat. Soc. Ser. A General. 120, 253–281. doi:10.2307/2343100
Fried, H. O., Lovell, C. K., Schmidt, S. S., and Yaisawarng, S. (2002). Accounting for environmental effects and statistical noise in data envelopment analysis. J. Prod. Analysis 17, 157–174. doi:10.1023/a:1013548723393
Fuentes, R., Fuster, B., and Lillo-Bañuls, A. (2016). A three-stage dea model to evaluate learning-teaching technical efficiency: key performance indicators and contextual variables. Expert Syst. Appl. 48, 89–99. doi:10.1016/j.eswa.2015.11.022
Gan, W., Yao, W., and Huang, S. (2022). Evaluation of green logistics efficiency in Jiangxi province based on three-stage dea from the perspective of high-quality development. Sustainability 14, 797. doi:10.3390/su14020797
Hou, L., and Feng, J. (2019). Analysis of agricultural production efficiency in China based on super-efficiency dea and malmquist index. J. Henan Agric. Univ. 53, 316–324. doi:10.16445/j.cnki.1000-2340.2019.02.022
Hu, B., and McAleer, M. (2005). Estimation of Chinese agricultural production efficiencies with panel data. Math. Comput. Simul. 68, 474–483. doi:10.1016/j.matcom.2005.02.002
Huang, D., Li, G., Chang, Y., and Sun, C. (2023). Water, energy, and food nexus efficiency in China: a provincial assessment using a three-stage data envelopment analysis model. Energy 263, 126007. doi:10.1016/j.energy.2022.126007
Jiao, Y. (2013). Study on evaluation of agricultural production efficiency in shandong province. Popul. Resour. Environ. China 23, 105–110. doi:10.3969/j.issn.1002-2104.2013.12.016
Kepei, M., and Baijun, W. (2010). “Research on the measurement of Anhui agricultural modernization,” in International conference on probability and statistics of the international institute for general Systems studies.
Liu, J.-B., and Zhao, B.-Y. (2023). Study on environmental efficiency of Anhui province based on sbm—dea model and fractal theory. Fractals 31, 2340072. doi:10.1142/s0218348x23400728
Liu, Y., Zhuo, L., Varis, O., Fang, K., Liu, G., and Wu, P. (2021). Enhancing water and land efficiency in agricultural production and trade between central Asia and China. Sci. Total Environ. 780, 146584. doi:10.1016/j.scitotenv.2021.146584
Liu, J. B., Zhang, X., and Cao, J. (2024). Structural properties of extended pseudo-fractal scale-free network with higher network efficiency. J. Complex Netw. 12, cnae023. doi:10.1093/comnet/cnae023
Liu, J. B., Guan, L., Cao, J., and Chen, L. (2025). Coherence analysis for a class of polygon networks with the noise disturbance. IEEE Trans. Syst. Man, Cybern. Syst. 55, 4718–4727. doi:10.1109/tsmc.2025.3559326
Liu, J. B., Wang, X., Hua, L., Cao, J., and Chen, L. (2025). The coherence and robustness analysis for a family of unbalanced networks. IEEE Trans. Signal Inf. Process. over Netw. 11, 378–387. doi:10.1109/tsipn.2025.3555164
Lu, L.-C., Chiu, S.-Y., Chiu, Y.-h., and Chang, T.-H. (2022). Sustainability efficiency of climate change and global disasters based on greenhouse gas emissions from the parallel production sectors–a modified dynamic parallel three-stage network dea model. J. Environ. Manag. 317, 115401. doi:10.1016/j.jenvman.2022.115401
Ma, L., Long, H., Tang, L., Tu, S., Zhang, Y., and Qu, Y. (2021). Analysis of the spatial variations of determinants of agricultural production efficiency in China. Comput. Electron. Agric. 180, 105890. doi:10.1016/j.compag.2020.105890
Pan, W.-T., Zhuang, M.-E., Zhou, Y.-Y., and Yang, J.-J. (2021). Research on sustainable development and efficiency of china’s e-agriculture based on a data envelopment analysis-malmquist model. Technol. Forecast. Soc. Change 162, 120298. doi:10.1016/j.techfore.2020.120298
Qi, J.-E., Guo, G.-C., and Chen, Y. (2015). Study on the impact of farmland transfer on agricultural production efficiency based on dea-tobit model. Resour. Sci. 37, 1816–1824.
Song, Z.-J., Xu, Y.-Q., and Zhang, Z.-Y. (2008). Evaluation of china’s agricultural efficiency based on dea model. J. Chongqing Univ. Soc. Sci. Ed. 14, 24–29.
Song, M., Jia, G., and Zhang, P. (2020). An evaluation of air transport sector operational efficiency in China based on a three-stage dea analysis. Sustainability 12, 4220. doi:10.3390/su12104220
Su, H. M., and He, A. X. (2024). Temporal-spatial evolution and influencing factors of agricultural carbon emissions in anhui province, China. Appl. Ecol. and Environ. Res. 22, 5541–5558. doi:10.15666/aeer/2206_55415558
Thrall, R. M. (2000). Measures in dea with an application to the malmquist index. J. Prod. Analysis 13, 125–137. doi:10.1023/a:1007800830737
Valjarević, A., Morar, C., Brasanac-Bosanac, L., Cirkovic-Mitrovic, T., Djekic, T., Mihajlović, M., et al. (2025). Sustainable land use in Moldova: GIS & remote sensing of forests and crops. Land Use Policy 152, 107515. doi:10.1016/j.landusepol.2025.107515
Vlontzos, G., Niavis, S., and Manos, B. (2014). A dea approach for estimating the agricultural energy and environmental efficiency of eu countries. Renew. Sustain. Energy Rev. 40, 91–96. doi:10.1016/j.rser.2014.07.153
Wang, J., Cramer, G. L., and Wailes, E. J. (1996). Production efficiency of chinese agriculture: evidence from rural household survey data. Agric. Econ. 15, 17–28. doi:10.1016/s0169-5150(96)01192-9
Wang, Q., Zhao, Z., Shen, N., and Liu, T. (2015). Have chinese cities achieved the win–win between environmental protection and economic development? From the perspective of environmental efficiency. Ecol. Indic. 51, 151–158. doi:10.1016/j.ecolind.2014.07.022
Wang, L., Yu, C.-C., Wang, M., and Du, D. (2019). Study on the policy effect and temporal and spatial difference of agricultural production efficiency in China: an empirical analysis based on three-stage dea model. Soft Sci. 33, 33–39. doi:10.13956/j.ss.1001-8409.2019.09.06
Ying-Liang, H., and Jiao-E, L. I. (2010). Thinking about the status of agricultural information service in anhui province. J. Hebei Agric. Sci. doi:10.16318/j.cnki.hbnykx.2010.07.050
Zhang, N., Zhou, P., and Kung, C.-C. (2015). Total-factor carbon emission performance of the chinese transportation industry: a bootstrapped non-radial malmquist index analysis. Renew. Sustain. Energy Rev. 41, 584–593. doi:10.1016/j.rser.2014.08.076
Zhang, M., Li, L., and Cheng, Z. (2021). Research on carbon emission efficiency in the chinese construction industry based on a three-stage dea-tobit model. Environ. Sci. Pollut. Res. 28, 51120–51136. doi:10.1007/s11356-021-14298-3
Zhou, W., and Yu, W. (2021). Regional variation in the carbon dioxide emission efficiency of construction industry in China: based on the three-stage dea model. Discrete Dyn. Nat. Soc. 2021, 1–13. doi:10.1155/2021/4021947
Keywords: three-stage DEA model, agricultural production efficiency, Anhui province, Malmquist index, stochastic frontier analysis
Citation: Wang L-F and Zhang X-F (2025) Analyze agricultural efficiency and influencing factors base on the three-stage DEA model and Malmquist index. Front. Earth Sci. 13:1633859. doi: 10.3389/feart.2025.1633859
Received: 23 May 2025; Accepted: 27 August 2025;
Published: 09 September 2025.
Edited by:
Luminita Marutescu, University of Bucharest, RomaniaReviewed by:
Chhavi Tiwari, University of Florida, United StatesYue Xu, Anhui University of Science and Technology, China
Copyright © 2025 Wang and Zhang. This is an open-access article distributed under the terms of the Creative Commons Attribution License (CC BY). The use, distribution or reproduction in other forums is permitted, provided the original author(s) and the copyright owner(s) are credited and that the original publication in this journal is cited, in accordance with accepted academic practice. No use, distribution or reproduction is permitted which does not comply with these terms.
*Correspondence: Xing-Fu Zhang, MTIwNjAyMUBhaGllYy5lZHUuY24=