 A. L. Back
 C. Kana Tepakbong
 L. P. Bédard
 A. Barry
- 1Sciences de la Terre - CERM, LabMaTer, Université du Québec à Chicoutimi, Chicoutimi, QC, Canada
- 2Département d’Informatique et de Mathématique, Université du Québec à Chicoutimi, Chicoutimi, QC, Canada
- 3Centre Armand Frappier–Santé Biotechnologie, Institut National de la Recherche Scientifique (INRS), Laval, QC, Canada
- 4INRS-Unité mixte de recherche INRS-UQAC en santé durable, Chicoutimi, QC, Canada
Geological processes are recorded in grain shape and geochemistry. However, grains are often described with minimal quantification. These descriptions are generally textual and can vary in their precision and accuracy. Historically, detailed studies of crystal size distribution have provided valuable insights into petrogenesis. A thorough analysis of numerous computable grain descriptors will offer even more significant information. Despite extensive literature on shape descriptors in fields like sedimentology, chemistry, and civil engineering, there is no consensus on their use, and their meanings often remain unclear. This article proposes a quantitative grain description method ranging from micrometers to centimeters using various image analysis techniques. Our approach consists of combining multiple quantitative descriptors to describe grain shape. This work is based on a comprehensive literature review across multiple scientific fields to extract numerous quantitative shape measurements. This paper focuses on roundness and roughness descriptors. A total of 25 descriptors, including Waddell roundness and fractal dimension, were extracted, compiled, and computed using Python. The descriptor computation code is provided as a library with this article. We use principal component analysis (PCA) to combine all descriptors in the same category without losing clarity and validated our approach on both generated and real grain images. For both roundness and roughness descriptors, the generated images and real grain images results are in accordance and could be summarized as follows. 1) The roundness descriptors PCA effectively distinguish grain shapes, performing comparably to form descriptors. However, it struggles to differentiate high degrees of roundness, and roughness significantly influences these results. 2) The roughness descriptors PCA excels at discriminating roughness intensity, despite the influence of form and roundness. These results align with our previous study on form descriptors and lead us to a new understanding of shape description: shape description includes both large-scale phenomena (“form”) and small-scale phenomena (“roughness”). And roundness is a specific case of shape description where various shapes transition into a circle. This study highlights the potential of using PCA alongside image-based shape analysis to enhance the quantitative description of grains, offering valuable implications for volcanology, planetary sciences, petrology and other fields.
1 Introduction
In Earth sciences, the textual description of mineral shapes often lacks quantification. The challenges of accurately analyzing mineral shapes have been recognized for decades, prompting numerous authors to improve precision by using visual charts (Folk, 1951; Goldstone, 1993; Murphy and Kemp, 1984). These charts continue to feature in scientific publications (Garzanti et al., 2015; Sandeep et al., 2018). With the growing availability of grain images from advanced imaging systems and the application of segmentation techniques, isolating individual grains is now feasible (Banerjee et al., 2019; Chen et al., 2024; Latif et al., 2022; Zheng and Hryciw, 2016). Consequently, a quantitative analysis of grain shapes can be achieved using appropriate shape descriptors (Back et al., 2025).
Quantitative shape analysis is essential for automating the evaluation of large datasets and for markedly enhancing precision and reproducibility. This method enables the statistical examination of grain shapes in a manner similar to geochemical data analysis. Grain shape relates to mineral crystal structure and applies across various geological disciplines, including zircon shape classification for magma petrogenesis (Pupin, 1980; Scharf et al., 2022), sedimentology—where grain shape correlates with transport distance and medium (Diepenbroek et al., 1992; Garzanti et al., 2015; Huddart et al., 1998)—geotechnics—where grain shape affects soil properties (Altuhafi et al., 2016; Lu et al., 2019)—and mineral extraction—where grain shape influences comminution (Buscarnera and Einav, 2021).
The analysis of object or particle shape is widely studied across various scientific fields. This study focuses on quantifying mineral grain shape at a micrometer to centimeter scale using image analysis techniques on 2D representations. Shape descriptions are most often conducted in 2D, e.g., petrological thin sections, metallurgical polished sections, and photography. Describing particles at a microscopic to macroscopic scale is crucial in multiple disciplines, including geology, materials science, metallurgy, agriculture, and chemistry, and has led to the development of a substantial body of literature. A wide array of quantitative shape descriptors has been developed and classified according to Barrett (1980) definition.
In a previous article (Back et al., 2025), the focus was on size, orientation, and form descriptors. Here, we evaluate roundness and roughness descriptors using a framework that quantifies the shape of mineral grains. The core objective of these articles is to move beyond the traditional challenge of evaluating descriptors in isolation. To do so, we systematically list, categorize, and study the numerous and often redundant descriptors, which, as highlighted in the literature (Hentschel and Page, 2003; Pirard, 2004), are known to produce same value for different shapes, complicating their independent use. To clarify their application, we propose a classification system based on the mathematical tool for each descriptor, or the specific geometric feature that it analyzes. Our methodology emphasizes integrating a reduced set of these functions using multivariate statistical tools, rather than seeking a single “ideal” descriptor. This approach effectively sidesteps the unresolved debate over “What are the best descriptors?” by demonstrating the interdependence of form, roundness, and roughness, showing the value of our combined approach over the pursuit of an individual “ideal” descriptor. The framework proposed in this article to test roundness and roughness descriptors is applied to both generated and actual grain images.
2 Why quantitative petrography matters for petrology?
Nowadays, petrology relies heavily on geochemistry, which, being quantitative, allows for more rigorous demonstration and testing of models. Petrography relies more on textual description, which is poor in quantitative data. Therefore, adding quantitative data to petrography offers the possibility of making it as powerful a tool as geochemistry. To ensure clarity, it is essential to define the terms used in this study, as the literature lacks a consensus on terminology. While most authors agree with Barrett (1980) definition that shape comprises form, roundness, and roughness, naming these components present challenges. Here, “shape” refers to the general contour of the object, with size and orientation adding two more components, totaling five. This study will concentrate on roundness and roughness. The five shape components are crucial for describing minerals in petrography. Precise definitions and their broader implications for petrology are also important. The terminology, definitions, and petrological implications are as follows:
1. Size, determined by the measurable dimensions of the shape, varies in value and interpretation based on the measurement method. Studies on crystal size provide insights into magmatic and metamorphic textures, revealing cooling rates, deformation rates, and element availability (Higgins, 2002; Marsh, 1988).
2. Orientation is defined by the direction of one of the shape’s axes relative to a reference point, though its value is influenced by the measurement method. Grain orientation is known for indicating flow direction in both water and lava, and it offers insights into deformation and its intensity (Nédélec and Bouchez, 2015; Shelton and Mack, 1970; Ventura et al., 1996).
3. Form refers to the polygon or ellipse that is closest to the grain shape. It can be linked to the crystallization sequence, as seen in cumulate textures where well-formed minerals crystallize early in the process (Vernon and Collins, 2011). Additionally, variations in form within the same mineral, such as zircon, offer insights into magma petrogenesis (Pupin, 1980; Zheng et al., 2022).
4. Roundness, also referred to as angularity, describes the angles of the grain, ranging from acute edges to smooth curves. Extensively studied by sedimentologists (Diepenbroek et al., 1992; Krumbein, 1941; Tafesse et al., 2013; Wentworth, 1919), it is a crucial parameter influencing the movement of clastic particles in water and offering insights into their travel distance or origin.
5. Roughness, also known as surface texture, details the outline features of the grain. It reflects various processes depending on the surrounding rock and context, such as rapid mineral growth leading to skeletal and dendritic crystals, or dissolution resulting in re-entrant formation (Hibbard, 1994). For instance, the roughness observed in the shape of corundum-bearing Ca–Al-rich inclusions in chondrites may indicate different origins: condensation (rough and irregular) or melt crystallization (rounded inclusions with radiated corundum; Needham et al., 2017).
These examples demonstrate that an in-depth study of shape parameters can offer valuable insights for petrology, as seen in zircon form classification (Pupin, 1980). Quantitative measurements better capture subtle rock changes, as shown by crystal size distribution (CSD) results (Higgins, 2002; Marsh, 1988). Combining shape parameters with quantitative tools can reveal new textural indicators, enhancing our understanding of geological phenomena.
In this article, a “descriptor” refers to a method or formula used to describe a shape component. The descriptors used in this study are detailed in the “Roundness and roughness descriptors” section, with their formulas provided as a python library available on GitHub (see Data availability statement). All definitions are applied to the 2D representation of grains using image analysis techniques, which are widely available and more cost-effective than 3D methods. Typically, petrographic analyses are conducted in 2D before advancing to 3D imaging.
3 Roundness and roughness descriptors
This section summarizes the main results of an extensive literature review. The methodology is detailed in Back et al. (2025). The classification of a descriptor as either roundness or roughness is based on the original intention of the descriptor’s author or its common use. The subcategories, however, were created for this study and are based on the mathematical tool used or the specific aspect of the shape described by the descriptor group.
3.1 Corner-focused roundness descriptors
The initial mathematical description of grain roundness involved the ratios of size measurements of the grain and one or more corners (Wadell, 1933; 1932; Wentworth, 1922; 1919). These equations approximate corner size using the diameter of a fitted circle (Figure 1A). Grain roundness is estimated by dividing the curvature diameter at the corner by the grain size. The number of corners measured and the choice of distance characterizing the grain vary among authors (Table 1). The curvature diameter–to–grain size ratios allow for comparing particle roundness across different sizes, e.g., a pebble and a boulder (Wadell, 1932).
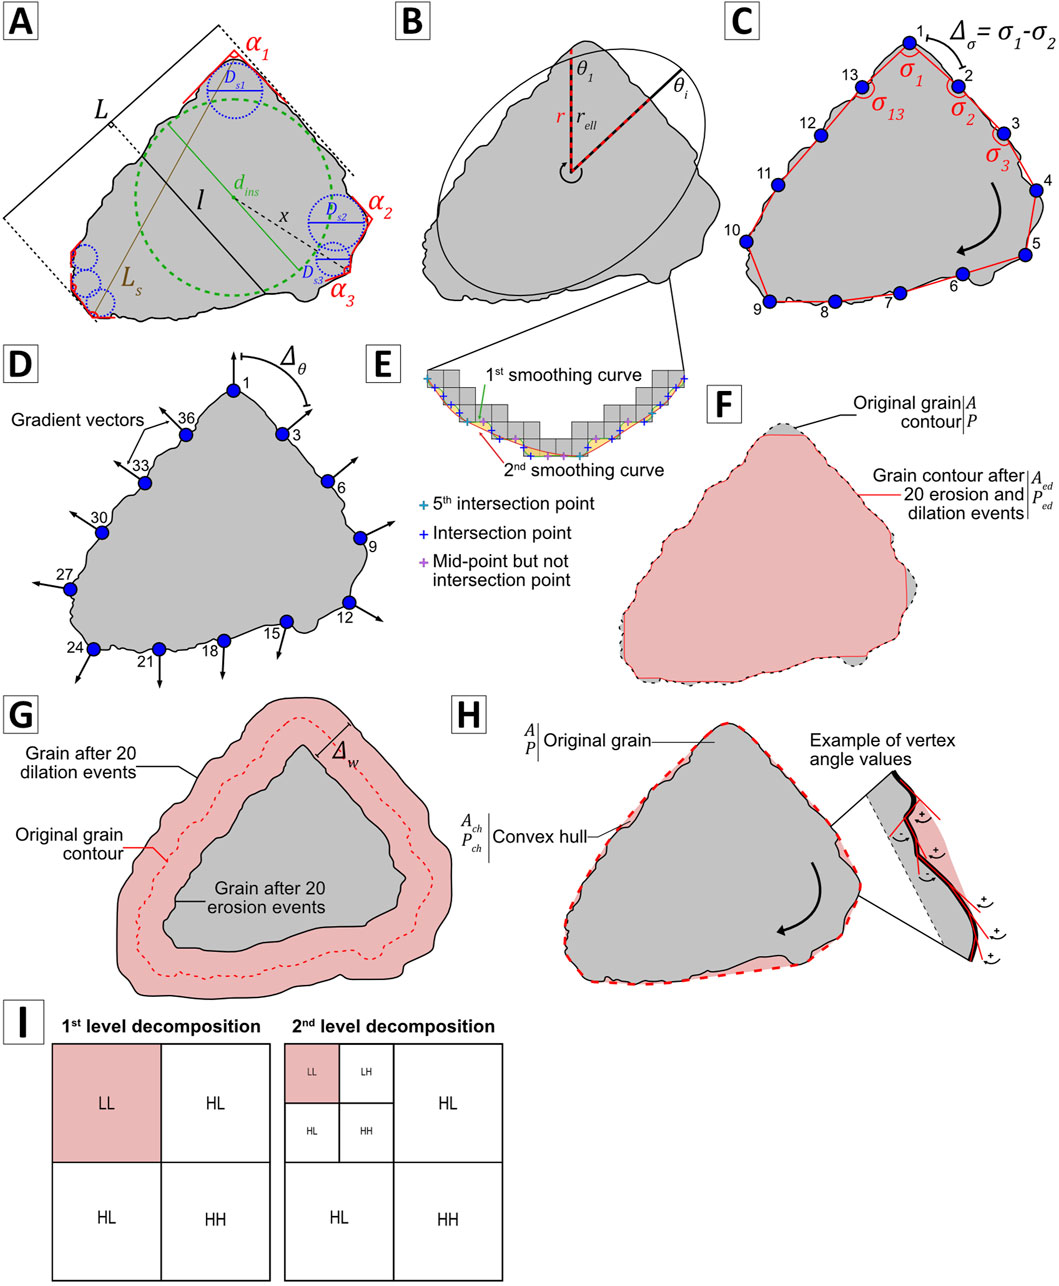
Figure 1. Illustration of the roundness and roughness descriptors: (A) corner-focused roundness descriptors; (B) radius angularity index; (C) segment angularity index; (D) gradient angularity index; (E) smoothing angularity index; (F) erosion–dilation ratio; (G) morphological fractal; (H) roughness descriptors using curvature properties; and (I) examples of wavelet decomposition.
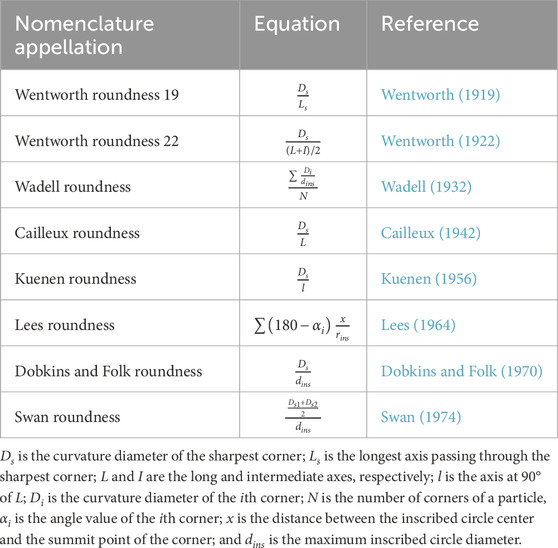
Table 1. Equations of the common corner-focused roundness descriptors.
These methods were initially designed for laboratory or field measurements relying on a caliper, ruler, or steel tape (Krumbein, 1941; Wentworth, 1922). This explains why some methods are simplifications of existing procedures and rely on only one or two corners rather than all possible corners, given the time and complexity of data acquisition in field settings. It also highlights the challenges of implementing these methods in image analysis tools. It is difficult to understand the precise meaning of a corner. Wadell (1932) defines it as “every such part of the outline of an area (projection area) which has a radius of curvature equal to or less than the radius of curvature of the maximum inscribed circle of the same area.” Thus, all corners on the outline of a grain, including the smallest ones, could be considered. However, for a complex outline (rough grain), this would relate more to roughness than roundness. Therefore, a scaling problem remains.
3.2 Roundness descriptors using a simplified grain contour
The following methods share a common approach: simplifying the original contour. The radius angularity index uses angular step analysis, the segment angularity index divides the shape into segments, the gradient angularity index uses every third point of the contour, and the smoothing angularity index applies approximation functions.
The radius angularity index is determined by the difference between the particle radius and the radius of the equivalent moment ellipse in several directions (Figure 1B). This difference is then normalized by the ellipse radius in each direction to avoid the influence of form on the angularity index (Al-Rousan et al., 2007; Masad et al., 2001). The equivalent moment ellipse represents a perfectly rounded particle, and the difference with the original grain contour highlights its angularity.
The segment angularity index method divides the particle contour into an n-sided polygon of equal segments. The angle at each node is then determined, and the difference is calculated between the angle at the previous node and the current angle (Figure 1C). The frequency distribution of these angle differences is then calculated using 10° class intervals. Finally, roundness is the sum of the class probabilities multiplied by the lowest value in each class interval (Rao et al., 2002). The optimal number of segments is 24 for distinguishing crushed and uncrushed gravels (Tutumluer and Pan, 2008).
The gradient angularity index indicates that acute particle angles cause rapid changes in the orientation of the gradient vector for neighboring grain contour points, whereas rounded particles show the opposite behavior. The absolute gradient is calculated using Sobel mask convolution in the x- and y-directions. For roundness analysis, the gradient orientation is computed at edge points, and the differences between neighboring gradient angles are determined (Figure 1D). The total roundness values for all points in the particle corners are summed to obtain the gradient angularity index (Al-Rousan et al., 2007; Chandan et al., 2004; Tafesse et al., 2013). It is advised to use every third edge point and discard angularity values below a 5° threshold to ensure that perfectly rounded objects have values close to 0 (Chandan et al., 2004).
The smoothing angularity index is obtained by generating two smoothing curves around the contour of the particle image. The first curve connects adjacent lateral midpoints of the polygon, whereas the second is formed by selecting every fifth point of intersection between the first curve and polygon (Figure 1E). The distance between the two curves is calculated using perpendicular segments at regular intervals. Roundness is defined as the standard deviation of the distances (Tafesse et al., 2013).
3.3 Fourier descriptors
The final method for characterizing particle roundness uses Fourier analysis on grain contour curves. Two techniques derive the grain contour curve: the Rθ method and the xy method. The Rθ method plots the ratio of the mean diameter to the diameter as a function of θ (Bui et al., 1989; Wang et al., 2005) but is limited to convex shapes. The xy method generates separate x- and y-coordinate curves as functions of θ, effectively handling the concave particles. Fourier analysis is then performed on the combined curves (Bowman et al., 2001; Caple et al., 2017).
Fourier analysis starts with a discrete Fourier transform applied to the grain contour curve, converting spatial information into frequency-domain data. Next, the power spectral density is computed to produce the frequency distribution of the boundary shape. Low-frequency components indicate form characteristics, whereas higher harmonics, up to an indeterminate threshold, reflect roundness. The highest harmonics describe the grain roughness using the same method.
However, the thresholds for differentiating form, roundness, and roughness are unclear, as most authors use varying definitions (Bowman et al., 2001; Bui et al., 1989; Ehrlich and Weinberg, 1970; Garzanti et al., 2015; Wang et al., 2005; Zhou et al., 2015). Fourier amplitudes can be normalized by the 0th harmonic amplitude to eliminate size effects and compare spectra of different shapes (Diepenbroek et al., 1992; Ehrlich and Weinberg, 1970). Some authors also normalize Fourier amplitudes by the first harmonic amplitude for similar reasons (Calderon De Anda et al., 2005). These factors contribute to the various definitions and equations of the Fourier descriptors. This study uses the thresholds and equations from Wang et al. (2005) for the combined Fourier descriptors (Equations 1–3).
where
3.4 Roughness descriptors based on morphological operations
The following descriptors use morphological operations—dilation and erosion—to quantify grain roughness. The simplest morphological descriptor compares the original grain area with its area after several iterations of erosion followed by dilation (Al-Rousan et al., 2007; Maroof et al., 2020; Moaveni et al., 2014; Moaveni et al., 2013; Tutumluer and Pan, 2008). These operations smooth the grain outline, resulting in a greater difference for very angular grains before and after the morphological processes (Figure 1F). The recommended parameters are 20 cycles of erosion followed by dilation Pan and Tutumluer (2007) using a 3 × 3 matrix [Masad et al., 2000 for aggregate grains (Equation 4)]. This descriptor characterizes the angularity in low-resolution images and roughness in higher-resolution images (Masad and Button, 2000).
where
The morphological fractal method calculates the fractal behavior of the area resulting from the difference between a grain after
3.5 Roughness descriptors using curvature properties
This roughness descriptor approach analyzes roughness by utilizing the convex or concave properties of a grain’s contour curve. Convexity is one of the most commonly used roughness descriptors in the literature.
Convexity is the ratio of a grain parameter to its convex hull equivalent (rubber band analogy). Numerous formulas exist in the literature, with some authors using the root or squared results (Kuo and Freeman, 2000; Liang and Yang, 2023) or area instead of the grain perimeter (Cox and Budhu, 2008; Huo et al., 2016). However, the principle remains the same: the properties of the grain are compared with those of its convex hull (Figure 1H).
The vertex concavity indicates the proportion of vertices angles less than 0° (Figure 1H). Completely convex shapes do not have negative angles. A high vertex concavity value signifies a greater degree of indentation (Heilbronner and Keulen, 2006).
3.6 Advanced mathematical roughness descriptors
The fractal dimension measures grain changes as a function of scale, showing that grains appear more irregular and detailed as the scale of observation decreases. This method provides a scale-invariant measure of roughness. Several methods exist to obtain the fractal dimension, such as the perimeter–area method, which is commonly used in geology (Cheng, 1995; Florio et al., 2019; Hyslip and Vallejo, 1997; Maroof et al., 2020; Moore and Donaldson, 1995) and the box-counting method, which is prevalent in image analysis (Asvestas et al., 1999; Lashgari et al., 2015). We focus on these two methods, given their widespread acceptance in the literature and their relevance to the topic. Both methods are similar and determine the fractal dimension by using the slope of a linear regression on a log–log plot, which compares either perimeter to area or the number of pixels in a shape to pixel size at different scales.
Wavelet analysis is also used to determine grain roughness from 2D images. This method involves convolving a specific function, called a wavelet, at various resolutions. Wavelet functions are well represented in both the spatial and frequency domains (Mallat, 1989), whereas Fourier-transformed functions are well represented only in the frequency domain. Several types of wavelet functions exist, each yielding different transformation results (Guo et al., 2022).
A one-level wavelet transformation of an image produces four detailed images: low-low (LL), high-low (HL), low-high (LH), and high-high (HH; Figure 1I). The LL image represents low-frequency components and captures coarse details of the texture of the image. The HL image captures high-frequency components in the horizontal direction, the LH image captures them in the vertical direction, and the HH image captures them in the diagonal (45°) direction. This transformation can be repeated multiple times, using the LL image from each iteration for further decomposition (Chandan et al., 2004; Mallat, 1989).
From the transformed images, we can compute various features to characterize the signal, such as energy, entropy, mean, standard deviation, and contrast. These features can be extracted from each image, either independently or in combination. If the directional components are irrelevant to the studied texture, all high-frequency images (HL, LH, and HH) can be treated as one (Al-Rousan et al., 2007; Chandan et al., 2004). To describe grain texture, the energy of the combined high-frequency images from the 6th decomposition level has proven to be optimal, with Daubechies 9/7 as the selected wavelet decomposition function (Chandan et al., 2004).
4 Classification
The following classification groups roundness and roughness descriptors by type (Table 2). We define types according to mathematical approaches (e.g., morphological, Fourier analysis) or focus (e.g., corner-focus, contour simplification). Corner-focused descriptors have been renamed according to their authors and publication dates when necessary. Additionally, the Ω method introduced by Heilbronner and Keulen (2006) is now called “vertex concavity” to better convey its analytical purpose.
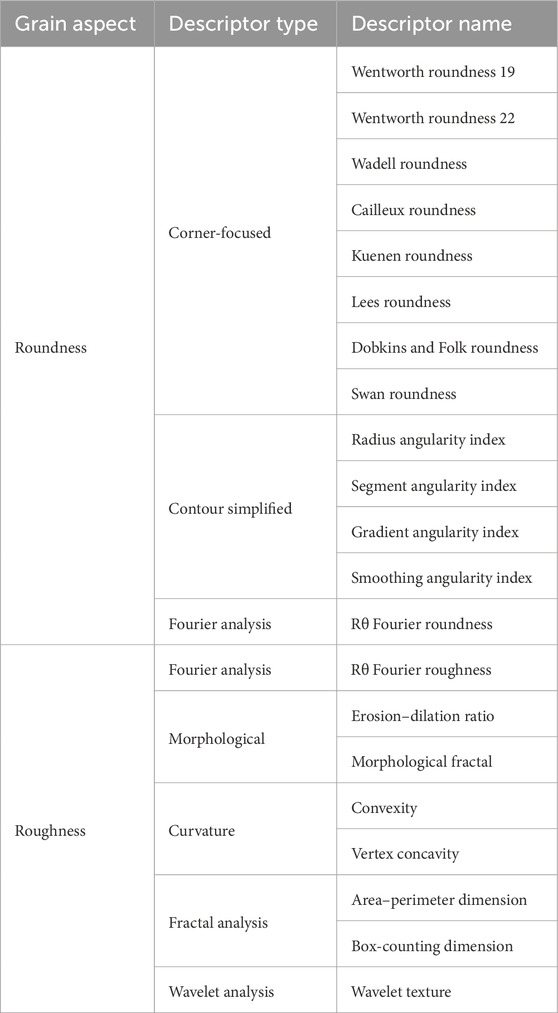
Table 2. Nomenclature for two-dimensional roundness and roughness descriptors.
For descriptors using Fourier analysis, information about the extraction method of the grain contour (Rθ or elliptic) should be provided, and the name should include the range of harmonics used for clarity (e.g., Rθ Fourier roundness 5–25 combined). When using wavelet texture analysis, one should consistently include the wavelet decomposition function, decomposition level, images, and image descriptors, as changes in these parameters can significantly alter the meaning and value of the wavelet descriptor.
5 Methodology
Given the extensive literature on quantitative shape descriptors and the diverse mathematical approaches used by each descriptor or group to quantify grain shape, it is important to note that each descriptor highlights specific aspects of the targeted information. Although no single descriptor is ideal, the goal is to identify the most suitable ones for a given study. Selecting relevant descriptors and analyzing their parameters reveals the physical properties that influence grain shape. The first step involves compiling a comprehensive inventory of quantitative descriptors.
5.1 Article selection
We used statistical tools to navigate the abundant literature and select articles. Our database was drawn from a Scopus query that yielded 2,127 papers. VOSviewer software visualized the bibliometric network (van Eck and Waltman, 2010). A citation-per-document mapping approach facilitated graph construction, and we labeled articles with primary authors’ names and publication years. Interconnections illustrating cross-referencing were depicted as links within the graph. This process allowed us to eliminate articles that were not connected to the bibliographic network and group them using the software clustering options. From the 24 groups obtained from 274 linked articles, we selected two to four articles on the basis of citations and publication years to provide an overview of early contributions to recent ones. The detailed article selection methodology used in this article is the same as in Back et al. (2025), where it is explained in greater depth.
5.2 Image generation and PCA training and testing data
Crystals exhibit a limited range of lattice structures, constraining their three-dimensional forms, which can be approximated as ideal polygons in two dimensions. To explore shape variability, we generated binary images of 13 geometrically ideal shapes with controlled parameters to maintain a grain-like appearance. The ideal shapes included: circle, triangle, square, rectangle, ellipse, pentagon, hexagon, heptagon, octagon, nonagon, decagon, hendecagon, and dodecagon. Shape sizes ranged from 300 to 600 pixels on the basis of prior segmentation data (Back et al., 2023), and orientations were randomized to avoid bias. Roundness was adjusted using Minkowski summation with a disk kernel, whereas roughness was modeled with Perlin noise to mimic natural grain complexity (Al Ibrahim et al., 2019; Back et al., 2025; Michot-Roberto et al., 2021; Perlin, 1985). Roundness ranges from 0 to 6 in increments of 0.6, and roughness ranges from 0 to 1.2 in increments of 0.12, with the number of octaves fixed at 12. This setup ensures a standardized scale of 10 for both roundness and roughness. These parameters are subjectively constrained to maintain the visual resemblance to a grain (Figure 2).
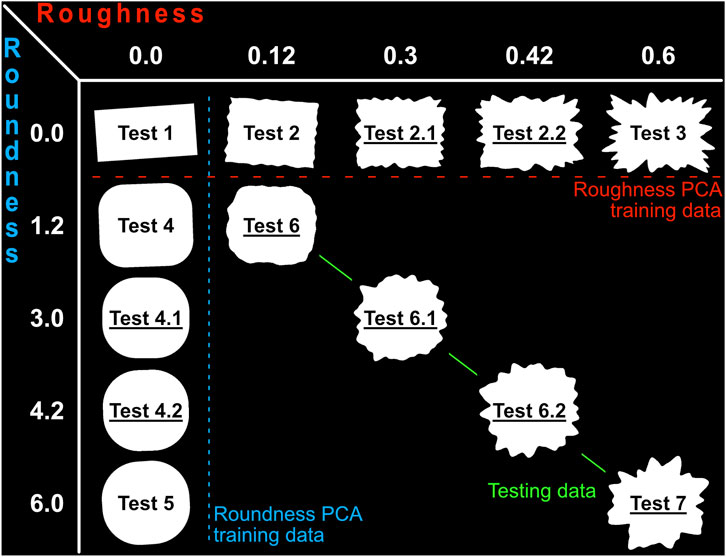
Figure 2. Examples of rectangle images generated and their associated parameters, showing the roundness training dataset (blue), the roughness training dataset (red), and the testing dataset (green), the newly generated datasets are underlined, the roughness value indicates the Perlin noise intensity and roundness the buffer value.
Tests 1, 2, 3, 4 and 5 are the same datasets as those in Back et al. (2025), and tests 4.1, 4.2, 2.1, and 2.2 (Figure 2) have been added to create a more gradual evolution in both roundness and roughness for the PCA training datasets. Test 1 has been added into tests 4 through 5 and tests 2 through 3, forming the training datasets for roundness and roughness respectively. This creates scales of 0, 2, 5, 7, and 10 out of 10 for both parameters. Tests 6 through 7 were added to examine the interaction between roundness and roughness (Figure 2). The effect of form is present in the training and testing datasets, as the 13 forms are present within each test. For visualization purposes only rectangle images are shown in Figure 2. Each test consisted of 3,900 images or 300 images per ideal shape (triangle to dodecagon). Thus, we obtained 19,500 training images for roundness and roughness and 15,600 test images, for a total of 50,700 images (3,900 images of test 1 are present in both training dataset).
5.3 Descriptor computation
Traditional corner-focused roundness descriptor methods were designed for manual measurements. This feature creates a scaling problem in image analysis because of the imprecise definition of corners (see Section 2.1). To address this issue, we developed a new procedure and created a corresponding function named extract_corner_metrics which applies the Ramer–Douglas–Peucker (RDP) algorithm to retain only the most significant corners (Douglas and Peucker, 1973). By reducing the impact of roughness and preserving essential shape points, this function specializes in extracting geometric features from the contours of objects in binary images, offering robust and precise measurements. The function focuses on morphology and orientation and computes all necessary measurements for the corner-focused roundness descriptors, as detailed in Table 1.
Two differences from the traditional corner-focused roundness descriptor methods should be noted: 1) as the intermediate axis used in Wentworth roundness 22 is unavailable in a 2D image, we used Feret’s mean diameter; and 2) corner diameters are computed as the inscribed circle diameter from the triangle formed by the corner instead of the radius of curvature. The diameter of the inscribed circle is inversely proportional to the radius of curvature of the corner, making it applicable to highly angular particles (ideal shapes) lacking curvature, where fitting a circle for curvature measurement is impossible.
For roundness and roughness descriptors using image analysis techniques, we developed Python modules, as their code was unavailable in Python or even not at all. These modules are designed to reproduce the descriptors as accurately as possible, utilizing the recommended parameters from the original studies as highlighted in the descriptor bibliography. To ensure reproducibility, these modules are available on our GitHub page (see Data availability statement). All parameters used for computing descriptors are default parameters within the Python library. For wavelet texture, we applied the same computation method (energy of combined high-frequency images from the 6th decomposition level); however, the Daubechies 9/7 function was unavailable in the PyWavelets library. Instead, we used the Bior 4.4 function, with the only difference being the coefficients normalization.
Using these modules, we could then compute the 13 roundness descriptors: radius angularity index, segment angularity index, gradient angularity index, Rθ Fourier roundness 5–25 combined, Wentworth roundness 19, Wentworth roundness 22, Cailleux roundness, Kuenen roundness, Dobkins and Folk roundness, Swan roundness, Lees roundness, Wadell roundness; and 12 roughness descriptors: erosion–dilation ratio, vertex concavity, wavelet texture, box-counting fractal, morphological fractal, area–perimeter fractal, Rθ Fourier roughness 26–180 combined, area convexity, area convexity percentage, perimeter convexity, perimeter convexity percentage, and RSD Feret. RSD Feret is the relative standard deviation of Feret measurements made with an angular step of 2°.
During the descriptor computation on generated images, some errors occurred with a total number of 28 errors for 50,700 images (<0.06%) involving only two descriptors. Errors for the Fourier methods and the radius angularity index arose from multiple contour points at the same angle instead of one, particularly in highly convex images such as grain 330 (Figure 9B). The Rθ Fourier roughness 26–180 shows one error in test 3 and the smoothing angularity index shows 27 errors with: 17 in test 1, 8 in test 4 and 2 in test 5. It results in empty cells within the datasets. During the descriptor computation on galena images, errors occurred with a total number of 144 errors for 580 images involving four descriptors. However, the smoothing angularity index encountered 139 out of the 144 errors (∼96%), the Rθ Fourier roundness 5–25 combined encountered 2 errors, the Rθ Fourier roughness 26–180 combined encountered 2 errors and the radius angularity index encountered 1 error. For the smoothing angularity index, all errors stemmed from the absence of intersection points, resulting from downsampling contour points, and the challenge of fitting a curve to complex grain contours.
5.4 Descriptor tests
Several authors have noted that individual descriptors, despite targeting the same shape aspects, such as roughness or form, have limitations and do not fully capture the phenomenon (Al-Rousan et al., 2007; Hentschel and Page, 2003; Tafesse et al., 2013). To address this issue, Hentschel and Page (2003) proposed combining descriptors. In this study, we use PCA to identify the most effective combination of descriptors. A key advantage of PCA over other unsupervised learning methods is the interpretability of its results, which allows for the identification of descriptors that explain the principal axes, thereby facilitating the creation of a community-usable index. This approach has yielded good results for form descriptors (Back et al., 2025) and in sediment grain analysis using Fourier amplitude (Suzuki et al., 2015).
The same methodology applies to roundness and roughness descriptors. With only 13 roundness and 12 roughness descriptors, a preliminary PCA for feature reduction is unnecessary, which differs from form descriptors (Back et al., 2025). We extracted descriptors from the training and testing dataset images. The training and testing data were scaled using Equation 5. Missing values because of computation errors were filled using the best-correlated descriptor column and a linear equation. For example, missing smoothing angularity index values are extrapolated using the Rθ Fourier roundness 5–25 combined. PCA was then performed on the scaled training data, and the scaled testing data, which were not involved in the PCA axis analysis, were projected at the end of the training into the PCA domain. Given the presence of 13 different ideal shapes in all datasets and the testing data featuring both roundness and roughness, we assessed the impact of form and roughness on roundness descriptors. Conversely, we also evaluated how form and roundness influence roughness descriptors.
where
To validate the method’s real-world applicability, we used the same galena grain image dataset as used in Back et al. (2025). Galena grain images were captured from glacial sediments following Back et al. (2023) protocol, with a consistent setup, except for using transmitted light and an exposure time of 364.2 µs. Transmitted light images of opaque minerals provide clear grain outlines, simplifying segmentation. The segmentation process involved converting images to grayscale, applying a pixel intensity threshold, using opening and closing operations to remove anomalous pixels, and extracting grain contours with OpenCV’s findContours method. The contours were filled with white, and the background was black, saving the result as a binary image. Some contours were manually removed because of acquisition artifacts from the Olympus Stream® software and issues with touching grains. However, we intentionally retained a few images with these artifacts to assess their effect on the approach, while avoiding an overly large cluster of anomalous images.
We used 580 galena grain images for training and 4 for testing. Because of the many missing values for the smoothing angularity index (139 out of 580), this descriptor was excluded from the roundness PCA, resulting in 12 descriptors for both roundness and roughness. We then applied the same methodology used for the generated images: 1) filling and scaling the dataset; 2) applying PCA on the learning dataset; and 3) projecting the scaled testing data into the PCA domain for both roundness and roughness.
To summarize the methodology of this study, we extracted the descriptors from both generated and real grain images and then separated these into training and testing datasets. We applied two distinct PCAs: one to the generated images training dataset and another to the real grain images training dataset. To assess the method’s reproducibility, we transformed both testing datasets into their respective PCA domains. This methodology was applied to both roundness and roughness descriptors, resulting in a total of four distinct PCAs.
6 Results
6.1 Roundness PCA
The roundness PCA, using the combined 13 roundness descriptors on the generated images, explained 80.6% of the variance using the first (PC1, 64.7%) and second (PC2, 15.9%) principal components. The role of each roundness descriptor in PC1 is evenly distributed, with coefficients varying from 0.241 to 0.340, except for the segment angularity index (0.179), the gradient angularity index (0.069), and Lees roundness (0.113). However, these descriptors play a significant role in PC2 with coefficients 0.514, −0.229, and −0.385, respectively (Table 3).
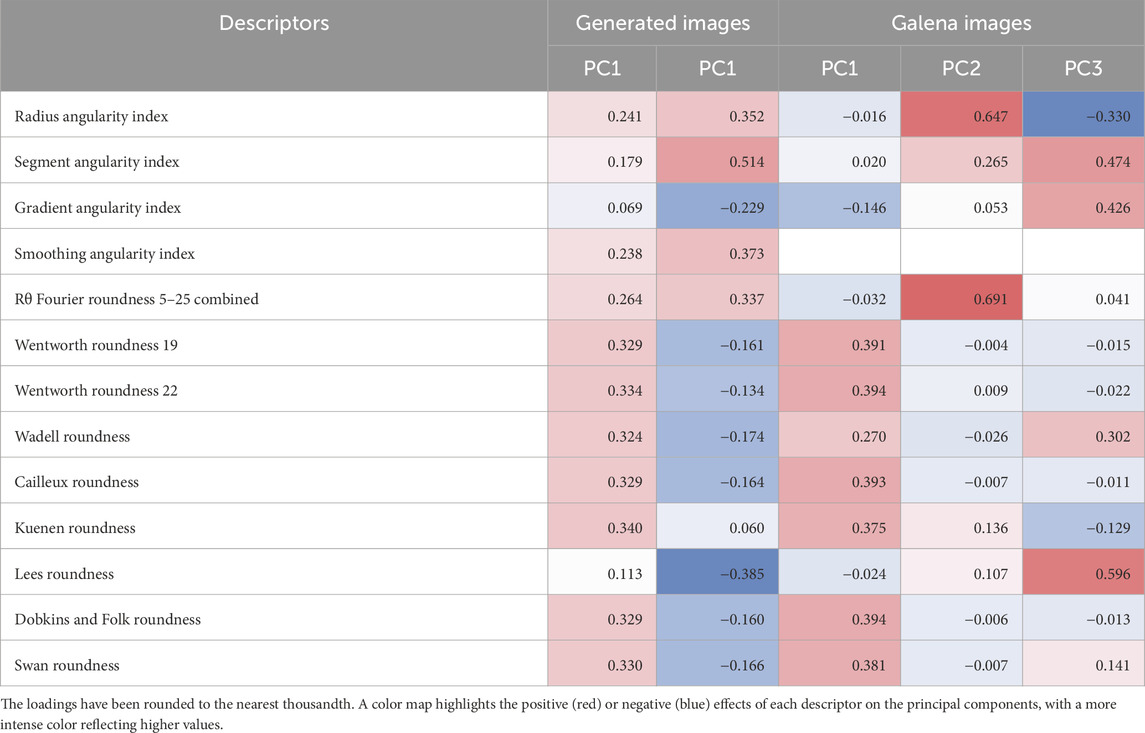
Table 3. Principal component analysis loadings for the roundness PCA on the generated and galena images.
The roundness PCA, using 12 roundness descriptors combined on galena images, explained 75.8% of the variance using PC1 (52.7%), PC2 (12.8%), and PC3 (10.3%). The corner-focused roundness descriptors play the most influential role in the PC1 distribution, except for Lees roundness with a coefficient of −0.024. In PC2, the key descriptors are the radius angularity index (0.647), the segment angularity index (0.265), and the Rθ Fourier roundness 5–25 combined (0.691). Finally, for PC3, the most influential coefficients are the radius angularity index (−0.330), the segment angularity index (0.474), the gradient angularity index (0.426), the Waddell roundness (0.302), and Lees roundness (0.596) (Table 3). For both roundness PCAs, each descriptor plays an influential role in at least one principal component.
Figure 3 shows the roundness PCA results from the generated images. In Figure 3A, all ideal shapes are represented. PC1 effectively discriminates shapes with no roundness, with high-order polygons and circles appearing between 0 and −2, and the number of sides decreases to triangles at PC1 values around 15. PC2 organizes ideal shapes with no roundness into three overlapping groups: triangles (high values, 5–12.5), ellipses (including circles) and high-order polygons (around 0), and rectangles (including squares) ranging from −5 to 2.5. Overlapping within each group results from the spread for the same ideal shapes; for the same shape, lower values indicate minimal elongation, and higher values indicate greater elongation, as highlighted by the gray arrows in Figure 3A. Ideal shapes with increasing roundness intensity converge toward the circle group position, making it impossible to discern intensities beyond 1.2. Figures 3B,C, which illustrates one type of ideal shape for visualization purposes, supports this observation. PC1 and PC2 together cannot distinguish intensities greater than 1.2 (or 2/10) despite a clear difference in roundness among the generated images forming the third cluster (Figures 3B,C).
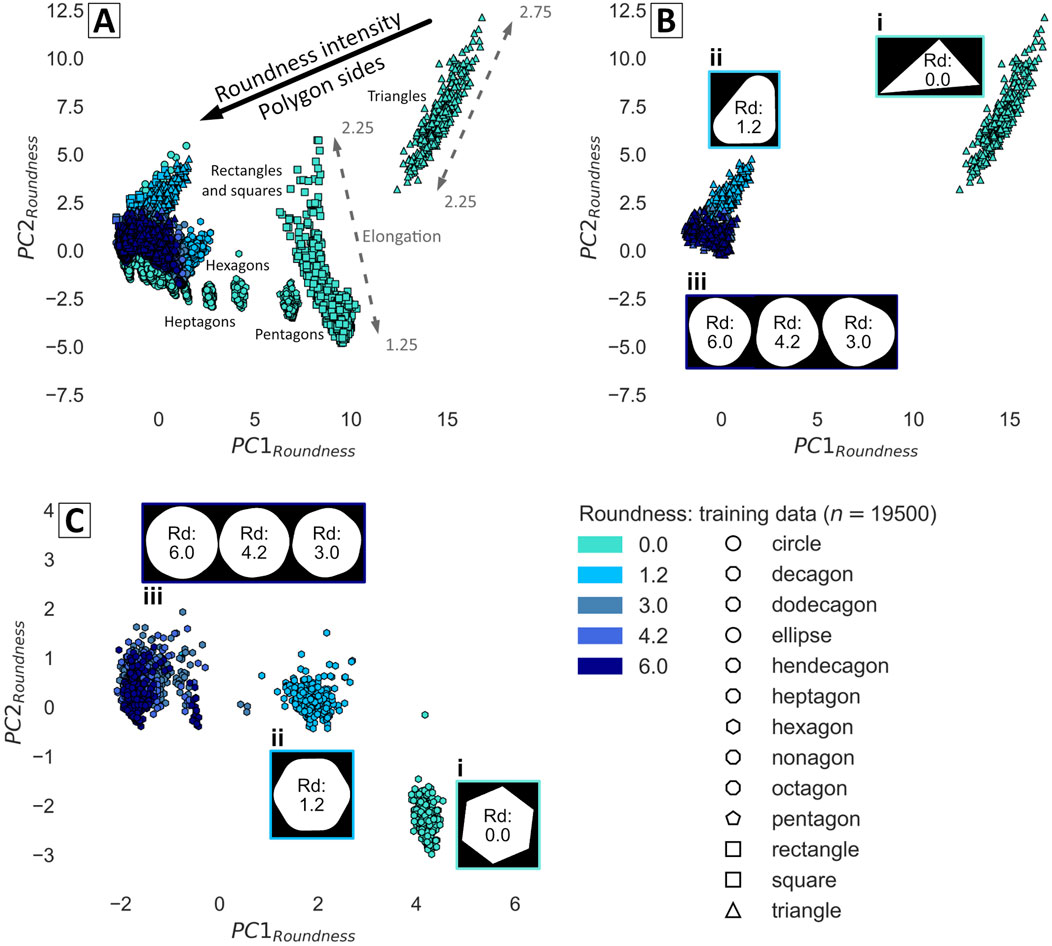
Figure 3. Roundness PCA plots showing the training data; (A) all ideal shapes are represented; (B) triangles and (C) hexagons; the blue scale represents the roundness intensity applied to the generated images, and the numbering (i, ii, and iii) refers to the shape clusters visible on B and C alongside their associated images.
Figures 4A–C demonstrate the effect of roughness on roundness descriptors by incorporating testing data into the roundness PCA plots. The testing data exhibit an equivalent increase in both simulated roughness and roundness intensity, with values matching those in the training data. For the roundness training data, roundness intensity increases as PC1 values decrease from 15 to −2. Conversely, in the testing data, both roundness and roughness intensity increase as PC1 values pass from −1 to 5, maintaining consistent roundness intensity values. In Figures 4B,C, images numbered iv (triangle and hexagon) represent the testing data at maximum roundness and roughness. Their group’s footprint overlaps the zone containing ideal shapes from hexagons to octagons, all with no roundness (Figures 3A, 4) despite having a distinctive angularity based on visual inspection (Figure 4B image number iv; Figure 4C: image numbers i and iv).
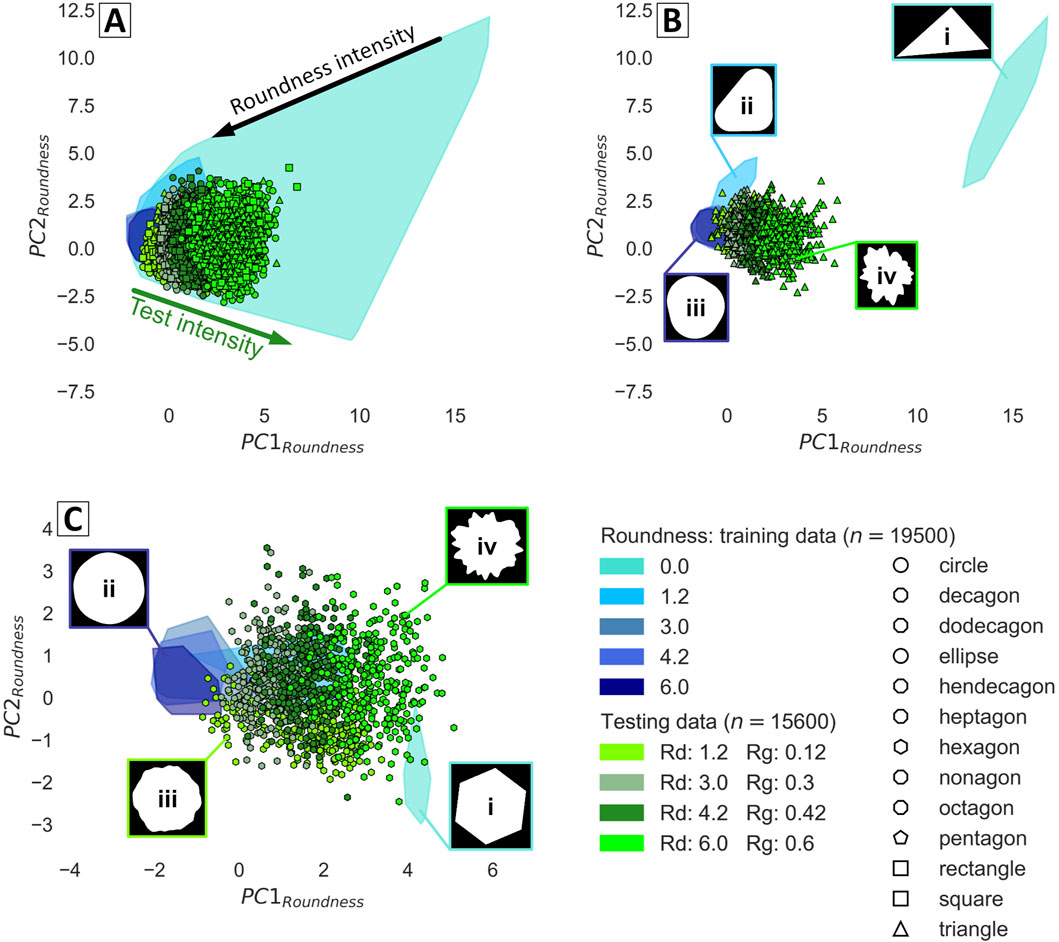
Figure 4. Roundness PCA plots showing the training data (color zones) and the testing data (scatter data); (A) all ideal shapes are represented (B) triangles and (C) hexagons; the blue scale represents the roundness intensity, and the green scale represents the roundness and roughness intensities applied to the generated images.
Figure 5 shows the evolution of the roundness parameter values for a generated roundness between 3 and 6 using the training dataset. Roundness descriptor values tend to become less spread as roundness intensity increases; however, they overlap. The radius angularity index and the Rθ Fourier roundness 5–25 combined can differentiate roundness intensities but only for similar shapes. Additionally, rectangles at a high roundness intensity tend to be considered outliers among corner-focused descriptors, the gradient angularity index and the segment angularity index.
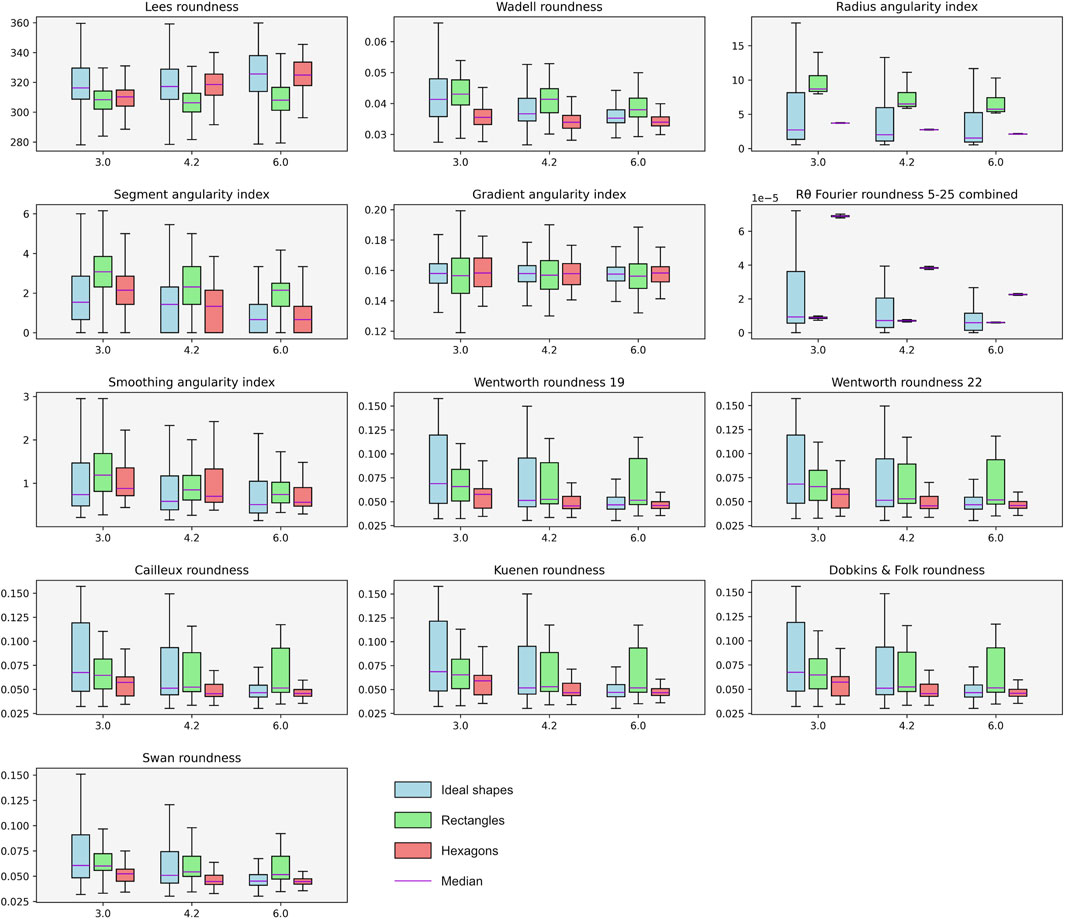
Figure 5. Boxplot showing the evolution of the roundness parameters (y-axis) as a function of the generated roundness (x-axis) for the entire ideal shape population (blue), rectangles (green), and hexagons (red). The median is represented by a purple horizontal line, and for illustration purposes, the outliers are not shown.
Figure 6A presents two distinct trends for galena grains, indicating that the images are well discriminated according to the roundness descriptors. The first trend along PC1 shows high values for stubby, very angular rectangular grains, almost perfect galena crystals (n° 4 and 316), transitioning to smooth rounded grains (n° 548 and 198) with low values. The second trend along PC2 displays elongated, angular rectangular grains (n° 102, 632, and 449) with high values, transitioning to smooth rounded grains with low values (n° 548 and 198), mirroring the PC1 trend. These results correspond with the testing data images: grain 391 is near grain 632 in the elongated trend, grain 494 is between the two trends (rectangular subangular), and grain 263 is on the stubby trend but lacks sufficient roundness to be near grain 198. Finally, grain 101 is close to rounded grains 198 and 548. Figure 6B shows PC3, which sorts grains from smooth surface grains (n° 22) to coarse grains (n° 391 being slightly rougher) to rough (n° 468) and very rough grains (n° 201).
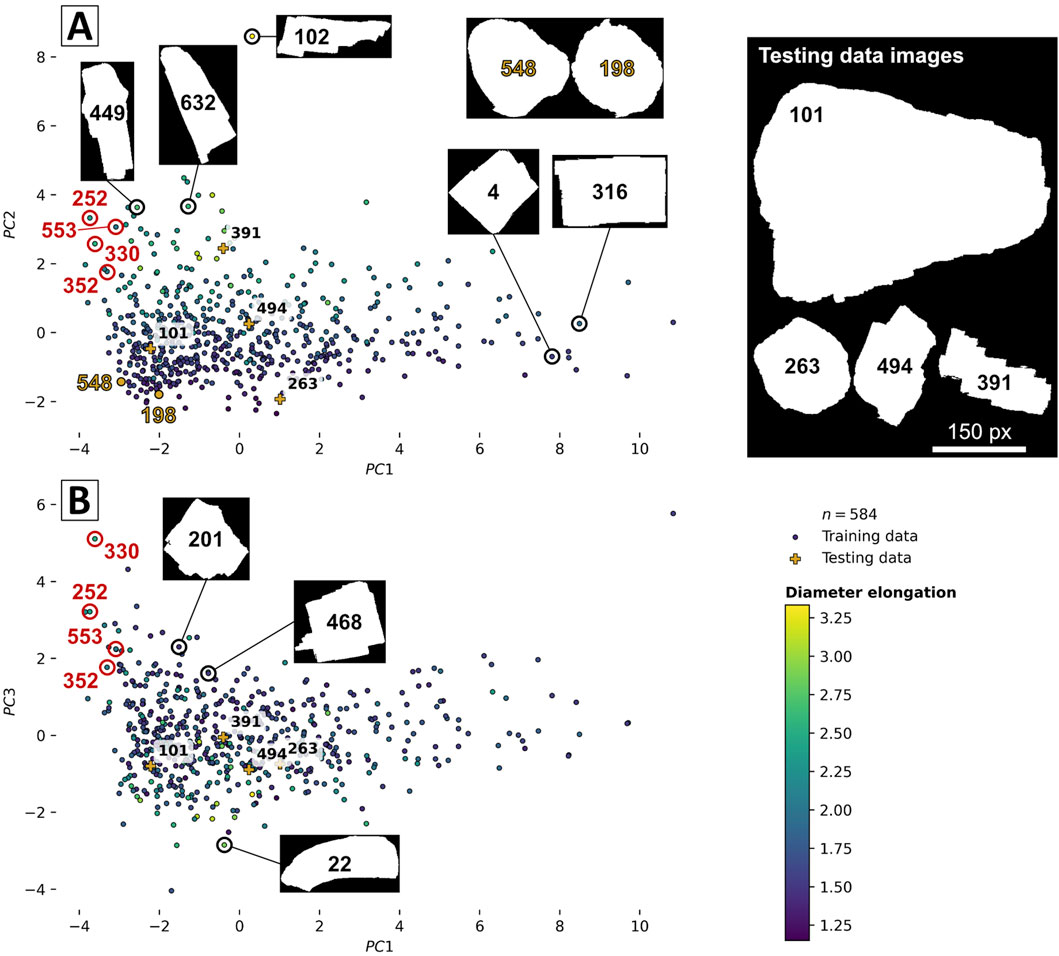
Figure 6. Roundness PCA plots obtained with galena grain images for the three principal components; (A) PC1 against PC2 and (B) PC1 against PC3; the color of the training data points represents the diameter elongation of the grain.
6.2 Roughness PCA
The roughness PCA, using the combined 12 roughness descriptors on the generated images, explained 72.3% of the variance—PC1 (52.7%) and PC2 (19.6%). PC1 is primarily driven by roughness descriptors using curvature properties (area convexity, area convexity percentage, perimeter convexity, perimeter convexity percentage, and vertex concavity) and the erosion–dilation ratio, with loading values ranging from 0.338 to 0.387. PC2 is influenced by the remaining descriptors, with the morphological fractal having a high positive loading of 0.360. In contrast, the box-counting fractal and area–perimeter fractal have high negative loadings of −0.414 and −0.480, respectively. The wavelet texture also exhibits a high negative loading value of −0.428. The relative standard deviation of the Feret measurements (RSD Feret) has a high positive loading of 0.364. The combined Rθ Fourier roughness 26–180 plays a similar role in both PCs, with loadings of 0.258 and 0.198, respectively (Table 4).
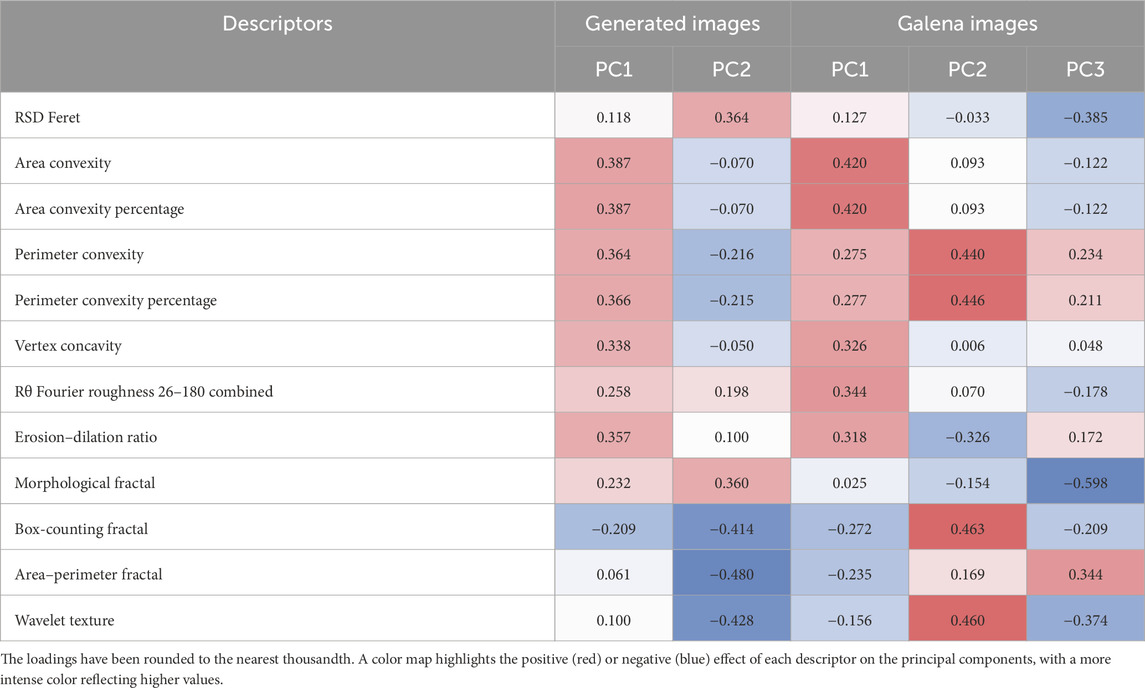
Table 4. Principal component analysis loadings for the roughness PCA on the generated and galena images.
The roughness PCA, using the combined 12 roughness descriptors on galena images, explained 70.6% of the variance—PC1 (38.2%), PC2 (19.5%) and PC3 (12.9%). All roughness descriptors significantly influence the PC1 distribution, except for the RSD Feret and the morphological fractal, which have coefficients of 0.127 and 0.025, respectively. PC2 shows high positive loadings for the perimeter convexity (0.440), perimeter convexity percentage (0.446), box-counting fractal (0.463), and wavelet texture (0.460). Additionally, the erosion–dilation ratio has a relatively high negative loading of −0.326. PC3 is primarily driven by the morphological fractal with a very high negative loading of −0.598, along with a moderate negative loading value for RSD Feret (−0.385) and a moderate positive value for the area–perimeter fractal (0.344; Table 4).
Figures 7A–C demonstrate the strong ability of PCA to discriminate between different roughness intensities using PC1 and PC2, despite the presence of ideal shapes in the dataset. However, PC1 is influenced by form at low roughness intensities and cannot accurately distinguish between roughness levels of 0.00 and 0.12. PC2 is more sensitive to form, as indicated by the gray arrow in Figure 7A, across all roughness intensities.
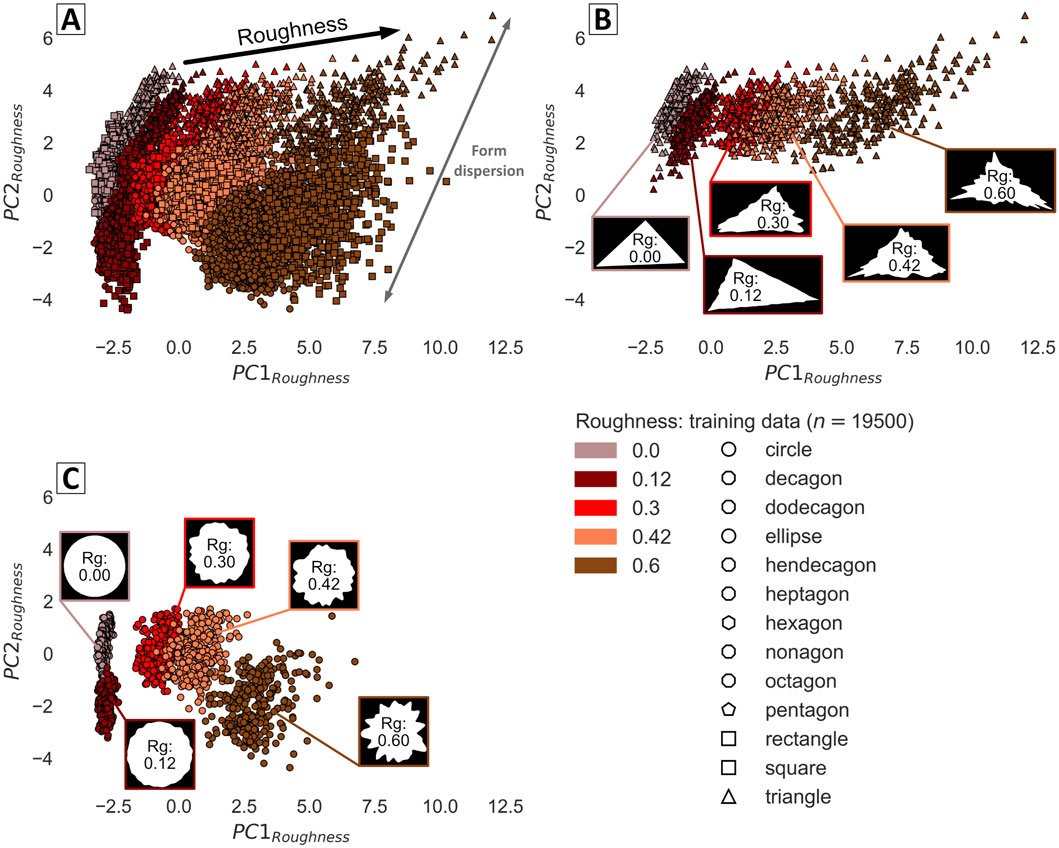
Figure 7. Roughness PCA plots showing the training data; (A) all ideal shapes are represented; (B) triangles and (C) circles. The red scale represents the roughness intensity applied to the generated images.
Figures 8A–C demonstrate the robustness of the roughness PCA method. Despite the presence of ideal shapes in both the training and testing datasets and the addition of roundness in the testing dataset, the method effectively discriminates between different roughness intensities. However, for equivalent roughness intensities, an offset is observed between the training and testing data, with the training data appearing with slightly higher values (positioned more to the right) on the PC1 axis. Additionally, the testing data exhibits a smaller form dispersion than that of the training data (Figures 7A, 8A).
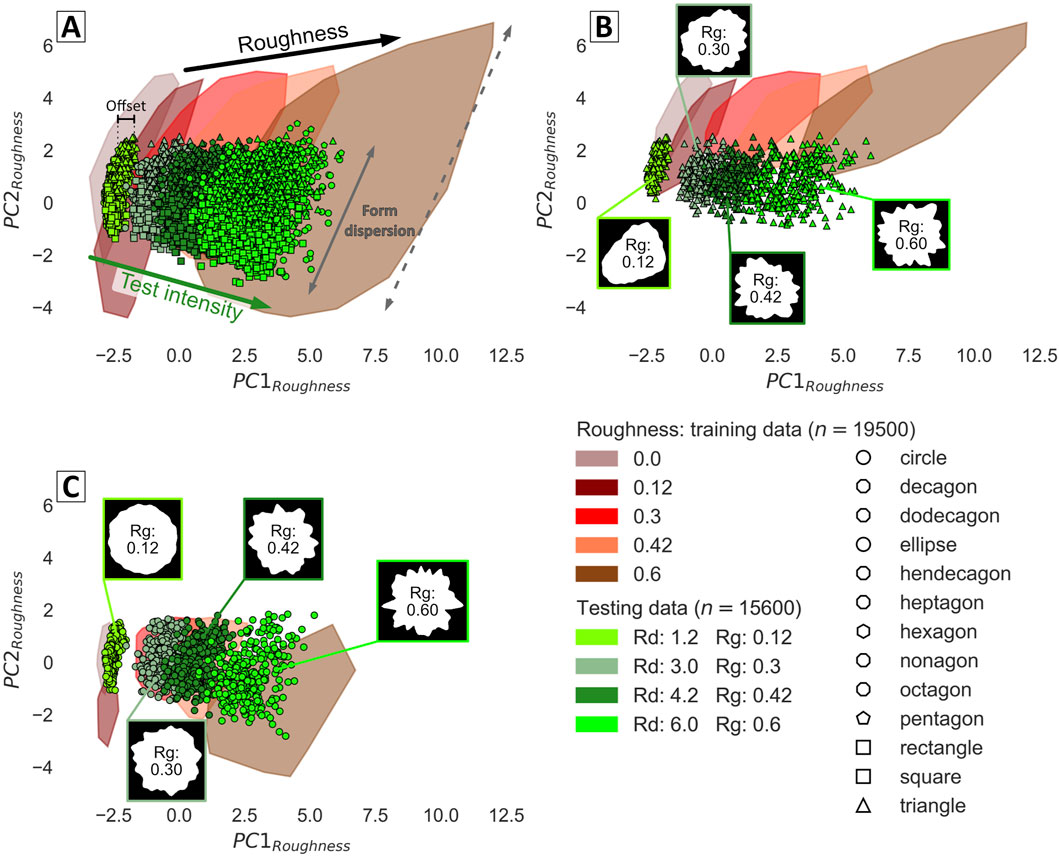
Figure 8. Roughness PCA plots showing the training data (color zones) and the testing data (scatter data), (A) all ideal shapes are represented (B) triangles and (C) circles; the red scale represents the roughness intensity, and the green scale represents the roundness and roughness intensities applied to the generated images.
Figures 9A,B present the three PCs of the roughness PCA on galena grain images using the 12 roughness descriptors. PC1 sorts grains by roughness from perfectly smooth (n° 419) to textured (n° 101 and 263), coarse (n° 332 and 494), rough (n° 156 and 391), and very rough (n °575) grains. PC2 classifies grains by area, as indicated by the color of the training data points. This pattern aligns with the roughness PCA loading values, highlighting perimeter convexity, perimeter convexity percentage, box-counting fractal, and wavelet texture, as the last two methods rely on image scaling for computation. Figure 5B shows that PC3 sorts grains by form and roundness, from low values with angular rectangular elongated grains (n° 412, 50, and 101) to round and subrounded rectangular grains (n° 263 and 494) and finally to stubby rectangular grains (n° 56 and 300).
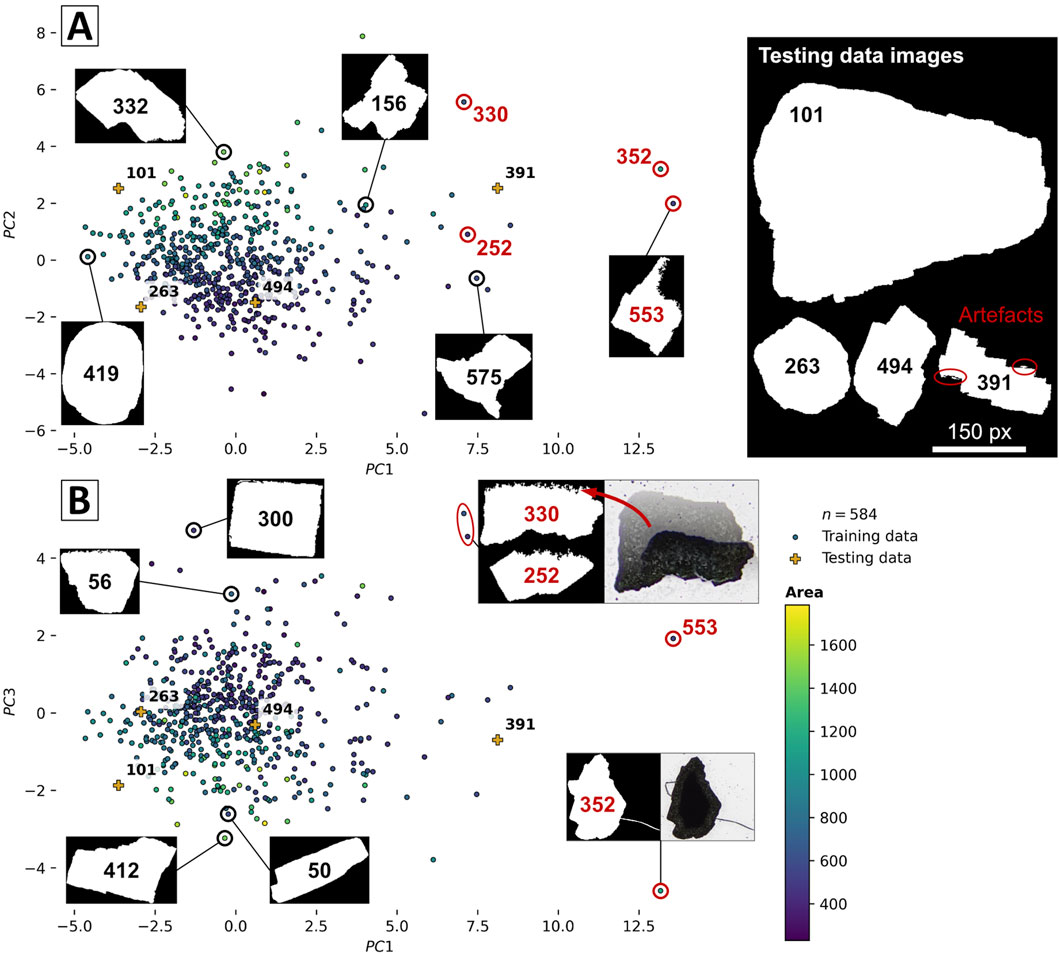
Figure 9. Roughness PCA plots obtained with galena grain images for the three principal components; (A) PC1 against PC2 and (B) PC1 against PC3; the color of the training data points represents the area of the grain.
However, some grains, such as 352 and 391, appear visually less rough than their graph values suggest. This discrepancy arises from artifacts on the grain outlines caused by a combination of acquisition and segmentation issues, as highlighted in Figure 9B for grains 352 and 330; other grains with anomalies are shown in red. These artifacts also affect PC2 and PC3 (Figures 9A,B). The same grains with artifacts are highlighted in Figures 8A,B. Despite these issues, none of the principal components of the roundness PCA are affected. PC3, which tends to sort grains by roughness, classifies them as would be expected upon visual analysis (e.g., grains 391, 352, 553, 252, and then 330).
Interactive graphs displaying the PCA plots of galena grains, along with their corresponding images, are available at https://pca-grain-shapes.onrender.com. The loading of the webpage may take a while.
7 Discussion
This study evaluates roundness and roughness descriptors using a framework to quantify the shape of mineral grains. The framework combines image-based descriptors using PCA and can be easily adapted to various 2D images and objects. All descriptors are available as a Python library on GitHub (see Data availability statement).
7.1 Methodology
For the methods discussed above, we applied the optimal parameters identified in the original studies when available (Al-Rousan et al., 2007; Masad et al., 2000; Pan and Tutumluer, 2007; Rao et al., 2002; Tutumluer and Pan, 2008). However, these methods target specific applications, such as describing aggregate shape properties in civil engineering (Masad et al., 2000). Consequently, the image and sample types in this study differ from those in previous work, suggesting that the parameters considered optimal in those studies may not be directly applicable without some adaptation. The methodology proposed in this article is highly adaptable, as it only requires a 2D binary image. However, depending on the specific study requirements, fine-tuning of the function’s parameters may be necessary. Regarding the application to 3D images, the method could be adapted in two ways: either by incorporating the third dimension into the descriptor functions, or by treating the 3D image as a stack of 2D images, computing the descriptors for each frame, and then using the most appropriate statistical feature to represent the descriptor value of the stacked images.
Modifying the calculation of the inscribed circle diameter of the triangle formed by the corners, rather than the curvature diameter, enhances the generalization of corner-focused descriptors. This approach can compute roundness for highly angular shapes, such as the ideal shapes in the training data. For shapes with high roundness intensities, the curvature diameter may offer greater sensitivity.
For Fourier descriptors, we selected one method with its associated threshold (Wang et al., 2005). However, existing studies present various methods, each with its own thresholds, to separate harmonics related to form, roughness, and roundness (Bowman et al., 2001; Bui et al., 1989; Zhou et al., 2015). Some approaches compute roundness by subtracting the particle spectrum from the equivalent moment ellipse and avoiding arbitrary thresholds (Diepenbroek et al., 1992). These alternative methods may provide valuable insights and could enhance the framework by being incorporated through adaptations to the Python functions included in this study. This method could also use the elliptic Fourier method (xy), rather than the Rθ method, to avoid errors with highly convex objects.
Regarding the roughness descriptors using wavelet decomposition, to our knowledge, only the Daubechies 9/7 function has been applied (Al-Rousan et al., 2007; Chandan et al., 2004), and we used the closest possible function (Bior 4.4 in the PyWavelets library). However, there is a wide variety of wavelet functions, each producing a different transformation result (Guo et al., 2022). Future studies should explore how different wavelet decomposition functions highlight specific image features and their connections to petrographic characteristics, such as inclusions or fractures. Additionally, wavelet analysis was applied directly to the 2D binary images rather than to their contours, which represent a 1D signal. Finally, the roughness descriptor developed by Chandan et al. (2004) describes grayscale images of aggregates rather than binary images.
7.2 Results
In the roundness PCA, the roundness descriptors effectively distinguish between ideal shapes, performing comparably to form descriptors when no roughness is applied (Figure 3A; Back et al., 2025). This could be because adding sides to a shape, transitioning from a triangle to a dodecagon, registers as an increase in roundness. Adding infinitely many sides to an ideal shape progressively makes it resemble a circle. However, the roundness PCA struggles to differentiate varying roundness intensities, regardless of shape. Beyond a roundness intensity of 1.2 (2/10), PCA fails to distinguish between degrees of roundness, although visual differences are apparent. The difficulty of PCA in differentiating roundness intensities stems from overlapping descriptor values at high roundness intensities (Figure 5). Still, a more effective roundness discrimination is likely to occur when there are fewer roundness values, such as between 4 and 6, as separation is relative to the training data. When the roughness simulation is applied to rounded ideal shapes with increasing intensity, the capability of the roundness PCA to discriminate between roundness and form significantly decreases, and the trend reverses. Despite the increased number of sides, rough shapes deviate further from the circle position (Figure 4). Roundness PCA results for galena images align with these observations, as PC1 and PC2 effectively describe the form and roundness of the galena grain population, showing two trends from elongated, angular rectangular grains and stubby angular rectangular grains to smooth rounded grains (Figure 6A). PC3 records the population’s roughness (Figure 6B).
Conversely, the roughness PCA excels at discriminating roughness intensity, despite including 13 ideal shapes in both the training and testing datasets, along with roundness in the testing data. The ideal shapes, simulating form effects, cause data dispersion but minimally affect the roughness intensity discrimination (Figure 7). Form dispersion is confirmed by testing data, which show increased roundness and roughness intensity. With roundness applied, the ideal shapes become more similar, leading to a marked decrease in the data dispersion (Figure 8). The roughness PCA results for galena images further support these findings. PC1 sorts the galena grains by roughness with high sensitivity, PC2 sorts by area, and PC3 sorts by form and roundness, albeit with less sensitivity than the roundness PCA. Although roughness PCA is minimally affected by form and roundness, it is significantly influenced by acquisition and segmentation artifacts, in contrast to the roundness PCA, as illustrated in Figures 6, 9 by the points highlighted in red. This sensitivity can be attributed to the reliance of the roughness descriptors on the entire contour or image without simplification, unlike the roundness descriptors.
In the proposed method, PCA was chosen for its interpretability and effectiveness in capturing linear relationships between variables. However, for more complex datasets where linear methods struggle to capture the relationships between descriptor values, which could be the case for high roundness intensities, autoencoders (AEs) could be a suitable alternative. Yet, this comes at the cost of interpretability, as AEs, like all neural network-based methods, lack transparency and are more difficult to interpret (Cacciarelli and Kulahci, 2023). The use of PCA with image analysis–based shape descriptors demonstrates that form, roundness, and roughness are interdependent, which is consistent with our previous study (Back et al., 2025).
7.3 A new perception of shape description
PCA using form descriptors captures the increasing roundness intensity (Back et al., 2025), whereas PCA using roundness descriptors can discriminate ideal shapes (Figure 3). On the other hand, PCA using roughness descriptors is slightly influenced by roundness intensity (Figure 8); however, roughness intensity affects the ability of the roundness PCA to differentiate between roundness and ideal shapes (Figure 4). However, the effect of roughness is minimal compared to the effect of form on roundness.
This evidence demonstrates that roundness is a form changeset with a minimal effect of roughness. Roundness is indeed a specific case of shape description, where various shapes transition into a single form, the circle. Following this logic, shape description encompasses large-scale (“form”) and small-scale phenomena (“roughness”). This perspective explains the challenge in establishing a threshold between roundness and roughness, both in the context of Wadell’s definition of a corner and in computing descriptors, e.g., obtained from Fourier analysis.
In conclusion, shape analysis focuses not on defining shapes by form, roundness, and roughness but on discriminating between them to identify trends within grain populations. Whether referred to as roundness or other processes, these interpretations are based on morphological characteristics. Descriptors should be classified and studied according to their mathematical properties and the aspects of the grain contour they define. The final version of this framework aims to compute all available descriptors for each grain image in the dataset and then select and combine them using multivariate statistical tools.
7.4 Potential applications of the method
The quantitative framework for grain shape analysis presented in this study offers practical solutions for various real-world applications. This method can be applied directly to geological settings in which the object shape is crucial.
In volcanology, the analysis of volcanic ash particles can provide insights into eruptive styles and magma ascent processes. For example, high-viscosity magma eruptions produce equant, angular to subrounded lithic fragments, whereas low-viscosity eruptions yield perfect spheres or elongated droplets with smooth, fluid surfaces. Phreatomagmatic eruptions generate small blocky or pyramidal glass ash particles (Heiken, 1972). Recent studies have demonstrated the effectiveness of convolutional neural networks (CNNs) in classifying volcanic ash from images (Shoji et al., 2018). By integrating CNN-based classifications with quantitative shape descriptors and the PCA methodology, the interpretation and understanding of classifications can be improved. PCA loadings reveal the contribution of each descriptor to shape discrimination, and the associated formulas clarify the physical parameters driving these variations.
In mineral exploration, where glacial sediments are used to find hidden deposits, mineral shape is a key indicator of transport. For example, gold grain morphology from glacial tills and stream sediment are an indicator of distance to source (Girard et al., 2021; Townley et al., 2003). Considering that the transport distance of gold grains of different shapes is key to finding a deposit, using an adequate geological setting, an equation could be developed to relate shape transformation to transport distance for the different combined shapes. This mathematical relation could be a powerful tool to refine deposit position.
The presented method also has significant potential in planetary science, particularly for describing crater and lake morphologies on other planets. Analyzing the morphological characteristics of these features can shed light on their formation mechanisms, thereby improving our understanding of planetary evolution. Crater and lake outlines can be described using methods similar to those applied to grains (Dhingra et al., 2019; Slezak et al., 2020). The contours of craters and lakes can be represented as binary images, like grain images, enabling our method to be applied. Its application could lead to improved differentiation of the various morphologies and a more detailed understanding of planetary surfaces and their formation processes.
8 Conclusion
Using PCA to study roundness and roughness descriptors reveals that each descriptor captures relevant information for its intended category, as well as additional shape information for both generated and actual grain images. This study, coupled with that of Back et al. (2025), demonstrates the potential of describing grain shape tendencies within populations using only form (Back et al., 2025), roundness, and roughness descriptors. These observations lead to a new perception of shape, suggesting that shapes can be defined by both large-scale and small-scale phenomena, with each descriptor capturing aspects of both.
This study proposes a new methodology for shape analysis that focuses on shape discrimination rather than shape definition using form, roundness, and roughness. This methodology avoids the unresolvable question of “What are the best descriptors?” and clearly shows that form, roundness, and roughness are interdependent.
Our methodology combines descriptors and can be applied to any 2D image. The proposed method can be summarized as follows: 1) obtain a grain binary image using segmentation techniques, 2) compute the descriptors according to the study objective, and 3) combine the descriptors using multivariate statistical tools. The goal is to analyze shape tendencies within the grain image dataset.
Data availability statement
The original contributions presented in this study are included in the Supplementary Material, except for the image datasets, which are available in the following GitHub repository: https://github.com/AL-Back/PCA_grain_shapes/tree/main/Image_datasets. The PyShapeDescriptors library can also be found on GitHub in the following repository: https://github.com/Cyrilkt/Image-Processing-Descriptors. Further inquiries can be directed to the corresponding author.
Author contributions
ALB: Conceptualization, Formal Analysis, Methodology, Visualization, Writing – original draft, Writing – review and editing. CKT: Software, Validation, Writing – review and editing. LPB: Conceptualization, Funding acquisition, Methodology, Project administration, Supervision, Validation, Writing – review and editing. AB: Supervision, Validation, Writing – review and editing.
Funding
The author(s) declare that financial support was received for the research and/or publication of this article. The authors declare that financial support was received for the research, authorship, and publication of this article. This research is funded by a Fonds de Recherche du Québec—Nature et Technologies (FRQ-NT) and Ministère des Ressources naturelles et Forêt du Québec (MRNF) grant to LPB, principal investigator (Programme de recherche en partenariat sur le développement durable du secteur minier-II, grant number: 2020-MN-283346 (https://doi.org/10.69777/283346) and Programme de recherche en partenariat sur le développement durable du secteur minier-III, grant number: 339845 (https://doi.org/10.69777/339845)) with contributions from IOS Services Géoscientifiques Inc. ALB received fellowships from FUQAC, MAC, and IAMG. The authors declare that this study received funding from IOS Services Géoscientifiques, Inc. The funder was not involved in the study design, data collection, analysis, interpretation, writing of this article, or the decision to submit it for publication.
Acknowledgments
Réjean Girard is thanked for his valuable contributions and the energy he shared. Sylvain Tual is thanked for his help with the interactive graphs. We thank the reviewers and the editor for their assistance in improving this manuscript.
Conflict of interest
The authors declare that the research was conducted in the absence of any commercial or financial relationships that could be construed as a potential conflict of interest.
Generative AI statement
The author(s) declare that Generative AI was used in the creation of this manuscript. For english verification and amelioration.
Any alternative text (alt text) provided alongside figures in this article has been generated by Frontiers with the support of artificial intelligence and reasonable efforts have been made to ensure accuracy, including review by the authors wherever possible. If you identify any issues, please contact us.
Publisher’s note
All claims expressed in this article are solely those of the authors and do not necessarily represent those of their affiliated organizations, or those of the publisher, the editors and the reviewers. Any product that may be evaluated in this article, or claim that may be made by its manufacturer, is not guaranteed or endorsed by the publisher.
Supplementary material
The Supplementary Material for this article can be found online at: https://www.frontiersin.org/articles/10.3389/feart.2025.1634237/full#supplementary-material
References
Al Ibrahim, M. A., Kerimov, A., Mukerji, T., and Mavko, G. (2019). Particula: a simulator tool for computational rock physics of granular media. Geophysics 84, F85–F95. doi:10.1190/geo2018-0481.1
Al-Rousan, T., Masad, E., Tutumluer, E., and Pan, T. (2007). Evaluation of image analysis techniques for quantifying aggregate shape characteristics. Constr. Build. Mater. 21, 978–990. doi:10.1016/j.conbuildmat.2006.03.005
Altuhafi, F. N., Coop, M. R., and Georgiannou, V. N. (2016). Effect of particle shape on the mechanical behavior of natural sands. J. Geotech. Geoenvironmental Eng. 142, 04016071. doi:10.1061/(ASCE)GT.1943-5606.0001569
Asvestas, P., Matsopoulos, G. K., and Nikita, K. S. (1999). Estimation of fractal dimension of images using a fixed mass approach. Pattern Recognit. Lett. 20, 347–354. doi:10.1016/S0167-8655(99)00004-5
Back, A. L., Bédard, L. P., Maitre, J., and Bouchard, K. (2023). From rocks to pixels: a protocol for reproducible mineral imaging and its applications in machine learning. Minerals 14, 51. doi:10.3390/min14010051
Back, A. L., Kana Tepakbong, C., Bédard, L. P., and Barry, A. (2025). From rocks to pixels: a comprehensive framework for grain shape characterization through the image analysis of size, orientation, and form descriptors. Front. Earth Sci. 13, 1508690. doi:10.3389/feart.2025.1508690
Banerjee, S., Chakraborti, P. C., and Saha, S. K. (2019). An automated methodology for grain segmentation and grain size measurement from optical micrographs. Measurement 140, 142–150. doi:10.1016/j.measurement.2019.03.046
Barrett, P. J. (1980). The shape of rock particles, a critical review. Sedimentology 27, 291–303. doi:10.1111/j.1365-3091.1980.tb01179.x
Bowman, E. T., Soga, K., and Drummond, W. (2001). Particle shape characterisation using Fourier descriptor analysis. Géotechnique 51, 545–554. doi:10.1680/geot.2001.51.6.545
Bui, E. N., Mazzullo, J. M., and Wilding, L. P. (1989). Using quartz grain size and shape analysis to distinguish between aeolian and fluvial deposits in the Dallol Bosso of Niger (West Africa). Earth Surf. Process. Landf. 14, 157–166. doi:10.1002/esp.3290140206
Buscarnera, G., and Einav, I. (2021). The mechanics of brittle granular materials with coevolving grain size and shape. Proc. R. Soc. Math. Phys. Eng. Sci. 477 (2249), 20201005. doi:10.1098/rspa.2020.1005
Cacciarelli, D., and Kulahci, M. (2023). Hidden dimensions of the data: PCA vs autoencoders. Qual. Eng. 35, 741–750. doi:10.1080/08982112.2023.2231064
Cailleux, A. (1942). Les actions éoliennes périglaciaires en Europe. Paris, France: Société géologique.
Calderon De Anda, J., Wang, X. Z., Lai, X., and Roberts, K. J. (2005). Classifying organic crystals via in-process image analysis and the use of monitoring charts to follow polymorphic and morphological changes. J. Process Control 15, 785–797. doi:10.1016/j.jprocont.2005.02.002
Caple, J., Byrd, J., and Stephan, C. N. (2017). Elliptical Fourier analysis: fundamentals, applications, and value for forensic anthropology. Int. J. Leg. Med. 131, 1675–1690. doi:10.1007/s00414-017-1555-0
Chandan, C., Sivakumar, K., Masad, E., and Fletcher, T. (2004). Application of imaging techniques to geometry analysis of aggregate particles. J. Comput. Civ. Eng. 18, 75–82. doi:10.1061/(ASCE)0887-3801(2004)18:1(75)
Chen, Y., Yi, Y., Dai, Y., and Shi, X. (2024). A multiangle polarised imaging-based method for thin section segmentation. J. Microsc. 294, 14–25. doi:10.1111/jmi.13261
Cheng, Q. (1995). The perimeter-area fractal model and its application to geology. Math. Geol. 27, 69–82. doi:10.1007/BF02083568
Cox, M. R., and Budhu, M. (2008). A practical approach to grain shape quantification. Eng. Geol. 96, 1–16. doi:10.1016/j.enggeo.2007.05.005
Dhingra, R. D., Barnes, J. W., Hedman, M. M., and Radebaugh, J. (2019). Using elliptical Fourier descriptor analysis (EFDA) to quantify titan lake morphology. Astron. J. 158, 230. doi:10.3847/1538-3881/ab4907
Diepenbroek, M., Bartholomä, A., and Ibbeken, H. (1992). How round is round? A new approach to the topic “roundness” by Fourier grain shape analysis. Sedimentology 39, 411–422. doi:10.1111/j.1365-3091.1992.tb02125.x
Dobkins, J. E., and Folk, R. L. (1970). Shape development on Tahiti-Nui. J. Sediment. Res. 40, 1167–1203. doi:10.1306/74D72162-2B21-11D7-8648000102C1865D
Douglas, D. H., and Peucker, T. K. (1973). Algorithms for the reduction of the number of points required to represent a digitized line or its caricature. Cartographica 10, 112–122. doi:10.3138/FM57-6770-U75U-7727
Ehrlich, R., and Weinberg, B. (1970). An exact method for characterization of grain shape. J. Sediment. Res. 40, 205–212. doi:10.1306/74D71F1E-2B21-11D7-8648000102C1865D
Florio, B. J., Fawell, P. D., and Small, M. (2019). The use of the perimeter-area method to calculate the fractal dimension of aggregates. Powder Technol. 343, 551–559. doi:10.1016/j.powtec.2018.11.030
Folk, R. L. (1951). A comparison chart for visual percentage estimation. J. Sediment. Res. 21, 32–33. doi:10.1306/d4269413-2b26-11d7-8648000102c1865d
Garzanti, E., Resentini, A., Andò, S., Vezzoli, G., Pereira, A., and Vermeesch, P. (2015). Physical controls on sand composition and relative durability of detrital minerals during ultra-long distance littoral and aeolian transport (Namibia and southern Angola). Sedimentology 62, 971–996. doi:10.1111/sed.12169
Girard, R., Tremblay, J., Néron, A., Longuépée, H., and Makvandi, S. (2021). Automated gold grain counting. Part 2: what a gold grain size and shape can tell. Minerals 11, 379. doi:10.3390/min11040379
Goldstone, R. L. (1993). Feature distribution and biased estimation of visual displays. J. Exp. Psychol. Hum. Percept. Perform. 19, 564–579. doi:10.1037/0096-1523.19.3.564
Guo, T., Zhang, T., Lim, E., López-Benítez, M., Ma, F., and Yu, L. (2022). A review of wavelet analysis and its applications: challenges and opportunities. IEEE Access 10, 58869–58903. doi:10.1109/ACCESS.2022.3179517
Heiken, G. (1972). Morphology and petrography of volcanic ashes. GSA Bull. 83, 1961–1988. doi:10.1130/0016-7606(1972)83[1961:MAPOVA]2.0.CO;2
Heilbronner, R., and Keulen, N. (2006). Grain size and grain shape analysis of fault rocks. Deformation Mech. Microstruct. rheology rocks Nat. Exp. 427, 199–216. doi:10.1016/j.tecto.2006.05.020
Hentschel, M. L., and Page, N. W. (2003). Selection of descriptors for particle shape characterization. Part. Part. Syst. Charact. 20, 25–38. doi:10.1002/ppsc.200390002
Hibbard, M. J. (1994). Petrographic classification of crystal morphology. J. Geol. 102, 571–581. doi:10.1086/629699
Higgins, M. D. (2002). A crystal size-distribution study of the Kiglapait layered mafic intrusion, labrador, Canada: evidence for textural coarsening. Contrib. Mineral. Petrol. 144, 314–330. doi:10.1007/s00410-002-0399-9
Huddart, D., Bennett, M. R., Hambrey, M. J., Glasser, N. F., and Crawford, K. (1998). Origin of well-rounded gravels in glacial deposits from Brøggerhalvøya, northwest Spitsbergen: potential problems caused by sediment reworking in the glacial environment. Polar Res. 17, 61–70. doi:10.1111/j.1751-8369.1998.tb00259.x
Huo, Y., Liu, T., Liu, H., Ma, C. Y., and Wang, X. Z. (2016). In-situ crystal morphology identification using imaging analysis with application to the L-glutamic acid crystallization. Chem. Eng. Sci. 148, 126–139. doi:10.1016/j.ces.2016.03.039
Hyslip, J. P., and Vallejo, L. E. (1997). Fractal analysis of the roughness and size distribution of granular materials. Eng. Geol., Fractals Eng. Geol. 48, 231–244. doi:10.1016/S0013-7952(97)00046-X
Krumbein, W. C. (1941). Measurement and geological significance of shape and roundness of sedimentary particles. J. Sediment. Res. 11, 64–72. doi:10.1306/D42690F3-2B26-11D7-8648000102C1865D
Kuenen, P. H. (1956). Experimental abrasion of pebbles: 2. Rolling by current. J. Geol. 64, 336–368. doi:10.1086/626370
Kuo, C.-Y., and Freeman, R. B. (2000). Imaging indices for quantification of shape, angularity, and surface texture of aggregates. Transp. Res. Rec. 1721, 57–65. doi:10.3141/1721-07
Lashgari, A., Ghamami, S., Shahbazkhany, S., Salgado-Morán, G., and Glossman-Mitnik, D. (2015). Fractal dimension calculation of a manganese-chromium bimetallic nanocomposite using image processing. J. Nanomater. 2015, 384835. doi:10.1155/2015/384835
Latif, G., Bouchard, K., Maitre, J., Back, A., and Bédard, L. P. (2022). Deep-learning-based automatic mineral grain segmentation and recognition. Minerals 12, 455. doi:10.3390/min12040455
Lees, G. (1964). A new method for determining the angularity of particles. Sedimentology 3, 2–21. doi:10.1111/j.1365-3091.1964.tb00271.x
Liang, P., and Yang, X. (2023). Grain shape evolution of sand-sized sediments during transport from mountains to dune fields. J. Geophys. Res. Earth Surf. 128, e2022JF006930. doi:10.1029/2022JF006930
Lu, Z., Yao, A., Su, A., Ren, X., Liu, Q., and Dong, S. (2019). Re-recognizing the impact of particle shape on physical and mechanical properties of sandy soils: a numerical study. Eng. Geol. 253, 36–46. doi:10.1016/j.enggeo.2019.03.011
Mallat, S. G. (1989). A theory for multiresolution signal decomposition: the wavelet representation. IEEE Trans. Pattern Anal. Mach. Intell. 11, 674–693. doi:10.1109/34.192463
Maroof, M. A., Mahboubi, A., Noorzad, A., and Safi, Y. (2020). A new approach to particle shape classification of granular materials. Transp. Geotech. 22, 100296. doi:10.1016/j.trgeo.2019.100296
Marsh, B. D. (1988). Crystal size distribution (CSD) in rocks and the kinetics and dynamics of crystallization. Contrib. Mineral. Petrol. 99, 277–291. doi:10.1007/BF00375362
Masad, E., and Button, J. W. (2000). Unified imaging approach for measuring aggregate angularity and texture. Comput.-Aided Civ. Infrastruct. Eng. 15, 273–280. doi:10.1111/0885-9507.00191
Masad, E., Button, J. W., and Papagiannakis, T. (2000). Fine-aggregate angularity: automated image analysis approach. Transp. Res. Rec. 1721, 66–72. doi:10.3141/1721-08
Masad, E., Olcott, D., White, T., and Tashman, L. (2001). Correlation of fine aggregate imaging shape indices with asphalt mixture performance. Transp. Res. Rec. J. Transp. Res. Board 1757, 148–156. doi:10.3141/1757-17
Michot-Roberto, S., Garcia-Hernández, A., Dopazo-Hilario, S., and Dawson, A. (2021). The spherical primitive and perlin noise method to recreate realistic aggregate shapes. Granul. Matter 23, 41. doi:10.1007/s10035-021-01105-6
Moaveni, M., Wang, S., Hart, J. M., Tutumluer, E., and Ahuja, N. (2013). Evaluation of aggregate size and shape by means of segmentation techniques and aggregate image processing algorithms. Transp. Res. Rec. 2335, 50–59. doi:10.3141/2335-06
Moaveni, M., Mahmoud, E., Ortiz, E. M., Tutumluer, E., and Beshears, S. (2014). Use of advanced aggregate imaging systems to evaluate aggregate resistance to breakage, abrasion, and polishing. Transp. Res. Rec. 2401, 1–10. doi:10.3141/2401-01
Moore, C. A., and Donaldson, C. F. (1995). Quantifying soil microstructure using fractals. Géotechnique 45, 105–116. doi:10.1680/geot.1995.45.1.105
Murphy, C. P., and Kemp, R. A. (1984). The over-estimation of clay and the under-estimation of pores in soil thin sections. J. Soil Sci. 35, 481–495. doi:10.1111/j.1365-2389.1984.tb00305.x
Nédélec, A., and Bouchez, J. L. (2015). Granites: petrology, structure, geological setting, and metallogeny. Oxford University Press.
Needham, A. W., Messenger, S., Han, J., and Keller, L. P. (2017). Corundum–hibonite inclusions and the environments of high temperature processing in the early solar system. Geochim. Cosmochim. Acta 196, 18–35. doi:10.1016/j.gca.2016.04.022
Pan, T., and Tutumluer, E. (2007). Quantification of coarse aggregate surface texture using image analysis. J. Test. Eval. 35, 177–186. doi:10.1520/JTE100181
Perlin, K. (1985). An image synthesizer. ACM SIGGRAPH Comput. Graph. 19, 287–296. doi:10.1145/325165.325247
Pirard, E. (2004). “Image measurements,” in Image analysis, sediments and paleoenvironments. Editor P. Francus (Netherlands, Dordrecht: Springer), 59–86.
Pupin, J. P. (1980). Zircon and granite petrology. Contrib. Mineral. Petrol. 73, 207–220. doi:10.1007/BF00381441
Rao, C., Tutumluer, E., and Kim, I. T. (2002). Quantification of coarse aggregate angularity based on image analysis. Transp. Res. Rec. 1787, 117–124. doi:10.3141/1787-13
Sandeep, C. S., He, H., and Senetakis, K. (2018). An experimental micromechanical study of sand grain contacts behavior from different geological environments. Eng. Geol. 246, 176–186. doi:10.1016/j.enggeo.2018.09.030
Scharf, T., Kirkland, C. L., Daggitt, M. L., Barham, M., and Puzyrev, V. (2022). AnalyZr: a python application for zircon grain image segmentation and shape analysis. Comput. Geosci. 162, 105057. doi:10.1016/j.cageo.2022.105057
Shelton, J. W., and Mack, D. E. (1970). Grain orientation in determination of paleocurrents and sandstone Trends1. AAPG Bull. 54, 1108–1119. doi:10.1306/5D25CBA9-16C1-11D7-8645000102C1865D
Shoji, D., Noguchi, R., Otsuki, S., and Hino, H. (2018). Classification of volcanic ash particles using a convolutional neural network and probability. Sci. Rep. 8, 8111. doi:10.1038/s41598-018-26200-2
Slezak, T. J., Radebaugh, J., Christiansen, E. H., and Belk, M. C. (2020). Classification of planetary craters using outline-based morphometrics. J. Volcanol. Geotherm. Res. 407, 107102. doi:10.1016/j.jvolgeores.2020.107102
Suzuki, K., Fujiwara, H., and Ohta, T. (2015). The evaluation of macroscopic and microscopic textures of sand grains using elliptic Fourier and principal component analysis: implications for the discrimination of sedimentary environments. Sedimentology 62, 1184–1197. doi:10.1111/sed.12183
Swan, B. (1974). Measures of particle roundness; a note. J. Sediment. Res. 44, 572–577. doi:10.1306/74D72A90-2B21-11D7-8648000102C1865D
Tafesse, S., Robison Fernlund, J. M., Sun, W., and Bergholm, F. (2013). Evaluation of image analysis methods used for quantification of particle angularity. Sedimentology 60, 1100–1110. doi:10.1111/j.1365-3091.2012.01367.x
Townley, B. K., Hérail, G., Maksaev, V., Palacios, C., de Parseval, P., Sepulveda, F., et al. (2003). Gold grain morphology and composition as an exploration tool: application to gold exploration in covered areas. Geochem. Explor. Environ. Anal. 3, 29–38. doi:10.1144/1467-787302-042
Tutumluer, E., and Pan, T. (2008). Aggregate morphology affecting strength and permanent deformation behavior of unbound aggregate materials. J. Mater. Civ. Eng. 20, 617–627. doi:10.1061/(ASCE)0899-1561(2008)20:9(617)
van Eck, N. J., and Waltman, L. (2010). Software survey: VOSviewer, a computer program for bibliometric mapping. Scientometrics 84, 523–538. doi:10.1007/s11192-009-0146-3
Ventura, G., De Rosa, R., Colletta, E., and Mazzuoli, R. (1996). Deformation patterns in a high-viscosity lava flow inferred from the crystal preferred orientation and imbrication structures: an example from Salina (Aeolian Islands, southern Tyrrhenian Sea, Italy). Bull. Volcanol. 57, 555–562. doi:10.1007/BF00304439
Vernon, R. H., and Collins, W. J. (2011). Structural criteria for identifying granitic cumulates. J. Geol. 119, 127–142. doi:10.1086/658198
Wadell, H. (1932). Volume, shape, and roundness of rock particles. J. Geol. 40, 443–451. doi:10.1086/623964
Wadell, H. (1933). Sphericity and roundness of rock particles. J. Geol. 41, 310–331. doi:10.1086/624040
Wang, L., Wang, X., Mohammad, L., and Abadie, C. (2005). Unified method to quantify aggregate shape angularity and texture using Fourier analysis. J. Mater. Civ. Eng. 17, 498–504. doi:10.1061/(ASCE)0899-1561(2005)17:5(498)
Wentworth, C. K. (1919). A laboratory and field study of cobble abrasion. J. Geol. 27, 507–521. doi:10.1086/622676
Wentworth, C. K. (1922). The shapes of beach pebbles. Washington, DC, United States: USGS, 75–83. doi:10.3133/pp131C
Zheng, J., and Hryciw, R. D. (2016). Segmentation of contacting soil particles in images by modified watershed analysis. Comput. Geotech. 73, 142–152. doi:10.1016/j.compgeo.2015.11.025
Zheng, D., Wu, S., Ma, C., Xiang, L., Hou, L., Chen, A., et al. (2022). Zircon classification from cathodoluminescence images using deep learning. Geosci. Front. 13 (6), 101436. doi:10.1016/j.gsf.2022.101436
Keywords: quantitative descriptors, shape discrimination, computer vision, statistical analysis, image processing, petrography
Citation: Back AL, Kana Tepakbong C, Bédard LP and Barry A (2025) From rocks to pixels: a comprehensive framework for grain shape characterization through image analysis of roundness and roughness descriptors. Front. Earth Sci. 13:1634237. doi: 10.3389/feart.2025.1634237
Received: 23 May 2025; Accepted: 30 September 2025;
Published: 21 October 2025.
Edited by:
Muhammad Jawad Munawar, University of the Punjab, PakistanReviewed by:
Muhammad Aleem Zahid, Lasbela University of Agriculture, Water and Marine Sciences, PakistanEric Ferre, New Mexico State University, United States
Copyright © 2025 Back, Kana Tepakbong, Bédard and Barry. This is an open-access article distributed under the terms of the Creative Commons Attribution License (CC BY). The use, distribution or reproduction in other forums is permitted, provided the original author(s) and the copyright owner(s) are credited and that the original publication in this journal is cited, in accordance with accepted academic practice. No use, distribution or reproduction is permitted which does not comply with these terms.
*Correspondence: A. L. Back, YXJuYXVkLWxvdWlzLWFiZWwuYmFjazFAdXFhYy5jYQ==