Abstract
China’s western alpine regions are rich in mineral resources. However, factors such as freeze-thaw erosion, earthquakes, rainfall, and mining disturbances have weakened the strength of rock masses in alpine mine slopes, leading to structural weathering. These issues severely compromise the safety and stability of rock slopes and hinder the safe, efficient production of mineral resources. Both impact loads (such as blasting) and seismic loads can induce instantaneous deformation in structures and their components, sharing similar mechanisms of action. Therefore, this study conducts dynamic impact tests on sandstone based on the research context of impact loads including seismic events and excavation blasting. This study focuses on the Lanping Lead-Zinc Mine. First, through freeze-thaw cycle tests, SHPB (Split Hopkinson Pressure Bar) impact tests, and DIC (Digital Image Correlation) technology, the impact mechanical responses and failure characteristics of sandstone specimens under different freeze-thaw cycles were investigated. The dynamic mechanical properties and crack propagation patterns of sandstone under impact loading at various freeze-thaw cycles were revealed. The findings indicate that the strain rate ε´-t curve of sandstone specimens under dynamic impact is characterized by “increasing-stabilizing-accelerating decrease”. The strain (ε-t) curve initially increases before stabilizing, and the peak strain rises with the number of freeze-thaw cycles. The stress-strain response of sandstone under impact loading can generally be divided into three stages: linear elastic, nonlinear hardening, and strain softening. The slope of the stress-strain curve in the elastic stage decreases as the number of freeze-thaw cycles increases. The dynamic peak stress and dynamic elastic modulus of sandstone gradually decrease with increasing freeze-thaw cycles. Analysis of the dynamic evolution of Y-directional strain in sandstone specimens under impact loading using DIC technology reveals that crack propagation is closely linked to strain concentration zones on the specimen surface. The distribution of axial strain concentration zones determines the initiation and expansion of primary and secondary cracks during specimen failure. The conclusions of this study provide theoretical insights for disaster prevention and control (e.g., frost heave and dynamic loading) in rock slope engineering in alpine mining regions.
1 Introduction
With the exploitation of open-pit mineral resources, the number of high and steep slopes has gradually increased, leading to frequent safety accidents in open-pit mines. According to statistics from 2001 to 2007 (Yang et al., 2020), there were 1951 slope collapse incidents in metal and non-metal open-pit mines, accounting for 15% of all accidents (ranking third), resulting in 3,065 casualties (18.75% of total casualties, ranking first). Among these, 228 incidents involved three or more fatalities, making up 38.3% of such severe accidents (ranking first), with 994 deaths (33% of total fatalities, ranking first). Further data from 2017 shows that slope landslides ranked third among all mine safety accidents in terms of both incidence (13.5%) and fatalities (9.3%) in China’s non-coal mining sector (Ministry of Emergency Management of the People’s Republic of China, 2017). Therefore, the stability of high rock slopes in open-pit mines is a critical issue for safe production, with significant theoretical and practical implications for ensuring mining safety and improving economic efficiency (Wang, 2017). China’s western alpine regions are rich in mineral resources, but due to harsh geographical conditions and extreme climates, slope failures occur frequently, severely impacting mine safety (Hou, 2022). For instance, in March 2013, a catastrophic landslide at the Jiama Mining Area in Lhasa, Tibet, was triggered by rock weathering and degradation caused by freeze-thaw cycles in the high-altitude environment, combined with seismic activity. The disaster buried 83 people and covered an area of 3–4 km2 (Li et al., 2021).
Many scholars at home and abroad have done a lot of research on the physico-mechanical properties of rock body under freeze-thaw cycle, dynamic load and the coupling of the two, and achieved certain results. Jia et al. found that the permeability and surface roughness of sandstone increased after freeze-thaw and the uniformity coefficient of the pore size showed a linear decrease phenomenon by comparing the internal pore structure of rock before and after freeze-thaw (Jia et al., 2020). An et al. proposed a method to measure the shape and size of geotechnical particles based on smartphone photography. This approach significantly reduces experimental costs and technical barriers, offering a promising technological pathway for rapid on-site analysis and instructional demonstrations (An et al., 2025). Zhou et al. have theoretically analyzed the correlation between specimen, deformation stress, incident stress, reflected stress and transmitted stress by means of the SHPB test results of the pulse shaper and special shape firing pin method to obtain the ontological relationship of rate-dependent rocks (Zhou et al., 2010). For different waveform incident waves, a method of stepwise equivalent simplification of incident waves is proposed to study the influence of sample wave impedance and incident wave rise time on transmitted and reflected waves (Li et al., 2025). Li et al. carried out a test on freeze-thaw cycle of granite (Li et al., 2018), which showed that the internal cracks of rock would increase and expand continuously after freeze-thaw cycle, resulting in the deterioration of rocky slope stability (Zhu et al., 2021; Zhou et al., 2015). Zhang Shuoyan et al. found that the damage degree of frozen sandstone specimens was weaker than that of ambient sandstone specimens under the same water content by conducting SHPB impact tests on sandstones with different water contents (Zhang et al., 2024). Wang et al. revealed the energy dissipation mechanism and crack expansion characteristics of engineering rocks in cold regions by conducting freeze-thaw cycling experiments on granite (Wang et al., 2019). Zhang and Wang (2022) conducted SHPB tests on sandstone with different numbers of freeze-thaw cycles, and the results showed that the longitudinal wave velocity, dry density, dynamic peak stress, elastic modulus, and average fracture block size of sandstone rock samples gradually decreased with the increase of the number of freeze-thaw cycles (Zhang and Wang, 2022). Gao Feng et al. found that the average uniaxial dynamic compressive and tensile strengths of rock samples under low-temperature freezing conditions were greater than those of rock samples at room temperature by conducting dynamic impact mechanical tests on rock samples under low-temperature freezing conditions (Gao et al., 2023). Liu Shaohe et al. conducted SHPB tests on red sandstone specimens with different numbers of freeze-thaw cycles, and the results showed that with the increase of the number of freeze-thaw cycles, the dynamic peak strain of the rock samples gradually increased and the dynamic modulus of elasticity gradually decreased (Liu et al., 2017). Xia Fei et al. in order to study the damage deterioration of mine slope rock in cold area under the action of freeze-thaw cycle, based on the indoor freeze-thaw cycle test and nuclear magnetic resonance (NMR) technology, analyzed the change rule of the amount of change in porosity and strength damage of quartz sandstone and greywacke, and based on the amount of change in porosity, established a strength deterioration model of the rock under different number of freeze-thaw cycles (Xia et al., 2022). Mei et al. based on the freeze-thaw cycle test, uniaxial compression test and SHPB test, the freeze-thaw damage ontological relationship of red sandstone under combined dynamic and static loading was established, which can reflect the effects of axial compression and freeze-thaw coupling damage, dynamic impact parameter, etc (Mei et al., 2021). Ping et al. analyzed the dynamic damage evolution characteristics of sandstone under 0–100 freeze-thaw cycles based on SHPB test and found that with the increase of loading rate, the dynamic compressive strength and dynamic elastic modulus of specimen increased, and the dynamic stress and dynamic elastic modulus increased, and the dynamic stress and dynamic elastic modulus increased. Modulus of elasticity increased and dynamic strain decreased (Ping et al., 2020). Lu et al. investigated the dynamic mechanical properties of sandstone by using SHPB test and DIC digital image technique (Lu et al., 2022). The study showed that the temperature had a significant effect on the mechanical properties and initial damage of sandstone, and meanwhile, the process of crack formation and expansion was explained by using DIC technique. Jia et al. carried out SHPB tests on muddy siltstone under different damage conditions after freeze-thaw cycling treatment and found that the dynamic compressive strength and strain rate of sandstone containing initial damage under freeze-thaw conditions decreased exponentially, and that containing the initial damage exacerbated the damage deterioration of the rock (Jia et al., 2022). Chen Hui et al. carried out 0–120 freeze-thaw cycle tests to analyze the fine structure of rocks in cold regions after freeze-thaw cycle, and found that after freeze-thaw cycle, the internal pores of rocks have obvious fractal characteristics, and the fractal dimension of the pores shows “V” type changes with the increase of freeze-thaw cycle times, and the complexity of pores increases and the connectivity increases with the increase of fractal dimension. As the fractal dimension increases, the complexity of the pores increases and the connectivity is enhanced (Chen et al., 2022).
With regard to the mechanical properties of rocks under the conditions of freeze-thaw cycles, most scholars at home and abroad have focused their research on the freeze-thaw properties of rocks on the macroscopic mechanical properties of freeze-thaw damage. However, for sandstone specimens in the western alpine region of China, the deterioration mechanism of rock damage under the coupled action of dynamic loading and freeze-thaw cycle is unclear, and the mechanical properties are not known. In order to ensure the safety of mine engineering construction and operation in the cold region, it is of great significance to study the deterioration law of physical and mechanical properties of rocks under the coupled action of freeze-thaw cycle-dynamic load for exploring the destructive mechanism of rocky slopes of mines in the alpine region and the safe construction of rock engineering in this region.
2 Engineering overview
The Lanping Lead-Zinc Mine is located in Lanping County, Yunnan Province (Figure 1). The mining area lies in the central part of the Hengduan Mountains in northwestern Yunnan, on the eastern slope of the Gaoping-Laomujing synclinal basin. The highest elevation within the mining area is 2,885 m, while the lowest is 2,475 m, resulting in a relative height difference of 410 m. After years of mining operations, the open-pit stope in the Beichang-Jiayashan ore section has taken on an inverted “C” shape. Currently, production is primarily concentrated in the Beichang ore section, where a large-scale hillside open-pit stope has been formed, consisting of the northern, eastern, southern, and relatively gentle western slopes. The top of the stope is located at an elevation of 2,740 m on the northern slope, while the bottom is at 2,552 m, making the mining depth 188 m.
FIGURE 1

Location of lanping lead-zinc mine.
Due to the combined effects of freeze-thaw weathering, rainfall, and seismic activity, small-scale landslides have occurred on individual or multiple benches of the sandstone rock mass on the southern slope of the mining area (Figure 2). Additionally, cracks have developed on the slope platforms along the upper sections of the northern and southern slopes (Figure 3). The eastern slope consists of highly to completely weathered argillaceous sandstone, which has been eroded by rainwater, forming gullies that significantly impact slope stability. On the lower section of the northern slope, the rock mass is composed of black argillaceous siltstone with weak weathering resistance. The slope surface is highly weathered, breaking down into fine sand and gravel. Furthermore, remnants of old underground mining tunnels in this area also pose localized stability risks.
FIGURE 2

Minor landslides on mine slope terraces.
FIGURE 3

Multi-step landslides and platform cracks on mine slopes.
3 Physical experimental design
3.1 Freeze-thaw cycle test
Under the influence of long-term freezing and thawing cycles, earthquakes and other factors, the rock body of the mine slope will have certain damage deterioration, causing serious safety hazards. In order to study the destabilization and damage mechanism of the mine slope, this paper carries out the freeze-thaw cycle test and impact mechanical test on the sandstone specimens in the field. The size of the sandstone specimen used in the test is 50 mm × 50 mm (Figure 4).
FIGURE 4

Sandstone specimen.
The freeze-thaw cycle test program is to saturate the sandstone specimens, and after the rock samples are thoroughly saturated, they are put into the fully automatic freeze-thaw cycle box for freeze-thaw cycle processing. Synthesis of climate extremes in the study area and related literature (Zhang et al., 2022), the freezing temperature was set to −20°C, the freezing time was 4 h, the thawing temperature was set to 20°C, the thawing time was set to 4 h, and one freeze-thaw cycle was set to 8 h (Figure 5), and the freeze-thaw cycle test was completed for 0, 10, 20, 30, 40, and 50 times, respectively. Among them, the next freeze-thaw cycle process was carried out immediately after the completion of each specimen freeze-thaw cycle. There were a total of 6 groups of freeze-thaw cycle tests, with 3 specimens in each group.
FIGURE 5
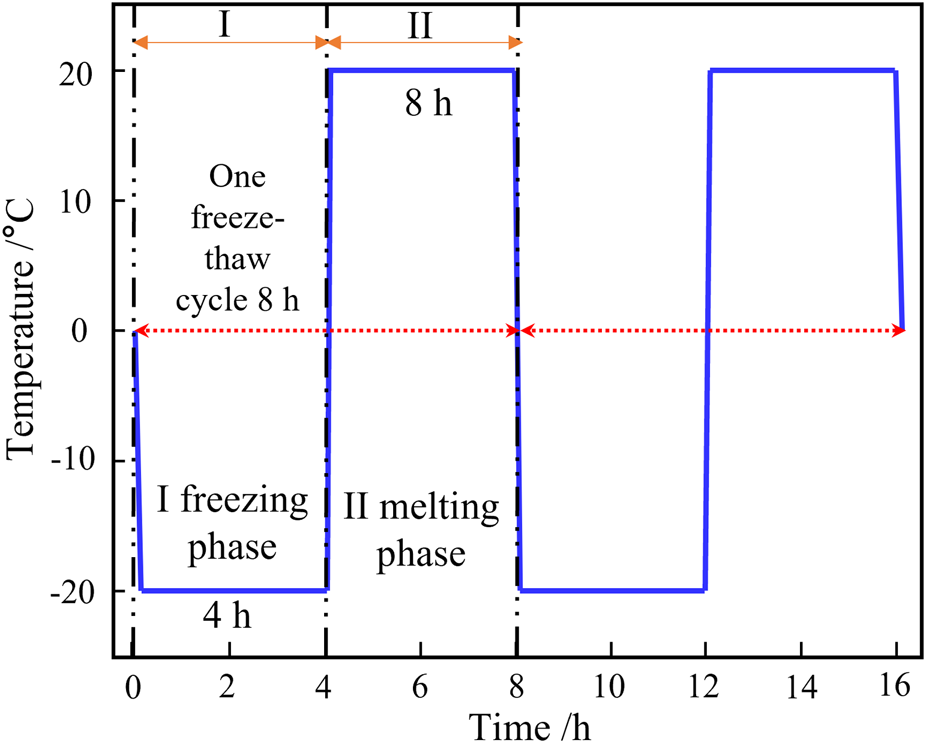
Freeze-thaw cycle temperature field.
3.2 Impact mechanics test
The Hopkinson dynamic impact mechanics test system primarily consists of a Split Hopkinson Pressure Bar (SHPB) apparatus, with incident and transmission bars measuring 50 mm in diameter, along with a data acquisition and processing system. The SHPB test setup includes the following components: Gas gun (capable of generating 0–2 MPa impact pressure), Striker projectile, Incident bar, Transmission bar, Energy absorber (damper) Additionally, a high-speed camera system was employed to record the failure process of sandstone specimens during testing. The high-speed imaging system operated at a frame rate of 75,000 frames per second (Figure 6).
FIGURE 6

Schematic diagram of SHPB test set system and conventional SHPB test set.
The loading air pressure of the impact mechanical test is 0.2 MPa, and the speed is 8 m/s∼10 m/s. Before the test, a piece of vacuum sealing mud should be placed at the end of the projectile rod in contact with the impact slug as a waveform shaper, which is used to reduce the amplitude of the transverse oscillatory waveform in order to obtain the slower and smoother waveform along the rising edge. At the same time, in order to reduce the inertial effect and friction caused by the radial impact, the sandstone specimen and the projectile rod, the projectile rod and the two contact surfaces coated with petroleum jelly (Figure 7). It's an effective way to reduce the amplitude of oscillations and ensure smoother waveform propagation (Haroon et al., 2017).
FIGURE 7

Schematic diagram of scattering treatment of rock samples.
4 Analysis of test results
4.1 Waveform curves of specimens under different freeze-thaw cycles
To minimize errors from freeze-thaw cycle tests and SHPB tests, the average value of three experimental datasets was adopted for analysis in this study. As shown in Figure 8 for the waveform curve of the impact mechanics test of sandstone under different numbers of freeze-thaw cycles, it can be seen that, because of the selection of a suitable waveform shaper between the impact rod and the incident rod in the SHPB test system, the shape of the original waveform curve obtained from the test is basically a half-sinusoidal waveform and the curve does not have any obvious oscillations, and the superposition of the incident wave and the reflected wave is basically equal to the transmitted wave. According to the principle of one-dimensional wave propagation theory and three-wave analysis method, the force P1 and P2 acting on both ends of the test piece can be calculated as:
FIGURE 8

Dynamic impact test result graph.
Where: P1 is the dynamic force at the incident rod-specimen interface; P2 is the dynamic force at the transmitted rod-specimen interface; A is the cross-sectional area of the rod; E is the Young’s modulus of the elastic rod; ε is the strain; and the subscripts i, r, and t denote the incident wave, reflected wave, and transmitted wave, respectively.
According to Equations 1, 2, the dynamic force P1 acting on one side of the specimen is proportional to the sum of the incident and reflected stress waves, and P2 on the other side is proportional to the transmitted stress wave. As can be seen in Figures 8a–c, the curves of the sum of incident and reflected stress waves almost coincide with those of the transmitted waves, which indicates that P1 and P2 are almost identical during the dynamic loading period, in which case the inertial effect is neglected because there is no global force difference in the specimen to induce inertial force, i.e., the specimen reaches stress equilibrium, which proves the accuracy and validity of dynamic uniaxial compression test. According to the strain rate and strain curves of sandstone rock samples under dynamic impact, it was found that the strain rate ε′-t curve showed a trend of increasing first, then stabilizing, and finally decreasing rapidly, and the strain rate was more stable during the overall loading process, and the strain ε′-t curve showed an increase first, and then tended to be stabilized, and the strain peak increased gradually with the increase of the number of freezing and thawing.
4.2 The variation law of stress and strain of rock sample after freeze-thaw cycle
It can be seen from Figure 9 that the sample directly entered the elastic stage in the dynamic test, and there was no compaction stage, which was mainly due to the late closure of the microcracks inside the sample under the impact load and the large inertia of the rock crystal. After the linear elastic stage, the sample enters the nonlinear hardening stage and the strain softening stage. According to the stress-strain curve, it can be found that the post-peak curve in the failure stage can be divided into three types: post-peak plasticity, stress drop and strain rebound (Ke et al., 2018). With the increase of the number of freeze-thaw cycles, the slope of the stress-strain curve in the elastic stage decreases, the peak stress of the sample decreases, and the peak strain increases, indicating that the internal damage of the sandstone gradually accumulates and increases, which will lead to the decrease of elastic modulus and final strength.
FIGURE 9

Dynamic stress-strain curves of sandstones treated with different numbers of freeze-thaw cycles.
As shown in Figure 10, when the number of freeze-thaw cycles of sandstone rock samples is 0, the peak stress intensity is 218.95 MPa. When the number of freeze-thaw cycles is 10, the peak stress intensity of rock samples is 213.69 MPa, and the peak stress decreases by 2.4%. When the number of freeze-thaw cycles is 20, the peak stress intensity of rock samples is 208.02 MPa, and the peak stress decreases by 5.0%. When the number of freeze-thaw cycles is 30, the peak stress intensity of rock samples is 189.39 MPa, and the peak stress decreases by 13.5%. When the number of freeze-thaw cycles is 40, the peak stress intensity of rock samples is 157.79 MPa. The peak stress decreased by 27.9%. When the number of freeze-thaw cycles was 40 times, the peak stress of the rock sample was 126.04 MPa, and the peak stress decreased by 42.4%. From the above data, it can be seen that when the number of freeze-thaw cycles is within 20 times, the damage of the freeze-thaw cycle to the rock sample is small and can be ignored. With the increase of the number of freeze-thaw cycles, to 30 times, 40 times, 50 times, the peak stress drops sharply, indicating that the rock sample has undergone more serious damage under the action of freeze-thaw cycles.
FIGURE 10

Dynamic compressive strength of sandstones treated with different numbers of freeze-thaw cyclesh.
4.3 The variation law of dynamic elastic modulus of rock samples after freeze-thaw cycles
At present, there are mainly three methods for calculating the dynamic elastic modulus of rock: the secant definition method of stress-strain curve (Jin et al., 2012), the slope definition method between 50% and 100% stress peak strength (Gong et al., 2011) and the slope definition method from 0.4Rd (Rd is the dynamic stress peak strength of sandstone) to 0.6Rd (Li et al., 2014; Zhang and Deng, 2019). Considering the dynamic deformation characteristics of sandstone, the dynamic elastic modulus of sandstone samples treated with different freeze-thaw cycles was analyzed by the method proposed in Reference (Gong et al., 2011). It can be seen from Figure 11 that with the increase of freeze-thaw cycles, the dynamic elastic modulus of rock samples decreases continuously, and the downward trend shows a certain linear relationship. It is proved that with the increase of freeze-thaw cycles, the internal structure of rock gradually accumulates under the action of cyclic frost heave, which significantly affects dynamic mechanical behavior (Ahmad et al., 2019; Ahmad et al., 2021).
FIGURE 11

Dynamic Young’s modulus of sandstone under different number of freeze-thaw cycles.
4.4 Strain field and displacement field evolution based on digital image technology
In order to study the distribution of strain field and the dynamic evolution of crack propagation during the failure process of sandstone samples under impact load, this study uses digital image technology (DIC) to analyze the imaging images of progressive fracture, and sets up two virtual strain gauges on the surface of the sample to obtain the surface strain distribution and crack propagation process of sandstone samples. This paper selected five displacement monitoring points, A1-A5, on the specimen surface. These points were arranged in the middle section of the specimen at equal intervals, with their specific locations shown in Figure 12.
FIGURE 12

Virtual strain gauge placement.
In this paper, according to the definition of elasticity, the tensile strain is positive and the compressive strain is negative. At the initial stage of loading, the strip-like positive strain concentration began to appear in some areas of the rock sample surface, which was the result of the initial tensile crack. After that, with the continuous superposition of the incident wave and the reflected wave inside the sample, the axial strain concentration area began to expand from the middle of the sample surface to both ends of the sample. By observing the stress concentration area in Figure 13a, it can be seen that when the loading time is 2970 us, multiple strain concentration areas appear on the surface of the rock sample, and the strain concentration area continues to expand with the loading. When loaded to 3186 us, the strain concentration area on the surface of the sample is connected to form two nearly parallel strain concentration areas, and two large cracks appear in the sample. From the stress concentration area of Figures 13a–f, it can be seen that there are two parallel strain concentration areas in Figures 13a,c,e,f, and cross strain concentration appears in Figures 13b,d. The initial strain concentration areas of b and d are in the middle of the rock surface, while the initial strain concentration areas of a, c, e and f are deviated from the middle position. The results show that the evolution process of crack propagation under impact load is inseparable from the strain concentration position on the surface of the specimen. The development of fracture zones is aligned with simulation-based studies of crack behavior in cemented geomaterials (Rizvi et al., 2020). The distribution of axial strain concentration area determines the generation and propagation of initial cracks and secondary cracks during the failure process of the specimen. Based on Figure 14, the displacements of the rock specimens after 10 and 30 freeze-thaw cycles are positive at monitoring points A4 and A5, but negative at points A1 to A3. This relationship between positive and negative values indicates the existence of a crack between A4 and A3.
FIGURE 13

Cloud diagrams of axial strain distribution of sandstone specimens with different numbers of freeze-thaw cycles under impact loading. (a) 0 freeze-thaw cycles; (b) 10 freeze-thaw cycles; (c) 20 freeze-thaw cycles; (d) 30 freeze-thaw cycles; (e) 40 freeze-thaw cycles; (f) 50 freeze-thaw cycles.
FIGURE 14
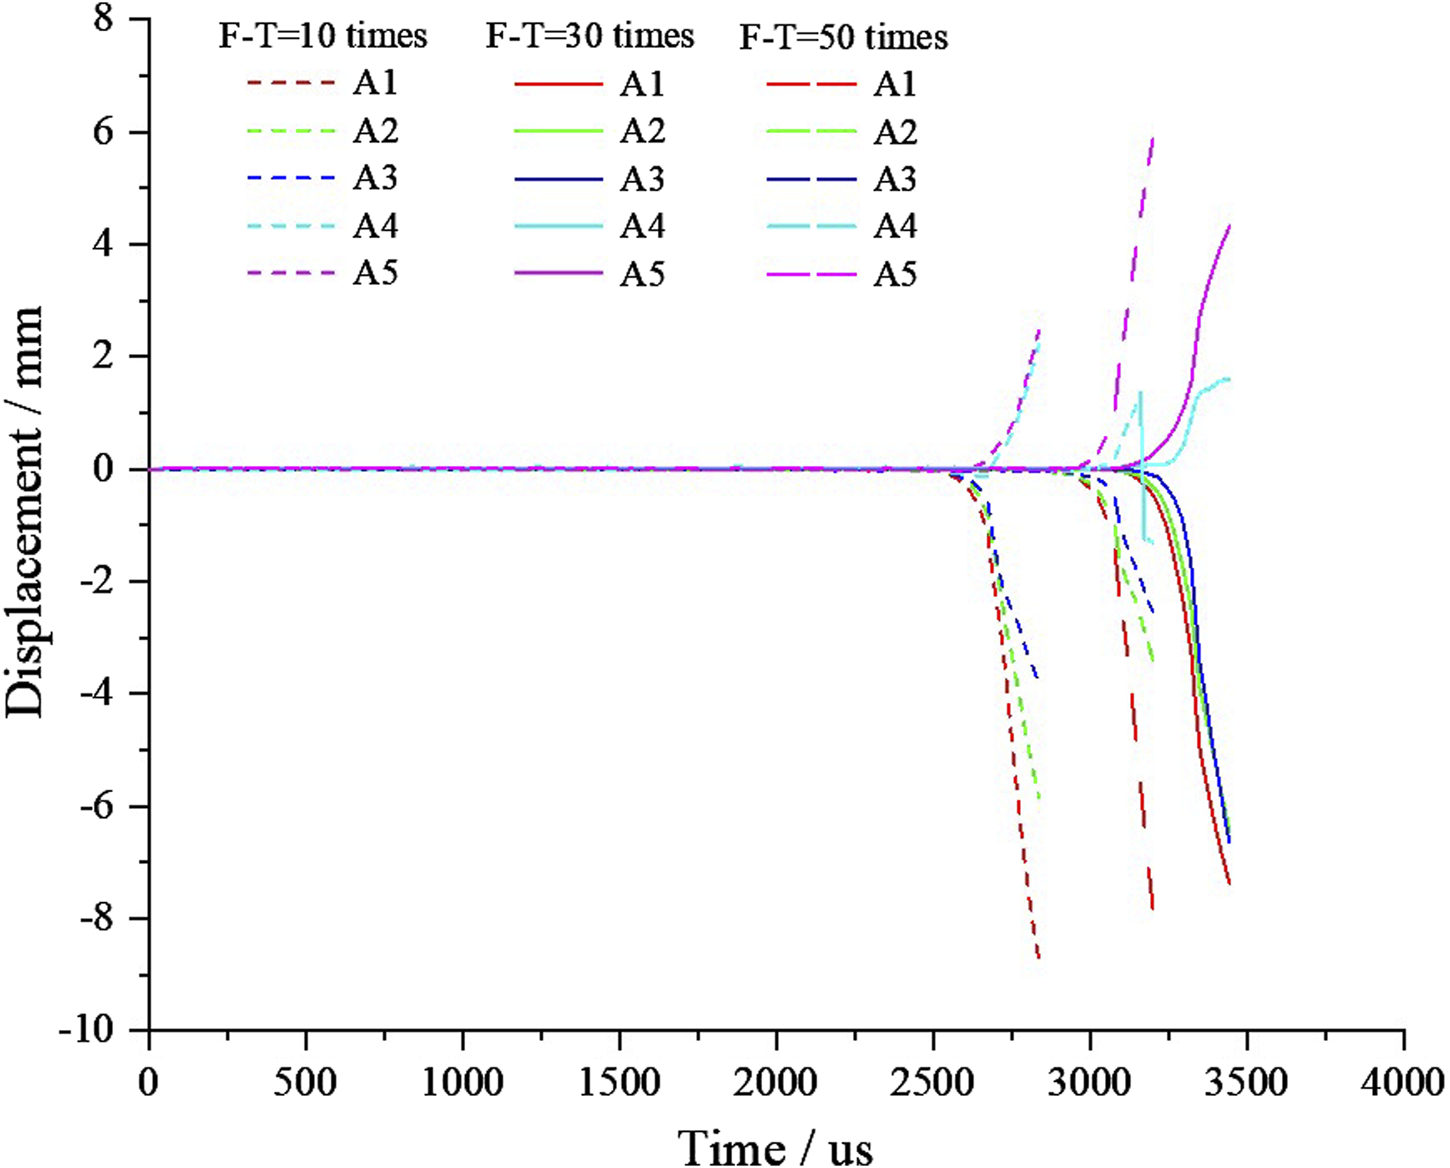
Y-direction displacement at different monitoring points of sandstone samples under freeze-thaw and impact loads.
It can be seen from the results of the virtual strain gauge measurement that the strain in the Y direction is much larger than that in the X direction, especially when geometric discontinuities influence stress concentration (Alsabhan et al., 2021), which indicates that the failure of the intact rock sample is less related to the strain in the shear direction during the loading process, which proves that the failure type of the rock sample under the impact load is the conclusion of splitting failure. Moreh et al. support recent efforts in using AI to predict crack localization in structural materials (Moreh et al., 2024).
5 Conclusion
In this paper, Lanping lead-zinc mine is taken as the research background. Firstly, based on freeze-thaw cycle test, SHPB impact test and DIC digital graphic technology, the impact mechanical response and failure characteristics of sandstone samples under different freeze-thaw cycles are studied, and the dynamic mechanical characteristics and crack propagation law of sandstone under different freeze-thaw cycles are revealed. The following main conclusions are drawn:
(1) The strain rate ε' -t curve of sandstone specimens under dynamic impact shows a trend of increasing first, then stabilizing, and finally decreasing rapidly. The strain rate of the whole loading process is relatively stable. The strain ε-t curve increases first and then tends to be stable, and the peak strain increases with the increase of freeze-thaw cycles.
(2) The stress-strain response process of sandstone specimens under impact load can be roughly divided into linear elastic stage, nonlinear hardening stage and strain softening stage. And in the elastic stage, the slope of the stress-strain curve decreases with the increase of the number of freeze-thaw cycles. The dynamic stress peak strength and dynamic elastic modulus of sandstone samples gradually decrease with the increase of freeze-thaw cycles.
(3) The dynamic evolution process of Y-direction strain of rock samples under impact load is analyzed by DIC image technology. It is found that the crack propagation under impact load is inseparable from the strain concentration position on the surface of the sample. The distribution of axial strain concentration area determines the generation and propagation of initial cracks and secondary cracks in the failure process of the sample.
Statements
Data availability statement
The raw data supporting the conclusions of this article will be made available by the authors, without undue reservation.
Author contributions
HX: Writing – original draft, Investigation. SS: Writing – review and editing, Resources, Funding acquisition. JZ: Funding acquisition, Resources, Writing – review and editing, Writing – original draft. XB: Writing – review and editing, Supervision, Investigation. WT: Supervision, Validation, Writing – original draft. SH: Writing – original draft, Validation, Supervision. QZ: Writing – original draft, Writing – review and editing.
Funding
The author(s) declare that financial support was received for the research and/or publication of this article. This work is supported by the Study on the degradation mechanism of alpine metal mines slopes and the criterion for judging temporal and spatial stability (202301AS070008), National Natural Science Foundation of China (42177152), Outstanding Youth Foundation of Hubei Province, China (No. 2023AFA045).
Conflict of interest
Authors HX and SS were employed by Kunming Prospecting Design Institute of China Nonferrous Metals Industry Co., Ltd. Author SH was employed by Guangdong Construction Engineering Quality & Safety Testing Head Station Co., Ltd.
The remaining authors declare that the research was conducted in the absence of any commercial or financial relationships that could be construed as a potential conflict of interest.
Generative AI statement
The author(s) declare that no Generative AI was used in the creation of this manuscript.
Publisher’s note
All claims expressed in this article are solely those of the authors and do not necessarily represent those of their affiliated organizations, or those of the publisher, the editors and the reviewers. Any product that may be evaluated in this article, or claim that may be made by its manufacturer, is not guaranteed or endorsed by the publisher.
References
1
Ahmad S. Rizvi Z. Khan M. A. Ahmad J. Wuttke F. (2019). Experimental study of thermal performance of the backfill material around underground power cable under steady and cyclic thermal loading. Mater. today Proc.17, 85–95. 10.1016/j.matpr.2019.06.404
2
Ahmad S. Rizvi Z. H. Arp J. C. C. Wuttke F. Tirth V. Islam S. (2021). Evolution of temperature field around underground power cable for static and cyclic heating. Energies14 (23), 8191. 10.3390/en14238191
3
Alsabhan A. H. Sadique M. R. Ahmad S. Alam S. Binyahya A. S. (2021). The effect of opening shapes on the stability of underground tunnels: a finite element analysis. GEOMATE J.21 (87), 19–27. 10.21660/2021.87.j2267
4
An P. Yong R. Du S. Long Y. Chen J. Zhong Z. et al (2025). Potential of smartphone-based photogrammetry for measuring particle size and shape in field surveys. Bull. Eng. Geol. Environ.84 (5), 238–20. 10.1007/s10064-025-04246-7
5
Chen H. Yin H. J. Zhang J. H. (2022). Study on meso-structure and fractal dimension of freezing-thawing rock in mining slope in cold region. Ming R&D42 (04), 50–54. 10.13827/j.cnki.kyyk.2022.04.015
6
Gao F. Yang G. Xiong X. (2023). Experimental study on the dynamic mechanical characteristics of slope rock under low-temperature conditions. Chin. J. Eng.45 (02), 171–181. 10.13374/j.issn2095-9389.2021.11.26.004
7
Gong F. Q. Li X. B. Liu X. L. (2011). Preliminary experimental study of characteristics of rock subjected to 3d coupled static and dynamic loads. Chin. J. Rock Mech. Eng.30 (06), 1179–1190. Available at: https://rockmech.whrsm.ac.cn/EN/Y2011/V30/I6/1179#.
8
Haroon A. Ahmad S. Hussain A. (2017). “CFD prediction of loss coefficient in straight pipes,” in Development of water resources in India (Springer International Publishing), 477–485.
9
Hou Z. Q. (2022). Research on freezing-thawing mechanical properties of fractured rock masses and stability of mine slope in high altitude cold region. University of Science and Technology, Beijing. 10.26945/d.cnki.gbjku.2022.000131
10
Jia H. Ding S. Zi F. Dong Y. Shen Y. (2020). Evolution in sandstone pore structures with freeze-thaw cycling and interpretation of damage mechanisms in saturated porous rocks. Catena195, 104915. 10.1016/j.catena.2020.104915
11
Jia Y. F. Wang H. C. Xia D. (2022). Study on macroscopic dynamic properties of rock with impact damage on argillaceous siltstone under freeze-thaw. Metal. Mine (02), 36–41. 10.19614/j.cnki.jsks.202202005
12
Jin J. F. Li X. B. Yin Z. Q. (2012). Effects of axial pressure and number of cyclic impacts on dynamic mechanical characteristics of sandstone. J. China Coal Soc.37 (06), 923–930. 10.13225/j.cnki.jccs.2012.06.002
13
Ke B. Zhou K. Xu C. Deng H. Li J. Bin F. (2018). Dynamic mechanical property deterioration model of sandstone caused by freeze–thaw weathering. Rock Mech. Rock Eng.51, 2791–2804. 10.1007/s00603-018-1495-0
14
Li B. Zhou Z. D. Xiang S. J. (2021). Emergency response and rescue techniques for landslides in high-altitude areas of tibet-taking emergency response and rescue of karma landslide in Tibet as an example. Sichuan Water Resour. (S2), 59–62+74. Available at:https://scsn.chinajournal.net.cn/WKB/WebPublication/wkTextContent.aspx?navigationContentID=db922688-adf9-430b-94cd-def1f4845b4d&mid=scsn.
15
Li J. Zhou K. Liu W. Zhang Y. (2018). Analysis of the effect of freeze–thaw cycles on the degradation of mechanical parameters and slope stability. Bull. Eng. Geol. Environ.77, 573–580. 10.1007/s10064-017-1013-8
16
Li W. Fang S. Zhu Y. Li G. (2025). Effect of rock wave impedance on dynamic mechanical response in SHPB experiments. Geotechnical Geol. Eng.43 (2), 118–15. 10.1007/s10706-025-03087-1
17
Li Y. R. Huang D. Li X. A. (2014). Strain rate dependency of coarse crystal marble under uniaxial compression: strength, deformation and strain energy. Rock Mech. Rock Eng.47, 1153–1164. 10.1007/s00603-013-0472-x
18
Liu S. H. Xu J. Y. Wang P. (2017). A SHPB experimental study and microscomic analysis of freeze-thaw red sandstone. J. Of Vib. Shock36 (20), 203–209. 10.13465/j.cnki.jvs.2017.20.031
19
Lu H. Chen Q. Ma X. (2022). Investigation into dynamic behaviors of high-temperature sandstone under cyclic impact loading using DIC technology. Appl. Sci.12 (18), 9247. 10.3390/app12189247
20
Mei S. Liang X. Wen L. (2021). “Experimental study on mechanical properties of freeze-thaw damaged red sandstone under combined dynamic and static loading,” in Shock and vibration (Wiley), 1–14.
21
Ministry of Emergency Management of the People’s Republic of China (2017). The report of non coal mine production safety accident statistical analysis in 2017. Available at: https://www.mem.gov.cn/xw/gdyj/201805/t20180504_230192.shtml.
22
Moreh F. Lyu H. Rizvi Z. H. Wuttke F. (2024). Deep neural networks for crack detection inside structures. Sci. Rep.14 (1), 4439. 10.1038/s41598-024-54494-y
23
Ping Q. Sun H. Zhang C. Zhou X. (2020). Physics and dynamics characteristics and energy analysis of freeze-thaw limestone. Adv. Civ. Eng.2020. 10.1155/2020/8820172
24
Rizvi Z. H. Mustafa S. H. Sattari A. S. Ahmad S. Furtner P. Wuttke F. (2020). “Dynamic lattice element modelling of cemented geomaterials,” in Advances in computer methods and geomechanics: IACMAG symposium 2019 volume 1 (Singapore: Springer), 655–665.
25
Wang G. D. (2017). Stability analysis of open pit slopes in a mine on the Tibetan Plateau. Beijing: China University of Geosciences.
26
Wang Y. Feng W. Wang H. Han J. (2019). Geomechanical and acoustic properties of intact granite subjected to freeze–thaw cycles during water-ice phase transformation in beizhan’s open pit mine slope, xinjiang, China. China. Water11 (11), 2309. 10.3390/w11112309
27
Xia F. Zhao W. K. Liao X. (2022). Strength deeradation model of rock in tension and compression under freeze thaw cycles. Ming R&D42 (08), 146–152. 10.13827/j.cnki.kyyk.2022.08.004
28
Yang T. H. Wang H. Dong X. (2020). Current situation, problems and countermeasures of intelligent evaluation of slope stability in open pit. J. China Coal Soc.45 (6), 2277–2295. 10.13225/j.cnki.jccs.zn20.0347
29
Zhang H. M. Wang Y. F. (2022). Multi-scale analysis of damage evolution of freezing-thawing red sandstones. Rock Soil Mech.43 (08), 2103–2114. 10.16285/j.rsm.2021.1726
30
Zhang J. Deng H. W. Taheri A. Ke B. Liu C. (2019). Deterioration and strain energy development of sandstones under quasi-static and dynamic loading after freeze-thaw cycles. Cold Regions Sci. Technol.160, 252–264. 10.1016/j.coldregions.2019.01.007
31
Zhang R. R. Jing L. W. Ma D. D. (2022). SHPB tests and constitutive model of red-sandstone after freeze-thaw and thermal shock cycles. J. Of Vib. Shock41 (09), 267–275. 10.16285/j.rsm.2021.1726
32
Zhang S. Y. Jiang N. Yao Y. K. (2024). Equivalent modeling of energy dissipation in impact and rock blasting fragmentation of frozen sandstone. Chin. J. Rock Mech. Eng.43 (05), 1255–1269. 10.13722/j.cnki.jrme.2023.0964
33
Zhou K. Bin L. I. Li J. Deng H. w. Bin F. (2015). Microscopic damage and dynamic mechanical properties of rock under freeze–thaw environment. Trans. Nonferrous Metals Soc. China25 (4), 1254–1261. 10.1016/s1003-6326(15)63723-2
34
Zhou Z. Li X. Ye Z. Liu K. (2010). Obtaining constitutive relationship for rate-dependent rock in SHPB tests. Rock Mech. Rock Eng.43, 697–706. 10.1007/s00603-010-0096-3
35
Zhu T. Chen J. Huang D. Luo Y. Li Y. Xu L. (2021). A DEM-based approach for modeling the damage of rock under freeze–thaw cycles. Rock Mech. Rock Eng.54, 2843–2858. 10.1007/s00603-021-02465-4
Summary
Keywords
rocky mine slopes, freeze-thaw cycles, split hopkinson pressure bar (SHPB), digital image correlation (DIC), alpine regions, sandstone
Citation
Xu H, Sui S, Zou J, Bao X, Tian W, He S and Zhang Q (2025) Experimental study on the mechanical properties of freeze-thaw cycled sandstone under dynamic loading. Front. Earth Sci. 13:1636234. doi: 10.3389/feart.2025.1636234
Received
27 May 2025
Accepted
30 June 2025
Published
01 August 2025
Volume
13 - 2025
Edited by
Krzysztof Skrzypkowski, AGH University of Krakow, Poland
Reviewed by
Zarghaam Rizvi, GeoAnalysis Engineering GmbH, Germany
Pengju An, Ningbo University, China
Updates
Copyright
© 2025 Xu, Sui, Zou, Bao, Tian, He and Zhang.
This is an open-access article distributed under the terms of the Creative Commons Attribution License (CC BY). The use, distribution or reproduction in other forums is permitted, provided the original author(s) and the copyright owner(s) are credited and that the original publication in this journal is cited, in accordance with accepted academic practice. No use, distribution or reproduction is permitted which does not comply with these terms.
*Correspondence: Junpeng Zou, zoujunpeng@cug.edu.cn; Quan Zhang, 16156834@qq.com
Disclaimer
All claims expressed in this article are solely those of the authors and do not necessarily represent those of their affiliated organizations, or those of the publisher, the editors and the reviewers. Any product that may be evaluated in this article or claim that may be made by its manufacturer is not guaranteed or endorsed by the publisher.