 Chenglong Zhang1*†Wentao Zhao2,3
†Tieya Jing2,3Junbin Zhao4Jian Zhang2,3Mingyi Wei5Juan Zhou2,3
Chenglong Zhang1*†Wentao Zhao2,3
†Tieya Jing2,3Junbin Zhao4Jian Zhang2,3Mingyi Wei5Juan Zhou2,3
 Lei Fu
1*
Lei Fu
1*- 1 Center for Hydrogeology and Environmental Geology Survey, Tianjin, China
- 2 China Huaneng Clean Energy Research Institute, Beijing, China
- 3 National Key Laboratory of High-Efficiency Flexible Coal Power Generation and Carbon Capture Utilization and Storage, Beijing, China
- 4 Shanxi Institute of Geological Survey CO., LTD., Taiyuan, China
- 5 CHN Energy Inner Mongolia Shanghaimiao Power Generation Co., LTD., Erenhot, China
Introduction: The volumetric method is the primary approach for calculating geological CO2 storage potential, with its accuracy largely dependent on the pore volume of reservoir rocks and the effective storage coefficient. While the precision of reservoir rock pore volume can be enhanced through more sophisticated geological exploration techniques, the current selection of effective storage coefficients lacks a theoretical foundation. Thus, obtaining a more accurate effective storage coefficient is crucial for improving the evaluation precision of CO2 geological storage potential.
Methods: To explore the factors influencing the effective carbon sequestration coefficient in saline aquifers and accurately assess their storage potential, nine sets of multiphase flow core displacement experiments were conducted using orthogonal design, with porosity, confining pressure, and pressure difference as variables.
Results: The results indicate that among these three factors, porosity has the most significant impact on maximum residual CO2 saturation.
Discussion: Qualitative analysis of water migration in cores during displacement was performed using nuclear magnetic resonance (NMR) T2 curves, revealing a close correlation between water movement and pore structure: water in mesopores and macropores is preferentially displaced, whereas water in nanopores and micropores is more resistant to displacement. Additionally, NMR was employed to analyze the maximum residual CO2 saturation of artificial cores under different conditions, leading to the establishment of a multiple linear regression equation for maximum residual CO2 saturation. By incorporating the volume coefficient derived from numerical simulations, the geological CO2 storage coefficient for actual engineering sites can be estimated.
1 Introduction
Geological CO2 storage refers to the process of injecting CO2—primarily captured from large industrial emission sources—into suitable geological formations (e.g., deep saline aquifers and depleted oil and gas reservoirs) through engineering techniques to achieve its long-term isolation from the atmosphere (Bert et al., 2005; Jing, 2021; Guo et al., 2014). It is estimated that by 2060, the contribution of CCUS technology to China’s carbon neutrality goal could exceed 500 million tons (Ding, 2021; Xiaochun et al., 2006). Among all geological formations suitable for CO2 storage, saline aquifers account for 95.6% of the total storage potential, far exceeding that of other formation types. Owing to their enormous potential and wide distribution, carbon sequestration in saline aquifers is regarded as a critical supporting technology for achieving carbon peak and carbon neutrality targets.
Referring to the calculation method for geological CO2 storage in saline aquifers proposed by the U.S. Department of Energy based on volumetric theory, the formula for estimating the CO2 storage potential of saline aquifers is as follows (Goodman et al., 2011; USDOE, 2006; Song et al., 2015):
where P (kg) is geological potential, A (m2) is reservoir area, h (m) is thickness, ϕ (%) is porosity, and ρ CO2 (kg/m3) is CO2 density. E, the carbon sequestration coefficient, is defined as the ratio of the volume of supercritical CO2 to the total pore space of the formation. And it is a dimensionless geological coefficient.
As indicated by the formula, the accuracy of CO2 geological storage potential calculations depends largely on the pore volume of reservoir rocks and the effective storage coefficient. While the precision of reservoir rock pore volume can be improved via advanced geological exploration techniques, the current selection of effective storage coefficients lacks a theoretical basis. Thus, obtaining a more accurate effective storage coefficient is crucial for enhancing the precision of CO2 geological storage potential evaluations.
Most existing studies on effective storage coefficients for geological CO2 sequestration have been conducted under idealized experimental conditions or via numerical models (Dai et al., 2022; Diao et al., 2023; Fu et al., 2022; Lei et al., 2022; Wei et al., 2013; 2021; 2022; Yang et al., 2019; Zhang et al., 2005; Zhang et al., 2019), failing to reflect the high complexity of real-world on-site scenarios. Currently, the mainstream storage coefficient used in calculating CO2 storage potential in saline aquifers is 0.02, which involves significant uncertainties (Goodman et al., 2011; Song et al., 2015; Diao et al., 2017; Guo et al., 2014). In practice, saline aquifers exhibit substantial variations in geological characteristics across regions, such as porosity, permeability, formation pressure, temperature, and formation water chemistry. These factors are interrelated, and traditional experimental methods struggle to systematically analyze the role of each factor, making it difficult to determine a unified and accurate storage coefficient.
To investigate the carbon sequestration coefficient in saline aquifers, this study adopted an orthogonal experimental design, using artificial cores with significantly different porosities as experimental materials. A multiphase flow displacement NMR analysis system was employed to conduct nine sets of core multiphase flow displacement experiments via orthogonal design, with porosity, confining pressure, and pressure difference as variables (Dongjiang et al., 2021). The maximum residual CO2 saturation of artificial cores under different conditions was obtained, thereby accurately identifying the relative importance and interactions of each factor on the storage coefficient. This effectively addresses the limitations of existing studies in comprehensively analyzing multiple factors. A multiple linear regression equation for maximum residual CO2 saturation was established, which can provide a reference for determining carbon storage coefficients in saline aquifers in future research.
2 Methodology
2.1 Experimental apparatus
The MesoMR12-060H-I multiphase flow displacement NMR system (Figure 1) was used, featuring.
• Relaxation spectrum testing: Analyzes porosity, pore size distribution, saturation, and layered water content.
• High/low temperature and pressure displacement: Supports pressures of 0–15 MPa, temperatures of −30 °C–40 °C, and core lengths of 25–60 mm (1-inch diameter), enabling real-time monitoring of fluid distribution during displacement.

Figure 1. Nuclear magnetic resonance analysis system for multiphase flow displacement.
2.2 Principle
NMR measures nuclear magnetic resonance of magnetic nuclei in external magnetic fields, providing rapid, non-destructive analysis of porous media properties (e.g., porosity, permeability, water saturation). In CO2 sequestration research, it is used to track the migration of wetting-phase fluids and characterize reservoir properties.
2.3 Experimental materials
Artificial sandstone cores (supplied by Yilai Bo Technology Co., Ltd.) with porosities (5%, 10%, 15%) were used, and their porosity accuracy was pre-tested (Table 1).

Table 1. Information of artificial cores.
2.4 Experimental design
A three-factor, three-level orthogonal design (L9 (33)) was adopted, with variables including porosity (5%–15%), confining pressure (8–10 MPa), and pressure difference (0.3–0.9 MPa), while temperature was maintained constant at 33 °C. Details of the nine experimental groups are provided in Table 2.
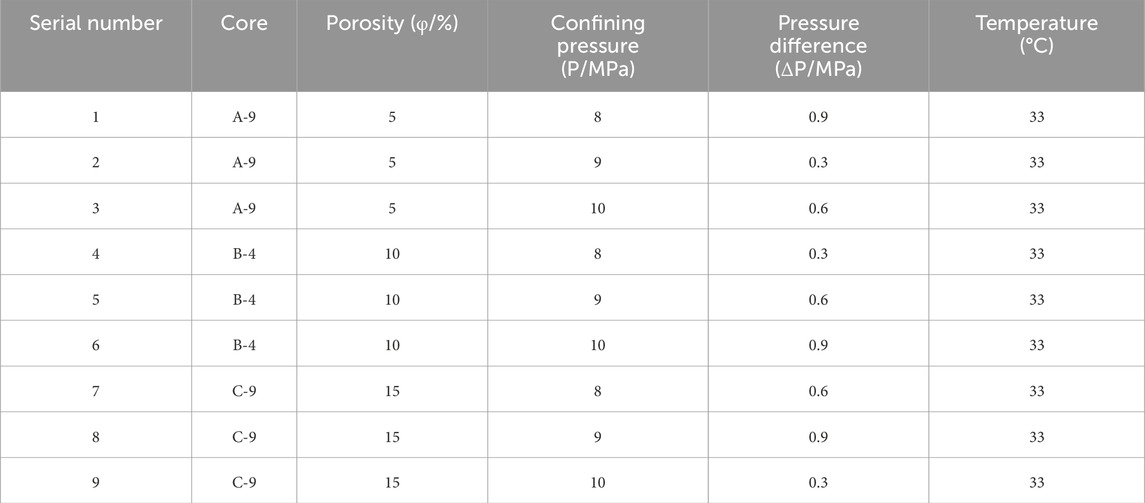
Table 2. Experimental Condition Design Table for Core Displacement with Different Porosities, confining pressures and Pressure Differences.
2.5 Procedures
2.5.1 Core saturation
Cores were fully saturated with water using a vacuum-pressure saturation device (Figure 2) to ensure uniform wetting. This device is primarily composed of a vacuum system, a liquid storage tank, a sample saturation chamber, a manual pump, a pressure gauge, and valves. When the liquid level in the storage tank ceases to drop, the valve is closed, and the hand pump is used to pressurize to 25 MPa, with this pressure maintained for 24 h. At this stage, the core is considered to be fully water-saturated.
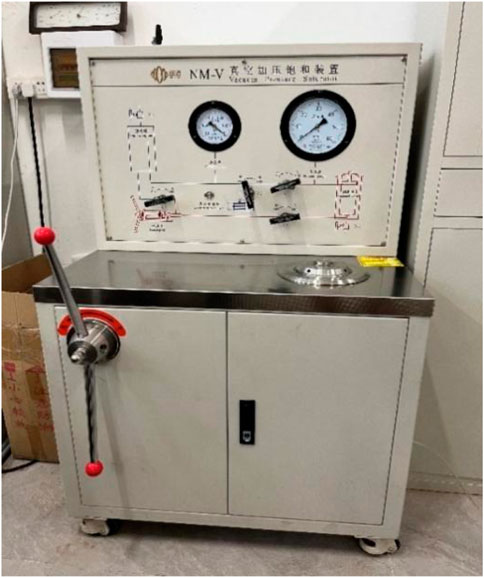
Figure 2. Vacuum pressure saturation device.
2.5.2 Displacement experiments
The core sample to be tested, which was fully saturated with water, was prepared prior to conducting the NMR core displacement experiment, following these steps.
1. System self-inspection: The NMR measurement system was powered on according to specifications, a calibration sample was placed into the core holder, and a system self-inspection was performed.
2. Sample preparation and loading: The core sample to be tested was retrieved, a heat-shrinkable tube was applied, and a heat gun was used to shrink the tube tightly around the core. The prepared core sample was loaded into the core holder.
3. Pipeline connection: The core holder was positioned within the NMR coil, and pipelines for the confining pressure unit, gas injection unit, back pressure unit, and low-temperature circulation unit (which maintains the NMR system temperature at 25 °C to eliminate temperature-induced interference with NMR signals) were connected.
4. Pressurization: After purging the confining pressure fluid (fluorinated fluid FC770), the fluid was heated to the required experimental temperature using the heating unit. The industrial control computer was used to synchronously apply confining pressure and back pressure in the following sequence: 3-5-7–9-12 MPa for confining pressure and 1-3-5–7-8 MPa for back pressure. Meanwhile, CO2 from the gas cylinder was injected into the intermediate container and pressurized to the required experimental pressure via a constant-rate, constant-pressure pump.
5. Initial signal acquisition: T2 curves and images of the sample in its initial saturated state were collected using the Carr-Purcell-Meiboom-Gill (CPMG) sequences. Additionally, the industrial control computer was used to set the sampling sequence and time intervals for the dynamic displacement process.
6. Water injection: Since high temperatures from the heat gun during sample preparation might lead to partial water loss in the core, the core was re-saturated with water at the experimentally designed back pressure for 12 h prior to the displacement experiment. This ensured 100% water saturation in the core before gas injection.
7. CO2 injection: Once water saturation was complete, CO2 gas (pressurized to the required experimental level) was injected into the core holder—with the confining pressure maintained 3–5 MPa higher than the inlet pressure throughout the experiment—to initiate the displacement process.
8. Data collection: Relevant NMR signals were acquired at predefined time points during displacement using the set sampling sequence, and the dynamic displacement process was monitored in real time.
9. Residual weight measurement: Throughout the displacement process, CPMG sequence tests were performed at regular intervals to obtain a series of core T2 curves, one-dimensional water distribution maps, and MRI images after varying displacement durations. As displacement progressed, reduced water content gradually weakened the hydrogen proton signal intensity. When the signal intensity approached the background level, MRI images were simultaneously observed: if fluid distribution boundaries became indistinct (i.e., imaging quality was impaired), it indicated that pore water had been displaced to irreducible saturation. Alternatively, the experiment could be terminated when changes in the core’s T2 curve were negligible and the curves nearly overlapped. The core sample was removed, and its residual weight was measured. All other experimental groups followed the same procedure.
2.5.3 NMR parameters
The CPMG sequence parameters were: waiting time (TW) = 5,000 ms, echo time (TE) = 0.2 ms, 16 accumulations, with an acquisition time of 3 min (Table 3).

Table 3. Nuclear magnetic resonance (NMR) sequence parameters table.
3 Results and discussion
3.1 NMR T2 spectra analysis
T2 curves (Figures 3–5) show bimodal distributions for cores A-9 and B-4, with rapid water loss in macropores/mesopores and slow loss in micropores/nanopores. Core C-9 exhibits rapid initial displacement, with most water removed within 10 min.
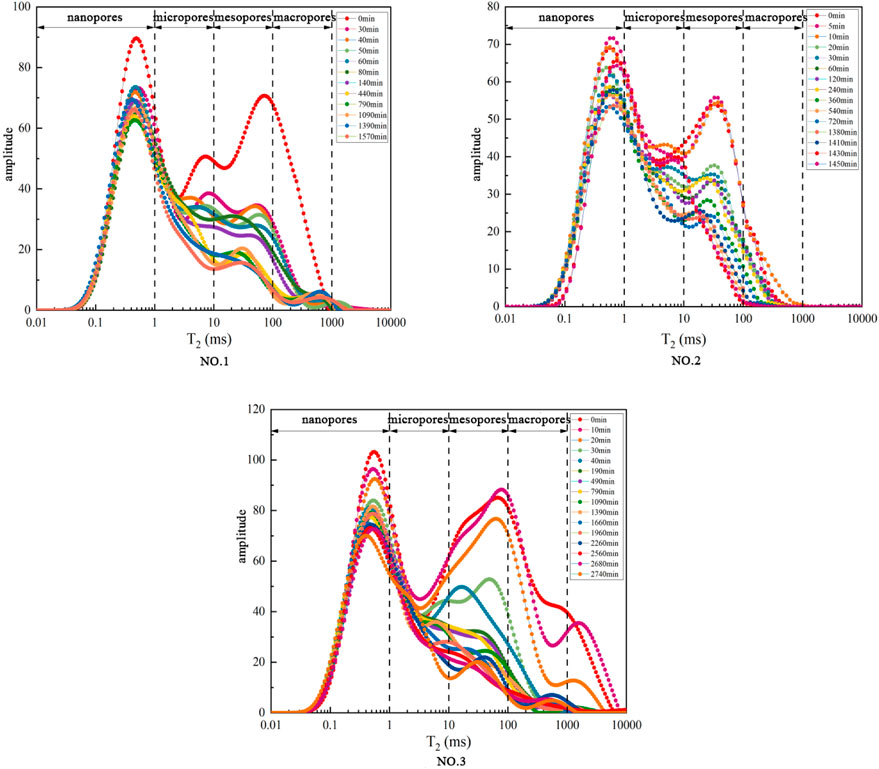
Figure 3. The transverse relaxation time (T2) curve of core displacement experiment for A-9.
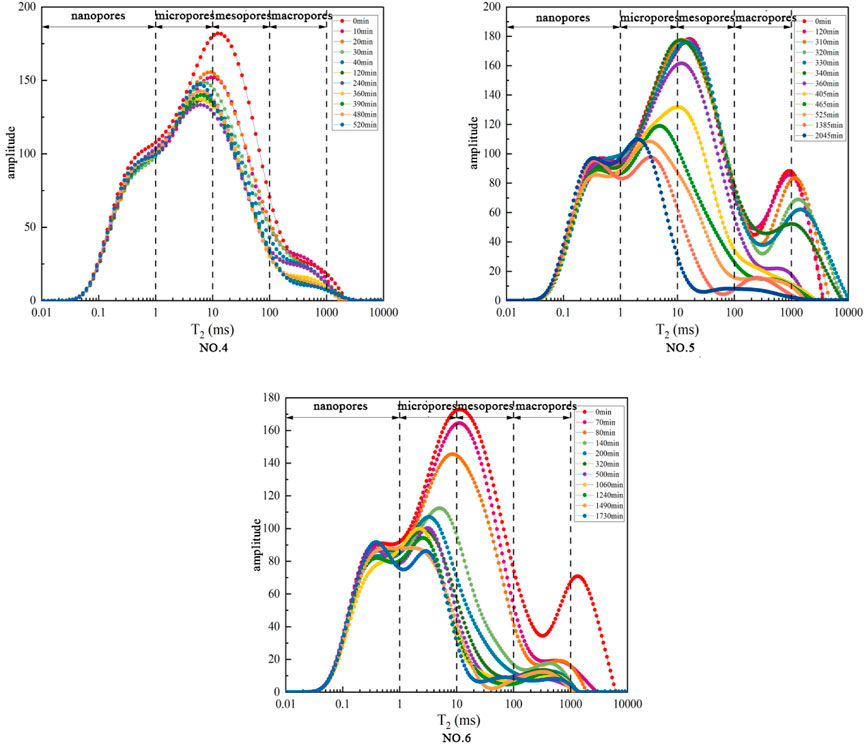
Figure 4. The transverse relaxation time (T2) curve of core displacement experiment for B-4.
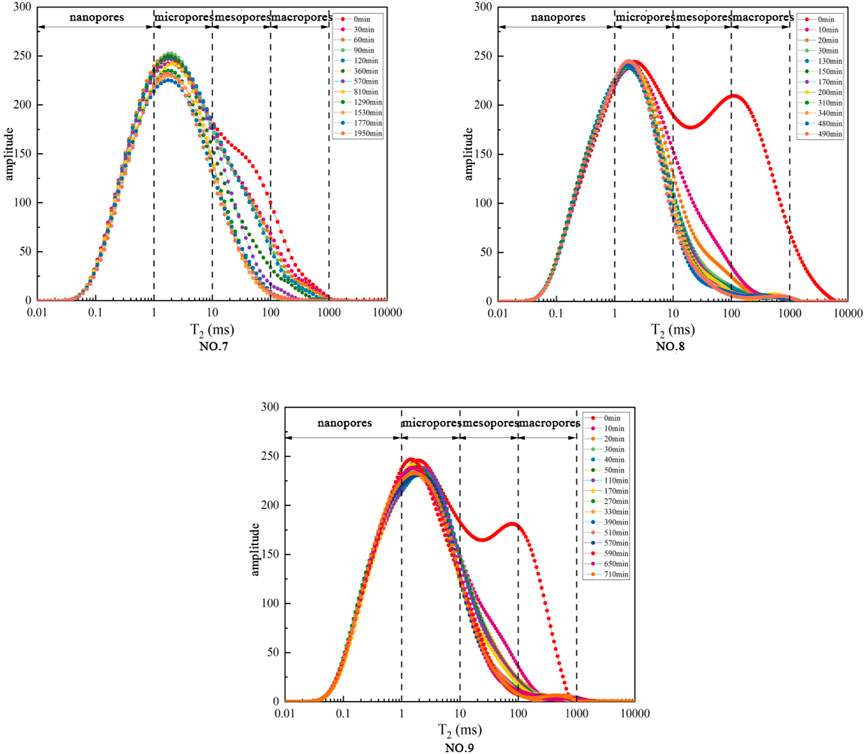
Figure 5. The transverse relaxation time (T2) curve of core displacement experiment for C-9.
Using the Laplace equation:
(Where Pc is capillary entry pressure, γ is interfacial tension, θ is contact angle, and R is pore radius), smaller pores (nanopores/micropores) require higher Pc, explaining why residual water concentrates in these regions.
To conduct an in-depth analysis of displacement processes across different pore size groups, the final CO2 displacement efficiency for each pore size group in each experimental set was calculated using the initial T2 curve from the displacement experiment and the T2 curve at the final state upon displacement completion. The formula for calculating CO2 displacement efficiency is as follows.
Where: R is the CO2 displacement efficiency; is the total nuclear magnetic signal within the range of nanopores, micropores, mesopores, or macropores in the initial T2 curve; is the total nuclear magnetic signal within the range of nanopores, micropores, mesopores, or macropores in the T2 curve at the final state after displacement.
Water can only migrate into nanopores if the pressure is sufficient to overcome the capillary entry pressure, which is typically high due to the small pore radii. CO2 displacement efficiency (Figure 6) shows that mesopores and macropores have displacement efficiencies of >60% and >80%, respectively, while nanopores and micropores have <50%. Negative efficiency in some nanopore calculations (Groups 5, 8, 9) reflects water influx from larger pores. The distribution of residual CO2 (Figure 7) shows that mesopores hold ≥40% of residual CO2, due to their higher proportion in the pore structure and the limited space in nanopores/micropores occupied by residual water.
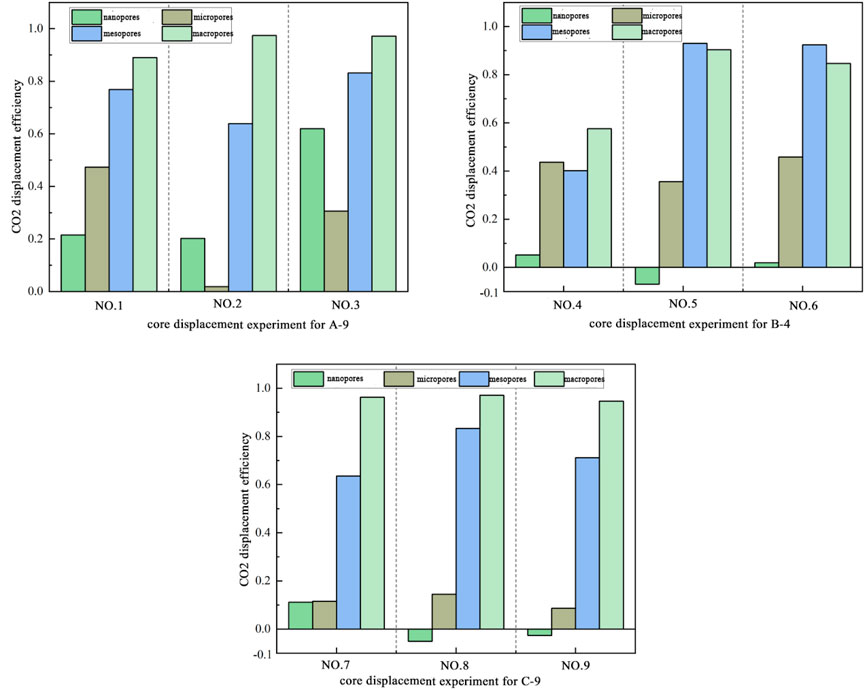
Figure 6. CO2 displacement efficiency diagram of core displacement experiment.
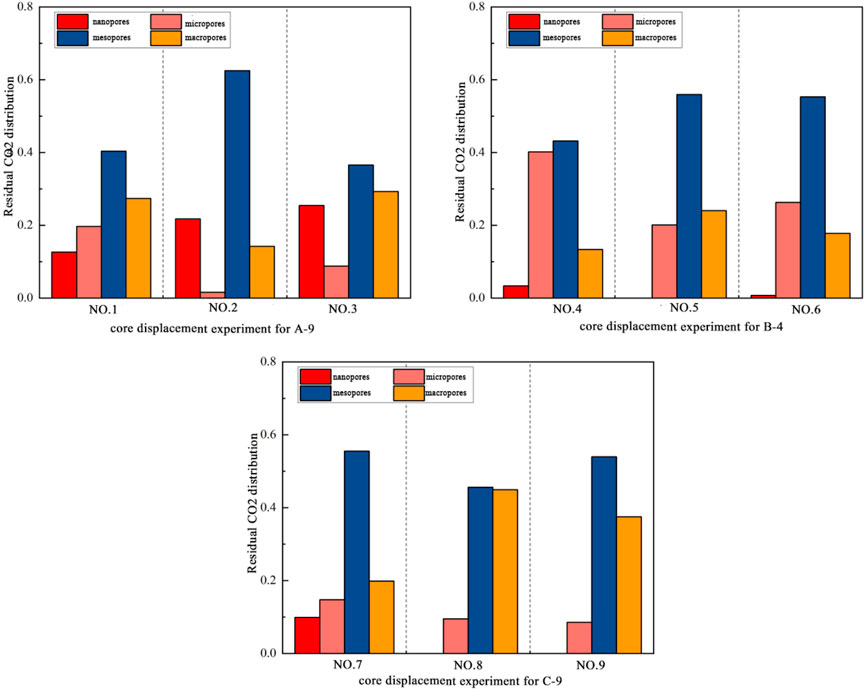
Figure 7. Residual CO2 proportion diagram of core displacement experiment.
3.2 Displacement experiment results
Maximum residual CO2 saturation (SR) and residual water saturation (SW) were calculated using:
where m0, m1, m2 are dry, saturated, and residual core weights, respectively. Results for nine groups are listed in Table 4.
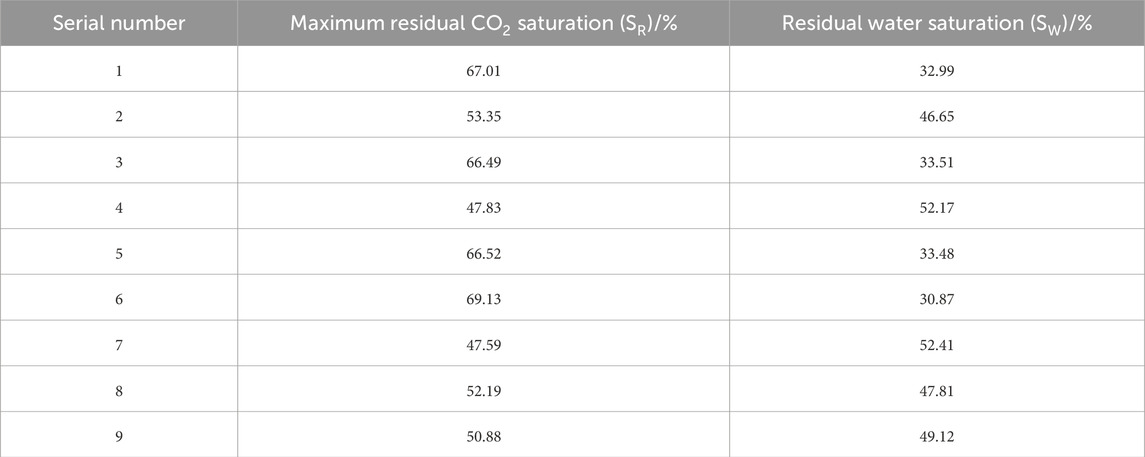
Table 4. Maximum residual CO2 saturation (SR) and residual water saturation (SW) in displacement experiments of artificial cores.
3.3 Data analysis
Assuming no interference from other factors and the generalizability of laboratory results, SPSS was employed to construct a regression model. The model (Table 5) showed an R 2 = 0.80, indicating that 80% of the variation in SR is explained by the three factors. The Durbin-Watson statistic (1.877) confirmed the independence of the data. ANOVA (Table 6) indicated a significant model fit (F = 6.674, p < 0.05).

Table 5. Durbin-watson test.
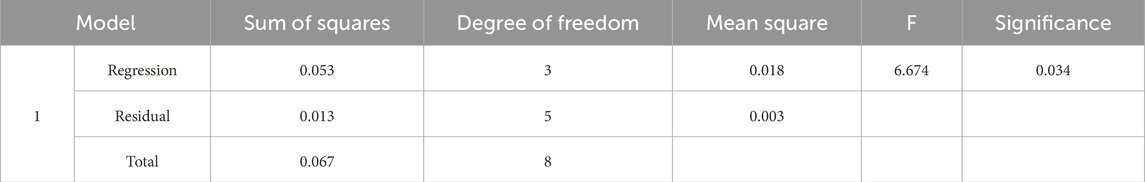
Table 6. Analysis of variance (ANOVA) for the model.
Regression coefficients (Table 7) indicated.
• Porosity (x1) had a negative impact on SR (β = −1.206, p < 0.05): a 10-percentage-point increase in porosity reduced SR by 12.06%. This is consistent with the results of the NMR displacement experiments, primarily due to the influence of capillary forces.
• Pressure difference (x3) had a positive impact on SR (β = 0.202, p < 0.05): a 1 MPa increase raised SR by 20.2%. This is mainly because the pressure difference facilitates the formation of “preferential pathways.”
• Confining pressure (x2) exhibited no significant effect (p = 0.115).
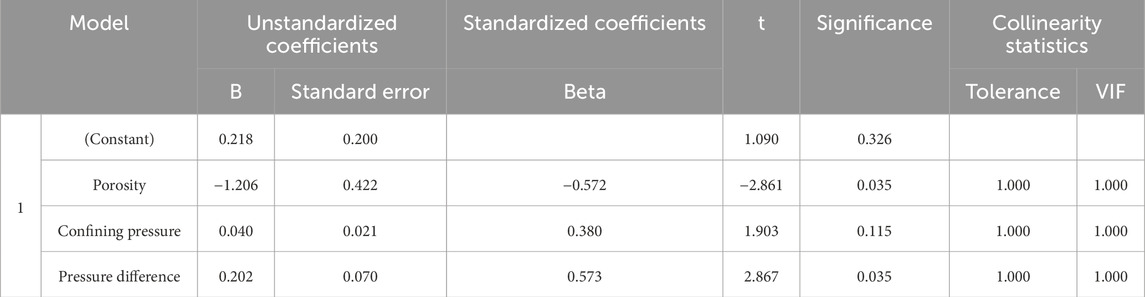
Table 7. Coefficients of the multiple linear regression equation.
Porosity had the strongest influence (largest absolute coefficient). The regression equation is:
Residual analysis (Figure 8) confirmed a normal distribution, validating the model assumptions.
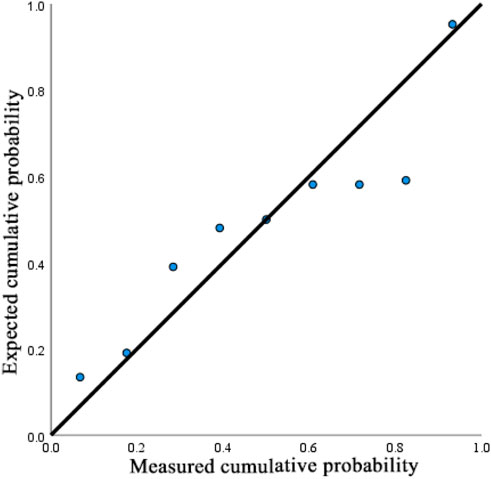
Figure 8. Standard P-P plot of standardized residuals.
The maximum residual CO2 saturation measured in the experiment corresponds to the displacement efficiency of the core under the relevant operating conditions. To derive the CO2 storage coefficient for actual engineering sites, an additional key parameter—the volume coefficient—is required alongside the displacement coefficient. The CO2 storage coefficient of saline aquifers can be calculated using the following formula:
In this formula, E denotes the geological CO2 storage coefficient; SR represents the maximum residual CO2 saturation; and EV stands for the volume coefficient.
The volume coefficient is associated with the area and formation thickness, while the heterogeneity of the formation complicates its calculation. In practical engineering, the volume coefficient is typically derived via three-dimensional geological modeling and numerical simulation methods. By integrating the maximum residual CO2 saturation equation developed in this study, the geological CO2 storage coefficient for actual engineering sites can be calculated, thereby supporting the evaluation of CO2 geological storage potential in saline aquifers.
4 Conclusion
To investigate the factors influencing the effective storage coefficient for CO2 sequestration in saline aquifers and accurately assess their storage potential, nine sets of multiphase flow core displacement experiments based on orthogonal design were conducted, with porosity, confining pressure, and pressure difference as variables. The experimental materials used were artificial cores with significantly different porosities. The key findings are as follows.
1. 80% of the variation in “maximum residual CO2 saturation” is influenced by “porosity,” “confining pressure,” and “pressure difference.” Among these three factors, porosity has the most significant impact on maximum residual CO2 saturation.
2. Qualitative analysis of water migration in cores during displacement via NMR T2 curves revealed that water migration during displacement is closely related to pore structure: water in mesopores and macropores is preferentially displaced, while water in nanopores and micropores is more resistant to displacement.
3. NMR was used to analyze the maximum residual CO2 saturation of artificial cores under different conditions, and a multiple linear regression equation relating maximum residual CO2 saturation to “porosity,” “confining pressure,” and “pressure difference” was established. By incorporating the volume coefficient derived from numerical simulations, the geological CO2 storage coefficient for actual engineering sites can be estimated. This serves as a reference for subsequent calculations of geological CO2 storage potential in saline aquifers.
Data availability statement
The original contributions presented in the study are included in the article/supplementary material, further inquiries can be directed to the corresponding authors.
Author contributions
CZ: Writing – review and editing. WZ: Writing – original draft. TJ: Writing – original draft. JbZ: Writing – original draft. JaZ: Writing – original draft. MW: Writing – original draft. JnZ: Writing – original draft. LF: Writing – original draft.
Funding
The author(s) declare that financial support was received for the research and/or publication of this article. Supported by the Natural Science Foundation of China (No. 42141009), the Science and Technology Projects of China Huaneng Group Co., Ltd. (No. HNKJ24-H25 and No. HNKJ24-H13 and No. HNKJ25-H49 and HNKJ22-H155 and HNKJ22-H10), Science and Technology Projects of China Energy Investment Corporation (No.GJNY-22-24), the project of China Geological Survey (No. DD20221818), and the Center for Hydrogeology and Environmental Geology Survey. The funders were not involved in the study design, collection, analysis, interpretation of data, the writing of this article, or the decision to submit it for publication.
Conflict of interest
Author JbZ was employed by Shanxi Institute of Geological Survey CO., LTD.
Author MW was employed by National Energy Group Inner Mongolia Shanghai Temple Power Generation Co., Ltd.
The remaining authors declare that the research was conducted in the absence of any commercial or financial relationships that could be construed as a potential conflict of interest.
Correction note
A correction has been made to this article. Details can be found at: 10.3389/feart.2025.1727687.
Generative AI statement
The author(s) declare that no Generative AI was used in the creation of this manuscript.
Any alternative text (alt text) provided alongside figures in this article has been generated by Frontiers with the support of artificial intelligence and reasonable efforts have been made to ensure accuracy, including review by the authors wherever possible. If you identify any issues, please contact us.
Publisher’s note
All claims expressed in this article are solely those of the authors and do not necessarily represent those of their affiliated organizations, or those of the publisher, the editors and the reviewers. Any product that may be evaluated in this article, or claim that may be made by its manufacturer, is not guaranteed or endorsed by the publisher.
References
Bert, M., Davidson, O., De Coninck, H. C., Manuela, L., and Meyer, L. (2005). IPCC special report on carbon dioxide capture and storage. Cambridge: Cambridge University Press.
Dai, S., Dong, Y., Wang, F., Xing, Z., Pan, Hu, and Yang, Fu (2022). A sensitivity analysis of factors affecting in geologic CO2 storage in the ordos basin and its contribution to carbon neutrality. China Geol. 5, 1–13. doi:10.31035/cg2022019
Diao, Y., Zhu, G., Jin, X., Zhang, C., and Xufeng, Li (2017). Evaluation of theoretical CO2 geological utilization and storage potential in the Sichuan Basin. Geol. Bull. China 36 (6), 1088–1095 (In Chinese with English abstract).
Diao, Y., Liu, T., Ning, W., Ma, X., Jin, X., and Fu, L. (2023). Classification and assessment methodology of carbon dioxide geological storage in deep saline aquifers. Geol. China 50 (3), 943–951 (In Chinese with English abstract).
Dongjiang, L., Zengmin, L., Lv, C., Wang, H., Qingmin, Z., and Han, S. (2021). Nuclear magnetic resonance experimental study of CO2 injection to enhance shale oil recovery. Petroleum Explor. Dev. 48, 603–612 (In Chinese with English abstract).
Fu, L., Xin, Ma, Diao, Y., Zheng, B., Zheng, C., Liu, T., et al. (2022). Economic analysis of carbon storage in CO2 plume geothermal system. Geol. China 49 (5), 1374–1384 (In Chinese with English abstract).
Goodman, A., Hakala, A., Bromhal, G., Deel, D., Rodosta, T., Frailey, S., et al. (2011). U.S.DOE methodology for the development of geologic storage potential for carbon dioxide at the national and regional scale. Int. J. Greenh. Gas Control 5, 952–965. doi:10.1016/j.ijggc.2011.03.010
Guo, J., Wen, D., Zhang, S., Jia, X., and Fan, J. (2014). Atlas of CO2 geological storage potential and suitability evaluation for major sedimentary basins in China [M]. Beijing: Geological Publishing House.
Jing, H. (2021). Evaluation report on carbon capture, utilization and storage technology in China [M]. Beijing: Science Press.
Lei, Fu, Diao, Y., Zheng, C., Ma, X., Zhang, C., Liu, T., et al. (2022). Caprock self-sealing effect due to CO2 leakage from geologic carbon sequestration reservoirs: a case study at Ping’an, China. Front. Energy Res. 10, 1–11. doi:10.3389/fenrg.2022.955465
Song, L., Yilian, L., Ying, Y., and Wu, Y. (2015). Study on the effective coefficient of carbon dioxide geological sequestration in saline Aquifers—A case Study of the Jianghan Basin. Saf. Environ. Eng. 22 (1), 1671–1556 (In Chinese with English abstract).
USDOE (2006). Carbon Sequestration Atlas of the United States and Canada: Appendix A - Methodology for development of carbon sequestration capacity estimates.
Wei, N., Li, X., Wang, Y., Dahowski, R. T., Davidson, C. L., and Bromhal, G. S. (2013). A preliminary sub-basin scale evaluation framework of site suitability for onshore aquifer-based CO2 storage in China. Int. J. Greenh. Gas Control 12, 231–246. doi:10.1016/j.ijggc.2012.10.012
Wei, N., Jiao, Z. S., Ellett, K., Ku, A. Y., Liu, S. N., Middleton, R., et al. (2021). Decarbonizing the coal-fired power sector in China via carbon capture, geological utilization, and storage technology. Environ. Sci. and Technol. 55, 13164–13173. doi:10.1021/acs.est.1c01144
Wei, N., Li, X. C., Jiao, Z. S., Stauffer, P. H., Liu, S. N., Ellett, K., et al. (2022). A hierarchical framework for CO2 storage capacity in deep saline aquifer formations. Front. Earth Sci. 9, 777323–121. doi:10.3389/feart.2021.777323
Xiaochun, Li, Liu, Y., Bai, B., and Fang, Z. (2006). Selection of priority areas for CO2 storage in deep saline aquifers in China. Chin. J. Rock Mech. Eng. 25 (5), 963–968 (In Chinese with English abstract).
Yang, H., Xisen, Z., Kang, Y., Chen, L., Huang, C., and Wang, H. (2019). Suitability and potential evaluation of CO2 geological sequestration in the ordos Basin. Progressus Inquisitiones de Mutat. Clim. Adv. Clim. Change Res. 15 (1), 95–102 (In Chinese with English abstract).
Zhang, H., Wen, D., Yilian, Li, Zhang, J., and Lu, J. (2005). Analysis of CO2 geological storage conditions and relevant suggestions in China. Geol. Bull. China 24 (12), 1107–1110 (In Chinese with English abstract).
Keywords: CO2 geological storage, carbon sequestration coefficient, residual CO2 saturation, multiphase flow displacement, nuclear magnetic resonance
Citation: Zhang C, Zhao W, Jing T, Zhao J, Zhang J, Wei M, Zhou J and Fu L (2025) Influencing factors of the carbon sequestration coefficient in saline aquifers based on multiphase flow displacement experiments. Front. Earth Sci. 13:1639432. doi: 10.3389/feart.2025.1639432
Received: 03 June 2025; Accepted: 26 August 2025;
Published: 22 September 2025; Corrected: 03 December 2025.
Edited by:
Ramanathan Alagappan, Independent Researcher, Tiruchirapalli, IndiaReviewed by:
Viswakanth Kandala, Indian Institute of Technology Madras, IndiaZehao Xie, Southwest Petroleum University, China
Cai Li, Chinese Academy of Geological Sciences, China
Copyright © 2025 Zhang, Zhao, Jing, Zhao, Zhang, Wei, Zhou and Fu. This is an open-access article distributed under the terms of the Creative Commons Attribution License (CC BY). The use, distribution or reproduction in other forums is permitted, provided the original author(s) and the copyright owner(s) are credited and that the original publication in this journal is cited, in accordance with accepted academic practice. No use, distribution or reproduction is permitted which does not comply with these terms.
*Correspondence: Chenglong Zhang, emhhbmdjaGVuZ2xvbmdAbWFpbC5jZ3MuZ292LmNu; Lei Fu, ZnVsZWlAbWFpbC5jZ3MuZ292LmNu
† These authors have contributed equally to this work