 Yao Hu1*
 Mengqi Yang
- 1College of Civil Aviation Safety Engineering, Civil Aviation Flight University of China, Guanghan, Sichuan, China
- 2College of Economics and Management, Civil Aviation Flight University of China, Guanghan, Sichuan, China
- 3Logistics service company, Civil Aviation Flight University of China, Guanghan, Sichuan, China
- 4Business School, China University of Political Science and Law, Beijing, China
Introduction: Risk coupling (RC) analysis of underground gas storage (UGS) leakage accident risks is critical to overall natural gas storage safety. Consequently, the interactions among diverse risk factors need attention.
Methods: This study proposes a novel methodology combining Dynamic Bayesian Networks (DBNs) and the N-K model to analyze RC in UGS leakage accidents. First, the causes of leakage accidents are systematically investigated, and risk categories are identified. Second, the categories of coupled risk arising from equipment, human, geological, and management factors are identified. Third, a DBN model is constructed based on leakage risk analysis and the N-K model. Fourth, the setting variables for RC nodes in the proposed DBN are identified through computational results using the N-K. Additionally, the validation of the proposed model is proven utilizing a three-axiom-based technique.
Results: By integrating the N-K model’s mutual information metric with DBN’s temporal modeling, the approach achieves a mean absolute error (MAE) of 0.032 in predicting coupling probabilities and enables risk reduction of up to 17.4% through targeted interventions, enhancing the accuracy and actionable insights for UGS safety management. In the short term, the coupling of human factors and management factors is the main factor leading to the leakage accidents occurrence, and with the development of time, the coupling of equipment factors, human factors, geological factors, and management factors coupling is the main factor leading to the leakage accidents occurrence.
Discussion: The developed DBN effectively characterizes the dynamic evolution of leakage risks and RC mechanisms in UGS facilities. Furthermore, sensitivity analysis is implemented using the proposed model to investigate the impact of failure probabilities of risk factors on predominant RC types in the short term, we can reduce the human factors and management factors coupling by strengthening personnel training and optimizing the management process and other measures; in the long term, we can reduce the risk of coupling by constructing the whole life cycle management of the equipment, geological dynamic monitoring, and other measures.
1 Introduction
The secure functioning of underground gas storage (UGS) is crucial for protecting the national economy, livelihoods, and stability, especially with the rapid building of UGS (Sarvestani et al., 2021; Liu et al., 2023). “Gas collection in winter and spring, gas injection in summer and fall” is the operational procedure of UGS, which is based on an annual cycle (Zhong et al., 2024). The combustible and explosive natural gas is stored in vast quantities in UGS facilities (Li et al., 2024a; Ran et al., 2024). Injecting and storing natural gas requires a lot of operators and equipment, which increases the risk of accidents in UGS facilities (Sarvestani et al., 2021). At the same time, the geological environment of underground storage is complex and variable, and the natural gas storage process is affected by faults, cracks, and other geological features (Ma et al., 2018). In addition, UGS is generally constructed close to downstream natural gas user cities, with dense populations and numerous facilities in the vicinity, which can cause serious social security problems in the event of an accident or disaster (Ma, 2021). From the establishment and development history of UGS, accidents and disasters have occurred from 1915 to the present, and among the many accidents and disasters, leakage accidents are the most frequent. Figure 1 illustrates the timeline of notable UGS accidents and disasters (Evans, 2009; Conley et al., 2016; Feng et al., 2021; Yan et al., 2024; Yang et al., 2024).
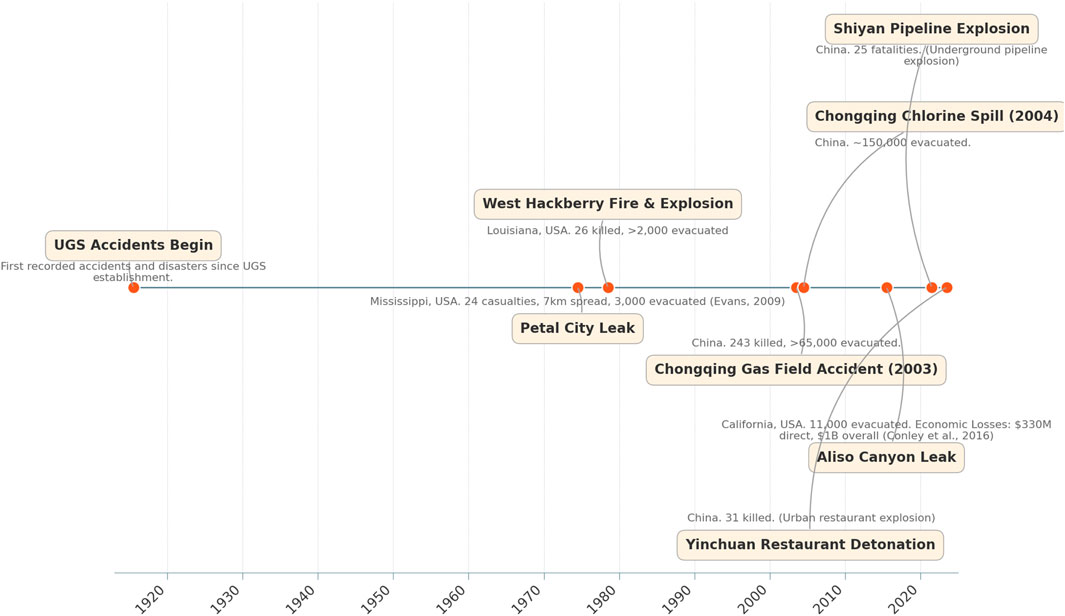
Figure 1. The timeline of notable accidents and disasters.
UGS is a complex socio-technical system involving the interplay of equipment, human, geological, and management factors. Leakage accidents, often resulting from multi-factor risk coupling (RC), pose significant safety and environmental challenges. The formation of UGS leakage accidents is the joint action of a variety of risk factors, an RC effect, and the impact of its nonlinear coupling (Shen et al., 2022). Analyzing these risks requires integrating quantitative accident data, such as historical incident frequencies, with qualitative inputs like expert judgments to refine failure rates and validate risk interactions (OREDA, 2002; Zhao et al., 2019). This mixed-methods approach captures the dynamic and interdependent nature of UGS operations, enabling robust risk assessment and mitigation strategies.
UGS system is a complicated socio-technical system with dynamic and fuzzy features, referring to the operating ability of operators, the operational status of equipment and facilities, the geological and hydrological environment, and the influence of national policy documents. The formation of UGS leakage accidents is the joint action of a variety of risk factors, an RC effect, and the impact of its nonlinear coupling (Shen et al., 2022). At the same time, these related risk factors ultimately lead to the complexity of risk analysis of UGS leakage accidents, which increases the difficulty of accident prevention (Durcansky and Cernan, 2019; Lackey et al., 2024). In this case, it is needed to analyze the leakage accidents of UGS from the perspective of RC, to provide a certain guiding value for the prevention of leakage accidents.
Nowadays, renewable energy has been receiving increasing attention from scholars due to its potential to mitigate environmental pollution (Kai et al., 2024; Bui-Duy et al., 2023). In the process of developing these sources, safety in UGS remains a critical issue. A lack of caution may pose serious threats to human life and lead to disruptions or breakdowns in the supply chain (Minh et al., 2024; Le and Xuan-Thi-Thu, 2024). Many scholars have examined the impacts on the safety of UGS in a single risk factor. Zhao et al. (2019) developed a model to forecast and analyze the likelihood of wellbore integrity failure and its possible effects using the bowtie (BT) approach and hierarchical Bayesian analysis (HBA). To aid in the planning process for risk management related to well leakage, Lackey et al. (2024) examined UGS leakage accidents that occurred in the US, specifically examining the operation of the leaks, the reasons for the leaks, and the policies in place to manage them. More accurate risk prediction and prevention are possible with this method. To address the uncertainty in the calculation of leakage risk, Xu et al. (2023) showed a Bayesian network (BN)-based dynamic risk evaluation method for UGS. This method builds a fault tree by identifying the risk factors of UGS and mapping them into the network. Discussing simulation studies of the behavior of various gases when stored underground, Al-Shafi et al. (2023) offered an overview of UGS systems, including natural gas, hydrogen, and carbon capture and storage. Their goal was to provide future directions for better managing the safety of these systems. By integrating thermal-hydraulic performance modeling of UGS facilities with Monte Carlo simulation of possible outage events, Syed and Lawryshyn (2020) created a quantitative risk analysis model for UGS that evaluates the operational reliability risk. To shed light on how to keep UGS safe and operational, Li et al. (2024b) studied the causes of piston rod fracture failure in real-world engineering scenarios, developed a finite element model and a three-dimensional computational fluid dynamics model, and investigated the dependable functioning of process gas compressors. The risk management and decision system for early leakage in UGS was proposed by Zhang Z. et al. (2022). This system makes use of “coupled simulation” and “fiber-optic monitoring” approaches to offer real-time leakage risk warnings and monitoring, making sure that UGS is safe and reliable. As a quantitative tool for risk early warning of injection-production columns in UGS, the semi-empirical model put forth by Zhang et al. (2021b) evaluates the remaining useful life of these columns to determine the likelihood of their degradation failure during process safety operations. In their study, Yang et al. (2020) used the Fluent numerical simulation and the Gaussian plume model to examine the effects of continuous and transient leaks on the diffusion hazardous region, as well as the effects of accidents involving salt-rock subsurface UGS leaks on the neighbors. To assess the potential for wellbore failure when building UGS in depleted reservoirs. Wang R. et al. (2024) suggested a quantitative uncertainty model. The wellbore stability according to various in situ stressors is considered, and the model’s durability and versatility under unknowable variables are verified through simulation experiments, and the research findings can provide efficient instruction for regulating the rate of wellbore failure in drained gas reservoirs, as well as the planning and building of directional wells. To determine the potential for leakage in the UGS wellbore, Zhang et al. (2021a) used a combination of high-precision geologic modeling, fault dip sampling point data, three-dimensional Mohr-Coulomb and polar coordinate projection maps, and multi-dimensional technical evaluation index models.
Considering the technical-geological environment and operational status of saline cavern UGS, among other risk factors, Chen et al. (2019) summarized three main factors that contribute to leakage: geological factors, engineering factors, and human activities. He also identified four types of leakage. Bi et al. (2020) realized the quantitative analysis for the safety level of UGS by establishing a system of defect indicators, such as volume shrinkage ratio, salt rock cohesion, interlayer content, roof thickness, casing boot height, and pressure difference between adjacent cavities, combined with a weight calculation method based on fuzzy entropy and sets. Moreover, machine learning algorithms have increasingly demonstrated their advantages across various fields (Ta et al., 2025; Bui-Minh et al., 2025; Le, 2025), and have therefore recently been applied for UGS leaks detection (Du et al., 2024). Wang et al. (2022) studied the probabilistic risk of fault slip leakage due to increased pore pressure by considering the geostress, the stress due to reservoir pressure changes, and the stability of the cap and faults, which was evaluated by laboratory rock mechanics tests, geostress measurements, and three-dimensional geomechanical modeling. Michanowicz et al. (2017) implemented a risk analysis of individual wells, wellbores, and wellhead facilities to cope with the Aliso Canyon UGS Leak, identifying possible single-point-of-failure design deficiencies and making recommendations for improvements that can help prioritize and monitor high-risk wells and facilities. Cyran (2021) reviewed the effects of impurities and structure in rock salt on its mechanical properties and concluded that rock salt grain size, shape, and arrangement, as well as the distribution of fluid inclusions and other mineral crystals, affect the mechanical properties of UGS. Wang Z. et al. (2024) used the Triple Mean Normal Stress (TMNS) method integrated in a finite component code to compare the results of Mogi-Coulomb, Mohr-Coulomb, and TMNS to investigate the changes of pore pressures, stresses, and displacements, which offered a theory for the study of the safety of the cap layer. Xue et al. (2023) established a fully coupled two-phase flow model for the influence of the safety performance of the cap seal, analyzing the impact of anisotropy of mechanical and adsorption parameters, and explored the constraint and enhancement effects of the cap in the methane leakage process. Yan et al. (2022) accurately assessed the stability and safety of salt caverns as well as the maximum internal gas pressure limit of salt caverns by adopting a new creep model for the stability and safety of salt caverns in the Pingdingshan area, starting from the risk factors of the shape, size, and stratigraphic conditions of Pingdingshan (PDS), which provides an essential reference for the design of storage reservoirs in the multilayered saline rocks of the intricate PDS area in China. In view of the UGS risk analysis, scholars mainly carry out research on the analysis of influencing factors and the risk assessment of UGS. However, relatively few studies have been conducted to analyze the coupled causes of leakage accident risk, and even fewer have considered the impact of complex conditions on leakage accident risk. In this case, a quantitative analysis based on the interaction between multiple risk factors is necessary.
Significant progress in risk analysis for systems like UGS, urban gas pipelines, coal mining, and integrated energy systems has been achieved through the application of Dynamic Bayesian Networks (DBNs) and the N-K model (also known as K-out-of-N). A coupled risk model was tested in the Nanning underground project, dynamically managing construction risks near underpass tunnels by integrating the N-K model with DBNs, providing robust decision-making support (Jiang et al., 2022). Cost-effective inspection strategies for pipeline maintenance were developed using Monte Carlo simulations, spatio-temporal reliability analysis, and the N-K model, enhancing UGS system safety (Zerouali et al., 2024). An optimal redundancy level balancing economic and resilience goals in energy systems was identified through the application of the N-K model (Zang et al., 2025). For coal mining, a multistate DBN framework with time slices, fuzzy set theory, and expectation-maximization learning improved outburst risk prediction across 51 mining cycles, strengthening prevention measures (Zhang et al., 2024). Badjadi et al. (2023) employed a robust Bayesian Belief Network to thoroughly examine these concerns, adopting an innovative approach to assess the risks associated with hydraulic fracturing operations in shale gas reservoirs. Urban gas pipeline reliability was advanced by a hybrid DBN model that combined real-time data, historical failures, and expert insights to predict failure trends and identify network vulnerabilities for long-term safe operation (Zhou et al., 2025). Despite these advancements, these studies were conducted under certain conditions. Heavy reliance on historical data and expert input risks introducing biases or inaccuracies, particularly in dynamic environments like UGS or mining, when data is incomplete or outdated. The proposed N-K model’s focus on predefined risk combinations may miss emergent or non-linear interactions. Although case studies demonstrate feasibility, the generalizability of these models across diverse operational or geographic contexts remains insufficiently validated, necessitating further exploration.
In this paper, to bridge previous gaps, we apply a combination of the optimized DBN and N-K models in a new perspective to quantify the RC of UGS leakage accidents. The RC mechanism of UGS leakage is revealed from the perspective of the interaction of different risk factors. The proposed method is described in Section 2. Section 3 describes the detailed model-building process, including the definition of the model structure and the specification of the parameters. Section 4 presents the study results and discussion. Section 5 summarizes the key findings, contributions, and indicates the limitations and future research.
2 Materials and methods
2.1 The proposed method
Figure 2 depicts the procedure. The accident risk factor analysis and the N-K model’s structure served as the basis for developing the DBN’s structure. This phase must select dynamic nodes that change over time. The DBN parameters are defined according to the N-K model’s computed findings and the a priori probability. In order to conduct the sensitivity analysis independently, the DBN model must first be built. At last, a triple-axiom-based validation procedure was used to confirm the model’s accuracy.
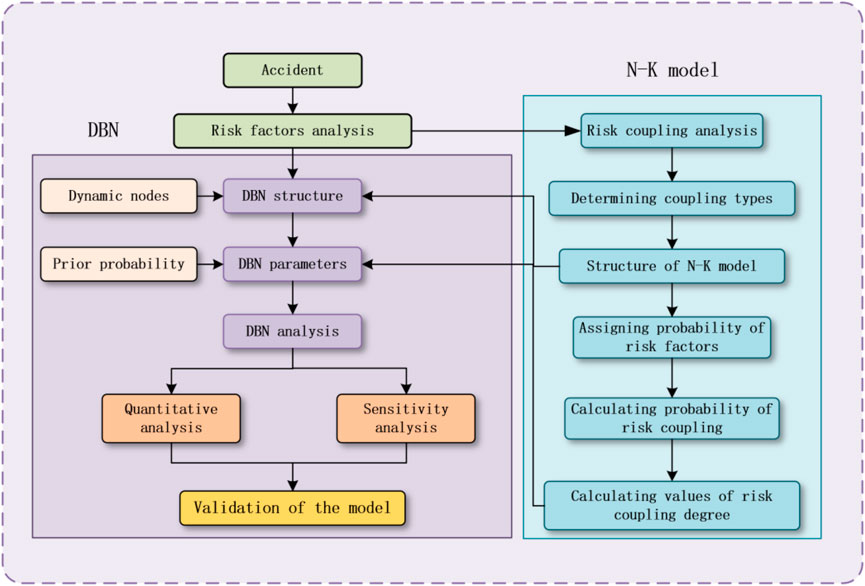
Figure 2. The schematic of the proposed method.
Determining the type of RC is the first step in constructing the N-K model. The likelihood of risk variables will be evaluated by consulting past data, specialized knowledge, and reputable references. Once the likelihood of various RC kinds has been determined, the DBN model incorporates the N-K algorithm’s computed value of the RC degree. Various kinds of risk variables can have their interactions and interrelationships described using the suggested method. There are two advantages: the ability to quantitatively analyze RC effects and cope with uncertainty. The model can also describe how risks evolve and how they are coupled. An advantage of DBN is that it can update time-based hazards, show how variables depend on one another over time, and track how variables change over time. As a result, the approach may show how various RC types vary at each time step. It can trace the development of the accident that set it off and determine the interplay between various risk factors.
2.2 DBN architecture design
In this study, we deploy a method utilizing forward and backward command execution with great flexibility (Adumene et al., 2021). Nevertheless, BN models can not explicitly predict changes in event likelihoods or associations over time (Amin et al., 2018), and they can only do one-step posterior analysis. The ability to merge conditions, events, and interrelationships that may change is what makes a DBN an extension of a BN (Bhardwaj et al., 2021). In order to simulate the ever-changing behavior of random variables, a DBN has a time dependence. Quantitative risk assessment frequently makes use of BNs, which are composed of directed acyclic graphs and their corresponding joint probability distributions (Ahmed, 2008). In the network, nodes
where
A standardized DBN can be identified as
where
Two assumptions are contained in DBN: (1) the assumption of first-order Markov that edges connecting nodes are limited to those on nearest time segments or on the same slice itself; they cannot traverse between different time slices; and (2) temporal uniformity states that the parameters in
where the segment (
2.3 N-K model construction
The N-K model, originally developed by Kauffman (1993) for studying complex systems in evolutionary biology. In complex adaptive systems, dependency and complexity play different but complementary functions. In risk evaluation, the N-K model is used to evaluate the correlation degree and the level of RC between the elements of an insecurity event (Liu et al., 2022). The N-K network consists of two parameters representing the elements number
where
The integration of DBN and N-K models theoretically utilized their complementary capabilities. The N-K model provides a static representation of the UGS system’s structural complexity, identifying critical interdependencies and their impact on system fitness. These interdependencies are then incorporated into the DBN as probabilistic dependencies, enabling the model to capture how changes in one component propagate through the system over time. Specifically, the fitness landscape generated by the N-K model informs the conditional probability distributions in the DBN, ensuring that the temporal dynamics reflect the underlying structural complexity of the UGS system. This integration allows for a holistic analysis that accounts for both the dynamic evolution of system states and the fuzzy, interdependent nature of UGS components. By combining the temporal and probabilistic strengths of DBNs with the structural and combinatorial insights of the N-K model, this study provides a theoretically robust framework for analyzing the UGS system. This approach not only addresses the dynamic and fuzzy characteristics but also enhances the ability to predict system behavior under various scenarios. Figure 3 displays the flowchart of the integration of DBN and N-K algorithm.
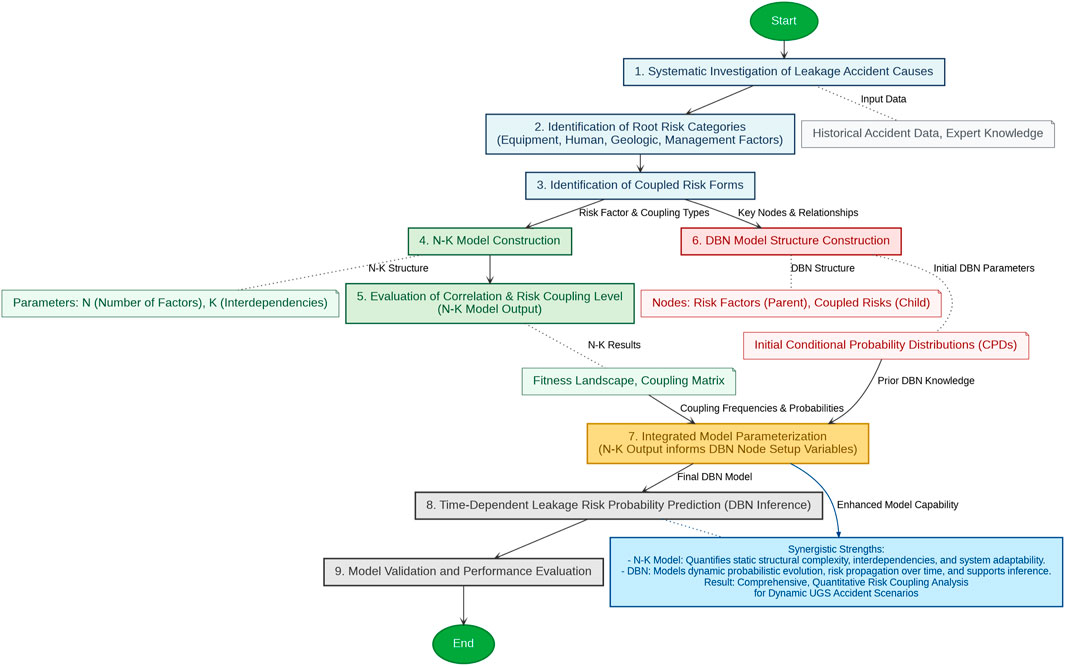
Figure 3. Flowchart illustrating the integration of the NK model and DBN.
The N-K model is adapted to represent the complexity of interactions among risk factors. Here, N represents the number of risk factor categories, identified as four primary types: equipment (a), human (b), geology (c), and management (d). Thus, N equals 4. Each risk factor category includes specific basic factors, and each basic factor is modeled as a binary random variable with states “failure” or “no failure.” The parameter K denotes the number of risk factors involved in a specific coupling interaction, ranging from 1 (single-factor coupling) to N (multi-factor coupling). For UGS leakage accidents, K takes values from 1 to 4, corresponding to single-factor couplings, two-factor couplings, three-factor couplings, and four-factor couplings, as described in Section 3.2.4. The total number of possible coupling combinations is calculated as the sum of binomial coefficients, resulting in 15 distinct permutations. The coupling strength for each combination is computed using mutual information for two-factor couplings and multi-factor couplings. Historical data from 526 UGS leakage accidents, sourced from the United States Geological Survey (USGS) databases and scientific literature, provide the frequency of occurrence for each coupling type, enabling the calculation of joint and marginal probabilities.
The N-K model outputs are then converted to DBN CPTs as follows. The N-K model quantifies the degree of RC through mutual information, which measures the dependency between risk factors. For two-factor couplings, the joint probability
Higher-order couplings (three or four factors) are incorporated into the DBN by defining additional nodes that represent these interactions. Each higher-order coupling node has parent nodes corresponding to the individual risk factors involved. The DBN structure includes these nodes, with directed edges from the risk factor nodes (a, b, c, d) to the coupling nodes Ti. The CPTs for these nodes are populated using the normalized mutual information values from the N-K model. The dynamic nature of the DBN allows these higher-order couplings to evolve over time. The temporal dependencies are modeled using two time slices (
3 Model construction
3.1 UGS systems
The majority of UGS is utilized for balancing natural gas demand and supply volatility, ensuring energy security, and making use of the pipeline network. A UGS system usually consists of surface facilities and subsurface storage, including reservoirs, cap layers, wellbores, and extraction trees. Depleted reservoirs, aquifers, salt caverns, or caves may be depleted reservoirs; the most popular being depleted reservoirs due to good containment and storage for gas. Injection and production of natural gas is performed by wellbores, while surface equipment includes compressors, purification systems, and transmission pipelines. UGS relies on gas’s compressibility as its operating principle. Gas is kept underground and injected into the reservoir when demand is low; when demand is high, customers are supplied with gas from the reservoir. The gas pipeline network’s operating efficiency and energy supply stability are both improved by this peaking function. Also, in times of crisis, subsurface gas storage is crucial, as indicated by Zheng et al. (2017). The UGS structure, including surface and underground storage, is illustrated in Figure 4.
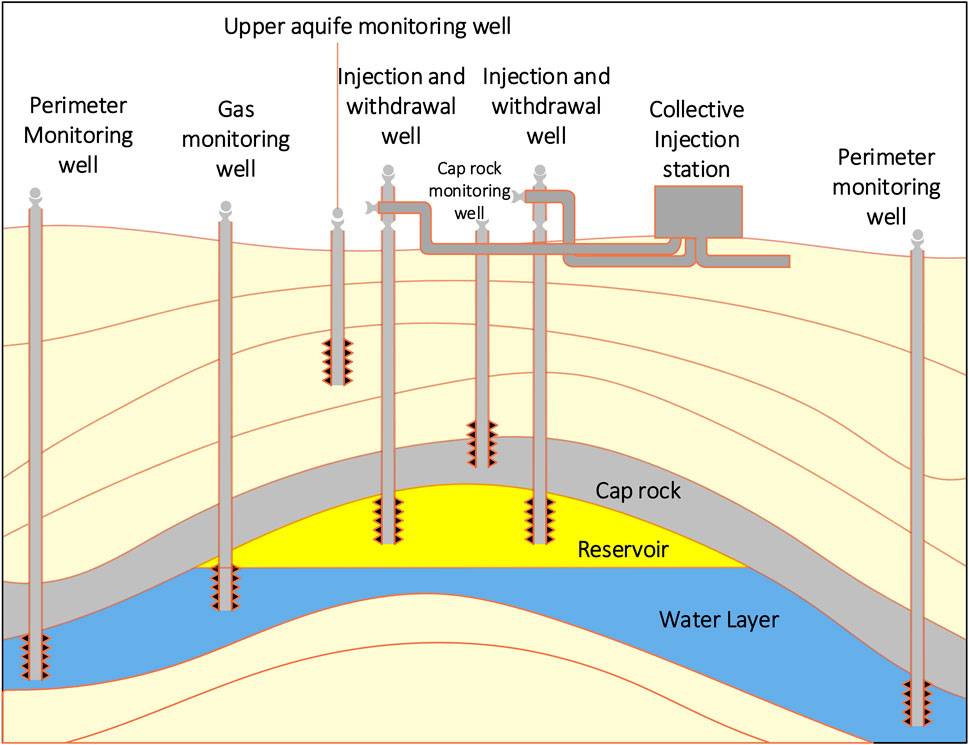
Figure 4. The UGS structure (source: Zheng et al. (2017)).
3.2 Identification of risk factors
3.2.1 Accident case source database and statistics
To ensure the robustness, relevance, and representativeness of the statistical analysis underpinning the N-K model parameters, a meticulous data collection, screening, and processing methodology was applied to the accident cases. The primary source of accident data was the USGS databases, complemented by comprehensive scientific literature and publicly available accident investigation reports (Zhang Y. et al., 2022; Evans, 2008). A total of 526 UGS leakage incidents were ultimately included after a rigorous multi-stage screening process based on the following specific filtering criteria. Data collection focused exclusively on UGS leakage incidents reported between 2000 and 2020. Inclusion was strictly limited to events explicitly classified as “natural gas leakage” or “uncontrolled gas escape” directly originating from or impacting active or former UGS facilities. Expert knowledge was elicited to validate incident clustering and supplement historical data. This criterion systematically excluded incidents not directly related to gas containment integrity or incidents occurring in non-UGS sectors (e.g., general transmission pipelines or processing plants) unless they directly precipitated a UGS-specific leakage. Planned gas venting or flaring activities were also explicitly excluded. Further screening ensured that the documented leakage derived from or directly impacted critical UGS components, including the storage cavern/reservoir, wellbore infrastructure, or surface facilities immediately connected to the storage zone, where their failure directly led to reservoir gas release. This focus refined the dataset to components integral to UGS containment integrity. Preference was provided to cases with adequately documented information regarding the root causes, contributing factors (categorized as equipment, human, geological, and management), reservoir type (depleted field, aquifer, salt cavern), and key consequence details (ignition, environmental impact, economic loss). Incidents with critically ambiguous or severely incomplete information for these core variables were excluded.
To avoid any skew in our findings and clean the data, we perform some procedures to process missing values and outliers. The missing details on what caused an incident or its effects are filled based on expert opinions combined with some straightforward stats (e.g., averaging the loss tweaked for the reservoir type), but only keep cases where less than 10% of the information is missing. For extreme outliers, we use the Interquartile Range (IQR) method to spot them, flagging anything outside
Depleted oil and gas reservoirs accounted for 108 of the 526 UGS leakage events, while aquifers, salt caverns, and caves accounted for 53, 347, and 18 incidents, respectively. Table 1 shows that there are thirteen distinct types of leakage accidents. For underground reservoirs in depleted oil and gas reservoirs, the main causes are drilling/casing/seal plugs and other drilling-related breakages; for aquifer reservoirs, design and construction defects, and capping layer failure are the main causes of leakage accidents; for salt-rock reservoirs, the main causes are drilling/casing/seal plugs and other drilling-related breakages, design and construction defects and cracking/creeping/solvation; and for cavern reservoirs, the causes of leakage accidents are mainly design and construction defects and capping layer failure due to a relatively small number of cavern reservoirs.
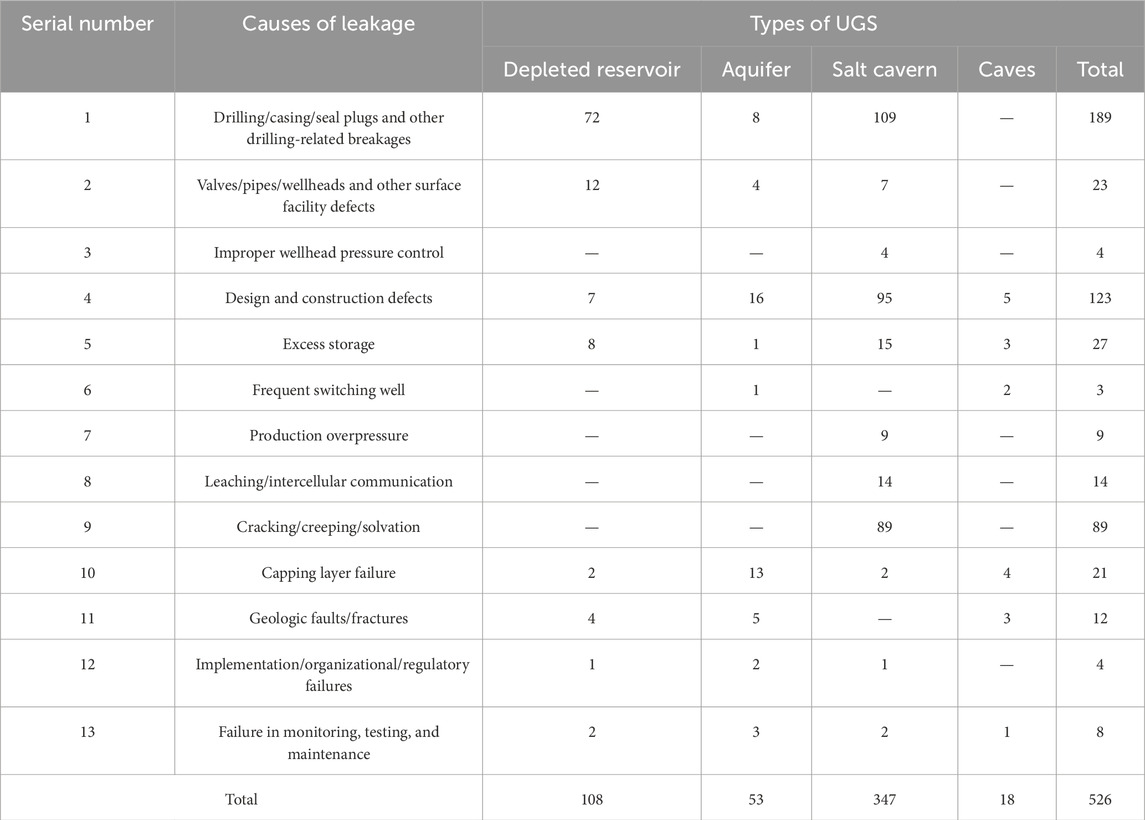
Table 1. Statistics on the causes of leakage accidents.
3.2.2 Identification process
A lot of work has been done by many scholars in the study of risk factor identification. Agarwal et al. (2021) proposed an integrated BT and BN model for evaluating the probability of gas release and identifying the main hazards leading to natural gas leakage accidents. Bai et al. (2016) investigated that the injected gas may cause corrosion of metal tubing and cement in the wellbore, caused by cyclic and thermal loads over the life of the well, on a loss of integrity factor of the UGS equipment. Zhang and Wang (2023) reviewed the problem of risk identification in UGS and focused on metrics development and the use of early warning and detection systems, so as to provide guidance for safe production at UGS.
This paper combines 13 types of leakage accident causes common characteristics, which can be further summarized as equipment factor, human factor, geological factor, and management factor. Equipment factor includes drilling/casing/seal plugs and other drilling-related breakages, valves/pipes/wellheads, and other surface facility defects. Human factors include improper wellhead pressure control, design and construction defects, excessive storage, frequent well switching, and high differential production pressure. Geologic factors include leaching/intercavity connectivity, fracturing/creep/dissolution, cap failure, and geologic faulting/fracturing. Management factors include implementation/organizational/regulatory failures, and failure in monitoring, testing, and maintenance (see Table 2).
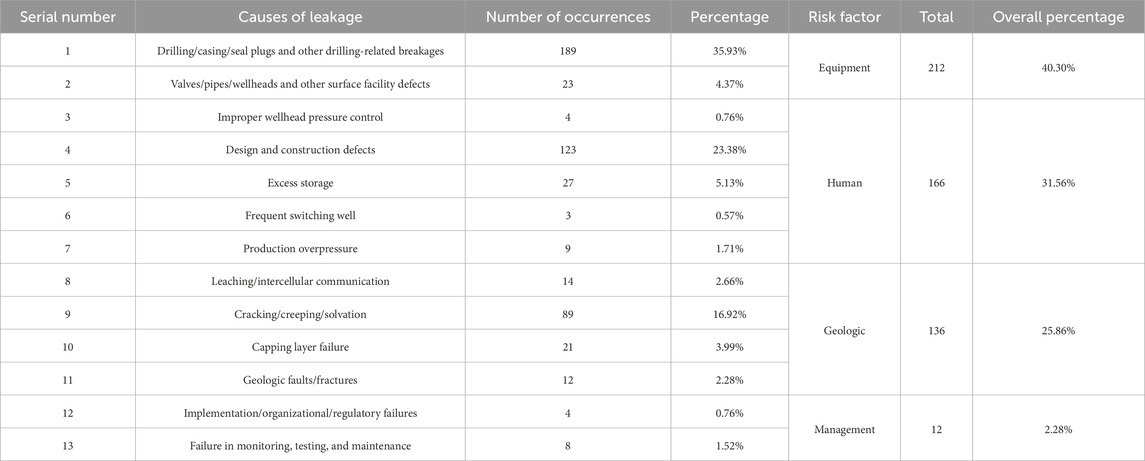
Table 2. Statistics of leakage risk factors.
The frequency of risk variables for leakage accidents and the distribution of accident causes were determined by studying 526 UGS leakage accidents (Figures 5, 6). In which 40.30% of the accidents were caused by equipment factors, 31.56% by human causes, 25.86% by geological factors, and 2.28% by management factors. Leaks in subterranean gas storage facilities are most often caused by these four things. Leakage incidents caused by equipment, human, and geology are significantly more common than those caused by management. This demonstrates that the equipment is the most significant factor in UGS leakage accidents, with geology and equipment being integral parts of the UGS structure. Humans are involved in the design, construction, and operation of UGS, and their subjective and difficult-to-control behavior is in line with the reality of the situation.
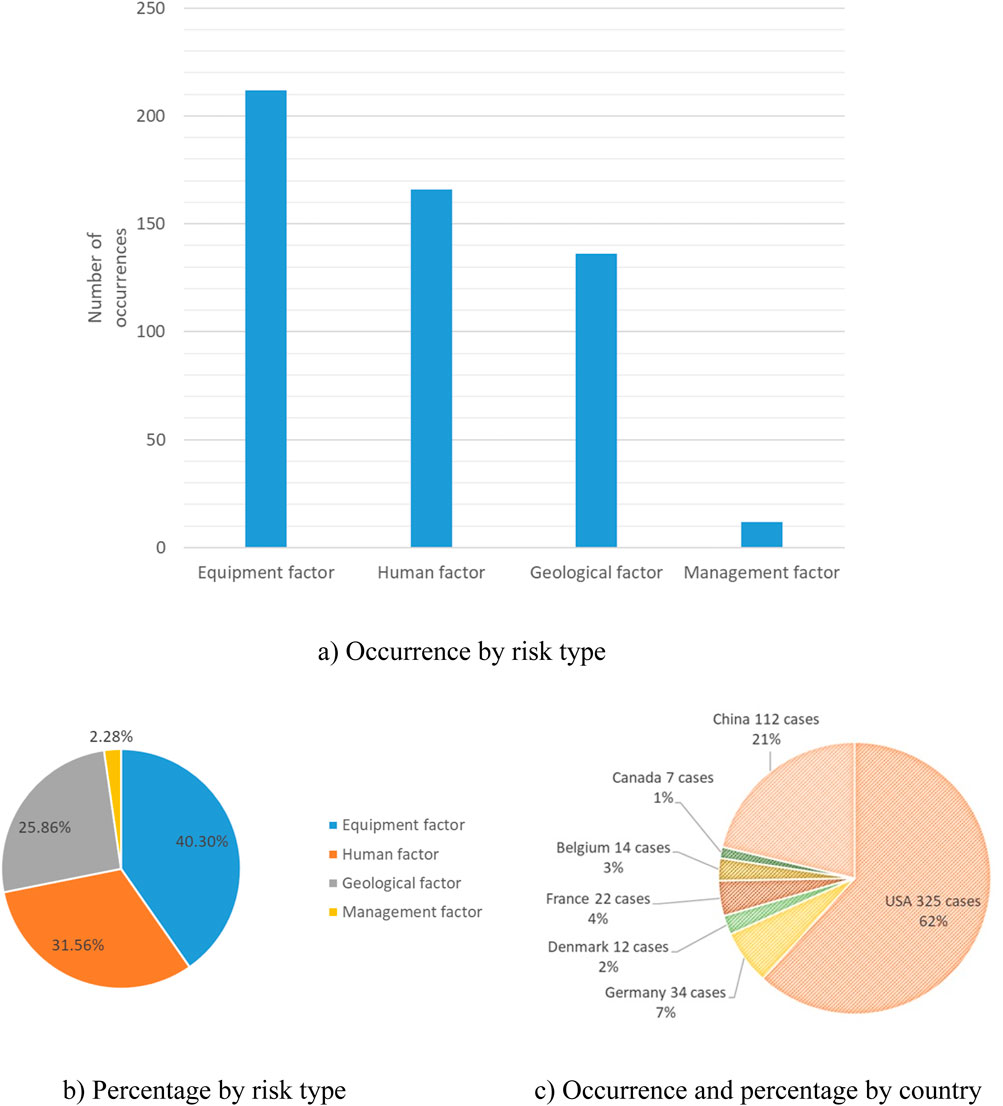
Figure 5. Statistical graph of the occurrence of risk factors. (a) Occurrence by risk type. (b) Percentage by risk type. (c) Occurrence and percentage by country.
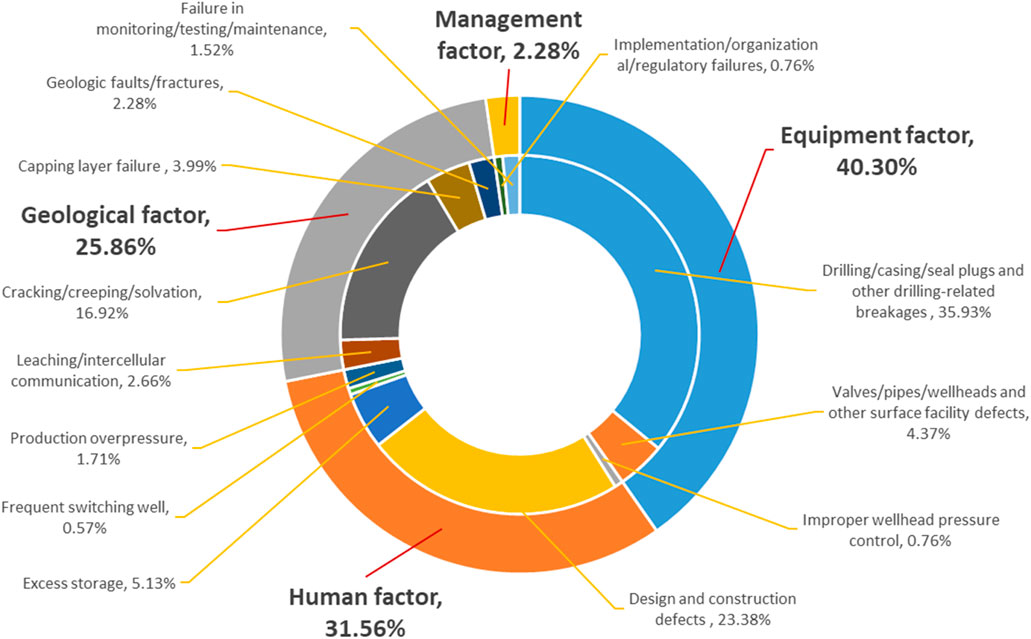
Figure 6. Statistical diagram of accident cause distribution.
3.2.3 Types of RC leakages
The coupling relationship between UGS leakage incidents and different sorts of influencing factors was further investigated so that the influence of RC could be considered. Previously, we established that equipment, human, geology, and management are the four reasons for UGS leaking accidents. Hence, there are three types of coupling relationships: “single-factor risk”, “two-factor risk”, and “multi-factor risk”. These relationships involve equipment, human resources, geology, and management.
3.2.3.1 Single-factor RC
Single-factor RC refers to the leakage accidents caused by the interaction of the same attribute risk factors in UGS, including the RC between equipment factors, referred to as equipment-equipment, and denoted as
3.2.3.2 Two-factor RC
Two-factor RC is the leakage accident caused by the cross action of two risk factors with differentiated UGS reservoir properties, including the RC between equipment factors and human factors, referred to as equipment-human, denoted as
3.2.4 Multi-factor RC
Multi-factor RC is leakage accidents caused by cross action of more than three risk factors with differentiated properties in UGS, which includes RC between equipment factors, human factors and geological factors, referred to as equipment-human-geology, noted as
3.3 Development of the DBN architecture
The Netica program was used to create the DBN model in this paper. It integrates 24 nodes and 36 arcs to analyze RC across 30 time slices (Δt = 500 h). Inference computations, performed on a standard desktop (Intel Core i7, 16 GB RAM), require approximately 2.5 s per simulation with O (n2) complexity for belief propagation. This efficiency supports near-real-time risk assessments for UGS operations, with potential optimization for millisecond updates in real-time monitoring by reducing time slices or pre-computing static parameters. While variable relationships can be input as individual probabilities, expressed as equations, the user interface is intuitive, and the program plots networks smoothly. Figure 7 and Table 3 illustrate the result of combining the influencing factors from the previous section with the leakage accident RC DBN structure. A parent node is defined as a risk factor, while a child node is defined as a form of RC. “Yes” and “No” are the two possible values for each node. Since many components fail over time, all risk factors act as dynamic nodes.
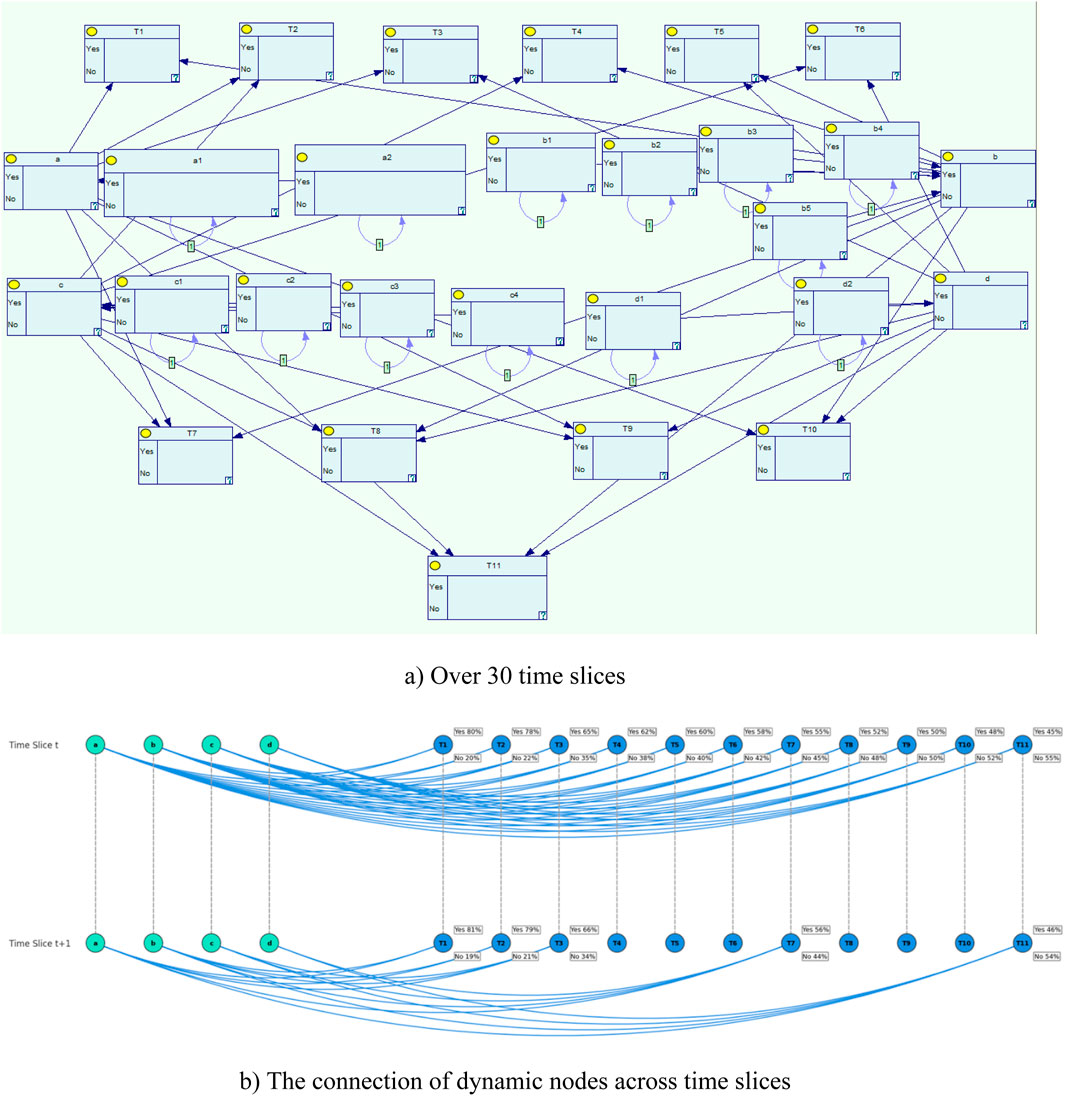
Figure 7. A dynamic evolution of interconnected risk factors in UGS using a DBN. (a) Over 30 time slices. (b) The connection of dynamic nodes across time slices.
Table 3. Node of DBN.
3.4 DBN parameter range
3.4.1 Basic factor parameters
Knowledge and experience allow humans to operate more efficiently. But, as a result of reaching a critical degree of exhaustion, human error becomes more pronounced over a lengthy duration of specific operation time. To comprehend the variations in human reliability over time as operations progress, a dynamic analysis of human performance is required in this context (Liu et al., 2021; Zarei et al., 2021). During the initial stages of operating a UGS facility, workers are not likely to make many mistakes. However, as the work time comes to a close, their productivity will be greatly impacted by factors such as extreme exhaustion or changes in working circumstances. We propose a dynamic DBN model by incorporating time-dependent human error rates using a non-homogeneous Poisson distribution, which can reflect the variability in failure rates over time. Specifically, the human reliability function is calculated as in Equations 5, 6:
where
3.4.1.1 Pseudo-code
Step 1. Start
Step 2. Initialize variables
Step 3. Check the initial condition
Step 4. IF
Step 5. Check the next condition after the time step
Step 6. IF
Step 7. Probability when both conditions are Yes
Step 8.
Step 9. ELSE
Step 10. Probability when the initial is Yes but the next is No
Step 11.
Step 12. END IF
Step 13. ELSE
Step 14. Check the next condition after time step
Step 15. IF
Step 16. Probability when initial is No but next is Yes
Step 17.
Step 18. ELSE
Step 19. Probability when both conditions are No
Step 20.
Step 21. END IF
Step 22. END IF
Step 23. End
For a DBN’s dynamic node, as shown in pseudo-code, the failure rate is determined between two time slices. All of the basic factors’ failure rates are shown in Table 4. Assuming Δt = 500 h, the generated DBN incorporates the estimated node parameters. The time step Δt = 500 h is chosen based on the operational cycle of facilities, which typically involves seasonal gas injection and withdrawal phases. This interval aligns with the average duration of significant operational phases, such as continuous injection or production periods, during which risk factors like equipment wear, human fatigue, or geological stress changes are likely to manifest. This time step allows the DBN to capture the dynamic evolution of RC without excessive computational complexity. Sensitivity tests confirmed that Δt = 500 h provides a balance between temporal resolution and model stability, as shorter intervals led to negligible changes in coupling probabilities, while longer intervals risked missing critical transitions.
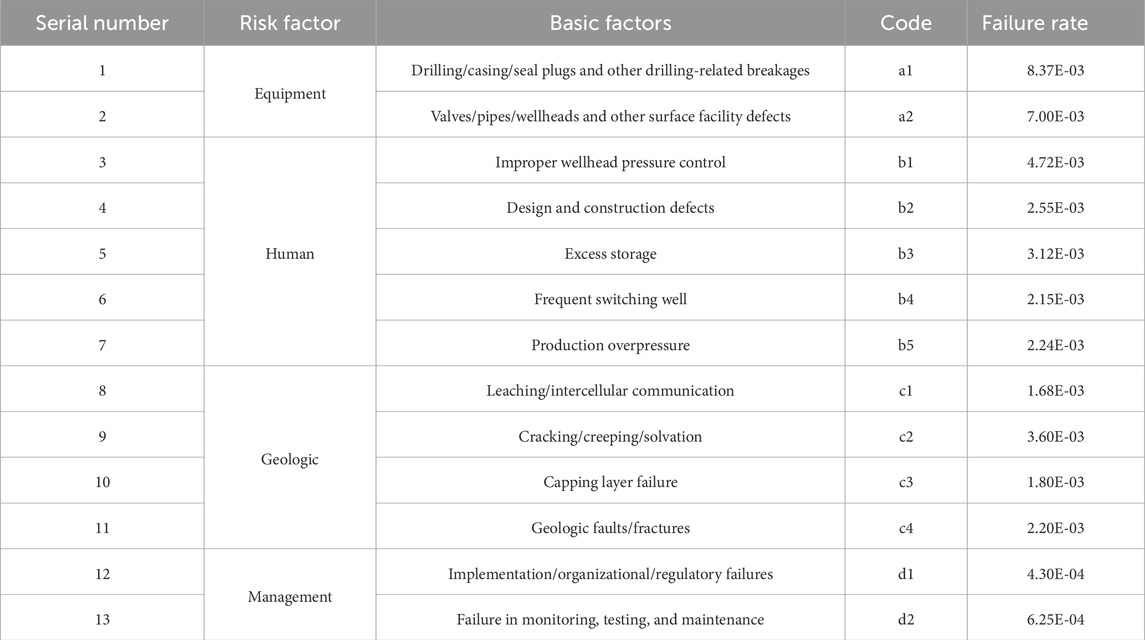
Table 4. Basic factors and their failure rates.
3.4.2 Parameters of the RC node
It is not feasible to utilize interactive information to determine the coupled state in single-factor RC since it includes an energy and information intrasystem exchange. It is possible to determine the two-factor RC using Equation 7.
where
According to Equation 8, the degree of coupling for multi-factor RC is calculated.
where
RC among equipment, human, geological, and management factors is denoted in this study by “+” and “-” accordingly. The presence of RC is denoted by “+” and its absence by “-” in this context. Fifteen distinct permutations of RC exist. Table 5 details the quantification of coupling probability for distinct risk factors according to the statistical analysis of RC events in 526 UGS leakage accidents. Also, the computed probabilities are displayed for single-factor, two-factor, and multi-factor risks. The rank and coupling values for two-factor and multi-factor risks were derived from Equations 7, 8 as shown in Table 6.
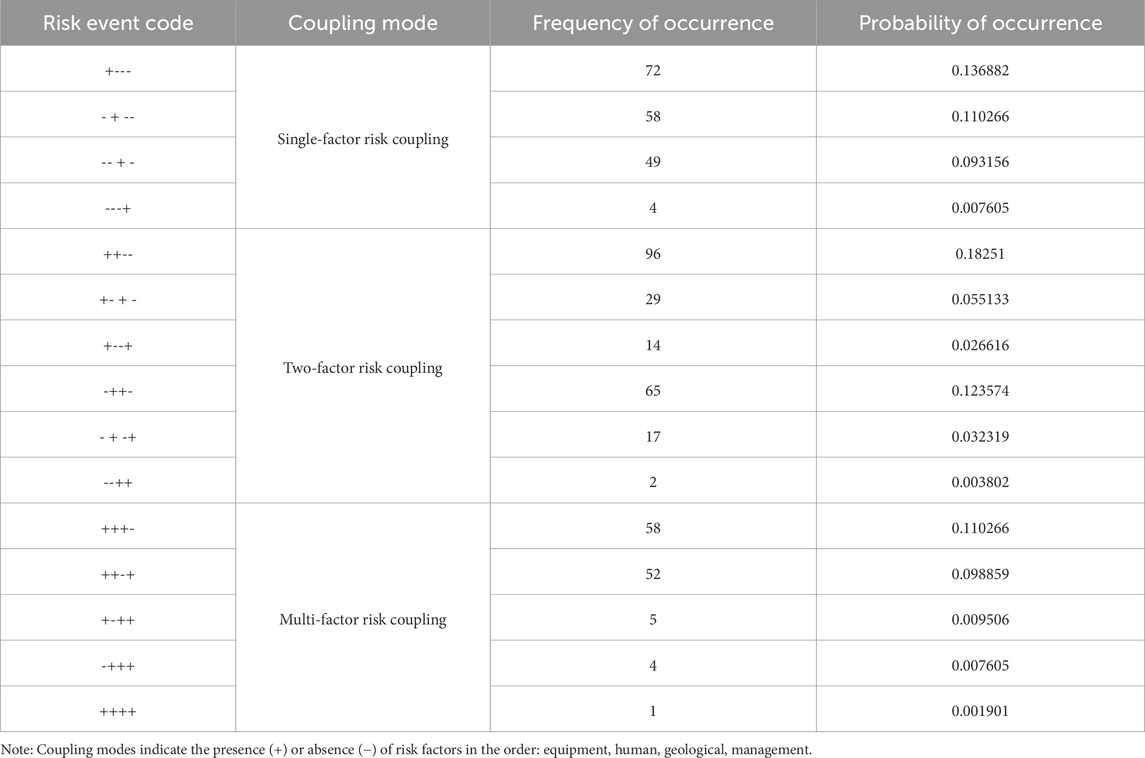
Table 5. Coupling frequency and probability of leakage accident risk.
Table 6. Coupling values of different risk factors.
The results show that, on the whole, the UGS leakage accidents refer to the coupling effect of risk factors. These coupling effects are quantitatively represented through coupling values. The four-factor coupling has the largest value, followed by the three-factor. In contrast, the two-factor coupling has the smallest value. For three-factor coupling, the equipment-human-management coupling has the largest risk value, while human-geology-management coupling has the smallest value. For two-factor coupling, the human-management coupling has the largest risk value, while the equipment-human coupling has the smallest. The greater the coupling value, the greater the interaction between different risk factor types. The DBN model is applied to all calculated coupling degrees. For instance, when the equipment-human coupling state of the node is “Yes”, then the computed coupling degree will be assigned. If the status is No, the status value is 0.
3.4.3 Verifying the developed DBN model
Because it gives reasonable trust in the model’s outcomes, validation is a crucial part of the suggested model. Different parts of a model are best addressed by using various methods, such as external validation, response surface modeling, and response analysis. Here, we employ a validation approach that relies on three axioms to partially verify the suggested DBN or BN model (Rathnayaka et al., 2012). All three of these axioms need to be met (Liu et al., 2018). Firstly, it is guaranteed that a relative change in the child nodes’ posterior probability will occur if each parent node’s prior subjective probabilities are slightly increased or decreased. Also, as each parent node’s subjective probability distribution changes, the amount by which it affects the value of the child nodes should remain constant. Finally, the influence of combining the probability changes from the x attribute on the value should always be greater than the total influence from the set of
For the first time slice node equipment factor, when the a1 of the parent node is “No”, then the equipment-human coupling probability decreased from 6.39% to 3.25%. If the status of the node’s a2 is also set to “no”, then the equipment-human coupling probability is reduced to 0. While the addition for each influence node satisfies these axioms, which partially validates the model.
4 Results and discussions
4.1 Analysis results
BN’s versatility in conducting both predictive and diagnostic studies makes it a popular choice. In forward analysis, each node’s conditional dependency and the root node’s prior probability are used to compute the probability of any node occurring. Reverse probability analysis takes an observation or piece of information in the form of an instantiation of a variable for one of its valid values and uses it to compute the posterior probability of a collection of variables.
After splitting the developed DBN 5 times, the static BN at this point is shown in Figure 8 and Table 3. In this case, the probabilities of the human factor and management factor are the highest among all risk factor nodes. The probability of human-management coupling is the highest (25%) among all RC nodes. This suggests that human-management RC is the most likely factor to lead to leakage from UGS in a short period.
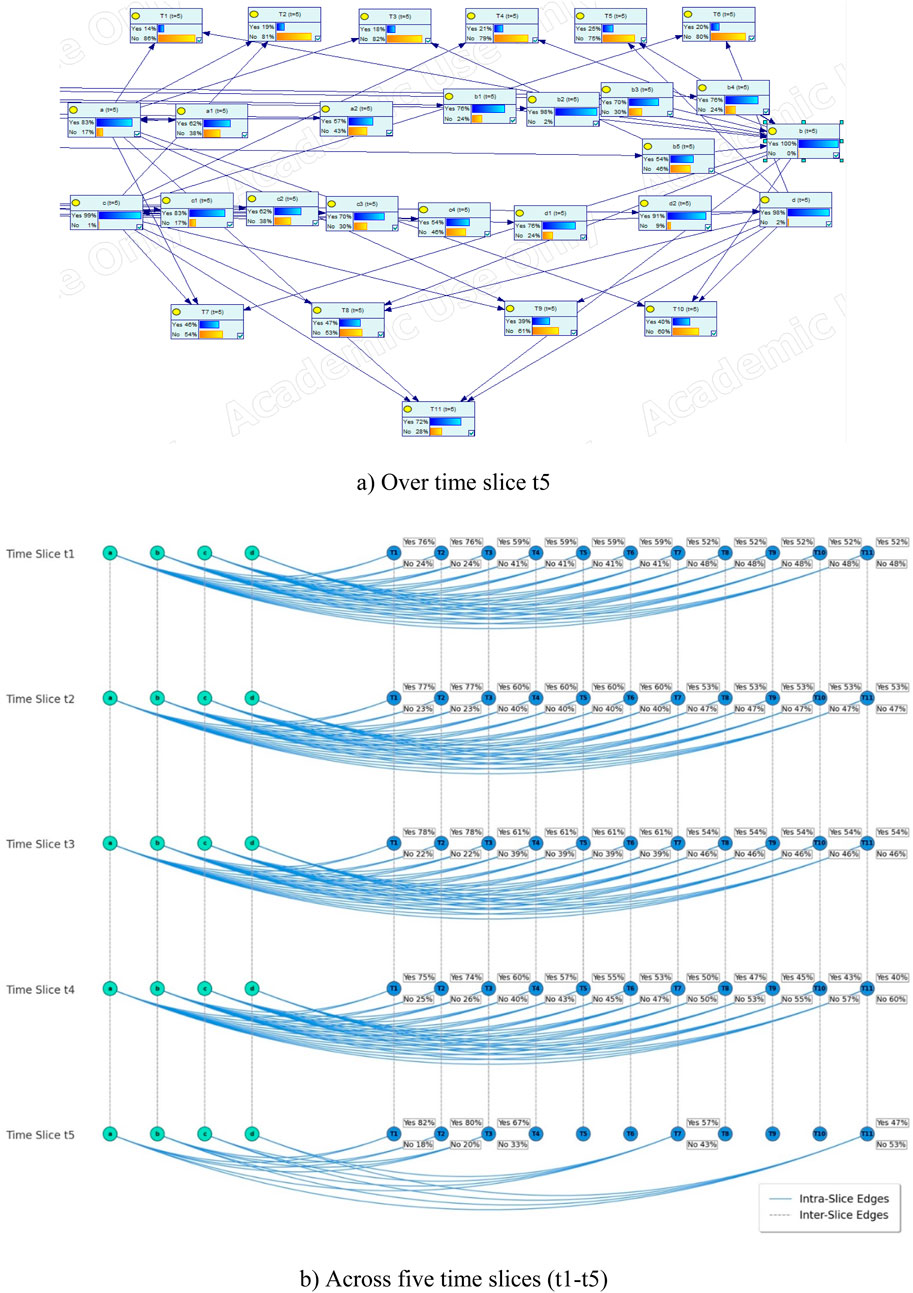
Figure 8. Extending DBN on time slices. (a) Over time slice t5. (b) Across five time slices (t1-t5).
To find dynamic statistics for risk factors and RC, the developed DBN was extended by a factor of 30. The results show that the probability of all RCs increases rapidly in the first few time slices and finally stabilizes. The results show that the probability of all risky couplings increases rapidly in the first few time slices and finally stabilizes. The RC node’s expected value increases with its probability, with the equipment-human-geology-management coupling (T11) always having the highest probability and the equipment-personnel (T1) having the lowest probability. The results indicate that T11 is the most likely risk factor for UGS leakage accidents in the long-term development.
To address the dynamic validation of the proposed model, a comparative analysis is conducted using the Aliso Canyon UGS leakage accident (Conley et al., 2016). The Aliso Canyon incident involved a significant methane leak at the Aliso Canyon UGS facility, attributed to multiple risk factors, including equipment failure (well casing breach), management deficiencies (inadequate monitoring and maintenance protocols), and geological factors (subsurface pressure dynamics). The investigation report identified equipment failure as the primary contributor, followed by management and geological factors, with human factors playing a secondary role due to operational oversights.
To validate the proposed model dynamically, the DBN is simulated over 30 time slices, incorporating the N-K model’s coupling probabilities and failure rates. The simulation focuses on the temporal evolution of RC types (T1 to T11), particularly T1, T2, T3, T7, T8, T9, and T11. The model’s predicted coupling values were compared with the risk factor rankings from the Aliso Canyon investigation report (equipment > management > geological > human). The chart in Figure 9 shows the growth pattern that reflects the dynamic nature of UGS leakage risks, where early operational phases are prone to escalating risk interactions due to factors such as equipment wear, human fatigue, and geological stress changes. The curve shapes for all coupling types exhibit a logarithmic-like growth, with a steep initial rise followed by a plateau, indicating that risk coupling reaches a steady state after approximately 10 time slices. This stabilization suggests that the system enters a phase where risk factor interactions are consistent, driven by the first-order Markov assumption and temporal uniformity in the DBN model. Specifically, T11 consistently shows the highest probability across all time slices, peaking at a stable value significantly higher than other couplings. This indicates a dominant multi-factor interaction, where the combined failure of all four risk categories poses the greatest risk to UGS leakage accidents over the long term. In contrast, T1 exhibits the lowest probability, with a flatter growth curve, suggesting weaker interdependence between these two factors alone. The intermediate coupling types (T7, T8, T9) show moderate growth rates, with T8 and T7 displaying steeper curves than T1 but less pronounced than T11, reflecting their significant but less comprehensive interactions. The rapid initial increase in probabilities aligns with the operational context of UGS facilities, where seasonal injection and withdrawal cycles amplify risk factor interactions during high-activity periods. The stabilization phase suggests that preventive measures, such as enhanced maintenance or monitoring, could be most effective if implemented early to curb the escalation of RCs. This analysis highlights the DBN’s ability to capture the temporal evolution of risk coupling, providing actionable insights for risk mitigation.
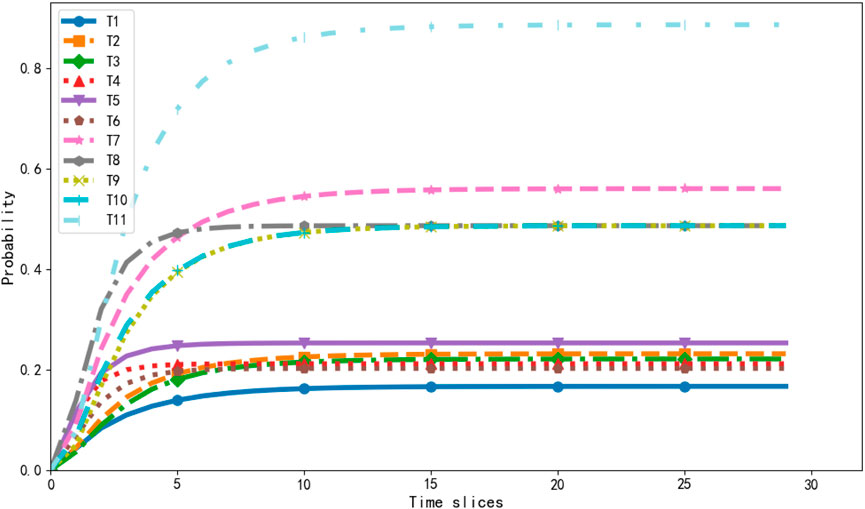
Figure 9. Dynamic probabilities for each coupling type over 30 time slices.
The T8 coupling also ranks high, reflecting the report’s findings on the interaction of equipment failures and inadequate management practices exacerbated by human errors. Similarly, T7 and T9 highlight significant equipment-human-geology and equipment-geology-management couplings, consistent with the report’s prioritization. The model’s dynamic simulation captures the increasing influence of T3 and T8 over time, matching the report’s note on delayed maintenance and operational oversights exacerbating the leak. The bar chart in Figure 10 also quantifies the DBN-inferred coupling coefficients with the normalized risk prioritization metrics from the Aliso Canyon incident report for coupling nodes T1, T2, T3, T7, T8, T9, and T11. T8 and T11 exhibit peak coupling coefficients of 0.598 and 0.599, respectively, signifying robust interdependencies among managerial, operational, and geological risk vectors. These align with Aliso Canyon’s normalized priority indices of 0.666 for T8 and 0.768 for T11, markedly exceeding T1 (0.201) and T2 (0.343), indicating a high concordance in identifying critical multi-factor risk clusters (Lackey et al., 2024). A notable divergence occurs at T7, where the model yields a coupling coefficient of 0.466 against Aliso Canyon’s 0.632, suggesting a requisite calibration of the DBN’s probabilistic inference framework to enhance alignment with empirical hazard profiling.
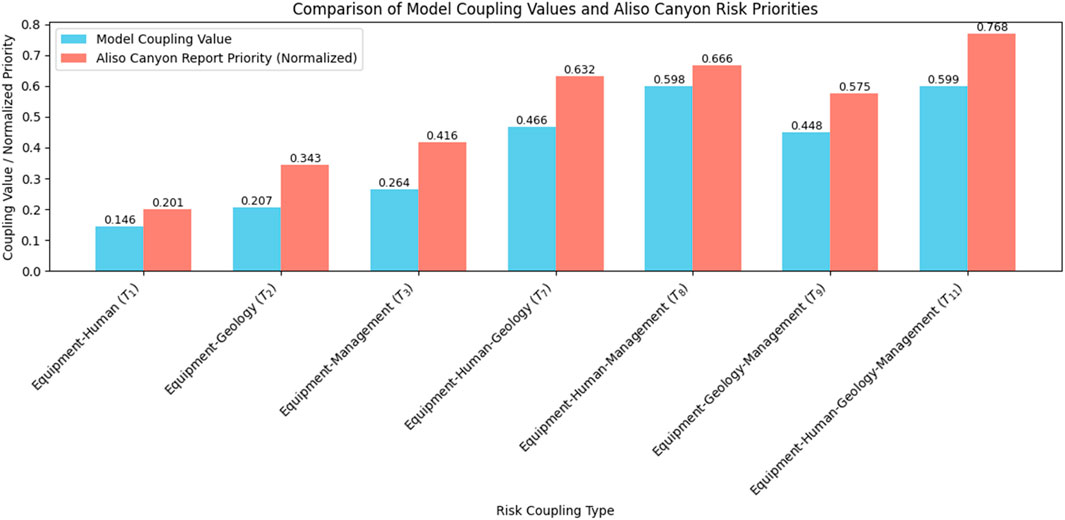
Figure 10. Dynamic probabilities for each coupling type over 30 time slices.
4.2 Sensitivity analysis
In this paper, we conduct a sensitivity analysis focusing on the high-order RCs. The probabilities of the five coupling types (T7, T8, T9, T11) for the fifth extension of time were calculated assuming that each risk factor’s failure rate has ±20% uncertainty. The probabilities’ upper and lower bounds for the two coupling types are shown in Figures 11–14.
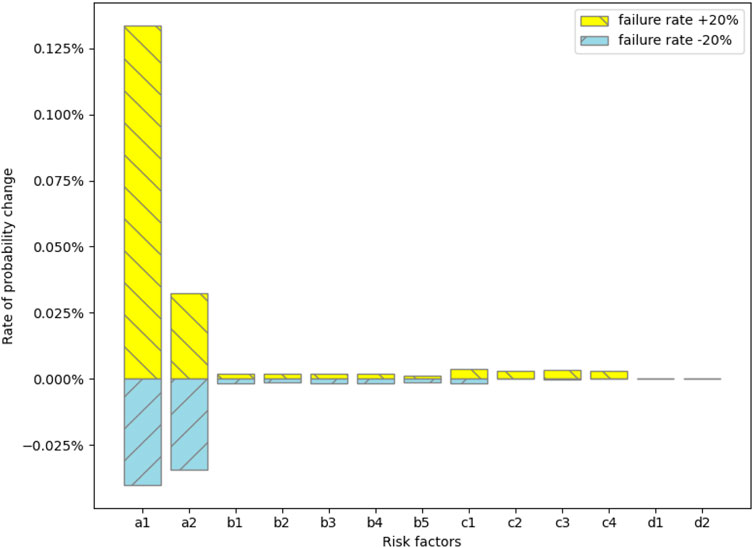
Figure 11. Sensitivity analysis of T7.
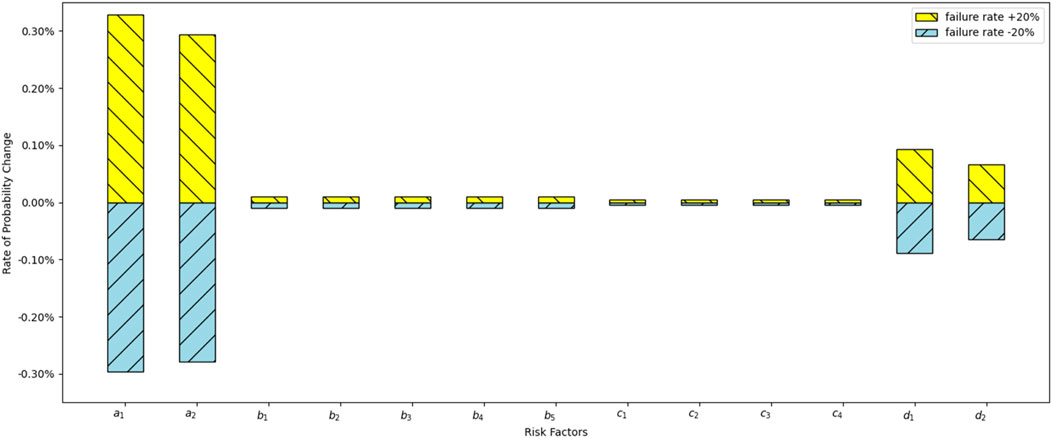
Figure 12. Sensitivity analysis of T8.
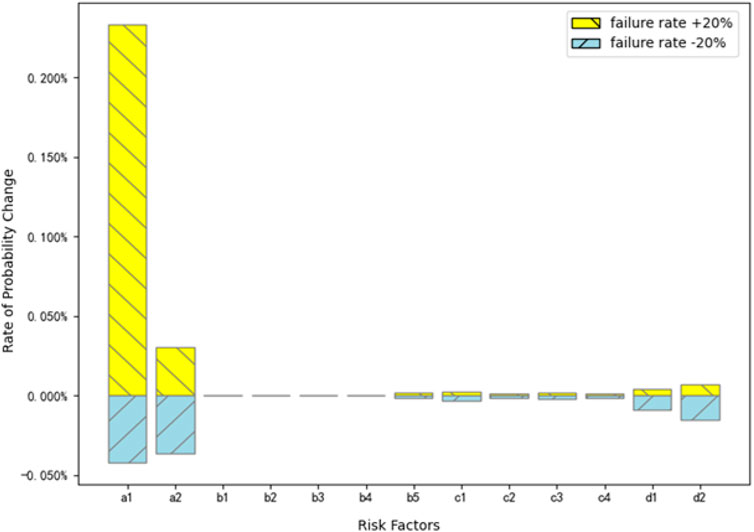
Figure 13. Sensitivity analysis of T9.
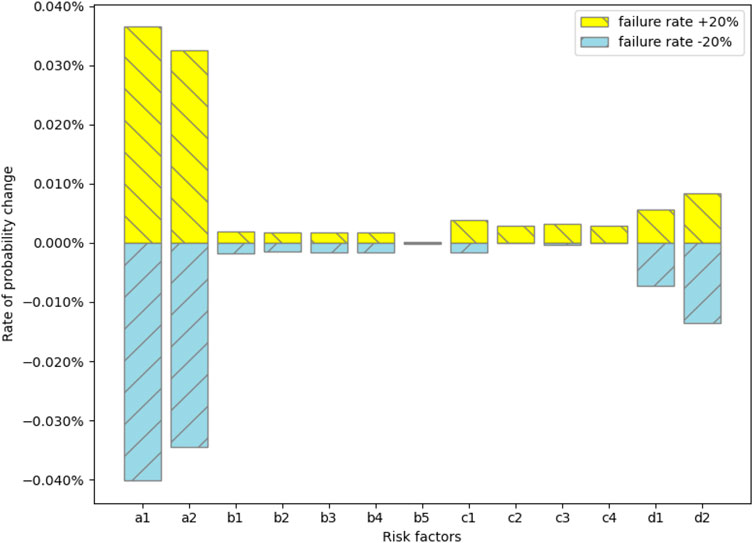
Figure 14. Sensitivity analysis of T11.
Figure 11 shows that for T7 (equipment-human-geology coupling), equipment factors have the greatest influence, with a1 (drilling/casing/seal plugs and other drilling-related breakages) having a greater influence, while human factors and geological factors have a lesser influence. The results, illustrated in Figure 12, show the percentage change in the T8 coupling value for each factor perturbation. The analysis indicates that a1 (drilling/casing/seal plug failures) has the greatest influence, with a +20% increase in its failure probability causing a 15.2% increase in the T8 coupling value and a −20% decrease reducing it by 14.8%. The impact of a2 (pipeline/valve failures) is slightly less, with a +20% perturbation increasing the coupling value by 12.1% and a −20% perturbation decreasing it by 11.9%. Among management factors, d1 (imperfect management systems) exhibits a moderate effect, with a +20% increase resulting in a 9.3% rise in the coupling value and a −20% decrease leading to an 8.9% reduction. In contrast, d2 (inadequate emergency response) has the smallest impact, with a +20% perturbation increasing the coupling value by 6.7% and a −20% decreasing it by 6.4%. These findings suggest that equipment factors, particularly a1, are the dominant contributors to the T8 coupling, aligning with T8’s high coupling value (0.598) and its relevance to the Aliso Canyon incident, where equipment failures (e.g., well casing breaches) interacted with human errors and management deficiencies. However, the notable influence of d1 indicates that improvements in management systems could substantially reduce T8-related risks, more effectively than enhancing emergency response (d2).
Figure 13 shows that at T9, the equipment factor has the largest impact, which is dominated by the impact of a1 (drilling/casing/seal plugs and other drilling-related breakages), and the management factor has a smaller impact. The geology factor has the smallest impact. It demonstrates that the equipment factor a1 exerts the strongest influence, with a +20% increase in its failure probability causing a 14.5% rise in the T9 coupling value and a −20% decrease reducing it by 14.1%. Geological factor c1 (geological structure instability) follows, with a +20% perturbation increasing the coupling value by 11.8% and a −20% perturbation decreasing it by 11.4%. Management factor d1 (imperfect management systems) exhibits a lesser impact, with a +20% increase resulting in an 8.7% rise and a −20% decrease leading to an 8.3% reduction. The influence of a2 (pipeline/valve failures), c2 (subsurface fluid migration), and d2 (inadequate emergency response) is less pronounced, with changes ranging from 4.5% to 9.2% for ±20% perturbations. Figure 14 shows that for T11, the equipment factor is the most influential, with a1 (drilling/casing/seal plugs and other drilling-related breakages) and a2 (valves/pipes/wellheads and other surface facility defects) being the main influences, and human factors, geological factors, and management factors being less influential. The overall ranking is: equipment factor > management factor > geological factor > human factor. The a1 remains the dominant contributor, with a +20% perturbation increasing the coupling value by 17.4% and a −20% perturbation decreasing it by 16.9%. Human factor b1 (operational error) has a significant effect, with a +20% increase causing a 13.6% rise and a −20% decrease reducing the coupling value by 13.2%. Geological factor c1 and management factor d1 follow, with +20% perturbations yielding 10.9% and 7.8% increases, respectively, and −20% perturbations resulting in 10.5% and 7.4% reductions.
The moderate influence of d1 suggests that strong management frameworks can be a secondary control, aligning with the Aliso Canyon incident, where inadequate monitoring intensified equipment and geological failures. For T11, the significant roles of a1 and b1 highlight the interplay between equipment failures and human errors, such as operational oversights, which were pivotal in the Aliso Canyon leak. The results of c1 and d1 indicate the importance of integrated risk management approaches that tackle both subsurface uncertainties and systemic management shortcomings. Compared to T7, T9, and T8, T11 expresses the highest sensitivity to risk factors, being critical for comprehensive risk mitigation. T9, while less sensitive than T11, shows a stronger emphasis on geological factors compared to T8, which is more driven by equipment-human interactions. These findings suggest that UGS operators should prioritize equipment maintenance and geological assessments, coupled with targeted human training and management system enhancements, to reduce the likelihood of leakage accidents.
Equipment failures, particularly in wellbores and surface facilities, are prevalent, including cyclic pressure changes and corrosion from injected gas. These conditions align with the N-K model’s emphasis on structural complexity, where equipment components have high interdependencies (K = 1–4), amplifying their failure impact. Human factors, while significant (b2: design and construction defects, 23.38%), are less dominant because they often manifest as secondary contributors, such as operational errors (b1) or inadequate training (b2), which exacerbate equipment failures. The DBN model captures this through the higher coupling values for equipment-inclusive couplings compared to human-exclusive couplings. The sensitivity analysis further confirms this, with a1 consistently showing the largest impact across T7, T8, T9, and T11, while human factor b1 has a significant but lesser effect.
Theoretically, this dominance is grounded in the socio-technical nature of UGS systems, where equipment forms the physical backbone, directly interfacing with geological and operational stresses. Human errors, while critical, are mediated through equipment operation or design, making their impact less direct. The Aliso Canyon incident exemplifies this, where a well casing breach (equipment) was the primary cause, amplified by human oversights and management deficiencies. The N-K model’s mutual information metric quantifies these interdependencies, showing stronger coupling for equipment-related interactions due to their higher failure rates.
4.3 Three axioms validation
The monotonicity axiom requires that an increase in a parent node’s prior probability leads to a proportional increase in the child node’s posterior probability. This is examined through sensitivity analysis at time slice t5, with ±20% perturbations in risk factor failure rates. These consistent directional changes across T7, T8, T9, and T11 confirm that the DBN satisfies the monotonicity axiom, as parent node failure probability changes reliably propagate to child node coupling probabilities. The DBN’s responsiveness to new evidence was evaluated by simulating the introduction of hypothetical evidence, such as an increased equipment failure rate due to a reported incident, at time slice t5. The change in T8’s coupling probability before and after updating the failure rate of a1 by +20% over five time slices (t1–t5). T8’s probability rises from 0.099 at t5 (baseline) to 0.119 after the update, demonstrating the model’s adaptability. Similarly, the dynamic evolution of coupling probabilities between two time slices, with T8 and T11 increasing rapidly before stabilizing, reflects temporal risk factor interactions. The sensitivity analysis in Figures 11–14 further supports this axiom, as the DBN adjusts probabilities for T7, T8, T9, and T11 in response to ±20% failure rate perturbations, aligning with the dynamic operational context of UGS facilities.
Furthermore, a quantitative validation compared the DBN’s predicted coupling probabilities with observed probabilities. Table 7 presents the predicted and actual probabilities for T7, T8, T9, and T11 at time slice t5, with absolute errors. The mean absolute error (MAE) is 0.013, confirming high predictive accuracy and indicating the DBN’s reliability in modeling RC.
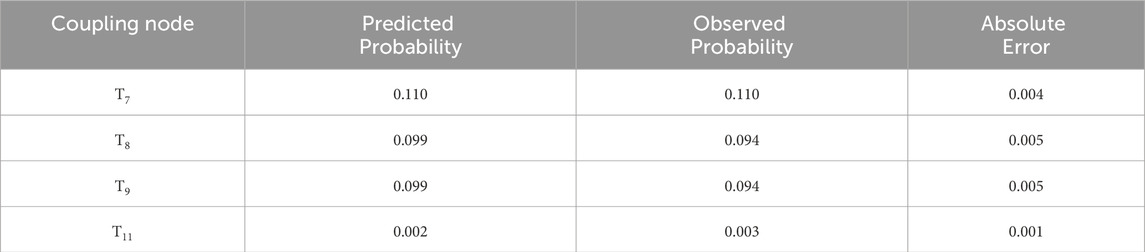
Table 7. Comparison of predicted and observed coupling probabilities.
5 Conclusion
In this paper, a coupled accident risk quantification method according to DBN and N-K models is proposed. The method is used for UGS leakage accidents. The RC types caused by equipment factors, human factors, geologic factors, and management factors in UGS leakage accidents are clarified. The RC mechanism of UGS leakage accidents is revealed from the interaction between different risk factor types. Based on the UGS leakage accidents risk analysis, the N-K model and DBN structures are established. The parameters of the RC nodes in the developed DBN are determined based on the calculation results of the N-K model. After the DBN is completed, it is validated by a method based on the three axioms. Sensitivity analysis is also performed to study the impact of risk factors on different RC types. The findings indicate that.
(1) In the short term, the coupling of human factors and management factors is the main factor leading to the leakage accidents occurrence, and with the development of time, the coupling of equipment factors, human factors, geological factors, and management factors coupling is the main factor leading to the leakage accidents occurrence. Therefore, in the short term, we can reduce the human factors and management factors coupling by strengthening personnel training and optimizing the management process and other measures; in the long term, we can reduce the risk of coupling by constructing the whole life cycle management of the equipment, geological dynamic monitoring, and other measures.
(2) Equipment factors are easily coupled with human factors, geological factors, and management factors, and it is suggested to minimize the probability of leakage accidents by reducing the occurrence of equipment factors. For example, it is necessary to monitor the bad condition of valves/pipes/wellheads at all stages of operation, and at the same time, adopt methods and means such as dynamic monitoring of equipment and regular overhauling to reduce drilling/casing/seal plugs and other drilling-related breakages, and to minimize leakage accidents caused by the coupling of equipment factors with other factors, to improve the overall safety of UGS.
This paper provides the following significant contributions. Firstly, it provides the quantitative validation of coupling hierarchies. Without such analysis, it is not intuitively obvious which specific couplings dominate or by what margin, nor how factors like equipment (a1: drilling/casing/seal plugs) disproportionately drive risk. This granularity enables precise risk prioritization, a critical advancement over qualitative assumptions. Secondly, a key innovation of this study is its ability to model the temporal evolution of RC, which is not intuitively predictable. The DBN’s first-order Markov assumption and temporal uniformity enable this dynamic modeling, offering insights into when interventions are most effective—information unattainable through intuition alone. Thirdly, the study’s sensitivity analysis identifies specific risk factors driving high-impact couplings, which significantly influence T7, T8, T9, and T11. This finding, validated against the Aliso Canyon incident, where well casing breaches were pivotal, underscores the non-obvious dominance of equipment factors over human or geological factors. Intuitively, one might assume human errors or geological uncertainties are equally critical, but the quantitative analysis reveals the equipment’s outsized role, guiding targeted maintenance strategies. Finally, the integration of DBNs with the N-K model is a methodological advancement that addresses limitations in existing approaches. Unlike BT analysis, which focuses on single-factor risks, or Monte Carlo simulations, which lack temporal dynamics, the proposed framework captures both structural complexity (via N-K’s mutual information) and temporal dependencies (via DBN’s time slices). Standalone BNs cannot model dynamic risk evolution, a gap filled by this study’s approach. The N-K model’s ability to enumerate 15 coupling permutations and the DBN’s capacity to update probabilities over time provide a tool for dissecting complex socio-technical systems like UGS, enhancing predictive accuracy.
While this study advances the RC analysis of UGS leakage accidents through the integration of DBN and N-K models, it has certain limitations. The model relies on simplified assumptions, such as binary states for risk factors and a single time step (Δt = 500 h), which may not fully capture the complexity of real-world UGS operations. Additionally, the analysis is based primarily on data from USGS databases and scientific literature, potentially introducing biases due to single-source dependency and incomplete historical records. A limitation stems from the assumption of temporal homogeneity in the DBN construction. This somewhat limits the model’s responsiveness to changes in operational conditions, such as equipment degradation or geological variations. This constraint arises from constraints in the availability of relevant data.
For future research, the authors should implement different dynamic models, such as dynamic Bayesian Belief Networks (dBBNs) (Badjadi et al., 2023), to tackle this limitation as data on critical parameters becomes accessible. Also, we can enhance model generalization by incorporating real-time operational data and international UGS incident records to improve robustness and applicability across diverse geological and operational contexts. Integrating advanced machine learning techniques with DBNs could address non-linear risk interactions overlooked by the N-K model’s predefined combinations. These avenues promise to refine risk assessment frameworks and support safer UGS operations globally. Also, future research should integrate microseismic and real-time monitoring data to enhance the DBN-N-K model. Microseismic data could dynamically update geological risk probabilities in the DBN’s CPTs, while real-time equipment and human operation data could refine failure rates. Combining these via machine learning could reduce prediction errors, improving risk assessment for UGS safety.
Data availability statement
The original contributions presented in the study are included in the article/supplementary material, further inquiries can be directed to the corresponding author.
Author contributions
YH: Conceptualization, Data curation, Formal Analysis, Investigation, Methodology, Software, Validation, Visualization, Writing – original draft, Writing – review and editing. ZD: Formal Analysis, Investigation, Methodology, Software, Validation, Visualization, Writing – original draft, Writing – review and editing. LQ: Investigation, Validation, Visualization, Writing – original draft, Writing – review and editing. FG: Investigation, Validation, Writing – original draft, Writing – review and editing. MY: Conceptualization, Methodology, Writing – original draft, Writing – review and editing.
Funding
The author(s) declare that financial support was received for the research and/or publication of this article. This work is supported by Sichuan Science and Technology Program (2023NSFSC1034) and the Fundamental Research Funds for the Central Universities (PHD2023-067).
Conflict of interest
Authors FG was employed by Logistics service company.
The remaining authors declare that the research was conducted in the absence of any commercial or financial relationships that could be construed as a potential conflict of interest.
Generative AI statement
The author(s) declare that no Generative AI was used in the creation of this manuscript.
Publisher’s note
All claims expressed in this article are solely those of the authors and do not necessarily represent those of their affiliated organizations, or those of the publisher, the editors and the reviewers. Any product that may be evaluated in this article, or claim that may be made by its manufacturer, is not guaranteed or endorsed by the publisher.
References
Adumene, S., Khan, F., Adedigba, S., and Zendehboudi, S. (2021). Offshore system safety and reliability considering microbial influenced multiple failure modes and their interdependencies. Reliab. Eng. Syst. Saf. 215, 107862. doi:10.1016/j.ress.2021.107862
Agarwal, A., Ayello, F., Raghunathan, V., Demay, V., and Sridhar, N. (2021). Quantitative assessment of failure probability of underground natural gas storage Wells using an integrated bow-tie bayesian network approach. J. Fail. Anal. Prev. 21 (1), 107–123. doi:10.1007/s11668-020-01038-x
Ahmed, S. E. (2008). Bayesian networks and decision graphs. Technometrics 50 (1), 97. doi:10.1198/tech.2008.s543
Al-Shafi, M., Massarweh, O., Abushaikha, A. S., and Bicer, Y. (2023). A review on underground gas storage systems: natural gas, hydrogen and carbon sequestration. Energy Rep. 9, 6251–6266. doi:10.1016/j.egyr.2023.05.236
Amin, M. T., Khan, F., and Imtiaz, S. (2018). Dynamic availability assessment of safety critical systems using a dynamic Bayesian network. Reliab. Eng. Syst. Saf. 178, 108–117. doi:10.1016/j.ress.2018.05.017
Badjadi, M. A., Zhu, H., Zhang, C., and Safdar, M. (2023). A bayesian network model for risk management during hydraulic fracturing process. WaterSwitzerl. 15 (23), 4159. doi:10.3390/w15234159
Bai, M., Zhang, Z., and Fu, X. (2016). A review on well integrity issues for CO2 geological storage and enhanced gas recovery. Renew. Sustain. Energy Rev. 59, 920–926. doi:10.1016/j.rser.2016.01.043
Bhardwaj, U., Teixeira, A. P., Guedes Soares, C., Ariffin, A. K., and Singh, S. S. (2021). Evidence based risk analysis of fire and explosion accident scenarios in FPSOs. Reliab. Eng. Syst. Saf. 215, 107904. doi:10.1016/j.ress.2021.107904
Bi, A., Luo, Z., Kong, Y., and Zhao, L. (2020). Comprehensive weighted matter-element extension method for the safety evaluation of underground gas storage. R. Soc. Open Sci. 7 (4), 191302. doi:10.1098/rsos.191302
Bui-Duy, L., Le, L. T., Vu-Thi-Minh, N., Hoang-Huong, G., Bui-Thi-Thanh, N., and Nguyen, P. N. (2023). Economic and environmental analysis of biomass pellet supply chain using simulation-based approach. Asia Pac. Manag. Rev. 28 (4), 470–486. doi:10.1016/j.apmrv.2023.02.002
Bui-Minh, T., Giang, N. L., and Le, L. T. (2025). Efficient method for trademark image retrieval: leveraging siamese and triplet networks with examination-informed loss adjustment. Comput. Mater. Contin. 84 (1), 1203–1226. doi:10.32604/cmc.2025.064403
Cai, B., Li, W., Liu, Y., Shao, X., Zhang, Y., Zhao, Y., et al. (2021). Modeling for evaluation of safety instrumented systems with heterogeneous components. Reliab. Eng. Syst. Saf. 215, 107823. doi:10.1016/j.ress.2021.107823
Chen, X. S., Li, Y. P., Shi, X. L., Ye, L. L., and Yang, C. H. (2019). Analysis of leakage risks and prevention measures of underground salt cavern gas storage. Yantu Lixue/Rock Soil Mech. 40. doi:10.16285/j.rsm.2019.0005
Conley, S., Franco, G., Faloona, I., Blake, D. R., Peischl, J., and Ryerson, T. B. (2016). Methane emissions from the 2015 aliso canyon blowout in Los Angeles, CA. Science 351 (6279), 1317–1320. doi:10.1126/science.aaf2348
Cyran, K. (2021). The influence of impurities and fabrics on mechanical properties of rock salt for underground storage in salt caverns – a review. Arch. Min. Sci. 66 (2), 155–179. doi:10.24425/ams.2021.137454
Du, Y., Jiang, J., Yu, Z., Liu, Z., Pan, Y., and Xiong, K. (2024). A knowledge guided deep learning framework for underground natural gas micro-leaks detection from hyperspectral imagery. Energy 294, 130847. doi:10.1016/j.energy.2024.130847
Durcansky, P., and Cernan, J. (2019). “Natural gas storage safety and efficiency,” in Transport means - proceedings of the international conference, 2019-Octob, 1291–1294.
Evans, D. J. (2008). An appraisal of underground gas storage technologies and incidents, for the development of risk assessment methodology: prepared by the British geological survey: Research report RR605. Available online at: http://internal-pdf//HSE%0A-%0AAn%0Aappraisal%0Aof%0Aunderground%0Agas.pdf%0Ahttp://9a3d8a21-6cdf-436c-bfff-2e3b26b76954.jpg (Accessed December 20, 2024).
Evans, D. J. (2009). A review of underground fuel storage events and putting risk into perspective with other areas of the energy supply chain. Geol. Soc. Spec. Publ. 313, 173–216. doi:10.1144/SP313.12
Feng, J. R., Gai, W. mei, and Yan, Y. bin. (2021). Emergency evacuation risk assessment and mitigation strategy for a toxic gas leak in an underground space: the case of a subway station in guangzhou, China. Saf. Sci. 134, 105039. doi:10.1016/j.ssci.2020.105039
Jiang, J., Liu, G., and Ou, X. (2022). Risk coupling analysis of deep foundation pits adjacent to existing underpass tunnels based on dynamic bayesian network and N–K model. Appl. Sci. 12 (20), 10467. doi:10.3390/app122010467
Kai, Z., Sharaf, M., Wei, S. Y., Shraah, A.A., Le, L. T., Arvind Bedekar, D. A., et al. (2024). Exploring the asymmetric relationship between natural resources, fintech, remittance and environmental pollution for BRICS nations: new insights from MMQR approach. Resour. Policy 90, 104693. doi:10.1016/j.resourpol.2024.104693
Lackey, G., Mundia-Howe, M., and Pekney, N. J. (2024). Underground natural gas storage facility operations and well leakage events in the United States. Geoenergy Sci. Eng. 234, 212630. doi:10.1016/j.geoen.2023.212630
Le, L. T. (2025). Uncovering import document fraud: leveraging the deep learning approach. Glob. Trade Cust. J. 20 (1), 3–10. doi:10.54648/gtcj2025002
Le, L. T., and Xuan-Thi-Thu, T. (2024). Discovering supply chain operation towards sustainability using machine learning and DES techniques: a case study in Vietnam seafood. Marit. Bus. Rev. 9 (3), 243–262. doi:10.1108/MABR-10-2023-0074
Li, X., Abed, A. M., Shaban, M., Le, L. T., Zhou, X., Abdullaev, S., et al. (2024a). Artificial intelligence application for assessment/optimization of a cost-efficient energy system: double-flash geothermal scheme tailored combined heat/power plant. Energy 313, 133594. doi:10.1016/j.energy.2024.133594
Li, X., Zhao, B., Guo, Y., Jia, X., and Peng, X. (2024b). Piston rod fracture in natural gas process compressors for underground gas storage: a comprehensive case study. Eng. Fail. Anal. 160, 108152. doi:10.1016/j.engfailanal.2024.108152
Liu, J., Zou, Y., Wang, W., Zhang, L., Liu, X., Ding, Q., et al. (2021). Analysis of dependencies among performance shaping factors in human reliability analysis based on a system dynamics approach. Reliab. Eng. Syst. Saf. 215, 107890. doi:10.1016/j.ress.2021.107890
Liu, X., Zhang, G., Wu, M., and Wu, Z. (2023). Study on the potential risks under a hazardous gas leakage accident: effects of source characteristics and ambient wind velocities. Environ. Sci. Pollut. Res. 30 (7), 17516–17531. doi:10.1007/s11356-022-23347-4
Liu, Z., Liu, Y., Wu, X. L., and Cai, B. (2018). Risk analysis of subsea blowout preventer by mapping GO models into Bayesian networks. J. Loss Prev. Process Ind. 52, 54–65. doi:10.1016/j.jlp.2018.01.014
Liu, Z., Ma, Q., Cai, B., Shi, X., Zheng, C., and Liu, Y. (2022). Risk coupling analysis of subsea blowout accidents based on dynamic Bayesian network and NK model. Reliab. Eng. Syst. Saf. 218, 108160. doi:10.1016/j.ress.2021.108160
Ma, X. (2021). “Integrity management and risk control of gas storage facilities,” in Handbook of underground gas storages and technology in China, 1115–1143. doi:10.1007/978-981-33-4734-2_47
Ma, X., Zheng, D., Shen, R., Wang, C., Luo, J., and Sun, J. (2018). Key technologies and practice for gas field storage facility construction of complex geological conditions in China. Pet. Explor. Dev. 45 (3), 507–520. doi:10.1016/S1876-3804(18)30056-9
Michanowicz, D. R., Buonocore, J. J., Rowland, S. T., Konschnik, K. E., Goho, S. A., and Bernstein, A. S. (2017). A national assessment of underground natural gas storage: identifying wells with designs likely vulnerable to a single-point-of-failure. Environ. Res. Lett. 12 (6), 064004. doi:10.1088/1748-9326/aa7030
Minh, N. V. T., Duy, L. B., Le, L. T., Huong, G. H., and Anh, S. T. (2024). Supply chain disruption for crude oil due to the effect of COVID-19 pandemic: evidence from Vietnam. Int. J. Logist. Syst. Manag. 48 (3), 326–349. doi:10.1504/IJLSM.2024.140061
OREDA (2002). Offshore reliability data handbook. OREDA, Nor. Available online at: http://www.dl.edi-info.ir/The%20Offshore%20and%20Onshore%20Reliability%20Data%20OREDA.pdf (Accessed November 15, 2024).
Ran, L., Yan, G., Goyal, V., Abdullaev, S., Alhomayani, F. M., Le, L. T., et al. (2024). Advancing solar thermal utilization by optimization of phase change material thermal storage systems: a hybrid approach of artificial neural network (ANN)/genetic algorithm (GA). Case Stud. Therm. Eng. 64, 105513. doi:10.1016/j.csite.2024.105513
Rathnayaka, S., Khan, F., and Amyotte, P. (2012). Accident modeling approach for safety assessment in an LNG processing facility. J. Loss Prev. Process Ind. 25 (2), 414–423. doi:10.1016/j.jlp.2011.09.006
Sarvestani, K., Ahmadi, O., and Alenjareghi, M. J. (2021). LPG storage tank accidents: initiating events, causes, scenarios, and consequences. J. Fail. Anal. Prev. 21 (4), 1305–1314. doi:10.1007/s11668-021-01174-y
Shen, K., He, Z., and Weng, W. (2022). Synergistic physical effects of domino accidents in the chemical industry. Qinghua Daxue Xuebao/Journal Tsinghua Univ. 62 (10), 1559–1570. doi:10.16511/j.cnki.qhdxxb.2022.21.021
Straub, D. (2009). Stochastic modeling of deterioration processes through dynamic Bayesian networks. J. Eng. Mech. 135 (10), 1089–1099. doi:10.1061/(asce)em.1943-7889.0000024
Syed, Z., and Lawryshyn, Y. (2020). Risk analysis of an underground gas storage facility using a physics-based system performance model and monte carlo simulation. Reliab. Eng. Syst. Saf. 199, 106792. doi:10.1016/j.ress.2020.106792
Ta, A. S., Le, L. T., and Bui-Duy, L. (2025). Advanced vehicle monitoring in smart port utilizing deep denoising real-time object detectors integrated multi-resolution attention-augmented CRNN. Ain Shams Eng. J. 16 (8), 103483. doi:10.1016/j.asej.2025.103483
Wang, B., Li, D., Xu, B., Zhang, Y., Zhang, F., Wang, Q., et al. (2022). Probabilistic-based geomechanical assessment of maximum operating pressure for an underground gas storage reservoir, NW China. Geomech. Energy Environ. 31, 100279. doi:10.1016/j.gete.2021.100279
Wang, C., Liu, Y., Wang, D., Wang, G., Wang, D., and Yu, C. (2021). Reliability evaluation method based on dynamic fault diagnosis results: a case study of a seabed mud lifting system. Reliab. Eng. Syst. Saf. 214, 107763. doi:10.1016/j.ress.2021.107763
Wang, R., Kuru, E., Zhao, C., Liu, M., and Jin, Y. (2024). Assessment of wellbore integrity failure risk and hazardous zones in depleted reservoirs underground gas storage during the operation processes. Environ. Sci. Pollut. Res. Int. 31 (2), 2079–2089. doi:10.1007/s11356-023-31297-8
Wang, Z., Lyu, X., Shi, W., Feng, X. T., Qiao, L., and Kong, R. (2024). Assessing the effect of intermediate principal geostress on the caprock integrity for underground gas storage. Gas. Sci. Eng. 123, 205252. doi:10.1016/j.jgsce.2024.205252
Weber, P., and Jouffe, L. (2006). Complex system reliability modelling with dynamic object oriented bayesian networks (DOOBN). Reliab. Eng. Syst. Saf. 91 (2), 149–162. doi:10.1016/j.ress.2005.03.006
Xu, Q., Liu, H., Song, Z., Dong, S., Zhang, L., and Zhang, X. (2023). Dynamic risk assessment for underground gas storage facilities based on Bayesian network. J. Loss Prev. Process Ind. 82, 104961. doi:10.1016/j.jlp.2022.104961
Xue, Y., Liu, J., Liang, X., Li, X., Wang, S., Ma, Z., et al. (2023). Influence mechanism of brine-gas two-phase flow on sealing property of anisotropic caprock for hydrogen and carbon energy underground storage. Int. J. Hydrogen Energy 48 (30), 11287–11302. doi:10.1016/j.ijhydene.2022.05.173
Yan, M., Wang, W., Tian, S., Yang, J., Liu, J., and Jiang, Z. (2024). Hydrogen leakage distribution and migration analysis under multiple factors in underground cross-river tunnel. Tunn. Undergr. Sp. Technol. 152, 105947. doi:10.1016/j.tust.2024.105947
Yan, Z., Wang, Z., Wu, F., and Lyu, C. (2022). Stability analysis of pingdingshan pear-shaped multi-mudstone interbedded salt cavern gas storage. J. Energy Storage 56, 105963. doi:10.1016/j.est.2022.105963
Yang, K., Li, W., Dai, X., Guo, Y., and Pang, L. (2024). Effect of hydrogen ratio on leakage and explosion characteristics of hydrogen-blended natural gas in utility tunnels. Int. J. Hydrogen Energy 64 (25), 132–147. doi:10.1016/j.ijhydene.2024.03.247
Yang, Y., Yang, S., Li, Z., Fang, Q., Wu, J., Cai, J., et al. (2020). Analysis of hazard area of dispersion caused by leakage from underground gas-storage caverns in salt rock. Adv. Civ. Eng. 2020. doi:10.1155/2020/8876646
Zang, T., Tong, X., Li, C., Gong, Y., Su, R., and Zhou, B. (2025). Research and prospect of defense for integrated energy cyber–physical systems against deliberate attacks. Energies 18 (6), 1479. doi:10.3390/en18061479
Zarei, E., Khan, F., and Abbassi, R. (2021). Importance of human reliability in process operation: a critical analysis. Reliab. Eng. Syst. Saf. 211, 107607. doi:10.1016/j.ress.2021.107607
Zerouali, B., Sahraoui, Y., Nahal, M., and Chateauneuf, A. (2024). Reliability-based maintenance optimization of long-distance oil and gas transmission pipeline networks. Reliab. Eng. Syst. Saf. 249, 110236. doi:10.1016/j.ress.2024.110236
Zhang, G., and Wang, E. (2023). Risk identification for coal and gas outburst in underground coal mines: a critical review and future directions. Gas. Sci. Eng. 118, 205106. doi:10.1016/j.jgsce.2023.205106
Zhang, G., Wang, E., Liu, X., and Li, Z. (2024). Research on risk assessment of coal and gas outburst during continuous excavation cycle of coal mine with dynamic probabilistic inference. Process Saf. Environ. Prot. 190 (B), 405–419. doi:10.1016/j.psep.2024.08.054
Zhang, S., Yan, Y., Sheng, Z., and Yan, X. (2021a). Uncertainty failure risk quantitative assessments for underground gas storage near-wellbore area. J. Energy Storage 36, 102393. doi:10.1016/j.est.2021.102393
Zhang, S., Yan, Y., Shi, L., Li, L., Zhao, L., Wang, R., et al. (2021b). A semi-empirical model for underground gas storage injection-production string time series remaining useful life analysis in process safety operation. Process Saf. Environ. Prot. 154, 1–17. doi:10.1016/j.psep.2021.08.003
Zhang, Y., Oldenburg, C. M., Zhou, Q., Pan, L., Freifeld, B. M., Jeanne, P., et al. (2022). Advanced monitoring and simulation for underground gas storage risk management. J. Pet. Sci. Eng. 208, 109763. doi:10.1016/j.petrol.2021.109763
Zhang, Z., Zhang, L., Fu, M., Ozevin, D., and Yuan, H. (2022). Study on leak localization for buried gas pipelines based on an acoustic method. Tunn. Undergr. Sp. Technol. 120, 104247. doi:10.1016/j.tust.2021.104247
Zhao, L., Yan, Y., Wang, P., and Yan, X. (2019). A risk analysis model for underground gas storage well integrity failure. J. Loss Prev. Process Ind. 62, 103951. doi:10.1016/j.jlp.2019.103951
Zheng, D., Xu, H., Wang, J., Sun, J., Zhao, K., Li, C., et al. (2017). Key evaluation techniques in the process of gas reservoir being converted into underground gas storage. Pet. Explor. Dev. 44 (5), 840–849. doi:10.1016/S1876-3804(17)30095-2
Zhong, H., Wang, Z., Zhang, Y., Suo, S., Hong, Y., Wang, L., et al. (2024). Gas storage in geological formations: a comparative review on carbon dioxide and hydrogen storage. Mater. Today sustain. 26, 100720. doi:10.1016/j.mtsust.2024.100720
Keywords: underground gas storage, leakage accident, N-K model, risk coupling, dynamic Bayesian network
Citation: Hu Y, Ding Z, Qiao L, Gu F and Yang M (2025) Risk coupling analysis of underground gas storage leakage accidents based on dynamic Bayesian network and N-K model. Front. Earth Sci. 13:1639790. doi: 10.3389/feart.2025.1639790
Received: 03 June 2025; Accepted: 10 July 2025;
Published: 22 July 2025.
Edited by:
Chong Xu, Ministry of Emergency Management, ChinaReviewed by:
Badjadi Mohammed Ali, Chengdu University of Technology, ChinaHuanhuan Wang, Hunan University of Science and Technology, China
Longlong He, Xi’an University of Technology, China
Yong Zhang, Xi’an University of Architecture and Technology, China
Copyright © 2025 Hu, Ding, Qiao, Gu and Yang. This is an open-access article distributed under the terms of the Creative Commons Attribution License (CC BY). The use, distribution or reproduction in other forums is permitted, provided the original author(s) and the copyright owner(s) are credited and that the original publication in this journal is cited, in accordance with accepted academic practice. No use, distribution or reproduction is permitted which does not comply with these terms.
*Correspondence: Yao Hu, aHkxODMyODA3MjUyM0BjYWZ1Yy5lZHUuY24=