Abstract
The matric suction of three types of dam impervious soils (HZ, ZJ, and WY) was measured during drying-wetting cycles under various compaction degrees using the filter paper method. The soil-water characteristic curves (SWCCs) were fitted using the van Genuchten (VG) model and the Fredlund-Xing (FX) model. Based on the fitting parameters, the water retention characteristics of the impervious soils were evaluated. Combined with particle size distribution curves and scanning electron microscopy (SEM) images, the influence mechanism of compaction degree on water retention was investigated from a microstructural perspective. The results show that: (1) The filter paper method revealed distinct suction–water content behaviors across soil types and compaction levels. The HZ soil showed the lowest air-entry value (AEV) and highest sensitivity to compaction, while WY soil maintained strong water retention and minimal variation in SWCC, indicating structural stability. (2) The VG model consistently outperformed the FX model in fitting the SWCCs of all three soils, with all R2 values exceeding 0.95. VG provided more stable parameter trends (a, n) and better captured the influence of compaction on hysteresis, especially for fine-grained soils. (3) SEM images and particle size distribution analyses confirmed that WY and ZJ soils possess higher clay content, denser particle arrangements, and smaller pores, contributing to stronger water retention. In contrast, the sandier HZ soil exhibited coarser pores, more significant structural rearrangement under compaction, and an increased presence of ink-bottle pores, intensifying the hysteresis effect. This study reveals the microstructural mechanism through which particle size composition and compaction degree jointly regulate the water retention properties of dam impervious soils, providing a basis for unsaturated seepage analysis and seepage control design in earth-rock dams.
1 Introduction
With the intensification of global climate change, frequent fluctuations in reservoir water levels pose severe challenges to the seepage stability of earth-rock dams (Guellouz et al., 1995; Wu et al., 2017). Similar soil-structure interaction issues have been reported in underground stability problems (Alsabhan et al., 2021). As the core structure of hydraulic engineering, the compaction degree gradient of impervious soils in dam construction can significantly influence the hydro-mechanical coupling behavior of unsaturated soils by altering pore structure and suction hysteresis effects (Anandarajah and Amarasinghe, 2012; Sheng and Zhou, 2011; Song and Choi, 2012). Traditional studies have mostly focused on homogeneous impervious soils or single compaction conditions. However, the heterogeneous nature of actual dam impervious soils—such as differences in particle size distribution between sandy and clayey soils—has not yet been systematically investigated. Although it is well established that fluctuations in reservoir water levels can cause seepage field redistribution (e.g., phreatic line lag and abrupt changes in seepage force) and reduced stability, the dynamic response mechanisms of suction under compaction gradients in dam impervious soils remain insufficiently explored.
In the field of unsaturated soil mechanics, the dual stress state variable theory proposed by Fredlund and Morgenstern (1977) laid the foundation for understanding hydro-mechanical coupling behavior. Based on this theory, researchers have quantified pore water pressure and permeability characteristics of unsaturated soils using the soil-water characteristic curves (SWCC) and permeability coefficient functions (Vanapalli et al., 1996). For instance, the VG model (1980) mathematically describes the nonlinear relationship between saturation and matric suction, while the Brooks (1965) further reveals the influence of pore structure on the shape of the SWCC. These studies have demonstrated that changes in pore structure significantly affect suction hysteresis, thereby altering the hydraulic conductivity of soils (Topp and Miller, 1966). However, most existing studies have focused on static analyses under a single compaction condition, without fully capturing how the soil–water characteristic curve and pore structure change as the degree of compaction varies in real-world situations (Lu and Likos, 2006).
Compaction degree, as a key factor influencing the behavior of unsaturated soils, has been extensively confirmed through experiments to be closely related to void ratio, particle arrangement, and degree of saturation (Delage and Lefebvre, 1984; Ekraminia et al., 2023; Nikbakht et al., 2022). Tinjum et al. (1997) analyzed the SWCCs of clay under different compaction degrees and found that higher compaction results in a denser pore structure, leading to a reduced hysteresis loop area and increased air-entry value (AEV) in the SWCC. Similarly, the study by Berisso et al. (2013) showed that increasing compaction significantly decreases the soil’s permeability coefficient, and enhances permeability anisotropy with greater compaction effort. Raghuram et al. (2024) investigated the effects of sample size and dry density on the properties of expansive soils, with a particular focus on soil-water characteristic curves (SWCC) and the stability of unsaturated finite slopes, further highlighting the decisive role of dry density in controlling matric suction and slope stability. However, it is worth noting that most existing studies have focused on one fixed compaction level and only described the soil–water relationship at that state, without quantitatively exploring how the pore structure changes and how suction gradually decreases when soil becomes more compacted (Zhou et al., 2012).
In practical engineering applications, the impervious soils used in earth-rock dam construction often exhibit significant heterogeneity, such as differences in particle size distribution between sandy and clayey soils, and compaction degree gradients caused by layered filling. Although some studies have attempted to incorporate heterogeneity through numerical simulations (Cui et al., 2008), these approaches often rely on simplified layered homogeneity assumptions and fail to fully capture the nonlinear variations in permeability characteristics under the coupled influence of particle gradation and compaction degree. For example, when seepage control materials with a wide range of particle sizes are unevenly distributed, the resulting pore structure heterogeneity can cause large variations in the permeability coefficient, sometimes differing by several orders of magnitude (Ozgurel and Vipulanandan, 2005). While notable advancements have been made in incorporating spatial heterogeneity into stability analysis models (Fenton and Griffiths, 2008; Kumar et al., 2020), many practical applications still adopt homogenized parameters due to limited data availability and computational efficiency. Such simplifications, though useful, may introduce discrepancies between modeled and actual seepage fields, especially in strongly layered or spatially variable soils. Therefore, conducting unsaturated hydro-mechanical coupling studies that consider compaction degree gradients and particle gradation has become a key direction for overcoming theoretical limitations (Lu and Likos, 2004).
This study aims to systematically reveal the suction response mechanism and model applicability of dam core impervious soils under the combined effects of compaction degree gradients and particle size distribution, addressing the current lack of attention to the interaction mechanisms of such composite control variables. Unlike earlier studies that primarily focused on the influence of compaction on SWCC, the novelty of this work lies in three aspects: (1) the comparative investigation of three typical dam construction soils (HZ, WY, ZJ), which highlights the differentiated suction responses under varying compaction conditions; (2) the integration of microstructural observations (SEM) with SWCC test results, which interprets how compaction degree regulates suction paths and hysteresis behavior through pore structure evolution; and (3) the quantitative analysis of compaction gradient effects via model fitting, comparing the applicability of the VG and FX models to identify the most suitable model for each soil type.
The filter paper method was used to determine the SWCCs of three typical dam construction materials at different compaction levels, obtaining matric suction–water content relationships under dynamic drying and wetting paths. The measured SWCC data were fitted using two commonly applied models, VG and FX, to derive the functional forms of the curves. By comparing the fitting performance of these models, the most suitable model for each soil type was identified. Finally, microstructural observations and particle size analyses were incorporated to interpret, from a structural evolution perspective, how compaction degree regulates suction path differences and hysteresis behavior. The results provide theoretical support for SWCC model selection, hysteresis analysis, and seepage stability prediction in compacted heterogeneous soils, contributing to the safe design of earth-rock dams.
2 Materials and methods
2.1 Soil samples and basic properties
Three types of dam construction impervious soils were collected from Hangzhou, WuYi, and Zhuji in Zhejiang Province, China, and are denoted as HZ, WY, and ZJ, respectively. The mineral compositions of the three materials were determined using X-ray diffraction (XRD) analysis and are summarized in Table 1. The primary minerals in HZ soil are quartz, illite, kaolinite, and montmorillonite; WY soil mainly consists of quartz, kaolinite, and pyrite; while ZJ soil is composed primarily of quartz, illite, kaolinite, albite, and microcline. Table 2 presents the basic physical properties of the samples.
TABLE 1
| Soil type | Mineral relative content (%) | ||||||
|---|---|---|---|---|---|---|---|
| Quartz | Kaolinite | Illite | Montmorillonite | Albite | Microcline | Pyrite | |
| HZ | 25.00 | 49.69 | 22.82 | 2.40 | – | – | – |
| WY | 20.29 | 78.63 | – | – | – | – | 1.08 |
| ZJ | 21.74 | 18.01 | 31.50 | – | 15.42 | 13.32 | – |
Mineral content.
TABLE 2
| Liquid limit (%) | Plastic limit (%) | Plasticity index | Specific gravity | Maximum dry density (g/cm3) | Optimum moisture content (%) | |
|---|---|---|---|---|---|---|
| HZ | 40.8 | 25.5 | 15.3 | 2.7 | 1.62 | 23.0 |
| WY | 53.8 | 30.8 | 23.0 | 2.77 | 1.59 | 25.0 |
| ZJ | 33.1 | 21.1 | 12.0 | 2.74 | 1.82 | 16.0 |
Physical indexes.
2.2 Experimental methods
The matric suction of the soil samples was measured using the filter paper method, which was selected for its wide applicable suction range and ease of implementation across all compaction levels. Whatman No. 42 filter paper was used in the test. Both the test filter paper and the protective filter paper (slightly larger than the test filter paper) were dried in an oven at 105 °C for more than 2 h. The containers used for drying were thoroughly cleaned with distilled water, dried, and covered with ordinary filter paper during drying to prevent contamination. After drying, the test filter papers were sealed in airtight bags and stored in a desiccator for later use (Lucian, 2012).
The soil samples were first oven-dried at 105 °C for 24 h and then passed through a 2 mm sieve. Distilled water was added to the sieved soils based on the optimum moisture content, and the mixture was stirred thoroughly. The moist soil was then sealed and cured in a humidity chamber for 3 days to ensure uniform moisture distribution. Compacted specimens with degrees of compaction of 100%, 98%, 95%, and 92% were prepared using a ring cutter with a diameter of 61.8 mm and a height of 20 mm. The prepared compacted specimens were saturated using the vacuum saturation method. The mass of the saturated samples was measured to calculate the saturated water content. Based on the saturated water content, eight target moisture contents were designed for suction measurement. The saturated volumetric water contents of the three soils under different compaction levels are shown in Table 3. As the degree of compaction decreases, the saturated volumetric water content does not exhibit a strictly monotonic increasing trend. For instance, in HZ soil, the value slightly increases from 43.16% at 100% compaction to 45.77% at 95%, then drops to 45.44% at 92%. This non-monotonic behavior may be attributed to microstructural rearrangements during compaction. At intermediate compaction levels, soil particles may form a more open but well-connected pore structure that retains more water under saturated conditions. Similar findings were reported by (Al-Mahbashi et al., 2020), who noted that moderate compaction energy could lead to enhanced water retention due to pore redistribution and structural transition.
TABLE 3
| Degree of compaction | Saturated volume moisture content (%) | |||
|---|---|---|---|---|
| 100.0 | 98.0 | 95.0 | 92.0 | |
| HZ | 43.16 | 44.64 | 45.77 | 45.44 |
| WY | 51.57 | 50.81 | 52.96 | 53.07 |
| ZJ | 45.83 | 45.59 | 44.83 | 45.56 |
Saturated volumetric water content of the three soil samples under different compaction conditions.
The soil samples were naturally air-dried. They were placed on trays lined with clean waterproof membranes in a shaded, ventilated environment. The mass of the soil samples was tested at regular intervals, and the moisture content was calculated. Once the target moisture content was reached, the samples were completely wrapped in cling film and placed in a moisture chamber filled with distilled water for 3 days to ensure uniform moisture distribution and avoid uneven drying (e.g., wet interior and dry exterior). After the dewatering process, one soil sample was taken, and the cutting edge of the ring knife was placed face-up. A piece of protective filter paper was placed on the sample, followed by a test filter paper. The mass of the test filter paper was measured using an analytical balance with a precision of 0.0001 g. After testing, the test filter paper was quickly placed on top of the protective filter paper. Another sample, with the same moisture content, was placed face-down on top of the first sample, and the two cutting edges were aligned. The contact area between the two cutting edges was sealed with insulating electrical tape to form a matric suction test sample. The test sample was tightly wrapped in cling film, then in aluminum foil, and finally sealed with paraffin wax. The sample was placed in a temperature and humidity-controlled chamber at 20 °C for 10 days. After the curing period, the test samples were disassembled. The test filter paper was quickly removed with tweezers and weighed. Additionally, the mass of the soil sample was recorded to calculate its moisture content, after which the soil sample was tightly wrapped again.
The droplet method was adopted for the wetting process. The soil samples, after completing the drying phase, were placed in an oven at 105 °C for 24 h to ensure complete dehydration. Once cooled, deionized water was gradually and uniformly added to the samples using a dropper, according to the designed water content increments. When the target water content was reached, each sample was tightly wrapped with plastic film and cured in a humidity chamber for 3 days to ensure uniform moisture distribution. After curing, the filter paper method was repeated following the same procedure as in the drying path, in order to obtain the relationship between matric suction and water content during the wetting process. The calibration curve of the filter paper was adopted from ASTM D5298-10, as given by Bicalho et al. (2007), and is expressed as Equation 1:
Where h represents the matric suction, and Wfp denotes the water content of the filter paper. Based on the experimental results, the matric suction corresponding to the water content gradient during the drying and wetting processes was calculated for the three soil types under different compaction conditions. The relationship between water content and matric suction was then plotted to obtain the SWCCs.
2.3 Fitting models
The Van Genuchten (VG) model and Fredlund and Xing (FX) model were employed to perform nonlinear fitting analyses of the SWCCs for the three soil types under different compaction conditions. In fact, to better describe the water retention behavior of unsaturated soils, numerous SWCC models have been proposed by researchers (Leong and Rahardjo, 1997; Matlan et al., 2016). However, the applicability of these models often depends on factors such as soil type and properties, making the selection of an appropriate model crucial for accurately describing the SWCC (Maaitah, 2012). Among these, the VG model and the FX model are widely used in SWCC fitting and analysis. These two models were selected in this study for the following reasons: (1) Both models are widely used and well-validated in engineering and research applications for different soil types; (2) The VG model performs well in the low-to medium-suction range and provides interpretable parameters related to air-entry value and pore-size distribution, while the FX model is capable of describing the full suction range by introducing a correction factor, making it suitable for analyzing drying–wetting hysteresis; (3) Compared to stepwise models such as Brooks–Corey, these models adopt continuous functions, which avoid instability in fitting fine-grained soils and facilitate correlation with microstructural characteristics; (4) Model parameters (e.g., a and n); can be directly associated with pore structure evolution, supporting the microstructural analysis in this study. Other models, such as Brooks–Corey, Kosugi, Gardner, and lognormal distribution models, were not considered because they require additional calibration and may not capture the continuous variation and hysteresis behavior of compacted fine-grained soils effectively.
The VG model, proposed by Van Genuchten (1980) based on the pore-size distribution function, is a method for parameter fitting of experimental data using the nonlinear least squares method, as shown in Equation 2.
Where is the residual volumetric water content, is the saturated volumetric water content, a is a fitting parameter related to the air-entry value, h is the matric suction, and n is a fitting parameter related to the pore-size distribution. The parameter m is defined as . The FX model (1994) (Equations 3 and 4) operates on similar fitting principles to the VG model. However, the FX model introduces a correction factor , which strictly ensures that the water content becomes zero when the matric suction reaches 106 kPa. Compared to the VG model, the FX model provides a more complete fitting range, is applicable to a wider variety of soil types, and generally produces more stable fitting results.
Where: a is a fitting parameter related to the air-entry value; n and m are fitting parameters associated with the pore-size distribution; is the matric suction corresponding to the residual volumetric water content.
3 Results and analysis
3.1 Characteristics and model fitting of the drying–wetting SWCCs
The SWCCs of the three types of dam impervious soils are shown in Figure 1. All samples exhibit a generally consistent trend in their SWCCs. When suction exceeds the AEV, air begins to invade the largest pores in the saturated samples. As matric suction continues to increase, progressively smaller pores lose water until the residual water content is reached. Beyond this point, further increases in suction cause little change in saturation. At the same suction, a higher SWCC indicates stronger water retention capacity. In this study, the overall water retention ranking of the three soils is: WY > ZJ > HZ. With increasing compaction degree, the water retention capacity of all three soils decreases, and the area enclosed by the hysteresis loop increases. A larger hysteresis loop implies greater irreversibility in moisture migration and higher complexity in the pore structure, which may result from an increase in ink-bottle pores and reduced pore connectivity. Analogous to flow resistance in porous and pipe systems (Haroon et al., 2017), pore geometry exerts strong influence on suction–water content response. Notably, the water retention capacity of HZ soil is more responsive to compaction, as reflected in the wider spread of its SWCCs under different compaction conditions. In contrast, the SWCCs of the other two soils remain more concentrated, indicating a less significant influence of compaction on their water retention behavior.
FIGURE 1

Measured SWCCs of the three types of dam impervious soils. (a) HZ. (b) WY. (c) ZJ.
The fitting results of the VG and FX models for each dam core seepage control material are shown in Figures 2–4, and the corresponding fitting parameters are listed in Table 4. There are certain differences in the fitting accuracy of the SWCCs. Overall, the VG model shows the best agreement between fitted and measured values across all soil layers, with significantly better fitting performance than the FX model, and R2 values all above 0.95. Notable differences are observed in the fitting parameters aa and nn between the VG and FX models. In the VG model, the parameter aa ranges from 0.01 to 0.08, and the shape parameter nn falls between 0.5 and 1.5. In contrast, the FX model yields a values between 0 and 40, and n values ranging from 1 to 1.4. Furthermore, in the low suction range, the VG model tends to predict lower SWCC values than the FX model, while in the high suction range, the VG model gives higher predictions than the FX model. The irregular parameter fluctuations in the FX model indicate that it is highly sensitive to data distribution in the low-suction range. This sensitivity, combined with the limited number of measurement points in that range, may amplify local fitting errors. Although the overall fitting accuracy of the FX model (as reflected by R2 values) remains within an acceptable range, it is clearly lower than that of the VG model. These results suggest that the FX model exhibits instability and lower robustness under compacted fine-grained soil conditions, making it unsuitable for detailed mechanistic interpretation. Therefore, the VG model is recommended as the preferred option for predicting SWCC behavior in engineering applications. Beyond classical fitting approaches, data-driven methods have also been employed in geotechnical diagnostics (Ahmad et al., 2025a), and could provide complementary pathways for capturing complex nonlinearities in SWCC behavior.
FIGURE 2

HZ soil measured data and fitted curves using VG model and FX model. (a) 100%. (b) 98%. (c) 95%. (d) 92%.
FIGURE 3

WY soil measured data and fitted curves using VG model and FX model. (a) 100%. (b) 98%. (c) 95%. (d) 92%.
FIGURE 4

ZJ soil measured data and fitted curves using VG model and FX model. (a) 100%. (b) 98%. (c) 95%. (d) 92%.
TABLE 4
| Specimens | Parameter | Model | Drying | Wetting | ||||||
|---|---|---|---|---|---|---|---|---|---|---|
| 100.0 | 98.0 | 95.0 | 92.0 | 100.0 | 98.0 | 95.0 | 92.0 | |||
| HZ | a | VG | 0.02585 | 0.02773 | 0.0326 | 0.03301 | 0.0368 | 0.0555 | 0.06833 | 0.08132 |
| FX | 3.9399 | 3.92174 | 5.14266 | 10.7103 | 4.1971 | 6.9204 | 10.0491 | 14.8221 | ||
| n | VG | 0.6048 | 0.6154 | 0.61056 | 0.58759 | 0.7563 | 0.7678 | 0.75133 | 0.72173 | |
| FX | 1.2447 | 1.22673 | 1.23123 | 1.22368 | 1.3090 | 1.3272 | 1.33006 | 1.30066 | ||
| R 2 | VG | 0.9819 | 0.976 | 0.96794 | 0.97116 | 0.9864 | 0.9709 | 0.9726 | 0.97728 | |
| FX | 0.8890 | 0.91214 | 0.90565 | 0.91347 | 0.9633 | 0.9488 | 0.94369 | 0.94821 | ||
| WY | a | VG | 0.0106 | 0.01087 | 0.01061 | 0.01277 | 0.0530 | 0.0531 | 0.06926 | 0.0741 |
| FX | 4.7191 | 0.28166 | 0.5125 | 1.87326 | 23.633 | 22.340 | 10.4863 | 23.1913 | ||
| n | VG | 0.17372 | 0.17892 | 0.17877 | 0.11954 | 0.6496 | 0.6394 | 0.56838 | 0.51396 | |
| FX | 1.07095 | 1.0229 | 1.04558 | 1.0439 | 1.1974 | 1.1398 | 1.34656 | 1.42863 | ||
| R 2 | VG | 0.96438 | 0.9815 | 0.96702 | 0.97982 | 0.9554 | 0.9714 | 0.9815 | 0.97926 | |
| FX | 0.89828 | 0.93055 | 0.91502 | 0.89271 | 0.9251 | 0.9635 | 0.93798 | 0.93475 | ||
| ZJ | a | VG | 0.02496 | 0.02675 | 0.02983 | 0.03056 | 0.0275 | 0.0433 | 0.05207 | 0.05698 |
| FX | 7.7352 | 11.56345 | 33.35673 | 41.26381 | 3.6394 | 8.4199 | 11.82228 | 15.48756 | ||
| n | VG | 0.124 | 0.13647 | 0.22273 | 0.25657 | 0.11368 | 0.1808 | 0.21032 | 0.3159 | |
| FX | 1.13809 | 1.1413 | 1.17741 | 1.17292 | 1.2137 | 1.2273 | 1.21848 | 1.2231 | ||
| R 2 | VG | 0.96375 | 0.98806 | 0.99581 | 0.99347 | 0.9723 | 0.9485 | 0.95516 | 0.95494 | |
| FX | 0.94461 | 0.91471 | 0.84285 | 0.8114 | 0.9636 | 0.9428 | 0.93319 | 0.91206 | ||
Comparison of fitting parameters between VG model and FX model.
Bold indicates better values.
The significant influence of compaction degree on ΔAEV (ΔAEV represents the difference in D-values between the two paths) shows an overall trend where ΔAEV decreases as compaction degree increases. Taking the HZ soil sample as an example (VG), when the compaction degree increases from 92% to 100%, the ΔAEV value decreases by approximately 35%. This phenomenon may be attributed to the reduction in the number of large pores and the increased proportion of medium and small pores in highly compacted soil. Such homogenization of pore distribution weakens the “bottleneck effect” of hysteresis, the differential behavior where large pores preferentially drain during desorption while small pores preferentially absorb water during adsorption.
Figure 5 illustrates the relationship between the fitted parameters a and n and the degree of compaction for the three types of dam impervious soils. Here, a is the inverse of the AEV and reflects the soil’s initial water absorption capacity. A higher a indicates a lower air-entry value, meaning that during the desaturation process, less suction is required for air to enter the soil pores and displace water. As shown in Figure 5a, for all soil types, a increases with decreasing compaction degree. This suggests that a lower degree of compaction results in a lower air-entry value and a higher proportion of macropores, making water easier to expel under low suction. Among the three soils, HZ soil has the lowest air-entry value, making it the easiest to lose water at low suction, while WY soil has the highest air-entry value, making it the most resistant to water loss under the same conditions.
FIGURE 5
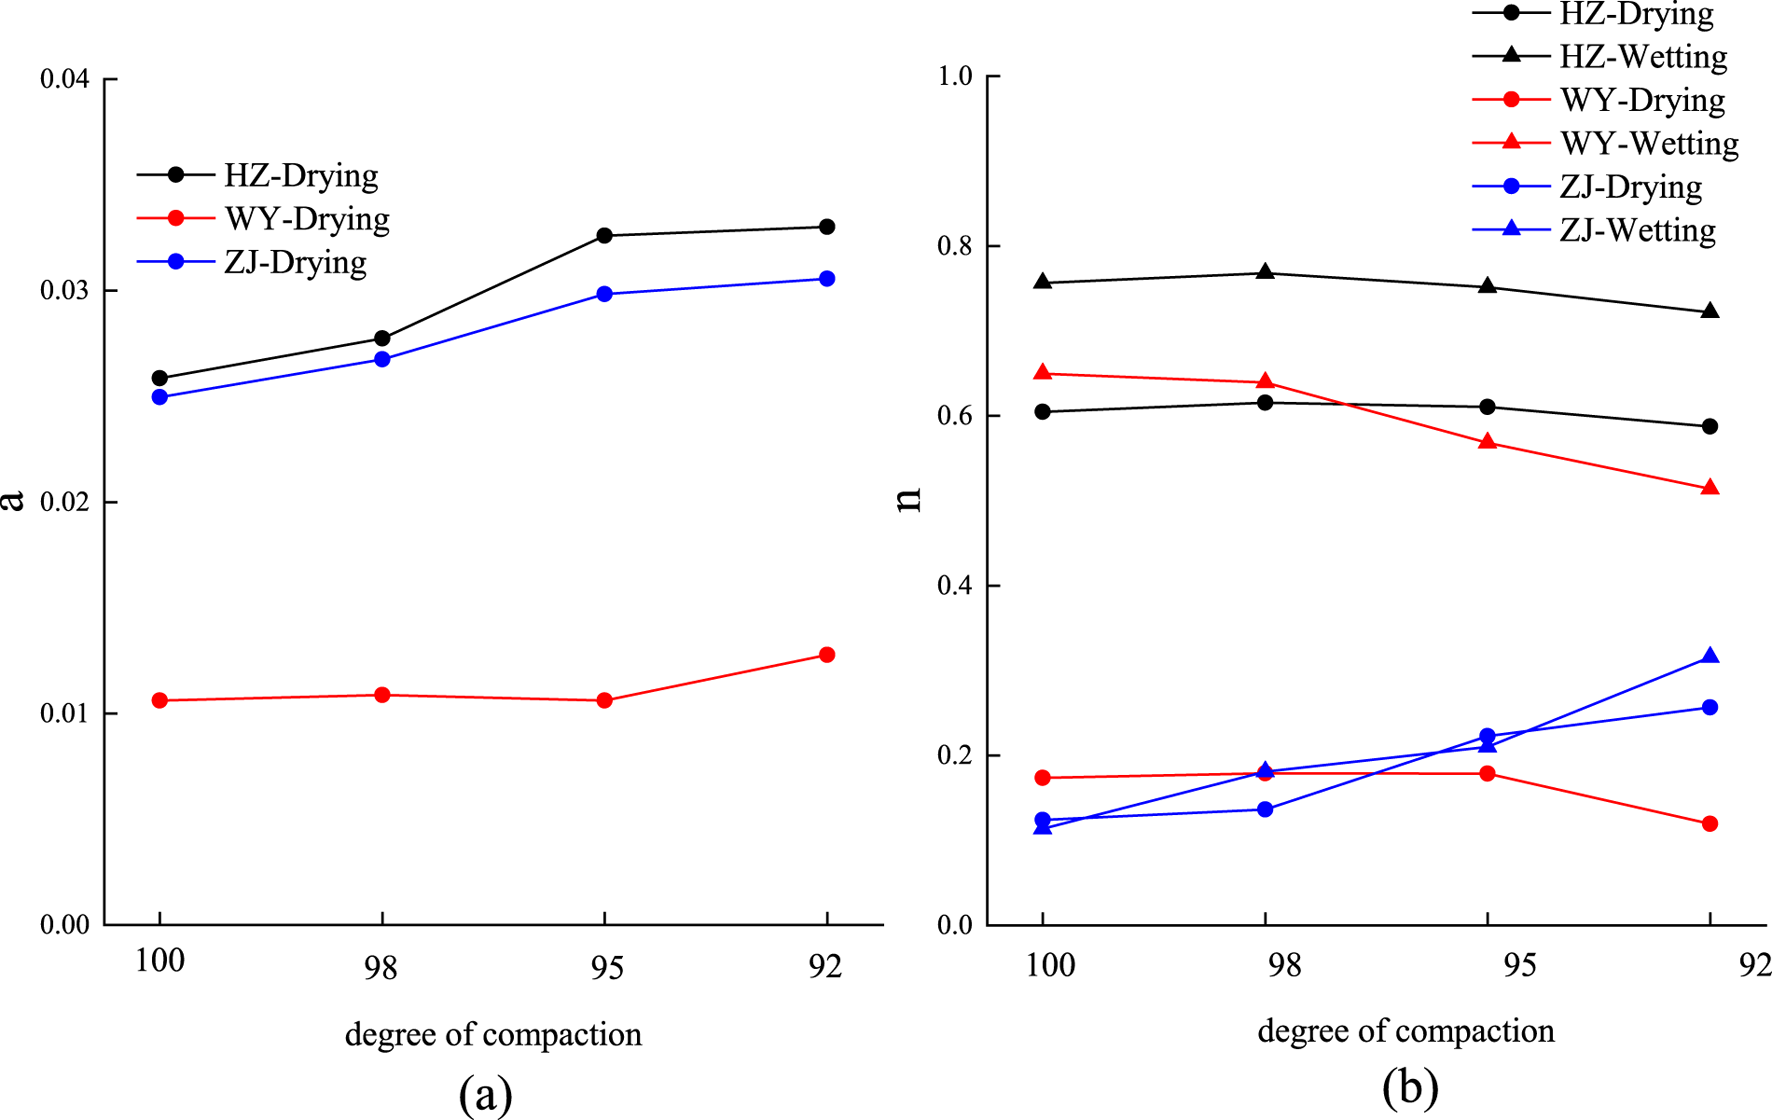
Relationship between VG model fitting parameters (a)a and (b)n and compaction degree.
Parameter n characterizes the uniformity of pore size distribution—higher values indicate more concentrated pore sizes and steeper changes in water content with suction. As seen in Figure 5b, for both HZ and WY soils, n decreases with decreasing compaction, indicating that pore size distribution becomes more heterogeneous at lower compaction levels. In contrast, the n values of ZJ soil are relatively similar during drying and wetting cycles, suggesting minimal differences in pore structure during drying and wetting, with relatively uniform and dispersed distribution. Notably, HZ and WY soils both show more uniform pore distribution during drying compared to wetting. However, WY soil exhibits the greatest difference in pore structure behavior between wetting and drying processes.
3.2 Influence mechanism of microstructure on SWCCs
The pore distribution and particle arrangement of soil are key factors that determine the shape of the SWCC and its water retention behavior. Figure 6 shows the particle size distribution curves of the three dam impervious soils. Additionally, SEM images of the soils at 95% and 85% compaction degrees were obtained using the high-performance Quanta 250 SEM instrument manufactured by FEI (Netherlands), with a magnification of 500×. Prior to testing, soil samples were treated using the vacuum freeze-drying method to preserve the original microstructure within the soil. It is recognized that SEM provides localized observations that cannot fully capture global pore network characteristics; therefore, microstructural interpretation in this study relies on SEM morphology combined with particle size distribution and model parameter analysis.
FIGURE 6

Particle size distribution curves of the three dam impervious soils.
The particle size distribution curves show that the dam impervious soils WY and ZJ have more fine and clay particles compared to HZ, with WY containing more clay particles than ZJ. The HZ soil sample has more sand particles and fewer fine and clay particles, leading to fewer contact points between large particles, which facilitates the formation of larger pores and results in a smaller AEV. Additionally, the fewer clay particles in HZ soil reduce the adsorption of water molecules, resulting in poorer water retention capacity. The fewer particle contact points also cause significant adjustments in pore structure when compaction changes, leading to a more noticeable fluctuation in water retention capacity with changes in compaction. The WY dam seepage control soil has generally smaller particle sizes, with more contact points between particles and smaller pore sizes. As a result, its AEV is much higher than the other two soils. Due to the limited space for structural rearrangement during compaction adjustments, its water retention characteristics are less sensitive to changes in compaction. The ZJ dam seepage control soil’s air entry value and water retention characteristics fall between those of WY and HZ.
Figure 7 shows the SEM images of the three soil types (WY, ZJ, HZ) at 95% and 85% compaction, the particles stack together to form relatively large pores, which causes the moisture to be easily drained at low suction. During the initial stage of the dehumidification process, all pores (large, medium, and small) are filled with water, and the air content is zero. The water exists in a free liquid form, with flow primarily driven by gravitational potential (such as drainage or seepage). The water in large pores has low viscosity resistance, and under the action of gravity, it drains first. Due to the larger particle size, there are fewer contact points between particles, so the compaction effect is significant. At 95% compaction, both pore number and volume are markedly reduced compared to 85%, with greater decreases in pore depth and width than in the other two soils, indicating a denser structure. Therefore, its water retention capacity responds more significantly to compaction changes, which is well verified in Figure 2. The significant compaction effect causes noticeable changes in the pore structure, and as compaction increases, “narrow-neck wide-chamber” ink-bottle-shaped and closed pores increase in number. The pore size distribution changes, exacerbating the hysteresis effect between the dehumidification and humidification paths. During the humidification process, water enters the wide chamber through the narrow entrance, overcoming the low capillary resistance at the entrance, while in the dehumidification process, the water inside the wide chamber needs to be discharged through the same narrow exit, where a higher capillary barrier is formed, requiring greater suction to drain. Furthermore, the increase in independent bubbles occupies the pores, making it harder for the water in the humidification process to break through the air-water interface and be expelled.
FIGURE 7

SEM images of the three soil types (WY, ZJ, HZ) at 95% and 85% compaction. (a)HZ 95%. (b)WY 95%. (c) ZJ 95%. (d)HZ 85%. (e)WY 85%. (e)ZJ 85%.
The microscopic structure of WY dam seepage control soil is clearly the densest among the three. The maximum pore size is much smaller than that of the other two soils, which is why the air-entry value of WY is much higher than that of the other dam impervious soils. With more contact points between particles, the compaction effect caused by the compaction process is weakened. From 85% to 95% compaction, the change in the number, area, and size of pores is minimal, which explains why the soil-water characteristic curve of WY dam seepage control soil is less sensitive to compaction changes, and the rate of increase in air-entry value with compaction is slow. The pores formed by the small clay particles in dam impervious soils are very tiny, and since capillary negative pressure (suction) is inversely proportional to pore radius, the matrix suction rises significantly, giving it the best water retention capacity. These findings align with recent studies on soil thermal behavior under energy infrastructure, where pore-scale features controlled heat–moisture transport dynamics (Ahmad et al., 2021; Ahmad et al., 2025b).
4 Conclusion
The filter paper method was used to measure the Soil Water Characteristic Curves (SWCCs) during drying-wetting cycles for three types of dam core impervious soil materials under varying compaction degrees. The obtained SWCCs were fitted using the VG model and the FX model. The water retention characteristics of the three materials were evaluated based on the fitted parameters. Furthermore, the differences in water retention behavior and compaction response among the three soil materials were analyzed from a microstructural perspective, based on particle size distribution curves and SEM images. The main findings are as follows.
1. The fitting accuracy of the VG and FX models varied across the SWCCs. Overall, the VG model showed better agreement with the measured values, outperforming the FX model significantly, with all R2 values exceeding 0.95.
2. The AEV of the HZ dam core material was the lowest, while that of the WY material was the highest. In terms of water retention capacity, the ranking from highest to lowest was: WY > ZJ > HZ. This is attributed to the high sand content and relatively low clay and silt content in HZ soil, leading to the formation of larger interparticle pores. As a result, water is easily lost under low suction, and the capillary forces provided by the small pores at high suction are also weak. In contrast, ZJ and WY soils contain a greater proportion of clay and silt particles and exhibit a denser structure, making them more resistant to water loss under low suction and exhibiting stronger water retention under high suction.
3. The influence of compaction degree on the water retention capacity of HZ soil was more pronounced than that of the other two soils. With increasing compaction, the AEV of HZ soil decreased significantly, and the area of the hysteresis loop gradually increased. In contrast, WY and ZJ soils showed relatively minor changes. This is because HZ soil has fewer particle contact points, making structural rearrangement more likely during compaction. On the other hand, WY and ZJ soils have more interparticle contacts and limited deformation space during compaction, rendering their water retention less sensitive to changes in compaction.
4. This study enhances the understanding of how compaction affects SWCCs and microstructure in dam impervious soils, offering practical guidance for field compaction control. The results also lay a foundation for future research on unsaturated soil behavior under varying compaction conditions.
Statements
Data availability statement
The datasets presented in this study can be found in online repositories. The names of the repository/repositories and accession number(s) can be found in the article/supplementary material.
Author contributions
XL: Project administration, Funding acquisition, Conceptualization, Writing – review and editing. KL: Investigation, Formal Analysis, Writing – original draft, Data curation. XJ: Investigation, Writing – review and editing. YC: Writing – review and editing. XY: Writing – original draft, Formal Analysis.
Funding
The author(s) declare that financial support was received for the research and/or publication of this article. This work was supported and funded by Zhejiang Provincial Natural Science Foundation of China under Grant No. LTGG23E090001.
Conflict of interest
The authors declare that the research was conducted in the absence of any commercial or financial relationships that could be construed as a potential conflict of interest.
Generative AI statement
The author(s) declare that no Generative AI was used in the creation of this manuscript.
Any alternative text (alt text) provided alongside figures in this article has been generated by Frontiers with the support of artificial intelligence and reasonable efforts have been made to ensure accuracy, including review by the authors wherever possible. If you identify any issues, please contact us.
Publisher’s note
All claims expressed in this article are solely those of the authors and do not necessarily represent those of their affiliated organizations, or those of the publisher, the editors and the reviewers. Any product that may be evaluated in this article, or claim that may be made by its manufacturer, is not guaranteed or endorsed by the publisher.
References
1
Ahmad S. Rizvi Z. H. Arp J. C. C. Wuttke F. Tirth V. Islam S. (2021). Evolution of temperature field around underground power cable for static and cyclic heating. Energies14, 8191. 10.3390/en14238191
2
Ahmad S. Rizvi Z. H. Wuttke F. (2025a). Unveiling soil thermal behavior under ultra-high voltage power cable operations. Sci. Rep.15, 7315. 10.1038/s41598-025-91831-1
3
Ahmad S. Ahmad S. Akhtar S. Ahmad F. Ansari M. A. (2025b). Data-driven assessment of corrosion in reinforced concrete structures embedded in clay dominated soils. Sci. Rep.15, 22744. 10.1038/s41598-025-08526-w
4
Al-Mahbashi A. M. Al-Shamrani M. A. Moghal A. A. B. (2020). Soil–water characteristic curve and one-dimensional deformation characteristics of fiber-reinforced lime-blended expansive soil. J. Mater Civ. Eng.32, 04020125. 10.1061/(ASCE)MT.1943-5533.0003204
5
Alsabhan A. H. Sadique M. R. Ahmad S. Alam S. Binyahya A. S. (2021). The effect of opening shapes on the stability of underground tunnels: a finite element analysis. GEOMATE J.21, 19–27. 10.21660/2021.87.j2267
6
Anandarajah A. Amarasinghe P. M. (2012). Microstructural investigation of soil suction and hysteresis of fine-grained soils. J. Geotechnical Geoenvironmental Eng.138, 38–46. 10.1061/(ASCE)GT.1943-5606.0000555
7
Berisso F. E. Schjønning P. Keller T. Lamandé M. Simojoki A. Iversen B. V. et al (2013). Gas transport and subsoil pore characteristics: anisotropy and long-term effects of compaction. Geoderma195, 184–191.
8
Bicalho K. V. Correia A. G. Ferreira S. R. Fleureau J.-M. Marinho F. A. (2007). Filter paper method of soil suction measurement.
9
Brooks R. H. (1965). Hydraulic properties of porous media. Fort Collins, CO: Colorado State University.
10
Cui Y.-J. Tang A.-M. Loiseau C. Delage P. (2008). Determining the unsaturated hydraulic conductivity of a compacted sand–bentonite mixture under constant-volume and free-swell conditions. Phys. Chem. Earth, Parts A/B/C33, S462–S471. 10.1016/j.pce.2008.10.017
11
Delage P. Lefebvre G. (1984). Study of the structure of a sensitive champlain clay and of its evolution during consolidation. Can. Geotech. J.21, 21–35. 10.1139/t84-003
12
Ekraminia S. Hajialilue Bonab M. Ghassemi S. Derakhshani R. (2023). Experimental study on seismic response of underground tunnel–soil–piled structure interaction using shaking table in loose sand. Buildings13, 2482. 10.3390/buildings13102482
13
Fenton G. A. Griffiths D. V. (2008). Risk assessment in geotechnical engineering. New York: John Wiley and Sons. Vol. 461.
14
Fredlund D. G. Morgenstern N. R. (1977). Stress state variables for unsaturated soils. J. Geotech. Engrg Div.103, 447–466. 10.1061/AJGEB6.0000423
15
Guellouz L. Bonelli S. Debordes O. (1995). “Hydraulic-mechanical coupling in unsaturated soils, application to loam dams,” in 2nd National Colloquium on Structural Calculation, Giens, May16–19, 1995.France: Hermes.
16
Haroon A. Ahmad S. Hussain A. (2017). CFD prediction of loss coefficient in straight pipes. In: GargV.SinghV. P.RajV., editors. Development of water resources in India. Cham: Springer International Publishing. p. 477–485. 10.1007/978-3-319-55125-8_41
17
Kumar R. Kasama K. Takahashi A. (2020). Reliability assessment of the physical modeling of liquefaction-induced effects on shallow foundations considering nonuniformity in the centrifuge model. Comput. Geotechnics122, 103558. 10.1016/j.compgeo.2020.103558
18
Leong E. C. Rahardjo H. (1997). Review of soil-water characteristic curve equations. J. Geotechnical Geoenvironmental Eng.123, 1106–1117. 10.1061/(asce)1090-0241(1997)123:12(1106)
19
Lu N. Likos W. J. (2004). Unsaturated soil mechanics. Hoboken, USA: John Wiley&Sons. Inc.
20
Lu N. Likos W. J. (2006). Suction stress characteristic curve for unsaturated soil. J. Geotech. Geoenviron Eng.132, 131–142. 10.1061/(ASCE)1090-0241(2006)132:2(131)
21
Lucian C. (2012). Soil-suction measurements using the filter paper method to evaluate swelling potential. Int. J. Sci. Eng. Technol.1, 49–54.
22
Maaitah O. (2012). Soil-water characteristic curve model-silty sand soil. Jordan J. Civ. Eng.6, 54–67.
23
Matlan S. J. Taha M. R. Mukhlisin M. (2016). Assessment of model consistency for determination of soil–water characteristic curves. Arab. J. Sci. Eng.41, 1233–1240. 10.1007/s13369-015-1888-2
24
Nikbakht M. Sarand F. B. Esmatkhah Irani A. Hajialilue Bonab M. Azarafza M. Derakhshani R. (2022). An experimental study for swelling effect on repairing of cracks in fine-grained clayey soils. Appl. Sci.12, 8596. 10.3390/app12178596
25
Ozgurel H. G. Vipulanandan C. (2005). Effect of grain size and distribution on permeability and mechanical behavior of acrylamide grouted sand. J. Geotech. Geoenviron Eng.131, 1457–1465. 10.1061/(asce)1090-0241(2005)131:12(1457)
26
Raghuram A. S. S. Negi P. S. Basha B. M. Moghal A. A. B. (2024). Effect of sample size, dry unit weight, and hysteresis of expansive soil on SWCC and finite slope stability. Int J Geosynth Ground Eng10, 18. 10.1007/s40891-024-00531-9
27
Sheng D. Zhou A.-N. (2011). Coupling hydraulic with mechanical models for unsaturated soils. Can. Geotech. J.48, 826–840. 10.1139/t10-109
28
Song Y.-S. Choi J.-S. (2012). Hysteresis of the suction stress in unsaturated weathered mudstone soils. J. Korean Geotechnical Soc.28, 55–66. 10.7843/kgs.2012.28.3.55
29
Tinjum J. M. Benson C. H. Blotz L. R. (1997). Soil-water characteristic curves for compacted clays. J. Geotech. Geoenviron Eng.123, 1060–1069. 10.1061/(asce)1090-0241(1997)123:11(1060)
30
Topp G. C. Miller E. E. (1966). Hysteretic moisture characteristics and hydraulic conductivities for glass‐bead media. Soil Sci. Soc Amer J30, 156–162. 10.2136/sssaj1966.03615995003000020008x
31
Van Genuchten M. T. (1980). A closed‐Form equation for predicting the hydraulic conductivity of unsaturated soils. Soil Sci. Soc Amer J44, 892–898. 10.2136/sssaj1980.03615995004400050002x
32
Vanapalli S. K. Fredlund D. G. Pufahl D. E. Clifton A. W. (1996). Model for the prediction of shear strength with respect to soil suction. Can. Geotech. J.33, 379–392. 10.1139/t96-060
33
Wu L. Z. Xu Q. Zhu J. D. (2017). Incorporating hydro-mechanical coupling in an analysis of the effects of rainfall patterns on unsaturated soil slope stability. Arab. J. Geosci.10, 386. 10.1007/s12517-017-3147-1
34
Zhou A.-N. Sheng D. Sloan S. W. Gens A. (2012). Interpretation of unsaturated soil behaviour in the stress – saturation space, I: volume change and water retention behaviour. Comput. Geotechnics43, 178–187. 10.1016/j.compgeo.2012.04.010
Summary
Keywords
SWCC, matric suction, VG model, compaction degree, hysteresis, microstructure
Citation
Li X, Li K, Jiao X, Chi Y and Yue X (2025) Effect of compaction degree on the soil-water characteristic curve of dam impervious soil: model comparison and microstructural analysis. Front. Earth Sci. 13:1640718. doi: 10.3389/feart.2025.1640718
Received
04 June 2025
Accepted
11 September 2025
Published
30 September 2025
Volume
13 - 2025
Edited by
Fanyu Zhang, Lanzhou University, China
Reviewed by
Zarghaam Rizvi, GeoAnalysis Engineering GmbH, Germany
Arif Ali Baig Moghal, National Institute of Technology Warangal, India
Updates
Copyright
© 2025 Li, Li, Jiao, Chi and Yue.
This is an open-access article distributed under the terms of the Creative Commons Attribution License (CC BY). The use, distribution or reproduction in other forums is permitted, provided the original author(s) and the copyright owner(s) are credited and that the original publication in this journal is cited, in accordance with accepted academic practice. No use, distribution or reproduction is permitted which does not comply with these terms.
*Correspondence: Xuemei Li, lixm@zjwater.gov.cn; Ke Li, 853915275@qq.com
Disclaimer
All claims expressed in this article are solely those of the authors and do not necessarily represent those of their affiliated organizations, or those of the publisher, the editors and the reviewers. Any product that may be evaluated in this article or claim that may be made by its manufacturer is not guaranteed or endorsed by the publisher.