 Zhiming Hu1,2
 Yonghong Fu
 Yuqiang Jiang
- 1National Energy Shale Gas Research (Experiment) Center, Beijing, China
- 2Unconventional Oil and Gas Research Institute, PetroChina Research Institute of Petroleum Exploration & Development, Beijing, China
- 3School of Geosciences and Technology, Southwest Petroleum University, Chengdu, Sichuan, China
- 4Sichuan Shale Gas Exploration and Development Company Limited, Chengdu, China
Micro-pores and micro-fractures constitute the most vital reservoir spaces and seepage pathways for shale gas. Conducting an in-depth study of pore-fracture combination types within shale gas reservoirs is beneficial for understanding shale gas enrichment and exploitation. In this study, we conducted a joint experiment involving MICP and WM impregnation on the main gas-producing layer of Longmaxi formation shale reservoir from five shale gas wells in the Luzhou area. This study achieved the visualization of MICP experiments, enabling a quantitative classification of pore volume and micro-fracture volume within the shale reservoir. A QP-F parameter system for classifying pore-fracture combination types has been established to evaluate pore-fracture connectivity, which are categorized into three types. The strongly connected pore-fracture type (SCPFT) shale gas reservoir in the study area has the characteristics of high porosity, high gas content and strong pore-fracture connectivity, which is the preferred target for shale gas exploration and development. Moderately connected pore-fracture type (MCPFT) and weakly connected pore-fracture type (WCPFT) shale gas reservoirs exhibit significant variations in porosity and gas content, coupled with weak pore-fracture connectivity. Despite some of these reservoirs possessing high porosity and gas content, they fail to achieve high production rates. Therefore, during the development of these two types of shale gas reservoirs, it is imperative to enhance and optimize fracturing techniques to create a more intricate fracture network structure, thereby enabling the release of shale gas trapped in poorly connected pores. This research holds significant theoretical and practical implications for identifying optimal shale gas development zones and improving gas recovery efficiency.
1 Introduction
Shale gas refers to natural gas that is formed through the hydrocarbon generation and evolution in shale, and is predominantly stored in the micro-fractures and pores of shale reservoirs in a free or adsorbed state, without significant migration (Jia et al., 2012; Zhang et al., 2008; Yang et al., 2025). After more than a decade of exploration and development, China has become a major global shale gas producer, with its share in the energy mix continuously increasing. In the future, it is poised to become one of the most reliable alternative energy sources (Zou et al., 2020; Zhao et al., 2020). The factors influencing production levels include geological and engineering factors, but geological factors such as the level of gas content or the degree of enrichment of shale gas are fundamental. Some scholars have recognized that shale gas can be redistributed to higher locations through relay transmission between pores and micro-fractures, resulting in high production from shale gas wells in higher locations, such as the Zhaotong, Ningxi, and Yuxi regions (Liang et al., 2021; Chen et al., 2021; Fu et al., 2021; Gao et al., 2024). Therefore, the coupled pore-fracture system has attracted the attention of academia and industry.
Shale gas reservoirs have extremely low porosity and permeability, with a large number of micro- and nano-pores developed (Curtis et al., 2012; Gou et al., 2023). This has attracted numerous scholars to analyze the microscopic pore development characteristics, pore size distribution, and pore connectivity of shale gas through experimental methods such as field emission scanning electron microscope (FE-SEM), focused ion beam-scanning electron microscope (FIB-SEM), low-pressure gas adsorption, nuclear magnetic resonance (NMR), asequence and sedimentary characteristics of Lower Silurind mercury injection capillary pressure (MICP) (Klaver et al., 2015; Clarkson et al., 2013; Guo Q. Y. et al., 2019; Hu et al., 2012; Fu et al., 2019; Gao and Hu, 2016). Therefore, numerous scholars have analyzed the impact of organic matter type, total organic carbon (TOC) content, mineral composition, diagenesis, and hydrocarbon generation evolution on the pore development of shale reservoirs using the above methods (Ma et al., 2020; Yang et al., 2020; Cui et al., 2024; Huang et al., 2023; Wang et al., 2025). It can be seen that the research on pore characteristics and development control factors of shale reservoir has become quite mature.
Foreign scholars have conducted early research on fractures. Hill and Nelson (2000) believed that natural fracture systems are the main storage spaces for free gas in shale reservoirs, and that organic matter abundance is an important factor affecting fracture development. Curtis (2002) believed that for shale reservoirs with low matrix permeability, the degree of fracture development is an important controlling factor for gas production capacity. Domestic scholars have concluded through fracture research that different types of micro fractures can be formed in the process of hydrocarbon generation and diagenetic evolution, which provides a large amount of reservoir space for shale gas (Cui et al., 2024) and is conducive to shale reservoir fracturing and shale gas production (Zhou et al., 2020; Huang et al., 2023). However, in complex structural areas, due to excessive tectonic activity, excessive fracture development can lead to the dissipation of shale gas, resulting in smaller or disappearing pores, which has a detrimental effect on shale gas preservation (Liu et al., 2016; Shi and Chen, 2023). Overall, current fracture research mainly focuses on fracture genesis, classification, activity periods, development control factors, fracture distribution prediction (Wang et al., 2016; Wang et al., 2015; Yang et al., 2022; He et al., 2017).
In order to deeply analyze the influence of pore structure development on shale gas enrichment and exploitation, scholars pay more and more attention to the micro connectivity of shale reservoir (Sun et al., 2023; Yang et al., 2022). For example, the connectivity of shale reservoir pores is characterized by imbibition media with different wettability (Hu et al., 2012; Fu et al., 2019; Guo Q. Y. et al., 2019), and the characteristics and permeability of shale reservoir pores and fractures are jointly characterized using multiple methods to reveal the connectivity of shale reservoirs (Gao et al., 2024; Sun et al., 2023; Yang et al., 2022). Although these methods all focus on the connectivity of shale reservoirs, current research on shale pores and fractures remains fragmented, with studies typically examining these components in isolation rather than as an integrated system (Chen et al., 2021; Fu et al., 2019; Gao and Hu, 2016). Therefore, it is necessary to establish new parameters for pore-fracture connectivity based on the degree of micro-pore and micro-fracture development, classify pore-fracture combination types, reveal the dynamic process of shale gas migration and enrichment, and guide the selection of shale gas areas, layers, and scientific exploitation.
This study selects downhole cores from the Longmaxi Formation in the Sichuan Basin and innovatively conducts a joint experimental test involving MICP, wood’s metal (WM) impregnation, and FE-SEM. This achieves visualization of the high-pressure mercury injection process and quantitatively identifies the micro-pore and fracture volumes in shale reservoirs. Based on the characteristics of the MICP curve, the combination types of micro-pores and fractures in shale reservoirs are classified, and the impact of different pore and fracture combination types on exploration and development is explored.
2 Geological background
According to the characteristics of regional tectonic deformation and oil and gas distribution in the basin, the Sichuan Basin is divided into six secondary structural units: the North Sichuan low-flat belt, the Middle Sichuan low-flat belt, the Eastern Sichuan high-steep belt, the Western Sichuan low-steep belt, the Southwestern Sichuan low-steep belt, and the South Sichuan low-steep belt. The study area is located in Luzhou area in the South Sichuan low-steep belt (Figure 1a). The current burial depth of Longmaxi formation in the study area is more than 3,500 m (Figure 1b), which is a typical deep shale gas reservoir. In this study, the downhole cores of five typical shale gas wells in the study area were selected for research. After nearly two decades of exploration and development, it has been verified that the organic-rich siliceous shale within the high GR (natural gamma ray log value) interval at the base of the Longmaxi Formation possesses commercial exploitation value, serving as the target interval of this study (Figure 1c).
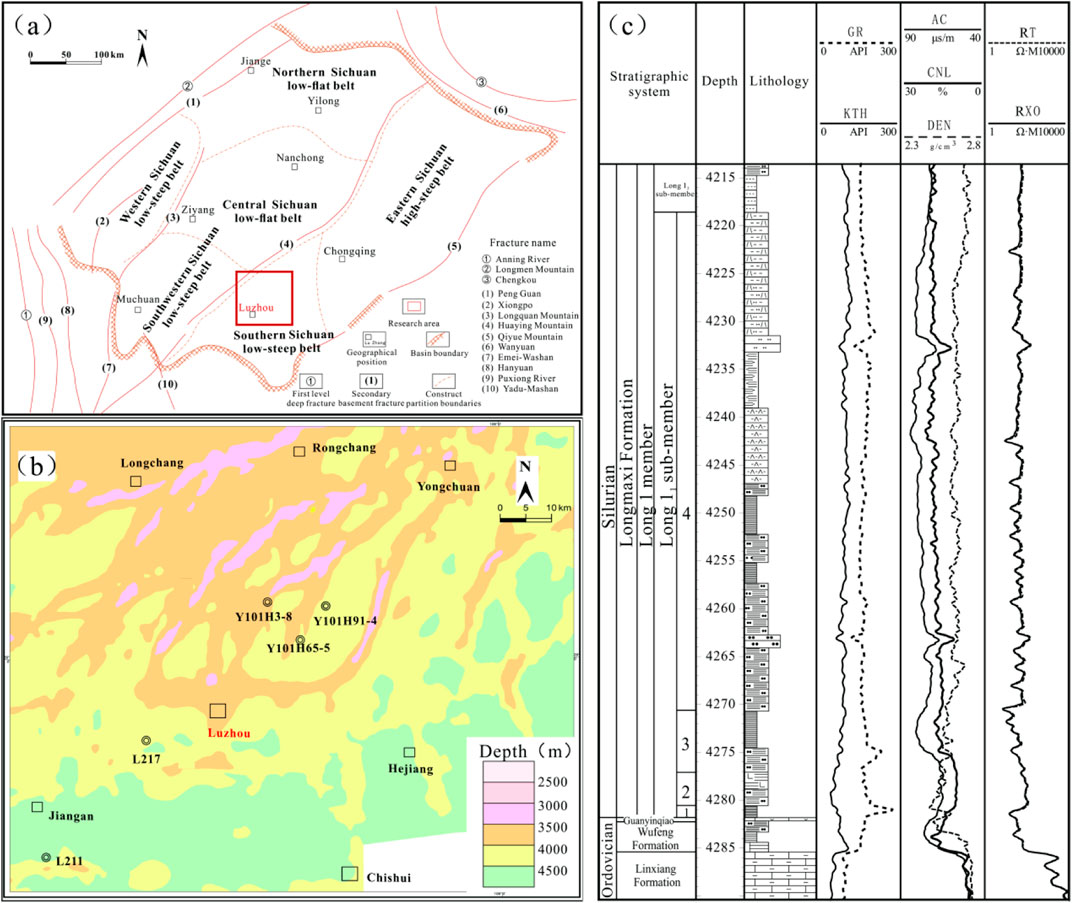
Figure 1. Structural location map and stratigraphic column diagram of the study area. (a) Structural map of the Sichuan Basin; (b) Burial depth and well location distribution map of the study area; (c) Comprehensive stratigraphic column diagram.
3 Sampling and methodologies
3.1 Sample information
In this study, the cores of deep shale gas reservoirs in 5 shale gas wells in Luzhou area of Sichuan Basin were selected for experimental test and analysis. These five wells are respectively L211, L217, Y101H3-8, Y101H91-4, and Y101H65-5, whose locations are displayed in Figure 1b. In order to enhance the comparability between samples, the samples in this study were taken from the high GR section at the bottom of Longmaxi formation in five wells. Among them, two core samples were selected from each well for experimental testing. The mineral composition, TOC content, and porosity of these samples are shown in Table 1. The samples have a TOC content of over 4%, with quartz content exceeding 50% and clay content less than 20%, indicating good gas generation potential and fracturing conditions. However, there are inter-well differences in porosity values, ranging from 3.52% to 5.81%, with an average of 4.88%. Among them, the porosity of wells L211 and Y101H91-4 is relatively low, falling below the average level.
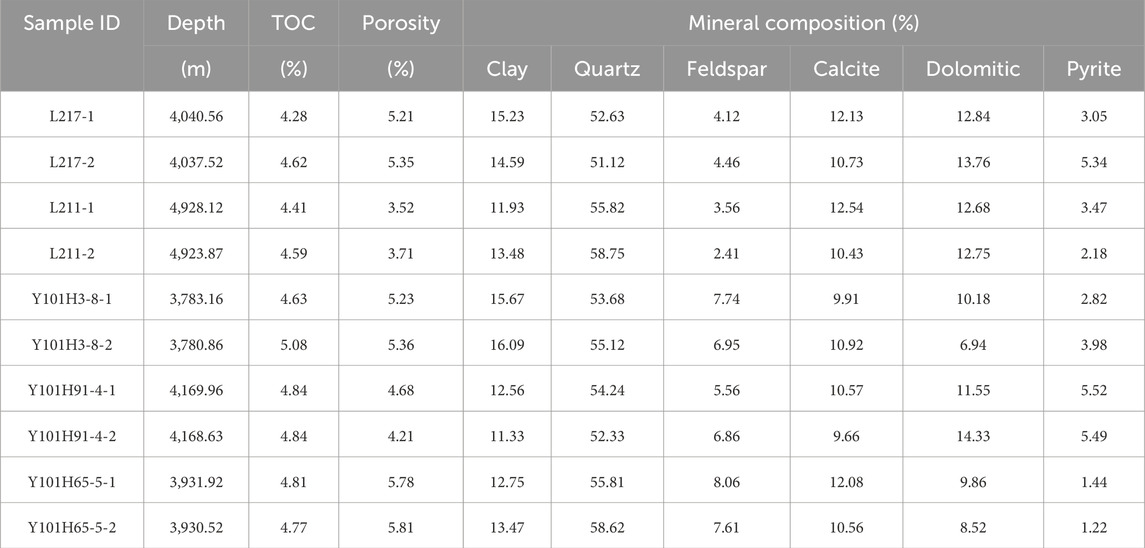
Table 1. Statistics of basic reservoir information of experimental samples.
3.2 Experimental testing analysis
3.2.1 Mercury injection capillary pressure (MICP) measurement
The Micromeritics AutoPore IV 9520 porosimeter was used for MICP testing, with a maximum pressure of 413.6 MPa. According to the Washburn equation (P = 2σcosθ/r, where P is the pressure of mercury intrusion; θ is the contact angle; σ is the surface tension; r is the radius of pore throat), the minimum detectable pore throat radius is approximately 3 nm under maximum pressure. Before conducting the MICP test, the shale samples were cut into cubes of approximately 1 cm3, polished on each surface to minimize surface roughness effects, and then dried at 60 °C. The bulk density was obtained by mercury encapsulation under initial pressure (0.034 MPa). To distinguish between residual mercury and actual pore intrusion, repeated MICP measurements were conducted on the same sample.
3.2.2 Wood’s metal (WM) impregnation
The samples for the high-pressure WM impregnation are companion samples to those used in MICP taken from the same full-diameter core along horizontal bedding planes. They have the same size (∼1 cm3) and similar reservoir properties as the mercury injection experiment samples. In order to effectively distinguish the pores and fractures invaded by mercury during MICP testing, four target experimental pressures of 500 psi, 1700 psi, 8,000 psi and 30,000 psi were set up for WM impregnation. The high-pressure WM impregnation experiment of shale samples was conducted at the Key Laboratory of Continental Shale Oil and Gas Reservoir Formation and Efficient Development, Northeast Petroleum University. The specific experimental steps are as follows:
(1) Samples were placed in the injection chamber and dried for 48 h under vacuum conditions.
(2) the sample chamber was heated to 110°C to fully melt the WM (melting point: 80°C).
(3) A manual pump was used to increase the pressure to the corresponding experimental pressure at a rate of 450 psi/min, allowing liquid WM to penetrate the pore-fracture system.
(4) While maintaining the target pressure, reduce the temperature of the sample chamber to room temperature so that WM is solidified in the invaded pore and fracture space, and then remove the sample by releasing the pressure of the sample chamber.
3.2.3 FE-SEM
After WM impregnation, shale samples with WM solidified in the pore-fracture system need to be polished with argon ions under low temperature conditions to prevent WM melting during the polishing. The FEI Quanta 650 FEG scanning electron microscope was employed to acquire pore and microfracture images of shale. The detailed procedures are outlined below:
(1) Sample cutting. After WM impregnation, the cubes were cut perpendicular to the laminate under liquid nitrogen cooling.
(2) Sample handling. The sample surface (1 × 1 cm) was polished under cooling conditions using Ilion + II (model 697, Gatan) argon-ion mill. Subsequently, the polished sample underwent a brief sputtering coating process to boost its electrical conductivity and improve the resolution of the scanning electron microscope images.
(3) Electron microscopic observation. The prepared sample was placed on the FE-SEM loading stage, and relevant parameters were set to observe WM filling in micro pores-fractures system at different magnifications.
4 Results
4.1 MICP test results
As the mercury injection pressure increases from 0.035 MPa to 413.6 MPa, the cumulative mercury injection volume of 10 shale samples gradually increases (Figure 2a). For some samples (such as L217-1/Y101H91-4-1/Y101H65-5-1/Y101H65-5-2, etc.), when the pressure reaches its maximum value (413.6 MPa), it begins to decrease, but the cumulative mercury injection volume continues to increase before gradually decreasing. This “over topping” phenomenon mainly occurs in low-porosity and low-permeability shale samples, which is due to the recovery of mercury volume expansion during the pressure reduction process (Sun et al., 2020). The MICP porosity values of the samples, calculated based on the cumulative mercury intrusion volume under maximum pressure and the bulk density measured under initial pressure, are presented in Table 2. The samples show significant variation in MICP porosity values, ranging from 0.42% to 3.16%, with an average of 1.56%. Well L217 exhibits the highest average MICP porosity (2.68%), while Well L211 shows the lowest (0.56%). According to the Washburn equation, the connected pore volume related to the corresponding pore throat size was calculated. The pore throat size distribution curve shows that more than half of the total pore volume is connected by pore throats smaller than 20 nm, and the pores and micro-fractures larger than 150 nm to several micrometers are also developed (Figure 2). In this study, the porosity of overmature marine shale samples with pore throats ranging from 3 to 20 nm accounts for 50.34%∼82.56% of the MICP porosity, providing substantial storage space for shale gas.
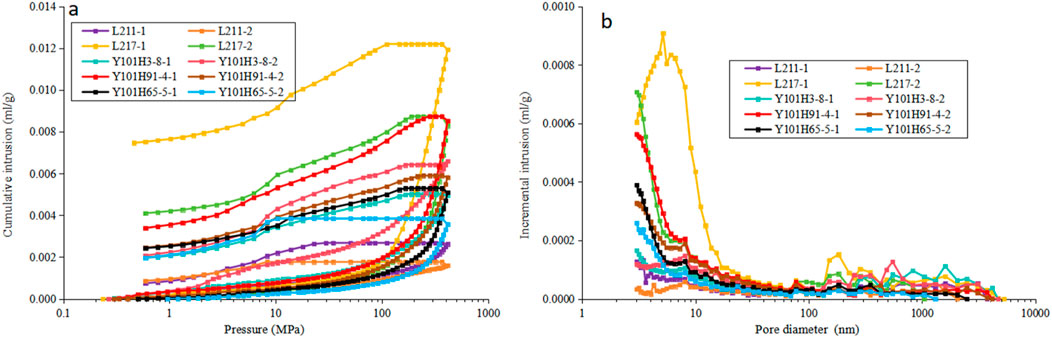
Figure 2. (a) Intrusion-extrusion curves and (b) Pore volume distribution vs. pore diameter from MICP of shale samples.
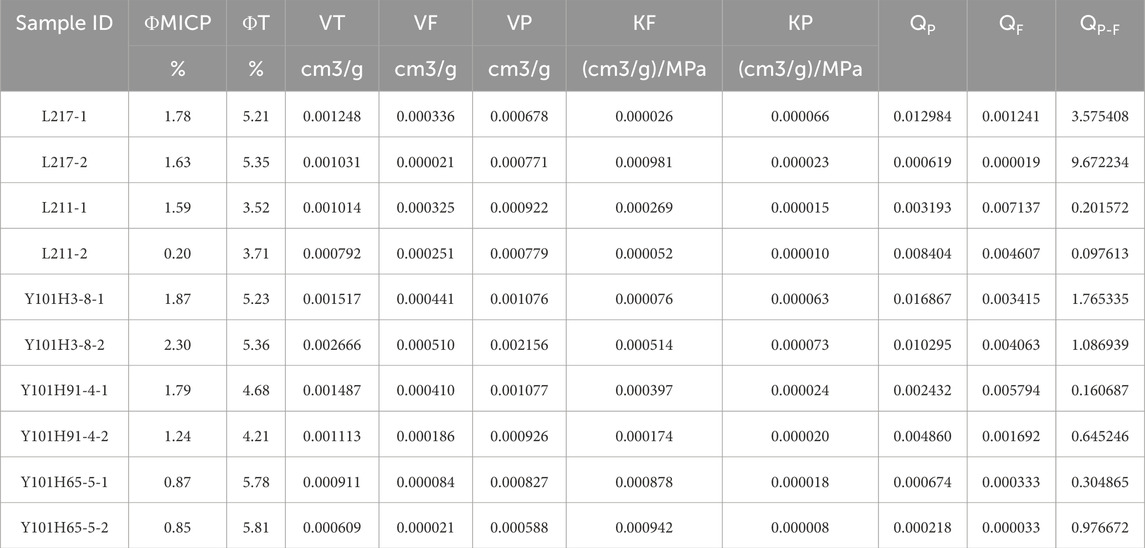
Table 2. Calculation parameters related to the pore-fracture combination type of the studied sample.
4.2 FE-SEM photos of WM immersion
To gain a clear understanding of the phenomenon of mercury molecules injecting into pores and micro-fractures during MICP process, we designed WM immersion experiments under different pressure conditions, and observed the locations of WM filling into pores and micro-fractures under FE-SEM. Sample L217-1 was subjected to WM impregnation at pressures of 500, 1700, 8,000, and 30,000 psi, respectively.
At a low pressure of 500 Psi, FE-SEM observations show that WM mainly occupied micro-fractures with large width and long length parallel to the lamination (Figure 3a). However, micro-fractures with both narrow width and short length remain unfilled by WM, particularly those diagenetic contraction fractures that exhibit almost no WM infiltration (Figure 3b). As the pressure increases to 1700 Psi, corresponding to a pore size of 105 nm, WM filled micro-fractures and a small number of pores, but organic pores and smaller pore size inorganic pores are basically not filled (Figure 3c). As the pressure increases to 8,000 Psi, corresponding to a pore size of 25 nm, WM successfully filled small organic pores, small-diameter inorganic pores, and diagenesis-related micro-fractures in sample L217-1 (Figures 3d,e). As the pressure increases to 30,000 psi, the pore size accessible to WM decreases to 7 nm. Under a low magnification, it is clearly visible that the pores and micro-fractures are filled with a large amount of WM (Figure 3f). Upon continuous magnification and observation of micro-fractures and pores, it was found that some interconnected micro-fractures with both narrow width and short length exhibited a partial filling with WM, which may be related to the volume shrinkage of the WM after cooling (Figure 3g). The pores (organic and inorganic pores) connected to the micro-fractures were fully filled with WM (Figures 3g,h). However, due to poor connectivity, a large number of intragranular pores did not exhibit WM filling (Figure 3i). It can be seen that with the increase of pressure, WM is regularly immersed in the pores and micro-fractures of shale. WM typically penetrates into larger-scale micro-fractures, then fills smaller-scale micro-fractures and inorganic pores, subsequently entering inorganic and organic pores with smaller diameters until most of the connected pores and micro-fractures are occupied by WM.
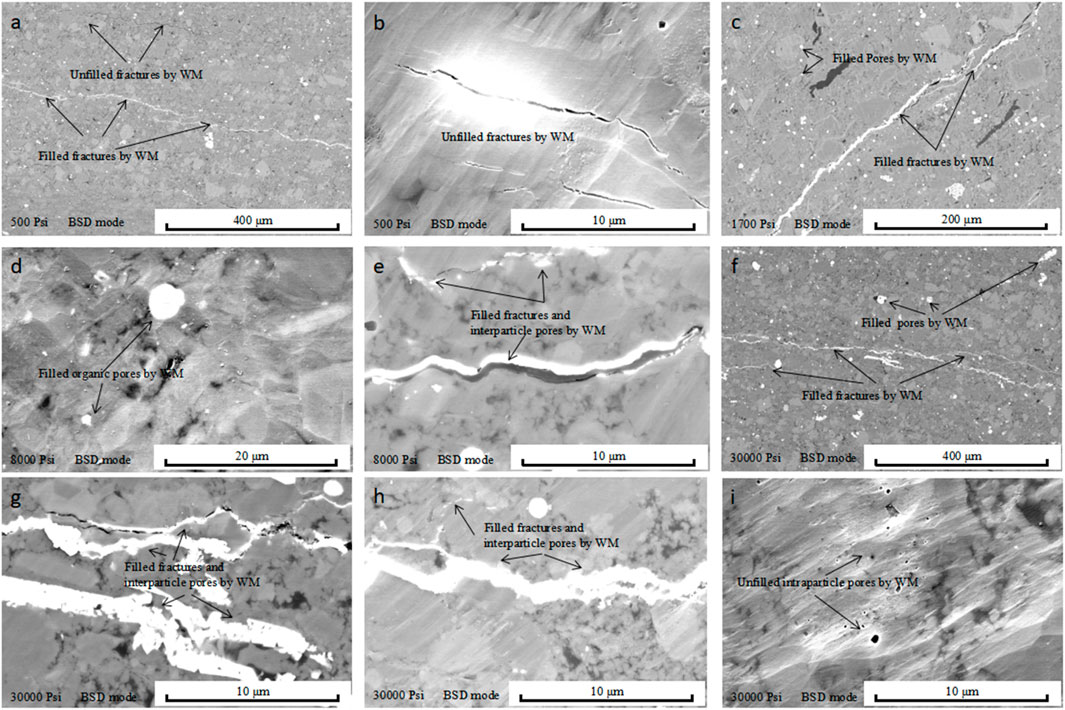
Figure 3. SEM photos of different WM injection pressures. (a) WM-filled micro-fractures in the sample of L217-1 at a low pressure of 500 Psi; (b) non-filled short length micro-fractures at a low pressure of 500 Psi; (c) WM-filled more micro-fractures at a pressure of 1700 Psi; (d) WM-filled few organic pores at a pressure of 8,000 Psi; (e) WM-filled micro-fractures and interparticle pores at a pressure of 8,000 Psi; (f) WM-filled micro-fractures and pores at a high pressure of 30,000 Psi; (g) WM-filled micro-fractures and organic pores at a high pressure of 30,000 Psi; (h) WM-filled micro-fractures and interparticle pores at a high pressure of 30,000 Psi; (i) non-filled intraparticle pores.
5 Discussion
5.1 Stage division of liquid mercury into pores and micro-fractures
The pore-fracture network in shale consists of a fracture system connected to the matrix pores (Davudov et al., 2020). Regarding the study of pore connectivity, scholars have employed methods such as spontaneous imbibition, CM-SANS, and FIB-SEM 3D reconstruction to analyze the pore connectivity within shale reservoirs, and these studies indicate that the organic pore connectivity in high-overmature marine shale gas reservoirs is relatively good (Sun et al., 2020; Sun et al., 2023; Hu et al., 2015; Hu et al., 2017), but the connectivity between micro-fractures and pores remains poorly understood. To address this knowledge gap, this study quantitatively analyses the types of pore-fracture combinations through FE-SEM observations after WM immersion experiments and MICP.
A large number of nano pores and micro nano scale micro-fractures are developed in shale gas reservoir. Numerous studies have shown that in the overmature Longmaxi Formation shale reservoirs, the pore diameters of inorganic pores are larger than those of organic pores, but both are smaller than those of micro-fractures (Yu et al., 2019; Yang et al., 2019). Among the inorganic pores, there are numerous isolated intragranular pores, and the pore diameters and quantities of organic pores in kerogen are significantly smaller than those in pyrobitumen (Teng et al., 2022; Liu et al., 2022; Guo X. W. et al., 2019). The MICP and WM immersion experiments involve injecting liquid metal fluid into the shale pore-fracture system under external force. This process follows the Washburn equation, which indicates that the mercury first enters fractures and pores with larger pore sizes, and then moves into pores with relatively smaller pore sizes. Therefore, by taking the partial derivative of the cumulative mercury injection volume with respect to the injection pressure, we can effectively distinguish the rate of liquid mercury filling into the pore-fracture system, which reflects the connectivity of pore-fracture system in shale samples. Figure 4 shows that the mercury injection rate (dV/dP) of the shale reservoir in the study area gradually decreases with pressure increases. The pressure corresponding to the first minimum value after the highest peak of dV/dP is used to distinguish micro-fractures, and the pressure corresponding to the minimum value of dV/dP tending to 0 for the first time is used to distinguish pores. Taking L217 sample as an example, according to the value of dV/dP, mercury injection process can be roughly divided into three intervals: high mercury injection rate (<1.2 MPa), moderate mercury injection rate (1.2∼16 MPa), and low mercury injection rate (>16 MPa) (Figure 4). It is worth noting that due to differences in the pore structure among shale samples, the pressure corresponding to the mercury injection rate range at different stages also varies. For example, the two samples from well Y101H65-5 have the lowest mercury injection rate (Figure 4) and also can be divided into three intervals: high mercury injection rate (<3 MPa), moderate mercury injection rate (3∼16 MPa), and low mercury injection rate (>16 MPa), indicating poor connectivity of pore-fracture system in the shale reservoir of this well. On the contrary, the dV/dP of shale samples from Well L217 and Well Y101H3-8 is relatively high, indicating good connectivity of pore-fracture system in the shale reservoir.
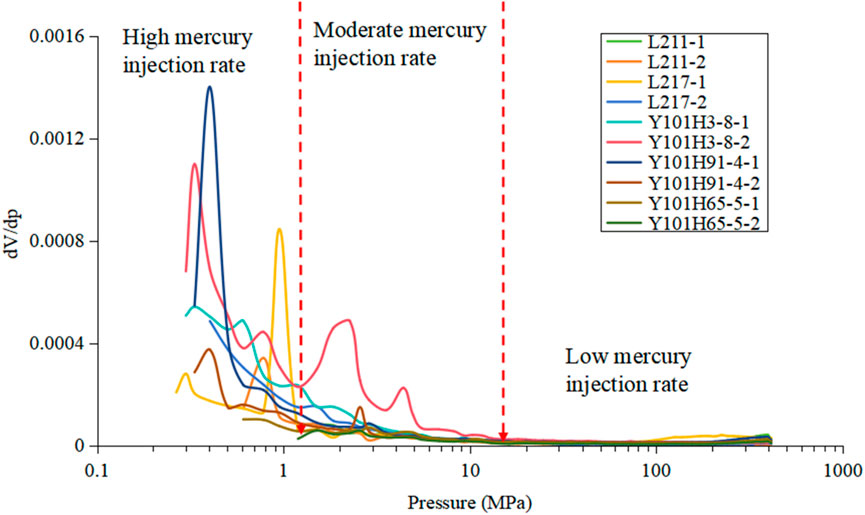
Figure 4. Deviation of cumulative mercury injection volume to pressure (dV/dP) vs. Pressure of study shale samples.
To better distinguish the stages of mercury molecules entering pores and micro-fractures during the MICP experimental process, the L217-1 sample that had completed the WM immersion experiment was selected for detailed analysis. Based on the change in dV/dP value, the mercury injection stage of the MICP is divided into three stages (Figure 5). The dV/dP value corresponding to point A is the first minimum value after the highest peak, indicating a turning point where the mercury injection rate changes from low to high and then back to low, and the pressure corresponding to point A is 1.2 MPa. Point B represents the minimum value of dV/dP tending to 0 for the first time, revealing the process where the mercury injection rate changes from high to low and then slight increase. The pressure value corresponding to point B is 16 MPa. So, when the mercury injection pressure is less than 1.2 MPa, the main space where mercury molecules penetrate is micro-fractures, with little penetration into pores and smaller-scale diagenetic contraction fractures (Figures 3a,b). When the injection pressure ranges from 1.2 to 16 MPa, micro-fractures are completely filled with WM, and then some inorganic pores begin to be filled with WM (Figure 3c). As pressure gradually increases, WM fills a large number of intergranular pores and organic pores, but intragranular pores and organic pores with poor connectivity are not filled (Figures 3g–i). Therefore, the mercury injection curve is categorized into three stages: the micro-fracture filling stage with mercury (<1.2 MPa), the stage of mercury filling pores and micro-fractures (1.2∼16 MPa), and the pore filling stage with mercury (>16 MPa). This sequential penetration pattern, where mercury infiltrates micro-fractures first followed by pores, is consistent with previous studies (Sun et al., 2023; Yu et al., 2019). The same analytical approach can be applied to other samples for pore-scale classification during mercury injection processes.
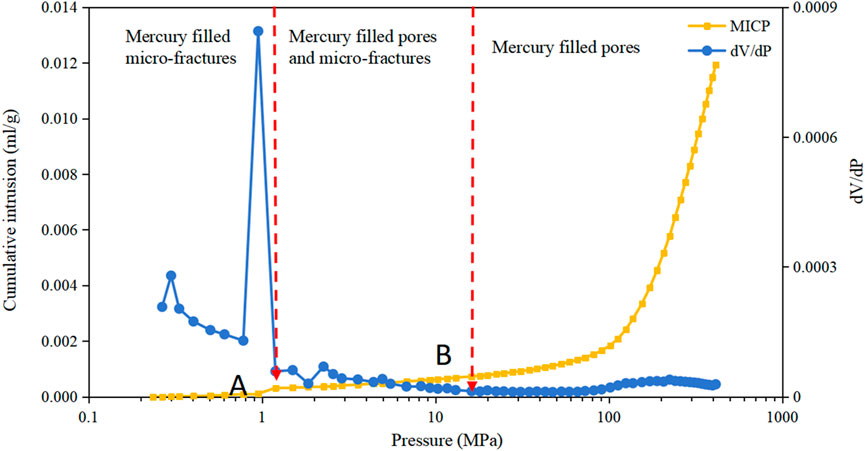
Figure 5. Schematic diagram of the stage division of mercury intrusion into micro pore-fracture during the L217-1 mercury intrusion process.
5.2 Quantitative characterization of pores-fractures combination type
Some scholars have classified the types of micro pore-fracture combinations in shale gas reservoirs, mainly through qualitative understanding of the contact relationships between micro-fractures and pores based on electron microscopy observations (Fu et al., 2021), but quantitative characterization has not been achieved. In the previous section, the mercury injection curve was divided into three stages, revealing the process of mercury entering pores and fractures, and achieving quantitative division of shale reservoir pores and fractures using the mercury injection curve, which lays the foundation for quantitative analysis of pore-fracture combination type.
The pore-fracture combination types in shale reservoirs aim to understand the connectivity between pores and micro-fractures, and further enhance the understanding of the difficulty of shale gas enrichment and extraction. MICP can characterize pores ranging from 3 nm to several micrometers, providing significant advantages in understanding pore-fracture structure (Yu et al., 2019). MICP involves injecting fluid into the pores and micro-fractures of shale reservoirs under external force. When characterizing pore connectivity using MICP, the main focus is on the mercury injection volume and rate. Based on this, we have defined the micro pore-fracture combination parameter (QP-F), which can be calculated using the following formula:
Where, QP is pore connectivity parameter; QF is fracture connectivity parameter; C is total connectivity parameter. C, QP and QF can express as Equations 2–4, respectively.
Where, ΦT is total porosity of shale core, %; ΦC is connective porosity calculated by MICP, %; VP is mercury injection volume after pressure exceeds point A, mL/g; VT is accumulated mercury injection volume, mL/g; VF is mercury injection volume at pressure less than point A, mL/g; K1 is average mercury injection rate after pressure exceeds point A, (mL/g)/MPa; K2 is average mercury injection rate at pressure less than point A, (mL/g)/MPa.
From Equation 1, it can be understood that QP-F represents the pore volume connected by the unit micro-fracture volume. The larger the value of QP-F, the better the connectivity of the pore-fracture system. Relevant calculation parameters were listed in Table 2. Our calculations reveal that when the QP value exceeds the QF value by an order of magnitude, the QP-F value is greater than 1; conversely, the QP-F value is less than 1. From the geological perspective of shale gas, it is believed that shale reservoirs are characterized by a large number of organic pores and a relatively small number of micro-fractures (Li et al., 2025; Chen et al., 2019). However, these micro-fractures serve as connecting pores, enhancing the migration of shale gas (Li et al., 2024; Liu et al., 2024). Studies also indicate that in areas with fault development, shale reservoirs with a high degree of natural fractures and micro-fractures exhibit very poor pore development, often resulting in poor reservoir performance and gas-bearing properties (Hu et al., 2024; Fu et al., 2021; Fan et al., 2020). It is evident that a higher degree of micro-fractures development hinders pore development. This serves as indirect evidence that our calculation results align with the geological features of shale gas reservoirs. Therefore, greater attention should be directed towards the connectivity between micro-fractures and pores, particularly in scenarios of limited micro-fractures development.
The QP-F values of all shale samples are distributed between 0.01 and 9.67, with an average value of 1.82, indicating that the degree of pore development in the shale reservoir is higher than that of micro-fractures. Among them, the QP-F values of the four samples from Well L217 and Well Y101H3-8 are greater than 1, with an average value of 4.02, indicating that the shale reservoirs of these two wells exhibit good pore-fracture connectivity. The QP-F value of Well L211 is the smallest, with two samples being 0.20 and 0.10 respectively, indicating that the shale reservoirs of this well exhibit poor pore-fracture connectivity. Based on the magnitude of the QP-F value, the pore-fracture combination types in shale reservoirs are categorized into three types: strongly connected pore-fracture type (SCPFT) (QP-F>1), moderately connected pore-fracture type (MCPFT) (0.5<QP-F<1), and weakly connected pore-fracture type (WCPFT) (QP-F<0.5). The QP value of SCPFT shale sample is much greater than QF value (Table 2), indicating that the degree of pore development is much better than that of micro-fractures. The QP value of WCPFT shale sample is equal to or slightly greater than the QF value (Table 2), reflecting that the pores of shale reservoir are developed, but the connectivity between pores and micro-fractures is poor. MCPFT shale reservoir is between the first two types. It is worth noting that the QP-F value of the shale reservoir of well L217 is much higher than that of other shale gas wells, especially the L217-2 sample, because the well is located far away from other wells and is relatively flat (Figure 1b), with weak structural deformation, high reservoir overpressure and high degree of pore development. Therefore, QP-F can indirectly distinguish the quality of shale reservoir and guide the optimization of favorable areas for shale gas exploration.
5.3 Influence of pores-fractures combination type on exploration and development
Micro pores and micro-fractures in shale reservoirs are important reservoir spaces and seepage channels of shale gas, which affect the enrichment and single well recovery of shale gas. Therefore, the pore-fracture combination type has an important impact on the exploration and development of shale gas. In the previous section, according to the QP-F value, the pore-fracture combination types of shale reservoir are divided into three categories. The following mainly analyzes the reservoir capacity and gas bearing property of shale reservoirs with different pore-fracture combination types.
Figure 6a shows that the porosity of all SCPFT shale samples is high, with an average of 5.28%; but the porosity of MCPFT and WCPFT shale samples varies greatly. It shows that SCPFT shale reservoir has strong reservoir capacity, while MCPFT and WCPFT shale reservoirs have strong heterogeneity of reservoir capacity. The corresponding shale gas reservoir has a similar variation law that the gas content of all SCPFT shale samples is greater than 7.5 m3/t, with an average of 8.28 m3/t, and the gas content of MCPFT and WCPFT shale samples is great difference (Figure 6b). Shale gas reservoirs exhibit typical characteristics of being both source and reservoir, and shale gas does not need to be migrated or migrated for a short distance in situ (Curtis et al., 2012; Liu et al., 2016; Hu et al., 2024). This will cause some disconnected pores to still contain gas in MCPFT and WCPFT shale reservoirs. However, it is difficult to exploit shale gas in these pores during the exploitation of shale gas. SCPFT shale gas reservoirs have high porosity (5.28%), high gas content (8.28 m3/t), and good pore-fracture connectivity which is conducive to shale gas exploitation. At the same time, this kind of reservoir has high quartz content, which is conducive to fracturing operation and forms complex fracture network structure. Therefore, SCPFT shale gas reservoir is the most important target in the process of shale gas exploration and development.
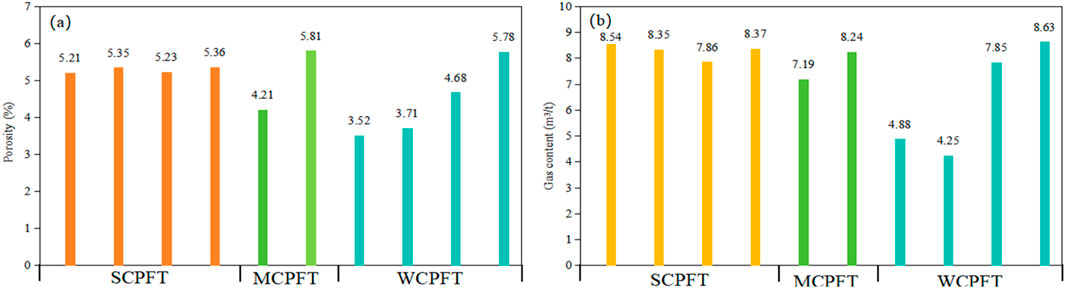
Figure 6. Porosity and gas content histogram of different pore-fracture combination types. (a) porosity and (b) gas content histogram of different pore-fracture combination types.
In order to further analyze the differences of shale gas enrichment and percolation in different pore-fracture combination types, the correlation between pore-fracture combination type parameters and gas bearing property and permeability was drawn in this study. The results show that there is a good logarithmic relationship between QP and gas content (Figure 7a), there is no correlation between QF and gas content (Figure 7b), and there is a positive correlation between QP-F and gas content to some extent (Figure 7c), suggesting that shale gas in shale reservoirs is predominantly stored within pores, with fractures exhibiting a relatively weaker storage capacity. A shale reservoir characterized by more developed pores exhibits superior productivity (Fu et al., 2021; Liu et al., 2024), aligning with our established understanding. The correlation between QP-F and gas content is not as good as QP (Figures 7a,c). QP-F merely reflects the degree of pore development to a certain extent, but more crucially, it embodies the connectivity of pore-fracture system. So there is a good positive correlation between QP-F and shale permeability (Figure 7d). Generally, the higher the permeability of a shale reservoir, the greater its flow capacity becomes, resulting in better productivity for a single well (Davudov et al., 2020). Figure 8 demonstrates a positive correlation between the QP-F value and the estimated ultimate recovery (EUR) of a single well, indicating that shale gas wells with superior pore-fracture connectivity tend to exhibit higher gas production rates.
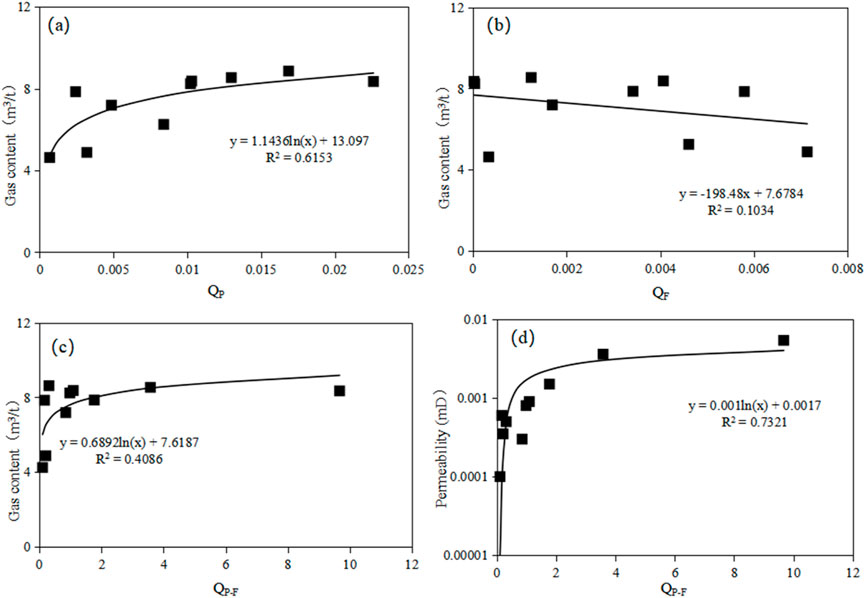
Figure 7. Correlation between parameters of pore-fracture combination type and gas content, permeability. (a) gas content vs. QP; (b) gas content vs. QF; (c) gas content vs. QP-F; (d) permeability vs. QP-F.
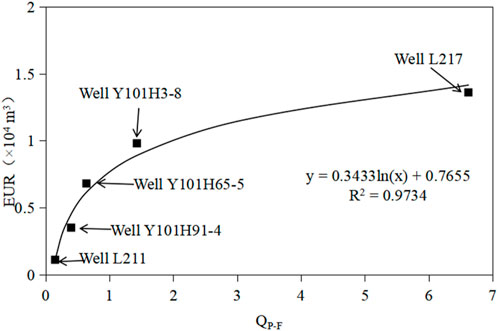
Figure 8. Correlation between QP-F and EUR of single Well.
Among the five shale gas wells selected for this study, Wells L217 and Y101H3-8 exhibit QP-F values for their shale reservoirs exceeding 1, classifying them as SCPFT. This kind of shale reservoir has good development of pores and micro-fractures, and the contact degree between pores and micro-fractures is high (Figure 9a), which is conducive to the enrichment and exploitation of shale gas. Well L211, on the other hand, has a QP-F value for its shale reservoir below 0.5, categorizing it as WCPFT. The development degree of pores and micro-fractures in this kind of shale reservoir is poor, and the connectivity of pores-fractures is poor (Figure 9c), which is not conducive to the enrichment and exploitation of shale gas. For Wells Y101H91-4 and Y101H65-5, their shale reservoir QP-F values are within the range of 0.16–0.97 but above 1 (note: this should be a clarification or correction as per context, possibly meaning “above 0.16 but some values are less than 1″), with average values of 0.4 and 0.64, respectively. Consequently, Well Y101H91-4 falls into the WCPFT category, while Well Y101H65-5 is classified as MCPFT, which shows good development characteristics of pores and micro-fractures, but the connectivity is relatively weak (Figure 9b). This elucidates the reason why Wells Y101H91-4 and Y101H65-5 exhibit high porosity and gas content; however, despite undergoing the same fracturing process, they failed to yield satisfactory gas production results. Therefore, in shale reservoirs where QP-F is less than 1, the pores-fracture connectivity is inadequate. To address this, the fracturing operation method must be optimized, including measures such as increasing the number of perforation clusters, enhancing the intensity of fracturing fluid, and augmenting the sand concentration. These adjustments aim to achieve a more intricate fracture network structure, thereby unlocking more pores with limited connectivity and ultimately enhancing shale gas recovery.
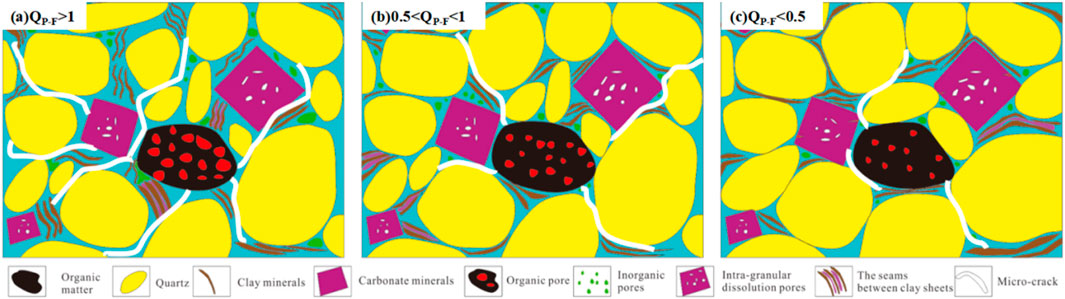
Figure 9. Schematic diagram of pore-fracture characteristics of shale reservoirs with different QP-F values. (a) QP-F>1; (b) 0.5<QP-F<1; (c) QP-F<0.5.
6 Conclusion
(1) The visualization of MICP was achieved through a combined experimental approach involving MICP and WM impregnation. According to the extreme value distribution characteristics of dV/dP, The mercury injection curve was categorized into three distinct stages: mercury penetration into micro-fractures, mercury penetration into micro pore-fractures, and mercury penetration into pores. The study clarified that the average pore volume of the shale reservoir in the research area was 0.00098 cm3/g, while the average micro-fracture volume was 0.00026 cm3/g.
(2) By utilizing high-pressure mercury injection data, a quantitative characterization method for the microscopic pore-fracture combination type in shale reservoirs has been established. A parameter, QP-F, is introduced to elucidate the pore-fracture connectivity within shale reservoirs. Based on the QP-F values, these combinations are categorized into three types, specifically: strongly connected pore-fracture type (SCPFT) (QP-F>1), moderately connected pore-fracture type (MCPFT) (0.5<QP-F<1), and weakly connected pore-fracture type (WCPFT) (QP-F<0.5).
(3) The SCPFT shale reservoir in the study area exhibits high porosity, averaging 5.28%, and high gas content, averaging 8.28 m3/t. It also boasts high single-well productivity, making it a prime target for shale gas exploration. In contrast, the MCPFT and WCPFT shale reservoirs display significant heterogeneity in porosity and gas content, coupled with poor pore-fracture connectivity. This accounts for the observation that some shale gas wells, despite having high porosity and gas content, exhibit low single-well productivity. Therefore, it is recommended to optimize fracturing operation parameters during extraction to facilitate the formation of complex fracture networks, thereby unlocking pores with poor connectivity and enhancing shale gas migration efficiency.
Data availability statement
The original contributions presented in the study are included in the article/supplementary material, further inquiries can be directed to the corresponding author.
Author contributions
ZH: Validation, Writing – review and editing, Methodology, Writing – original draft. XD: Formal Analysis, Methodology, Writing – review and editing. YF: Investigation, Writing – original draft. YC: Project administration, Writing – original draft. JC: Investigation, Writing – original draft. YJ: Project administration, Writing – review and editing. LY: Investigation, Validation, Writing – review and editing.
Funding
The author(s) declare that financial support was received for the research and/or publication of this article. The research was supported by the National Natural Science Foundation of China (Grant No. 42302166), National Energy Shale Gas Research (Experiment) Center (2023-KFKT-37); National Natural Science Foundation of China (Grant No. 42272171), and the Science and Technology Cooperation Program of CNPC–SWPU Innovation Alliance (Grant No. 2020CX020104).
Conflict of interest
Authors ZH, XD, YC, and JC were employed by PetroChina Research Institute of Petroleum Exploration & Development. Author LY was employed by Sichuan Shale Gas Exploration and Development Company Limited.
The remaining authors declare that the research was conducted in the absence of any commercial or financial relationships that could be construed as a potential conflict of interest.
Generative AI statement
The author(s) declare that no Generative AI was used in the creation of this manuscript.
Publisher’s note
All claims expressed in this article are solely those of the authors and do not necessarily represent those of their affiliated organizations, or those of the publisher, the editors and the reviewers. Any product that may be evaluated in this article, or claim that may be made by its manufacturer, is not guaranteed or endorsed by the publisher.
References
Chen, G. S., Wu, J. F., Liu, Y., Huang, H. Y., Zhao, S. X., Chang, C., et al. (2021). Geology-engineering integration key technologies for ten billion cubic meters of shale gas productivity construction in the Southern Sichuan Basin. Nat. Gas. Ind. 41 (1), 72–82. doi:10.3787/j.issn.1000-0976.2021.01.006
Chen, Z. Y., Song, Y., Jiang, Z. X., Liu, S. B., Li, Z., Shi, D. S., et al. (2019). Identification of organic matter components and organic pore characteristics of marine shale: a case study of wufeng-longmaxi shale in Southern Sichuan basin, China. Mar. Petroleum Geol. 109, 56–69. doi:10.1016/j.marpetgeo.2019.06.002
Clarkson, C. R., Solano, N., Bustin, R., Bustin, A., Chalmers, G., He, L., et al. (2013). Pore structure characterization of North American shale gas reservoirs using USANS/SANS, gas adsorption, and mercury intrusion. Fuel 103, 606–616. doi:10.1016/j.fuel.2012.06.119
Cui, Z., Sun, M. D., Mohammadian, E., Hu, Q. H., Liu, B., Ostadhassan, M., et al. (2024). Characterizing microstructural evolutions in low-mature lacustrine shale: a comparative experimental study of conventional heat, microwave, and water-saturated microwave stimulations. Energy 294, 130797. doi:10.1016/j.energy.2024.130797
Curtis, J. B. (2002). Fractured shale-gas systems. AAPG Bull. 86 (11), 1921–1938. doi:10.1306/61EEDDBE-173E-11D7-8645000102C1865D
Curtis, M., Cardott, B., Sondergeld, C., and Rai, C. S. (2012). Development of organic porosity in the woodford shale with increasing thermal maturity. Int. Jounal Coal Geol. 103 (23), 26–31. doi:10.1016/j.coal.2012.08.004
Davudov, D., Moghanloo, R. G., and Zhang, Y. X. (2020). Interplay between pore connectivity and permeability in shale sample. Int. J. Coal Geol. 220, 103427. doi:10.1016/j.coal.2020.103427
Fan, C. H., Li, H., Qin, Q. R., He, S., and Zhong, C. (2020). Geological conditions and exploration potential of shale gas reservoir in wufeng and longmaxi formation of southeastern sichuan basin, China. J. Petroleum Sci. Eng. 191, 107138–4105. doi:10.1016/j.petrol.2020.107138
Fu, Y. H., Jiang, Y. Q., Dong, D. Z., Hu, Q. H., Lei, Z. A., Peng, H., et al. (2021). Microscopic pore-fracture configuration and gas-filled mechanism of shale reservoirs in the Western Chongqing area, Sichuan Basin, China. Petroleum Explor. Dev. 48 (05), 1063–1076. doi:10.1016/s1876-3804(21)60091-5
Fu, Y. H., Jiang, Y. Q., Wang, Z. L., Hu, Q. H., Xie, J., Ni, G. S., et al. (2019). Non-connected pores of the longmaxi shale in southern Sichuan Basin of China. Mar. Petroleum Geol. 110, 420–433. doi:10.1016/j.marpetgeo.2019.07.014
Gao, P., Xiao, X. M., Hu, D. F., Lash, G. G., Liu, R. B., Zhang, B. Y., et al. (2024). Comparison of silica diagenesis between the lower Cambrian and lower Silurian shale reservoirs in the middle-upper yangtze platform (southern China). AAPG Bull. 108 (6), 971–1003. doi:10.1306/01242422096
Gao, Z. Y., and Hu, Q. H. (2016). Initial water saturation and imbibition fluid affect spontaneous imbibition into barnett shale samples. J. Nat. Gas Sci. Eng. 34, 541–551. doi:10.1016/j.jngse.2016.07.038
Gou, Q., Xu, S., Hao, F., Zhang, L., Chen, Z., and Bai, N. (2023). Petrography and mineralogy control the nm-μm-scale pore structure of saline lacustrine carbonate-rich shales from the Jianghan Basin, China. Mar. Petroleum Geol. 155, 106399. doi:10.1016/j.marpetgeo.2023.106399
Guo, Q. Y., Xu, S., Hao, F., Yang, F., Zhang, B. Q., Shu, Z. G., et al. (2019). Full-scale pores and micro-fractures characterization using FE-SEM, gas adsorption, nano-CT and micro-CT: a case study of the Silurian longmaxi formation shale in the fuling area, Sichuan Basin, China. Fuel 253, 167–179. doi:10.1016/j.fuel.2019.04.116
Guo, X. W., Qin, Z. J., Yang, R., Dong, T., He, S., Hao, F., et al. (2019). Comparison of pore systems of clay-rich and silica-rich gas shales in the lower Silurian longmaxi formation from the jiaoshiba area in the eastern Sichuan Basin, China. Mar. Petroleum Geol. 101, 265–280. doi:10.1016/j.marpetgeo.2018.11.038
He, Z. L., Nie, H. K., Zhao, J. H., Liu, W. X., Fang, B., and Zhang, W. T. (2017). Types and origin of nanoscale pores and fractures in wufeng and longmaxi shale in Sichuan Basin and its periphery. J. Nanosci. Nanotechnol. 17 (9), 6626–6633. doi:10.1166/jnn.2017.14425
Hill, D. G., and Nelson, C. R. (2000). Gas productive fractured shales: an overview and update. EurekaMag 6 (2), 4–13. doi:10.2523/29580-ms
Hu, Q. H., Ewing, R. P., and Dultz, S. (2012). Low pore connectivity in natural rock. J. Contam. Hydrology 133, 76–83. doi:10.1016/j.jconhyd.2012.03.006
Hu, Q. H., Ewing, R. P., and Rowe, H. D. (2015). Low nanopore connectivity limits gas production in barnett formation. J. Geophys. Res. Solid Earth 120, 8073–8087. doi:10.1002/2015JB012103
Hu, Q. H., Liu, H., Yang, R., Zhang, Y. X., Kibria, G., Sahi, S., et al. (2017). Applying molecular and nanoparticle tracers to study wettability and connectivity of longmaxi formation in southern China. J. Nanosci. Nanotechnol. 17 (9), 6284–6295. doi:10.1166/jnn.2017.14428
Hu, Z. Q., Liu, Z. Q., Du, W., Bai, Z., Wang, R. Y., Sun, C. X., et al. (2024). Key geological factors governing sweet spots in the wufeng-longmaxi shales of the Sichuan basin, China. Energy Geosci. 5 (3), 100268. doi:10.1016/j.engeos.2023.100268
Huang, X., Kang, Z., Zhao, J., Wang, G., Zhang, H., and Yang, D. (2023). Experimental investigation on micro-fracture evolution and fracture permeability of oil shale heated by water vapor. Energy 277, 127677. doi:10.1016/j.energy.2023.127677
Jia, C. Z., Zheng, M., and Zhang, Y. F. (2012). Unconventional hydrocarbon resources in China and the prospect of exploration and development. Petroleum Explor. Dev. 39 (2), 139–146. doi:10.1016/S1876-3804(12)60026-3
Klaver, J., Desbois, G., Littke, R., and Urai, J. (2015). BIB-SEM characterization of pore space morphology and distribution in postmature to overmature samples from the haynesville and bossier shales. Mar. Petroleum Geol. 59, 451–466. doi:10.1016/j.marpetgeo.2014.09.020
Li, H., He, S., Radwan, A. E., Xie, J. T., and Qin, Q. R. (2024). Quantitative analysis of pore complexity in lacustrineorganic-rich shale and comparison to marine shale: insights from experimental tests and fractal theory. Energy and Fuel 38 (17), 16171–16188. doi:10.1021/acs.energyfuels.4c03095
Li, J., Zhang, Q., Jiang, W., Li, H., Li, L., Xue, T. F., et al. (2025). Lithological controls on pore structure and their implications for deep shale gas reservoir quality in the longmaxi formation, Luzhou area, Southern Sichuan Basin, China. Energy and Fuel 39, 1541–1558. doi:10.1021/acs.energyfuels.4c05247
Liang, X., Shan, C. A., Zhang, Z., Xu, Z. Y., Xu, J. B., Wang, W. X., et al. (2021). Three-dimensional closed system accumulation model of taiyang anticline mountain shallow shale gas in the zhaotong demonstration area. Acta Geol. Sin. 95 (11), 3380–3399. doi:10.3969/j.issn.0001-5717.2021.11.015
Liu, B., Mastalerz, M., and Schieber, J. (2022). SEM petrography of dispersed organic matter in black shales: a review. Earth-Science Rev. 224, 103874. doi:10.1016/j.earscirev.2021.103874
Liu, J. F., He, X., Xue, F. J., Dai, J. J., Yang, Y. X., Huang, H. Y., et al. (2024). The influence of natural fractures of multi-feature combination on seepage behavior in shale reservoirs. J. Min. Strata Control Eng. 6 (1), 013437. doi:10.13532/j.jmsce.cn10-1638/td.20240018.001
Liu, S. G., Deng, B., Zhong, Y., Ran, B., Yong, Z. Q., Sun, W., et al. (2016). Unique geological features of burial and superimposition of the lower Paleozoic shale gas across the Sichuan Basin and its periphery. Earth Sci. Front. 23 (1), 11–28. doi:10.13745/j.esf.2016.01.002
Ma, X. H., Xie, J., Yong, Y., and Zhu, Y. Q. (2020). Geological characteristics and high production control factors of shale gas reservoirs in Silurian longmaxi formation, southern Sichuan Basin, SW China. Petroleum Explor. Dev. 47 (5), 901–915. doi:10.1016/s1876-3804(20)60105-7
Shi, Q., and Chen, P. (2023). “Rigid-elastic chimera” pore model and overpressure porosity measurement method for shale: a case study of the deep overpressure siliceous shale of Silurian longmaxi formation in southern Sichuan Basin, SW China. Petroleum Explor. Dev. 50 (1), 113–124. doi:10.1016/S1876-3804(22)60374-4
Sun, M. D., Duan, X. G., Liu, Q., Blach, T., Ostadhassan, M., Liu, B., et al. (2023). The importance of pore-fracture connectivity in overmature marine shale for methane occurrence and transportation. Mar. Petroleum Geol. 157, 106495. doi:10.1016/j.marpetgeo.2023.106495
Sun, M. D., Zhang, L. H., Hu, Q. H., Pan, Z. J., Yu, B. S., Sun, L. W., et al. (2020). Multiscale connectivity characterization of marine shales in southern China by fluid intrusion, small-angle neutron scattering (SANS), and FIB-SEM. Mar. Petroleum Geol. 112, 104101. doi:10.1016/j.marpetgeo.2019.104101
Teng, J., Liu, B., Mastalerz, M., and Schieber, J. (2022). Origin of organic matter and organic pores in the overmature ordovician-silurian wufeng-longmaxi shale of the Sichuan Basin, China. Int. J. Coal Geol. 253, 103970. doi:10.1016/j.coal.2022.103970
Wang, L. C., Zhang, W., Cao, Z. Z., Xue, Y., and Xiong, F. (2025). Coupled effects of the anisotropic permeability and adsorption-induced deformation on the hydrogen and carbon reservoir extraction dynamics. Phys. Fluids 37, 066608. doi:10.1063/5.0270765
Wang, R. Y., Ding, W. L., Gong, D. J., Zeng, W. T., Wang, X. H., Zhou, X. H., et al. (2016). Development characteristics and major controlling factors of shale fractures in the Lower Cambrian niutitang formation, southeastern Chongqing-northern Guizhou area. Acta Pet. Sin. 37 (07), 832–845. doi:10.7623/syxb201607002
Wang, Y. M., Huang, J. L., Li, X. J., Dong, D. Z., Wang, S. F., and Guan, Q. Z. (2015). Quantitative characterization of fractures and pores in shale beds of the Lower Silurian, longmaxi formation, Sichuan Basin. Nat. Gas. Ind. B 35 (09), 481–488. doi:10.1016/j.ngib.2015.12.002
Yang, G. Q., Zeng, J. H., Qiao, J. C., Liu, Y. Z., Liu, S. N., Jia, W. T., et al. (2022). Role of organic matter, mineral, and rock fabric in the full-scale pore and fracture network development in the mixed lacustrine source rock system. Energy and Fuels 36 (15), 8161–8179. doi:10.1021/acs.energyfuels.2c01484
Yang, R., Hu, Q. H., He, S., Hao, F., Guo, X. S., Yi, J. Z., et al. (2019). Wettability and connectivity of overmature shales in the fuling gas field, Sichuan Basin (China). AAPG Bull. 103 (3), 653–689. doi:10.1306/09051817138
Yang, W., Cai, J. F., Wang, Q. Y., Cui, Z. J., Cui, Z., Xu, L., et al. (2020). The controlling effect of organic matter coupling with organic matter porosity on shale gas enrichment of the wufeng-longmaxi marine shale. Petroleum Sci. Bull. 5 (2), 148–160. doi:10.3969/j.issn.2096-1693.2020.02.015
Yang, W., Yang, R., Wang, M., Bao, S. J., Yang, L. L., Hou, H. D., et al. (2025). Impact of lithofacies categories on inflection-point behaviors in micro-nano pore-structure evolution: implications for differential reservoir-forming mechanisms and “sweet-spot intervals” identification for marine gas shales. Mar. Petroleum Geol. 176, 107336. doi:10.1016/j.marpetgeo.2025.107336
Yu, Y. X., Luo, X. R., Wang, Z. X., Cheng, M., Lei, Y. H., Zhang, L. K., et al. (2019). A new correction method for mercury injection capillary pressure (MICP) to characterize the pore structure of shale. J. Nat. Gas Sci. Eng. 68, 102896. doi:10.1016/j.jngse.2019.05.009
Zhang, J. C., Xu, B., Nie, H. K., Wang, Z. Y., Lin, T., Jiang, S. L., et al. (2008). Exploration potential of shale gas resources in China. Nat. Gas. Ind. 28 (6), 136–140. doi:10.3787/j.issn.1000-0976.2008.06.040
Zhao, W. Z., Jia, A. L., Wei, Y. S., Wang, J. L., and Zhu, H. Q. (2020). Progress in shale gas exploration in China and prospects for future development. China Pet. Explor. 25 (1), 31–44. doi:10.3969/j.issn.1672-7703.2020.01.004
Zhou, X. J., Yong, R., Fan, Y., Zeng, B., Song, Y., Guo, X. W., et al. (2020). Influence of natural fractures on fracturing of horizontal shale gas wells and process adjustment. China Pet. Explor. 25 (06), 94–104. doi:10.3969/j.issn.1672-7703.2020.06.010
Keywords: pore-fracture characteristic, pore-fracture combination type, shale gas reservoir, longmaxi formation, geological significance
Citation: Hu Z, Duan X, Fu Y, Chang Y, Chang J, Jiang Y and Yu L (2025) Microscopic pore-fracture combination types and their impact on exploration and development: in case of deep shale gas reservoirs in the Luzhou area of the Sichuan Basin. Front. Earth Sci. 13:1640726. doi: 10.3389/feart.2025.1640726
Received: 04 June 2025; Accepted: 17 July 2025;
Published: 04 August 2025.
Edited by:
Chao Yang, Chinese Academy of Sciences (CAS), ChinaReviewed by:
Zhengzheng Cao, Henan Polytechnic University, ChinaWei Yang, China University of Petroleum, Beijing, China
Yijun Zheng, Chinese Academy of Sciences (CAS), China
Copyright © 2025 Hu, Duan, Fu, Chang, Chang, Jiang and Yu. This is an open-access article distributed under the terms of the Creative Commons Attribution License (CC BY). The use, distribution or reproduction in other forums is permitted, provided the original author(s) and the copyright owner(s) are credited and that the original publication in this journal is cited, in accordance with accepted academic practice. No use, distribution or reproduction is permitted which does not comply with these terms.
*Correspondence: Yonghong Fu, ZnloX3N3cHVAMTYzLmNvbQ==