 Eñaut Izagirre1,2,3*
 Gino Casassa4,5
 Inés Dussaillant6
 Evan S. Miles7
 Ryan Wilson8
 Camilo Rada4
 Sérgio H. Faria2,9Iñaki Antiguedad1
- 1Hydro-Environmental Processes Research Group, University of the Basque Country UPV/EHU, Leioa, Spain
- 2Basque Centre for Climate Change BC3, Leioa, Spain
- 3Instituto Pirenaico de Ecología, Consejo Superior de Investigaciones Científicas (IPE-CSIC), Zaragoza, Spain
- 4Centro de Investigación Gaia Antártica, Universidad de Magallanes UMAG, Punta Arenas, Chile
- 5Instituto Antártico Chileno INACH, Punta Arenas, Chile
- 6Department of Geography, University of Zurich, Zurich, Switzerland
- 7Swiss Federal Institute for Forest, Snow and Landscape Research WSL, Birmensdorf, Switzerland
- 8Department of Physical and Life Sciences, University of Huddersfield, Huddersfield, United Kingdom
- 9IKERBASQUE, Basque Foundation of Science, Bilbao, Spain
The rapid retreat of mountain glaciers due to climate change has led to the expansion of glacial lakes, which can produce sudden glacial lake outburst floods (GLOFs) due to the failure of unstable moraine or glacier dams, in some cases triggering a cascade of consequences. This study investigates the evolution of glacial lakes and the occurrence of GLOFs in the Cordillera Darwin and Cloue Icefields of Tierra del Fuego, southernmost South America, from 1945 to 2024 — a region that has not been analysed in detail before. Using historical aerial imagery, satellite data, UAV photogrammetry and field surveys, we document a 461% increase in the number of lakes (from 33 to 185) and a 124% increase in lake area (from 28.2 ± 5.6 to 63.3 ± 1.9 km2) as a result of glacier retreat. A pronounced shift from ice-dammed (71.6%–14.8% of the total area) to moraine-dammed lakes (80.5% by 2024) reflects the destabilisation of the ice margins and the exposure of overdeepened basins. We identified the first recorded southernmost GLOFs in this region, including a moraine collapse in 1997/98 that released ∼8.3 ± 1.2 × 10⁶ m3 of water and a larger, adjacent cascading event in 2018 that released 28.3 × 10⁶ m3 of water through successive moraine dam breaches. The cyclic outflows of the ice-dammed Lago Mateo Martinic (1985–2024) underline the dynamic interactions between ice and water. The results are consistent with global patterns of accelerated lake formation and growth over the last century, and with the diverse and complex processes at GLOFs that make Tierra del Fuego an important natural laboratory for studying the deglacierising environment. This study improves the understanding of glacial lake dynamics in the little-studied southern latitudes and emphasises the accelerated transformation of Andean cryospheric landscapes as warming progresses.
1 Introduction
The global retreat of mountain glaciers and icefields in response to climate change has dramatically increased both the size and number of glacial lake systems, a trend observed in all mountain regions worldwide (Shugar et al., 2020; Zhang G et al., 2024). This decline has intensified since the end of the Little Ice Age (LIA; Roe et al., 2017; Zemp et al., 2015), with much of the accelerated retreat and mass loss in recent decades due to rising air temperatures and changing precipitation patterns (Kargel et al., 2014; Marzeion et al., 2014; Zemp et al., 2019; Faria et al., 2021; Hugonnet et al., 2021; Zemp et al., 2025).
Glacial lakes have become prominent features of many deglacierising environments and are of great global and regional importance for several reasons: (1) they serve as a valuable water resource, with their current and future storage capacity playing a key role in regulating the contribution of ice melt to global sea level rise (Loriaux and Casassa, 2013; Carrivick et al., 2016; Wilson et al., 2018; Zhang et al., 2023); (2) their interaction with glaciers can negatively affect their mass balance by increasing melt rates and destabilising ice margins (Benn et al., 2007; King et al., 2019; Sugiyama et al., 2019; Minowa et al., 2021; Langhamer et al., 2024); and (3) they pose a significant hazard as a source of glacial lake outburst floods (GLOFs), which are among the most destructive glacial hazards and can cause widespread damage and disaster (Reynolds, 1992; Dussaillant et al., 2010; Iribarren Anacona et al., 2015b; Taylor et al., 2023). As described in Westoby et al. (2014), GLOFs are complex, often unpredictable phenomena, with each event influenced by a number of factors, including triggering mechanisms (hydrometeorological, geomorphological, etc.), reservoir bathymetry, geometry, composition and structural integrity of the dam (either a moraine, glacier ice, bedrock or a combination of these). In addition, the topography and geology of the surrounding region play a critical role in promoting glacial lake development and shaping flood behaviour and impacts (Holm et al., 2004; Carrivick and Tweed, 2013; Allen et al., 2016).
Glacial lakes can cause sudden floods (GLOFs) resulting from the failure of an unstable dam, triggering hazard cascades with numerous downstream impacts (Veh et al., 2023). They are typically classified based on their dam type and geomorphologic context (Carrivick and Tweed, 2013; Tweed and Carrivick, 2015; Zhang T. et al., 2024), and how their characteristics might influence any potential GLOF, the likelihood of recurrent GLOF events and their long-term areal change (Rick et al., 2022; Veh et al., 2022). Moraine-dammed lakes, which often form behind unconsolidated debris left behind by retreating glaciers, are prone to instability due to their porous and weak structure (Richardson and Reynolds, 2000; Harrison et al., 2018). Similarly, landslide-dammed lakes also present an unconsolidated structure of poorly sorted, often angular material (Korup and Tweed, 2007). In contrast, ice-dammed lakes are formed by meltwater accumulating at the edges of the glacier ice and are prone to draining when thresholds are met related to ice thickness change, lake bathymetry, subglacial water pressure and thermal conditions (Liestøl, 1956; Walder and Costa, 1996; Tweed and Russell, 1999; Gilbert et al., 2012). Other types of glacial lakes, such as bedrock-dammed lakes may have greater stability but are not immune to failure under certain geomorphologic and climatic conditions (Richardson and Reynolds, 2000; Carrivick and Tweed, 2013; 2016).
Advances in remote sensing technology and geographic information systems (GIS) have enabled significant progress in understanding the factors that influence the formation and extent of glacial lakes (Quincey et al., 2005, 2007; Bolch et al., 2008). Satellite data and GIS analyses allow accurate monitoring of glacier changes, lake evolution and the occurrence of GLOFs (Veh et al., 2022; Zhang G. et al., 2024). In particular, these tools (supported by high-resolution aerial imagery) have proven valuable to assess their triggering mechanisms and quantify the associated hazards at local (Iribarren Anacona et al., 2018; Wilson et al., 2019), regional (Iribarren Anacona et al., 2014; Colavitto et al., 2024) and global scales (Taylor et al., 2023).
In South America, studies have documented accelerated glacier retreat in the Andean Cordillera since the end of the LIA (e.g., Carrivick et al., 2024), and significant mass loss in recent decades (e.g., Braun et al., 2019; Dussaillant et al., 2019). These changes in glacier mass balance and dynamics from the central Andes to southern Patagonia are accompanied by the formation and expansion of glacial lakes, as the number and areal extent of glacial lakes in this region increased by about 7% and 43% respectively, between 1986 and 2016 (Wilson et al., 2018). The “Chilean Public Inventory of Glacial Lakes” identifies ∼5,400 glacial lakes across the country, with the largest concentration in the southernmost glaciological macrozone (Zona Austral), which includes southern Patagonia and Tierra del Fuego (DGA, 2023). Although GLOFs have been recorded in many regions of Patagonia, including the Northern and Southern Patagonia Icefields, detailed studies of their triggers and threshold conditions remain limited; they have highlighted the importance of local topography, climate variability and dam stability in the occurrence and magnitude of GLOF events (Dussaillant et al., 2010; Iribarren Anacona et al., 2014; Wilson et al., 2019; Colavitto et al., 2024).
In the southernmost Andes, the Tierra del Fuego archipelago has undergone similar changes as observed elsewhere in Patagonia. The outlet glaciers of the Cordillera Darwin and the Cloue Icefields, for example, have retreated rapidly since 1986, shrinking by around 14% in area between the LIA and 2016 (Davies and Glasser, 2012; Meier et al., 2018). This retreat has led to the expansion of glacial lakes (Shugar et al., 2020), but no study to date has investigated in detail how this retreat has affected the evolution of glacial lakes or whether new GLOFs have occurred in this region. These glacial lakes and GLOFs do not present hazards to any human settlements or infrastructure, as this domain is entirely unsettled. In contrast to other regions in the Andes, the studied region therefore offers a particularly interesting natural laboratory for investigating the evolution of glacial lakes and GLOFs in a study region that remains remarkably free from local human disturbances. Unlike heavily monitored glacial environments, where artificial drainage, hazard mitigation or proximity to infrastructure direct research priorities towards hazardous lakes, the isolation of Tierra del Fuego ensures that all lakes (regardless of their outburst potential) are equally scrutinised. In addition, the low hydraulic gradient of the archipelago, with many lakes perched near sea level, limits the erosive power and geomorphic impact of GLOFs compared to high relief mountainous regions. Documenting this remote region not only extends the geographic range of GLOF inventories (Lützow et al., 2023), but also contributes to emerging research on the interaction between glacial drainage and coastal landscapes during deglacierisation, complementing recent work in Patagonian-Fuegian fjord systems (Bertrand et al., 2017; Vandekerkhove et al., 2021; Piret et al., 2022), with a focus on the characteristic low-lying, maritime environment of Tierra del Fuego.
This study has three objectives: (1) to analyse the evolution of glacial lakes in the Cordillera Darwin and Cloue Icefields since 1945, (2) to document recent GLOFs and their characteristics in the Tierra del Fuego archipelago, and (3) to explore possible GLOF drainage mechanisms, placing these results in the broader context of GLOF occurrence in the southernmost Andes. By achieving these objectives, this study aims to improve the understanding of GLOFs in this understudied region and contribute to the broader discourse on the variable growth and expansion of glacial lakes in the context of ongoing climate-induced glacier retreat.
2 Study region
The Cordillera Darwin Icefield (CDI) is located near the southernmost reaches of the Andes in Tierra del Fuego and is the third largest temperate icefield in the Southern Hemisphere (Figure 1; Bertrand et al., 2017; Melkonian et al., 2013; Temme et al., 2025). The CDI (54°39′S, 69°36′W) is bounded by the Canal Beagle to the south and the Fiordo Almirantazgo to the north, with the highest peak, Monte Shipton, at 2,568 m above sea level (asl). The CDI covered an area of approximately 1,656 km2 in 2022 (Izagirre et al., 2024), and is characterised by a complex network of gently sloping high-plateaus from which land-terminating and calving outlet glaciers flow into the fjords and lakes (Holmlund and Fuenzalida, 1995; Porter and Santana, 2003). Around the icefield, there are smaller ice masses to the west, including the Monte Sarmiento massif and the Cordón Navarro range (totalling 179 km2 in 2016; Meier et al., 2018; González, 2019), as well as many other smaller glaciers in the eastern lower mountain ranges.
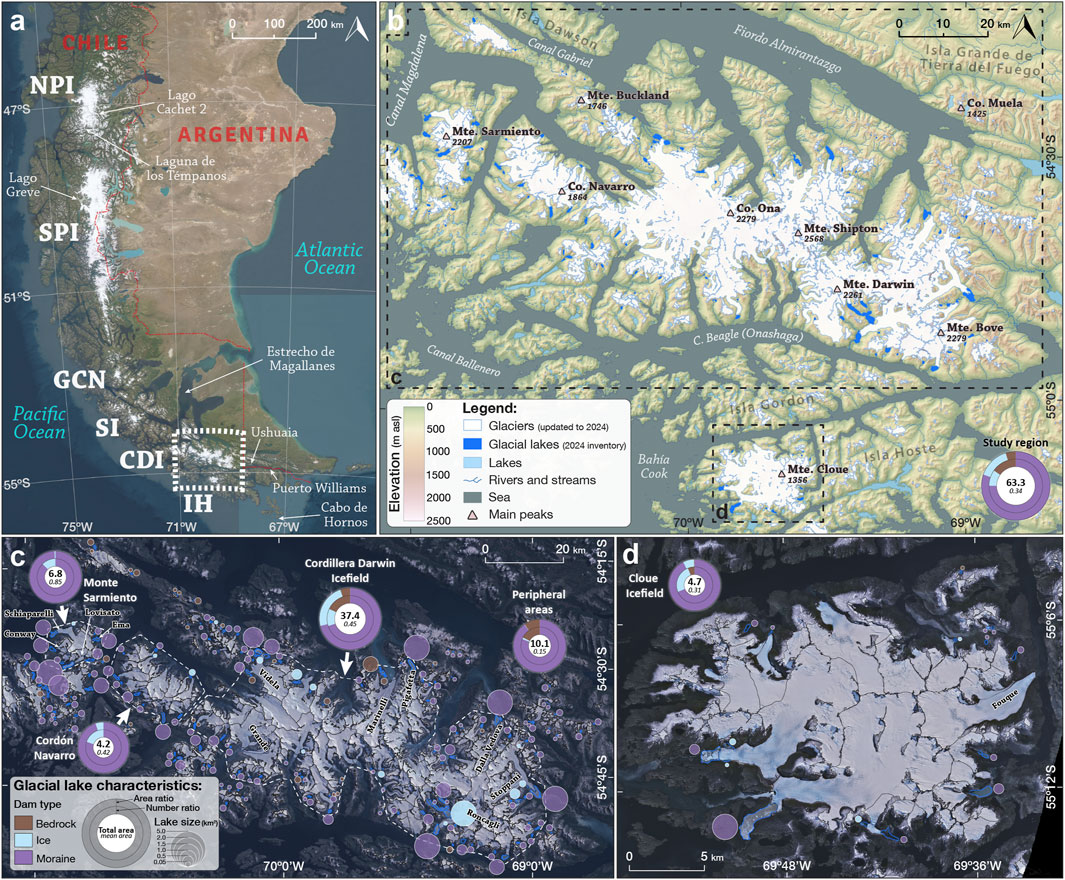
Figure 1. Location map and overview of the study region showing the inventory and characteristics of glacial lakes in 2024. (a) Southern South America and the distribution of modern icefields (labelled with acronyms), together with the location of the study region in Tierra del Fuego (dashed white rectangle) and other main locations mentioned in the text. NPI: Northern Patagonia Icefield; SPI; Southern Patagonia Icefield; GCN: Gran Campo Nevado; SI: Santa Inés; CDI: Cordillera Darwin Icefield; IH: Isla Hoste (Cloue Icefield). (b) Main geographical features of the CDI, IH and surrounding areas, together with the places mentioned in the text. The boxes indicate the location and labelling of additional figures presented in the following sections. The current glacier outlines have been updated to 2024 from the ‘Chilean Public Inventory of Glaciers’ (DGA, 2022). (c) Inventory and characteristics of glacial lakes (2024) of the CDI, Monte Sarmiento massif, Cordón Navarro range and peripheral areas, shown on a Sentinel-2 image from 4 March 2024, using a real colour composition with saturation enhanced by the near-infrared band. (d) Inventory and characteristics of glacial lakes (2024) of the Cloue Icefield (IH), shown on a Sentinel-2 image from 4 March 2024, using a similar setting as in the previous subfigure.
The Cordillera Darwin is a geologically unique structural high point, as the mountain range is on average 1 km higher than neighbouring areas (Cunningham, 1995), and it is located in the present-day core of the southern westerlies, which provides relatively consistent precipitation throughout the year (Garreaud et al., 2013). The Cordillera Darwin range creates an orographic barrier resulting in a strong W-E climate gradient characterised by a cold-maritime climate at the western and southwestern margins with high precipitation rates (up to 5,000 mm yr−1 at the top of the icefield) and relatively mild temperatures due to its proximity to the ocean (Holmlund and Fuenzalida, 1995; Carrasco et al., 2002; Koppes et al., 2009; Fernandez et al., 2011). In contrast, precipitation decreases sharply towards the eastern slopes, along with a steppe-like climate with higher temperatures to the northeast and east of the mountain range (Holmlund and Fuenzalida, 1995; Strelin and Iturraspe, 2007; Reynhout et al., 2021).
Isla Hoste, located southeast of the CDI and separated by the SW arm of the Canal Beagle, is the second largest island in the Tierra del Fuego archipelago. It is characterised by a rugged topography with numerous fjords and inlets. The island’s climate is also strongly influenced by southerly westerly winds, resulting in high and relatively uniform annual precipitation (up to 2,000 mm yr−1 in the westernmost areas) and persistent cloud cover that decreases towards the east (Carrasco et al., 2002; Santana et al., 2006; Garreaud et al., 2013). These climatic conditions have favoured the persistence of several small glaciers and a small icefield on Isla Hoste (Figure 1b), which covered an area of approximately 203 km2 in 2016 (Meier et al., 2018), and accounts for 50% of the glacierised terrain on the island (Bown et al., 2014). The Cloue Icefield (55°10′S, 69°43′W) and the peninsula on which it is located were first explored, photographed, described and named by the Romanche expedition in 1882–83 (Hyades, 1887; Mercer, 1967). It has an average elevation of 750 m, peaking at Monte Cloue (1,356 m asl), and is drained by 12 main outlet glaciers, five of which reach sea level and seven of which flow into lakes.
Human presence in the region is limited to sparse coastal settlements, mainly Ushuaia, Argentina (∼80,000 inhabitants) 40 km east of the CDI, and Puerto Williams, Chile (∼2,500 inhabitants) 85 km to the east. The Cordillera Darwin and Cloue Icefields are still uninhabited wilderness areas with permanent infrastructure only on the eastern edges of the CDI (e.g., Bahía Yendegaia). While the Canal Beagle serves as a shipping line for scientific, tourist and military vessels, the most significant anthropogenic impact on the ecosystem comes from the North American beaver (Castor canadensis), which was introduced in the 1946 (Skewes et al., 2006; Choi, 2008; Pietrek and Fasola, 2014). Through the construction of dams, they have considerably altered the eastern watersheds, while the western areas of the Cordillera Darwin and Cloue Icefields are less affected due to steeper topography and limited ecological connectivity (Westbrook et al., 2017; Herrera et al., 2020). This combination of minimal direct human disturbance and limited beaver activity makes the region particularly valuable for the study of natural cryospheric and geomorphological processes.
3 Data and methods
Our first objective is to produce inventories of glacial lakes covering this broad region from the 1940’s to the present day. Since the Cordillera Darwin and Cloue Icefields extend over a wide area with frequent cloud cover, there are scarce remote sensing data covering the entire area during this period. Therefore, a compilation of different sources was needed to conduct this study. Table 1 lists the sources of aerial and satellite data used for the glacial lake inventories in 1945, 1986, 2006, 2019 and 2024. The intermediate observation years 1986 and 2006 are similar to those used by Meier et al. (2018) for the glacier inventory in this region.
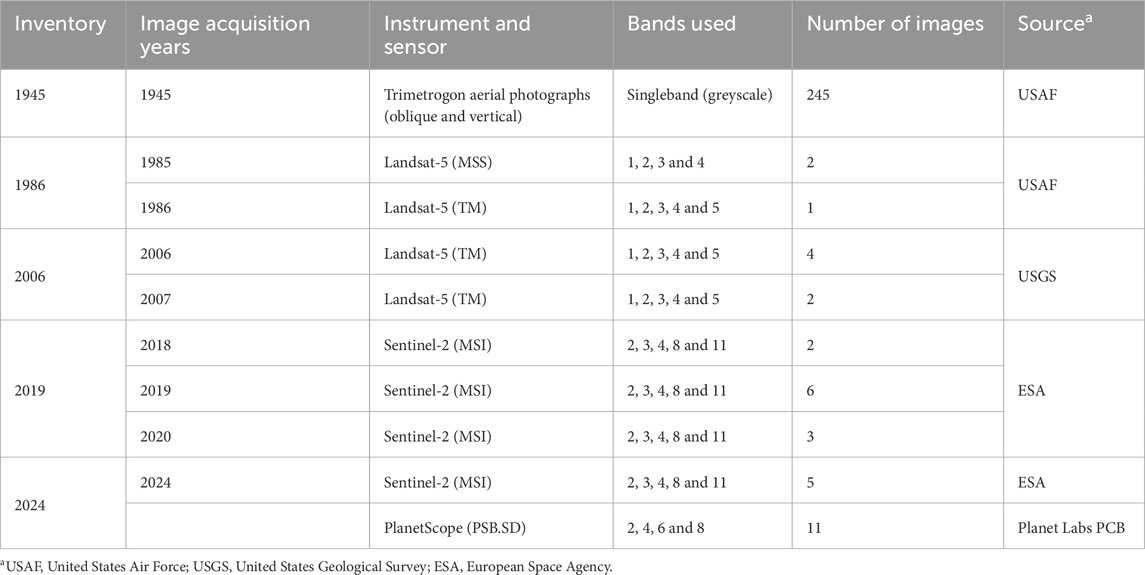
Table 1. List of remote sensing aerial and satellite data used to compile the glacial lake inventories of 1945, 1986, 2006, 2019 and 2024. The actual image data for each satellite-based inventory differed by ± 1 year from its target year (1986, 2006, 2019 and 2024). However, most of the lakes included in each inventory were mapped using imagery acquired in the specified target years.
3.1 Historical aerial photographs and Lliboutry’s sketch map
The oldest available data set for this region are the Trimetrogon aerial photographs acquired by the U.S. Army Air Force (USAF) in the austral summer of 1944/45 (Figures 2a,b). The aerial survey, conducted in January and February of 1945, represents the first comprehensive airborne coverage of the CDI and Cloue Icefield and provides a valuable basis for assessing glacial and geomorphologic change over the past eight decades (Lliboutry, 1998). The survey was strategically carried out in mid-summer to ensure optimal conditions for snow and ice melt, which in most areas allows glacial lakes to be clearly distinguished from ice and land areas. However, the spatial resolution of the USAF Trimetrogon photographs is limited by the variable image quality, incomplete coverage of some areas, the flight line spacing and the oblique view of the left- and right-looking acquisitions, even resulting in gaps in some places that make it difficult to distinguish these features. In addition, the 1:250,000 scale preliminary maps produced by the Instituto Geográfico Militar (IGM) of Chile based on these photographs often lack precise delineations of glacial and hydrological features, further complicating their interpretation (Lopez et al., 2010).
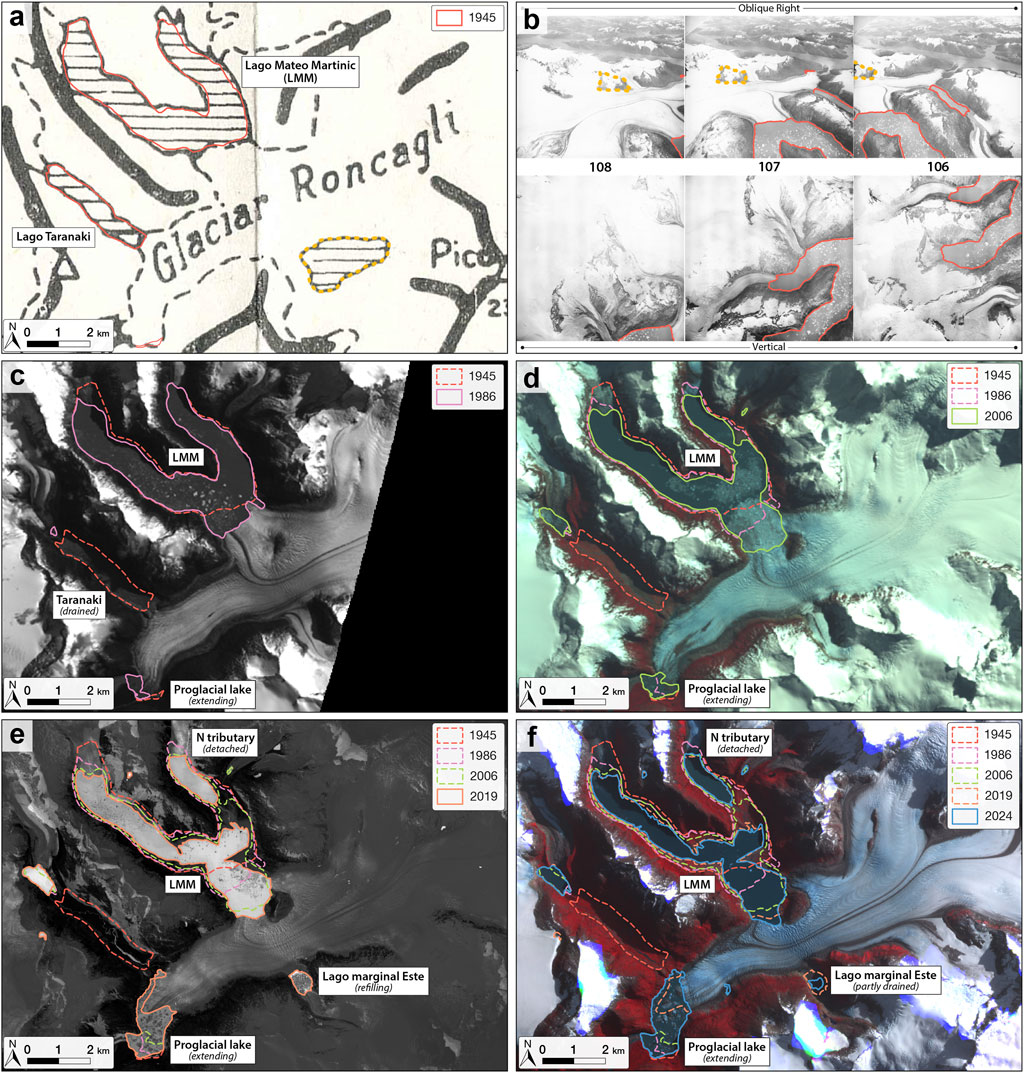
Figure 2. Methodology for reconstructing the evolution of glacial lakes in the study region using the Roncagli/Alemania glacier (Glaciar Roncagli in the figure) as an example. (a) Historical cartography by Lliboutry (1956) showing the extent of the glaciers and an early glacial lake configuration in 1945 (labelled), also confirmed by geomorphologic landforms such as the former lake shorelines mapped by Izagirre et al. (2024). The dashed polygon (in yellow) marks a mountain area using the same symbolism as a glacial lake. (b) Interpretation of oblique and vertical aerial photographs acquired during the USAF Trimetrogon campaign in early 1945. The use of these photographs together with the previous map is crucial to distinguish the real glacial lakes in 1945 from other rugged mountain landscapes (yellow dashed polygon). (c) Visible green band (2) of the Landsat-5 TM image from 26 February 1986. Lago Taranaki is already drained, while Lago Mateo Martinic (LMM) and the proglacial terminal lake continue to expand. (d) False colour composite of the Landsat-5 TM image acquired on 8 October 2006. (e) Ratio composite (R = BGreen/BNIR) of the Sentinel-2 MSI image from 4 February 2019. (f) Final reconstruction with the integration of the false colour composite of the PlanetScope image acquired on 4 March 2024, showing glacier retreat and glacial lake extent and change over eight decades.
The original USAF Trimetrogon photographs, from 1944/45, served as the basis for the sketch maps published by Louis Lliboutry in his seminal work “Nieves y Glaciares de Chile” (Lliboutry, 1956). One of these maps covers the entire CDI and its surroundings and provides a detailed representation of the extent of the glaciers and the location of the glacial lakes as they existed in 1945, providing an important historical reference for the study of glacier dynamics in the region. For this purpose, Lliboutry’s sketch map was georeferenced with 132 off-glacier tie-points manually identified on high-resolution “ESRI Imagery” available via “QuickMapServices” in the QGIS software (v3.40.5-Bratislava). In the case of the two icefields and considering that the Cloue Icefield was not included in Lliboutry’s sketch map, the preliminary location and extent of the glacial lakes identified with the sketch map were manually improved by (1) using the individual USAF Trimetrogon photographs (Table 1) and (2) using the previously mapped geomorphologic landforms (former lake shorelines from Izagirre et al., 2024).
It should be noted that Lliboutry’s work remains a cornerstone in the glaciological literature of the Southern Andes, as it not only documents the state of the CDI and surrounding mountain ranges in the mid 20th century, but also establishes a methodological framework for the integration of aerial photography into glaciological studies. Despite its historical significance, the map’s utility is reduced by the limitations of the original photographic data. Nevertheless, these early datasets are invaluable for reconstructing the long-term evolution of glaciers and glacial lakes, especially when combined with modern remote sensing technologies and field observations (Rivera et al., 1997; Harrison et al., 2007; Wilson et al., 2016; Piret et al., 2021; Gorsic et al., 2025).
3.2 Satellite imagery
To create the glacial lake inventories for the observation years 1986, 2006, 2019 and 2024, we used a combination of Landsat-5, Sentinel-2 and PlanetScope satellite imagery (Table 1; Supplementary Table S1). All Landsat-5 MSS and TM scenes with a multispectral spatial resolution of 30 m were orthorectified by the United States Geological Survey (USGS) and obtained as Level 1 Products through the USGS Earth Explorer interface (https://earthexplorer.usgs.gov/).
For the 2019 inventory, we analysed nine Sentinel-2 MSI scenes with a multispectral spatial resolution of 10 m. The Sentinel-2 MSI scenes were orthorectified by the European Space Agency (ESA) and downloaded as Level-1C Products from the Copernicus Browser interface (https://browser.dataspace.copernicus.eu/). The 2024 inventory was derived from five Sentinel-2 MSI scenes, complemented by 11 high-resolution PlanetScope scenes (∼3 m multispectral spatial resolution) from 4 March 2024 (Planet Team, 2024).
All satellite scenes were carefully selected based on minimal cloud cover and a late summer acquisition date to ensure optimal conditions for distinguishing surface boundaries such as ice/snow, glacier/rock, glacier/lake and lake/floating ice. However, due to challenges such as snow cover, cloud obstruction and mountain shadows, in some target years (e.g., 1986, 2006 and 2019) scenes from a ±1 year period had to be included to ensure adequate image availability and quality. This approach allowed us to maintain consistency in the identification and mapping of glacial lakes across the study period.
3.3 Glacial lake definition and delineation
The first step in establishing our glacial lake inventory was to define which lakes should be included. Given that the study region was extensively covered by the Patagonian Ice Sheet during the last glacial cycle, many lakes in the area could be classified as glacial in origin (Davies et al., 2020). However, to focus on lakes most relevant to modern glacier dynamics, we restricted our analysis to the present-day ice-contact lakes of the Cordillera Darwin and Cloue Icefields and their surroundings, as well as the lakes that formed after the end of the LIA and are still in contact with or separated from the present-day glacier margins. Lakes in direct contact with glaciers are particularly dynamic and have likely undergone the greatest changes since the end of the LIA (Loriaux and Casassa, 2013; Izagirre et al., 2024). These lakes are also more likely to experience significant changes in size, volume and stability due to their interaction with glacial and paraglacial processes (Harrison et al., 2018; Wilson et al., 2018). To identify these lakes, we compared LIA glacier extents mapped by Davies and Glasser (2012), Meier et al. (2018) and Carrivick et al. (2024) with historical USAF Trimetrogon photographs and recent glacial landform mappings by Izagirre et al. (2024).
We classified glacial lakes into three main types based on their formation mechanisms: (1) moraine-dammed lakes, which form adjacent to glacier termini and are impounded by frontal or terminal moraines; (2) ice-dammed lakes, which are impounded by glacier ice, often in tributary valleys or marginal depressions on the side of the glacier; and (3) bedrock-dammed lakes, which occupy overdeepenings and depressions in bedrock. These classifications help to understand the geomorphic processes driving lake formation and their potential for future changes. In addition, we categorised the lakes according to their area size to facilitate the analysis of size-dependent behaviours. Small lakes are defined as lakes with an area of less than 0.5 km2 and large lakes with an area of 0.5 km2 or more. This classification corresponds to the thresholds used in comparable studies in Patagonia (e.g., Loriaux and Casassa, 2013) and effectively captures the different behaviours observed in the study region.
Glacial lakes were delineated using a combination of semi-automatic and manual mapping techniques. The semi-automatic approach employed the normalized difference water index (NDWI) and a ratio-based method (R) proposed by Gardelle et al. (2011), which distinguishes water from non-water surfaces using the formula:
where BGreen and BNIR represent the green and near-infrared spectral band values, respectively. While NDWI is widely used for water detection, it can misclassify shadowed areas as water, particularly along lake margins (Huggel et al., 2002). The ratio-based method (R) mitigates this issue but can struggle to differentiate between ice and water at calving fronts (Loriaux and Casassa, 2013). To address these challenges, we incorporated a terrain slope threshold derived from a 30-meter resolution digital elevation model (DEM) from the NASA Shuttle Radar Topography Mission (SRTM GL1) Global 1 arcsec degree of the year 2000 from Open Topography repository (NASA Shuttle Radar Topography Mission, 2013). Lakes were assumed to occupy areas with surface slopes below 10% (5.7°), accounting for DEM uncertainties and resolution limitations (Gardelle et al., 2011).
Manual refinement of the semi-automated classifications was essential to ensure accuracy, particularly in complex areas such as shadowed margins, calving fronts and regions with mixed ice-water boundaries. This labour-intensive process involved visually inspecting and correcting lake boundaries using false-colour composites of satellite imagery (Figures 2c–f; Supplementary Table S1). This step also ensured that turbid lakes with high suspended sediment loads—which reduce spectral contrast and can be misclassified using ratio-based methods—were correctly identified and included in the inventory. Manual refinement significantly improved the quality of the lake polygons, ensuring consistency and high accuracy in the final inventory (Wilson et al., 2018).
Mapping errors and uncertainties were inherent in our approach, particularly for earlier observation years (1945, 1986 and 2006) due to the coarser spatial resolution of the available image data (e.g., Landsat-5 MSS and TM in 1986 and 2006) and the exclusively manual delineation in 1945. In this respect, small lakes were probably underrepresented in the early inventories (1945 and 1986) as the coarser resolution of the images possibly increased the apparent growth rates. Errors were also influenced by factors such as cloud cover, snow cover and mountain shadows, which can obscure lake boundaries and thus lead to minor biases (Gardelle et al., 2011; Loriaux and Casassa, 2013; Wilson et al., 2018). To minimise these uncertainties, we used high-resolution PlanetScope imagery (3 m) for the 2024 inventory, which provides a more accurate reference for validating previous datasets. Despite these efforts, uncertainties in lake area calculations vary considerably across time periods due to differences in image resolution and validation sources. Earlier estimates (e.g., ± 20% in 1945 and ±15% in 1986) reflect the limitations of historical images with lower resolution, while modern measurements achieve much higher precision thanks to higher resolution data (e.g., ± 5% in 2019 with Sentinel-2 and ±3% in 2024 with PlanetScope). To account for these variations, we include a mapping error of at least 1 pixel along all lake perimeters.
3.4 GLOF identification and field observations
In this study, we hypothesised that changes in glacial lakes between 1945 and 2024 could reveal previously undocumented drainage events in the Cordillera Darwin and Cloue Icefields. We classify these events into two categories based on hydrological and terrestrial geomorphological evidence: (1) Outflows, defined as usually rapid discharges of water from ice-dammed lakes that often leave stranded icebergs but have limited distal impact due to buffering by downstream water bodies (lakes or sea) and may occur in cyclic events; (2) Outbursts (or GLOFs), characterised by single or cascading, sudden high-magnitude water releases that produce clear geomorphological signatures beyond the lake basin, including breached moraines and downstream sediment deposits.
Cyclic events such as those at Lago Mateo Martinic are poorly documented in existing studies (Iturraspe, 2011; Iribarren Anacona et al., 2015b; Izagirre et al., 2024). To fill this gap, we combined remote sensing analyses with field observations conducted between 2016 and 2024 and focused on areas with known or suspected outflow or GLOF activity. These included the inner part of Fiordo Fouque (Cloue Icefield) and the Roncagli/Alemania glacier system (CDI).
Field data collection included site reconnaissance, photo-documentation and validation of remote sensing interpretations to constrain the timing and magnitude of GLOF events. This process included an extension of satellite image coverage to identify annual variations (Supplementary Table S1) and detailed geomorphologic mapping of diagnostic GLOF features, such as breached moraines, flood channels and sedimentary deposits, as described by Izagirre et al. (2024). In addition, we collected first-hand accounts from local sailors and residents of Puerto Williams that gave us valuable insights into the dynamics of GLOFs, particularly the events of 1997/98 and 2018 in the inner part of the Fiordo Fouque. These interviews helped reconstruct the sequence of events and assess the geomorphological changes associated with GLOFs.
In March 2016, we visited the area of Lago Covadonga in the inner part of Fiordo Fouque to document the landscape changes caused by the GLOF event in 1997/98. Using a Nikon Coolpix AW100 (16 Mp), we acquired 356 overlapping photos along survey circuits around the terminal moraine and the breached section. These images were processed using structure-from-motion (SfM) techniques in Agisoft Metashape Professional (v2.2.0) to create an initial 3D point cloud model. As the camera’s geotags provided only limited positional accuracy, the 3D model was subsequently georeferenced using 50 virtual ground control points (GCPs) from high-resolution satellite imagery, supplemented by handheld Garmin etrex30 GPS waypoints (±5 m elevation precision) collected along the lake shoreline and moraine ridge. From the georeferenced 3D point cloud, we derived a DEM that formed the basis for estimating lake level and volume change. While no independent GCP set was available for formal accuracy validation, the use of a large number of virtual GCPs, in combination with on-sited GPS waypoints and cross-comparisons of the lake shoreline with foliage patterns clearly visible in 2016, helped to minimise horizontal and vertical uncertainties. Using this reconstruction, we estimated the lowering of the lake level and the area change after the GLOF event and finally calculated the released water volume using a first-order approximation based on the mean area multiplied by the elevation change.
In order to document the geomorphological changes caused by the 2018 GLOF event in the inner part of Fiordo Fouque, we carried out an unmanned aerial vehicle (UAV) survey with a DJI Mavic 2 Pro in August 2024. The high-resolution aerial images were processed with SfM in Agisoft Metashape to create an initial 3D model covering an area of 1.33 km2. Since there were no differential GNSS camera positions during our survey, we took special measures to correct lens distortions and minimise model warping. We created 11 synthetic GCPs along the shoreline of both the current and former areas of the lower lake (Lake 2). These synthetic GCPs—defined as points with x-y-z coordinates extracted from the initial 3D model—helped to compensate for elevation differences of several metres observed along the shoreline due to geolocation inaccuracies and imperfect lens distortion corrections. In the final 3D model, we constrained these GCPs to zero elevation (all are shoreline points) and set their positional uncertainties to 15 m (x, y) and 0.1 m (z) to prevent error propagation into the lens distortion parameters. The conservative horizontal value reflects the maximum expected drift of the UAV’s non-differential GNSS receiver, while the vertical threshold accounts for both pixel-level selection errors (≤0.1 m at 0.05 m resolution) and our use of instantaneous sea level as a zero-elevation reference.
This approach successfully generated flat water surfaces and reduced shoreline elevation differences to centimetre accuracy, with lens distortion residuals equal to or less than 1 pixel. Using the optimised model, we generated an orthomosaic with a resolution of 0.05 m and a DEM with a resolution of 0.20 m, allowing accurate quantification of geomorphological changes and key parameters, such as breach dimensions and the released water volume. For the comparison of pre- and post-GLOF, we manually digitised the lake boundaries using the UAV-generated orthomosaic (0.05 m, 15 August 2024) and WorldView-2 satellite imagery (0.50 m, 21 November 2013), identifying former shorelines based on vegetation patterns and bedrock colour changes. Elevation differences were calculated using the Copernicus DEM GLO-30 as a baseline, with estimates of released water volume derived from the mean area multiplied by the elevation change as a first-order approximation.
4 Results
4.1 Inventory of glacial lakes in 2024
The inventory of glacial lakes in 2024 for the Cordillera Darwin and Cloue Icefields and their surrounding regions shows a total of 185 glacial lakes with a total area of 63.3 ± 1.9 km2 and a mean lake area of 0.34 km2 (Figure 1b; Table 2). The majority (81.5%) of the lakes mapped in 2024 are small lakes (<0.5 km2; 151 lakes totalling an area of 16.5 km2), but large lakes (≥0.5 km2; 34 lakes totalling an area of 46.8 km2) contribute disproportionately to the total area (74%).
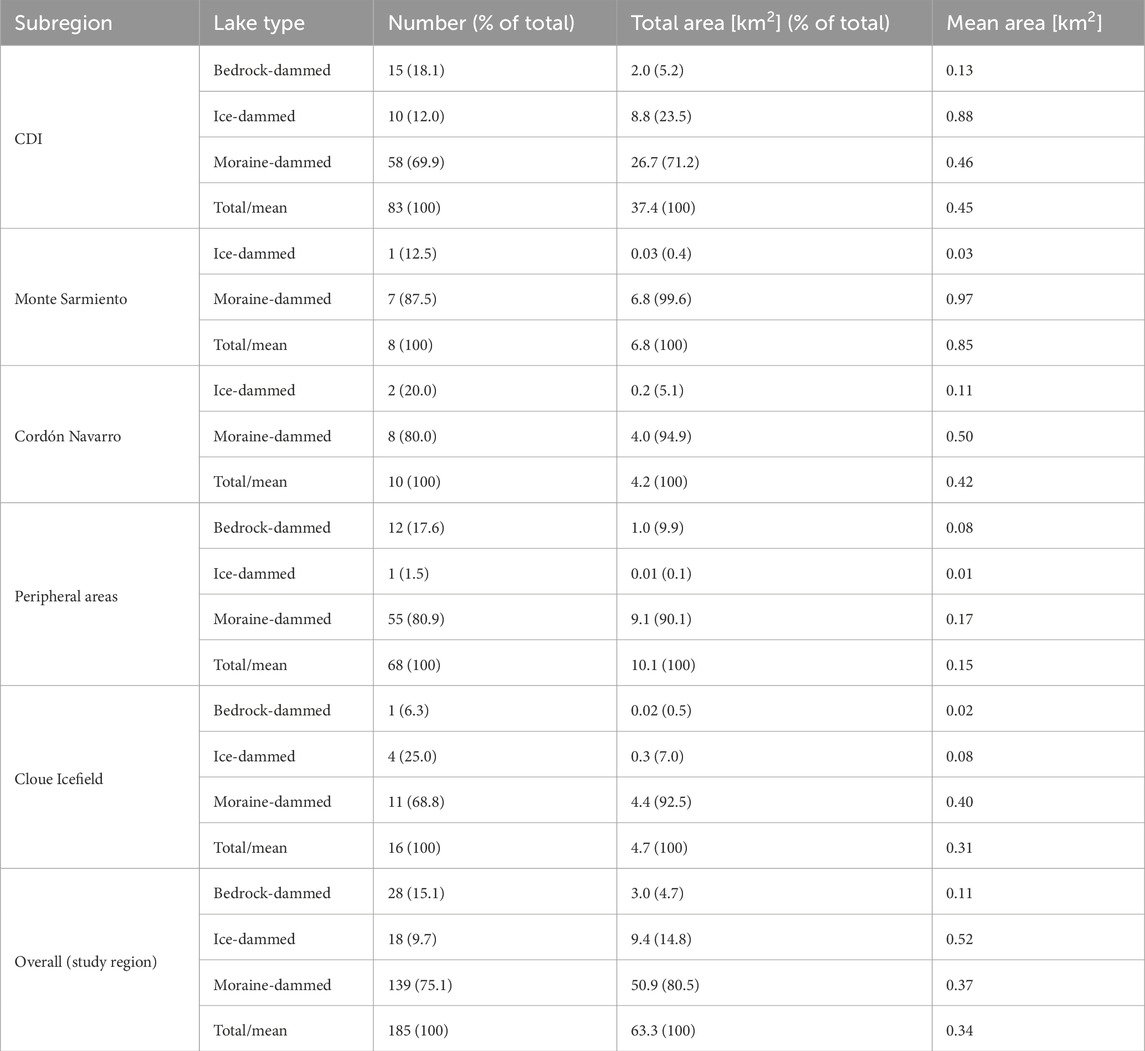
Table 2. Summary of the number, area and type of glacial lakes in the Cordillera Darwin and Cloue Icefields and their surrounding regions in 2024.
Accounting for 75.5% (139 lakes) of the total number and 80.5% (50.9 km2) of the total area, moraine-dammed lakes dominate the inventory. These lakes are concentrated in regions where glaciers retreated significantly after the LIA, particularly in the CDI, which contains 83 lakes (37.4 km2), many of which formed and expanded in overdeepened basins exposed by retreating outlet glaciers. The largest are the proglacial lakes of Stoppani and Pigafetta, which have an area of 3.6 km2 and 2.8 km2, respectively. Ice-dammed lakes are less numerous (9.8% of the total number, 18 lakes) but still account for 14.8% (9.4 km2) of the total area, especially in zones with active glacier dynamics such as the Roncagli/Alemania glacier in the CDI, where the largest ice-dammed lake (Lago Mateo Martinic) has an area of 6.5 km2. Bedrock-dammed lakes are less frequent (14.7% of the total number, 27 lakes) and account for 4.7% (3.0 km2) of the total area.
In spatial distribution, the CDI remains the epicentre of lake development. It is home to the largest lakes and accounts for 59.2% (37.4 km2) of the total glacial lake area (Figure 1c). The Cloue Icefield has 15 lakes (4.7 km2) and a mean area of 0.31 km2 (Figure 1d). In contrast, the Monte Sarmiento massif (6.8 km2) and the Cordón Navarro range (4.2 km2) are home to fewer but larger lakes with a mean area of 0.85 km2 (8 lakes) and 0.42 km2 (10 lakes), respectively. Peripheral lakes, located in recently deglacierised adjacent areas, are hotspots for small lake formation, with 68 lakes (10.1 km2), 85% of which are smaller than 0.5 km2 and have a mean lake area of 0.15 km2 (Figure 1c).
4.2 Changes in glacial lakes between 1945 and 2024
Between 1945 and 2024, the number and area of glacial lakes in the study region increased considerably. The total number of lakes increased by 461% from 33 to 185, while the total area of glacial lakes increased by 124% from 28.2 ± 5.6 km2 to 63.3 ± 1.9 km2 (Table 3; Supplementary Table S2). In the case of the large lakes, they increased by 162% in number (from 13 to 34), while their area increased by 87% from 25.0 ± 5.0 km2 to 46.8 ± 1.4 km2. This growth was not linear; there were various phases of lake area acceleration and deceleration. The fastest increase in lake number occurred between 1945 and 1986 (136% growth), followed by sustained growth until 2006 (65%) and 2019 (43%), which stabilized by 2024 (Figure 3a). In contrast, the largest expansion of total lake area occurred between 1986 and 2006 (54.6% growth, annual rate of 2.7% yr−1), followed by the 2019 to 2024 period (9.8% growth, annual rate of 2.0% yr−1).
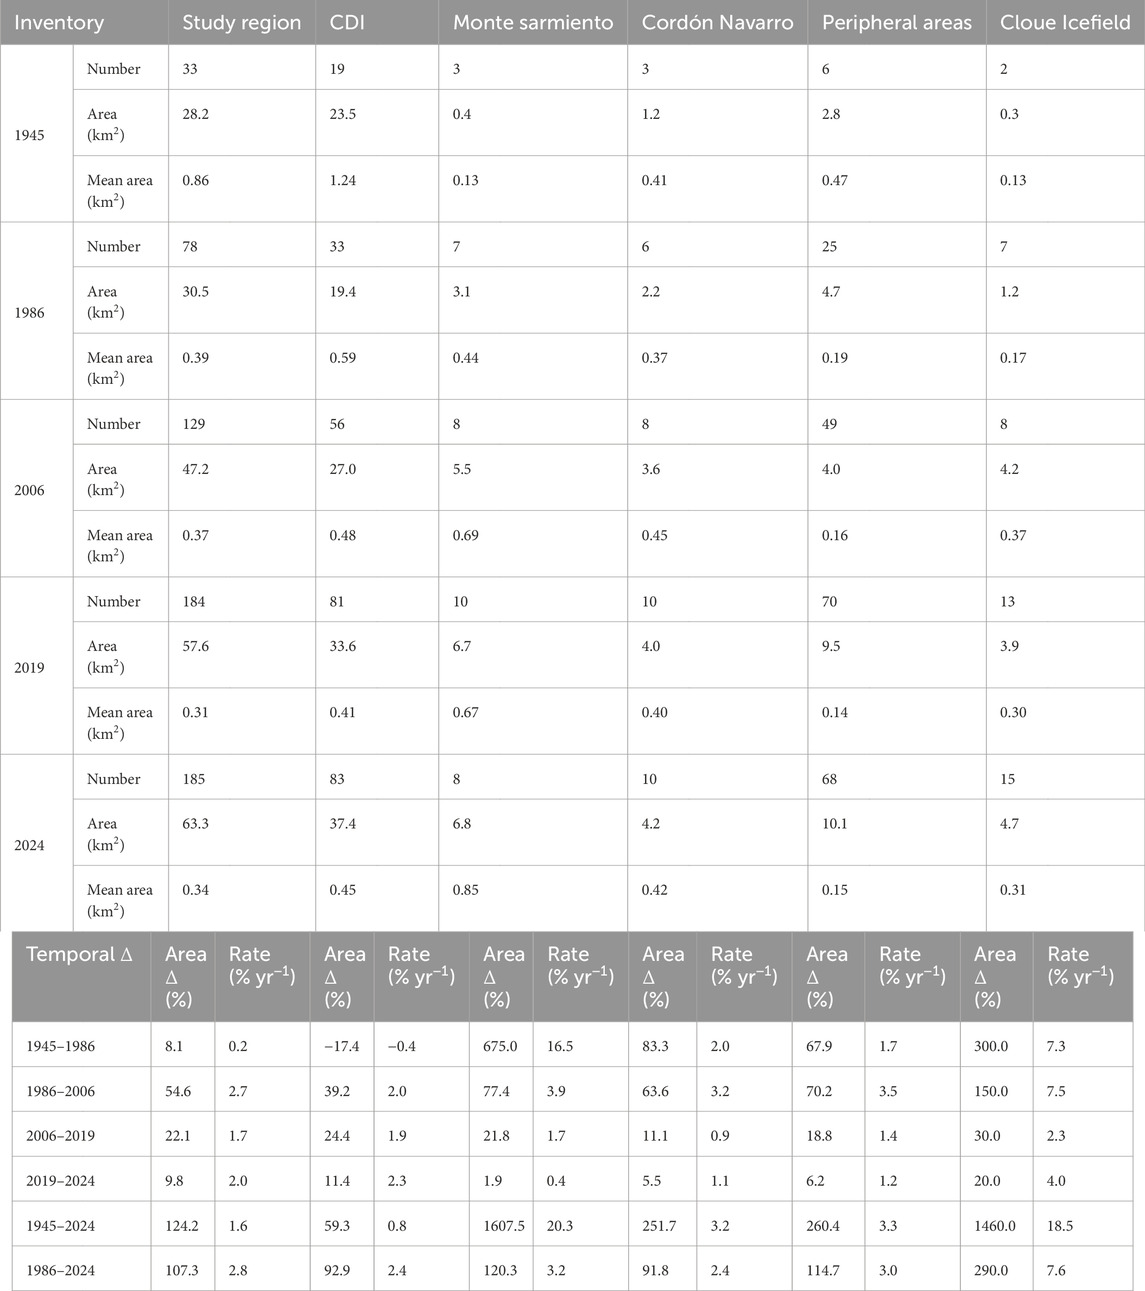
Table 3. Number and area of glacial lakes in the study region and in each subregion in 1945, 1986, 2006, 2019 and 2024. The change over time (Temporal Δ) for different periods is also included.
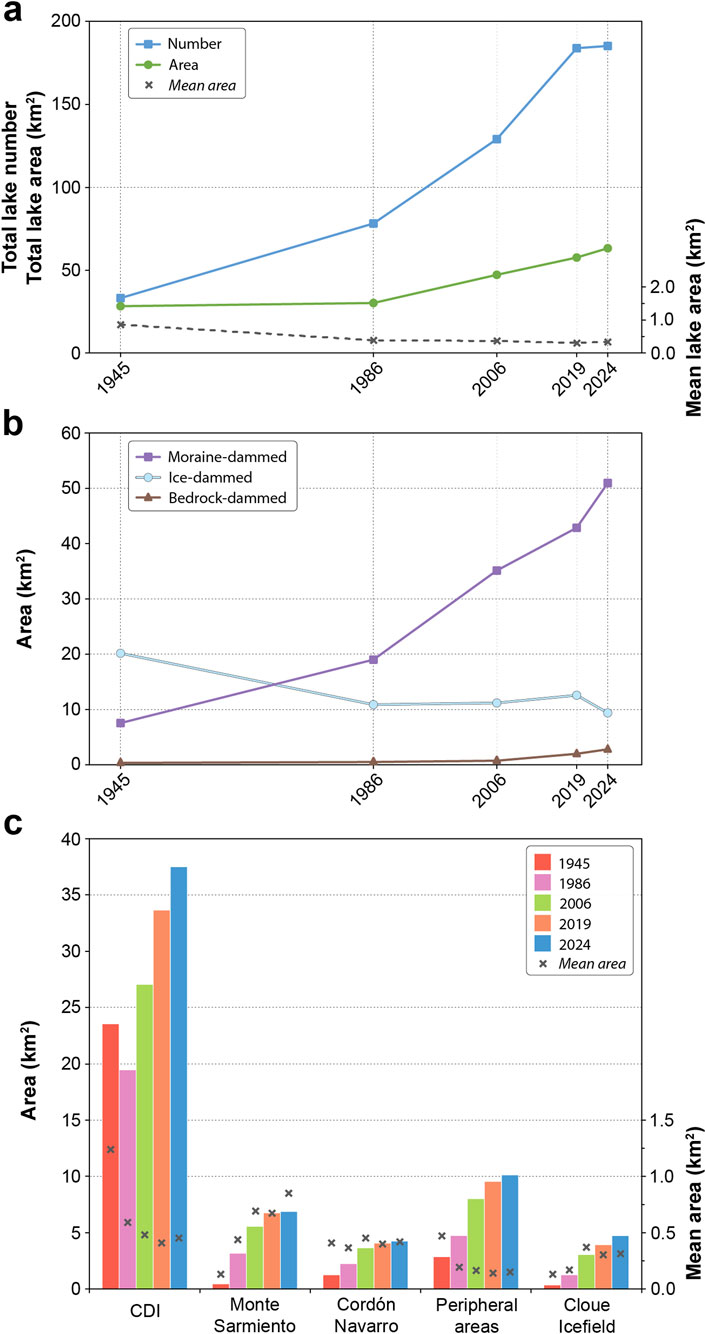
Figure 3. Temporal evolution of glacial lakes in the study region from 1945 to 2024. (a) Changes in the total number and area of glacial lakes, with the corresponding mean lake area. (b) Evolution of glacial lake area by dam type: moraine-dammed, ice-dammed and bedrock-dammed. (c) Spatial distribution of changes in lake area in different subregions: Cordillera Darwin Icefield (CDI), Monte Sarmiento massif, Cordón Navarro range, peripheral areas and Cloue Icefield. The bars represent the total lake area in the individual inventory years and the black crosses show the mean lake area for each subregion and year.
The dominance of ice-dammed lakes in 1945, which accounted for 71.6% (20.2 km2) of the total area, changed drastically during the study period (Figure 3b). In 1986, moraine-dammed lakes were already the predominant lake type accounting for 62.4% (19.1 km2) of the total area, compared to 26.9% (7.6 km2) in 1945. Ice-dammed lakes, on the other hand, declined sharply between 1945 and 1986, both in terms of area (from 71.6% to 35.6%) and number (from 36.4% to 3.8%). From 1986 to 2024, the difference between ice-dammed and moraine-dammed lakes widened, with the latter accounting for 80.5% (50.9 km2) of the total area in 2024, while the mean area of ice-dammed lakes decreased significantly, from 1.68 km2 in 1945 to 0.52 km2 in 2024. This transition again reflects the role of glacier retreat after the LIA, which exposed moraines that dammed up meltwater, while glacier thinning destabilized the ice dams. The proportion of bedrock-dammed lakes, while still small, steadily increased, tripling in both number (from 1 to 27) and area (from 0.4 km2 to 3.0 km2), indicating a gradual exposure of stable overdeepenings and depressions.
The mean lake area decreased from 0.86 km2 in 1945 to 0.39 km2 in 1986 and 0.34 km2 in 2024 (Figure 3a), mainly due to the disappearance of large ice-dammed lakes and the proliferation of small lakes, particularly in the adjacent areas of the Cordillera Darwin and Cloue Icefields. These peripheral lakes saw the largest relative increase in lake numbers, from 6 in 1945 to 49 in 2006 and 68 in 2024, but remained small after 1986, when the mean lake area decreased from 0.19 km2 to 0.15 km2, indicative of widespread newly emerging glacial lakes (Figure 3c).
The total area of glacial lakes in the CDI fluctuated from 1945 to 2006, decreasing by 17% from 1945 to 1986 and then increasing by 39% during the next observation period (1986–2006). Meanwhile, the emergence rate of new lakes increased from 0.3 yr−1 between 1945 and 1986 to 1.2 yr−1 between 1986 and 2006. From 2006 to 2024, the total area and number of glacial lakes increased further (1.2 yr−1 in number and 39% in area). These observed increases in number from 1945 to 2024 occurred despite a 64% reduction in the mean lake size (from 1.24 km2 to 0.45 km2), mainly due to the nearly complete disappearance of the large ice-dammed lakes observed in 1945. The total lake area of the CDI increased by 59% (from 23.5 km2 in 1945 to 37.4 km2 in 2024), reflecting the formation of smaller lakes in newly deglacierised terrain and small ice-dammed lakes at higher elevations after 2019, together with large moraine-dammed lakes that expanded at an accelerated rate after 2006 (Figure 3c). This applies to the proglacial lakes of the Videla, Pigafetta, Roncagli/Alemania and Stoppani glaciers.
The Cloue Icefield experienced a 15-fold increase in lake area (from 0.3 km2 in 1945 to 4.7 km2 in 2024), and the mean lake area also increased from 0.13 km2 to 0.31 km2, as the land-terminating glaciers transitioned into freshwater calving systems, which expanded considerably after 1986 (Figure 3c). The Monte Sarmiento massif experienced the fastest growth, with a 16-fold increase in lake area (from 0.4 km2 in 1945 to 6.8 km2 in 2024). Meanwhile, its mean lake area increased from 0.13 km2 to 0.85 km2 (Figure 3c), due to the expansion of large moraine-dammed lakes such as Schiaparelli, Emma, Conway and Lovisato. In contrast, the Cordón Navarro range showed a gradual but constant development of glacial lakes between 1945 and 2024. The number of lakes increased from 3 to 10, while the total lake area increased by 252% (from 1.2 km2 to 4.2 km2). The mean lake area remained relatively stable and varied between 0.37 km2 and 0.45 km2 (Figure 3c), indicating that the growth of the lakes was due to the formation of new basins of similar size rather than the enlargement of existing ones.
4.3 Recent southernmost GLOFs and cyclic outflows
Our analysis of multi-temporal aerial and satellite imagery, combined with field observations and local accounts, identified several previously undocumented outflow events and various GLOFs in the Cordillera Darwin and Cloue Icefields between 1986 and 2024 (Table 4). Some of these events, identified by lake extent changes in association with distinct geomorphic features such as breached moraines and extensive large-size (>1 m) boulder debris, represent the southernmost modern-day GLOFs recorded in South America.
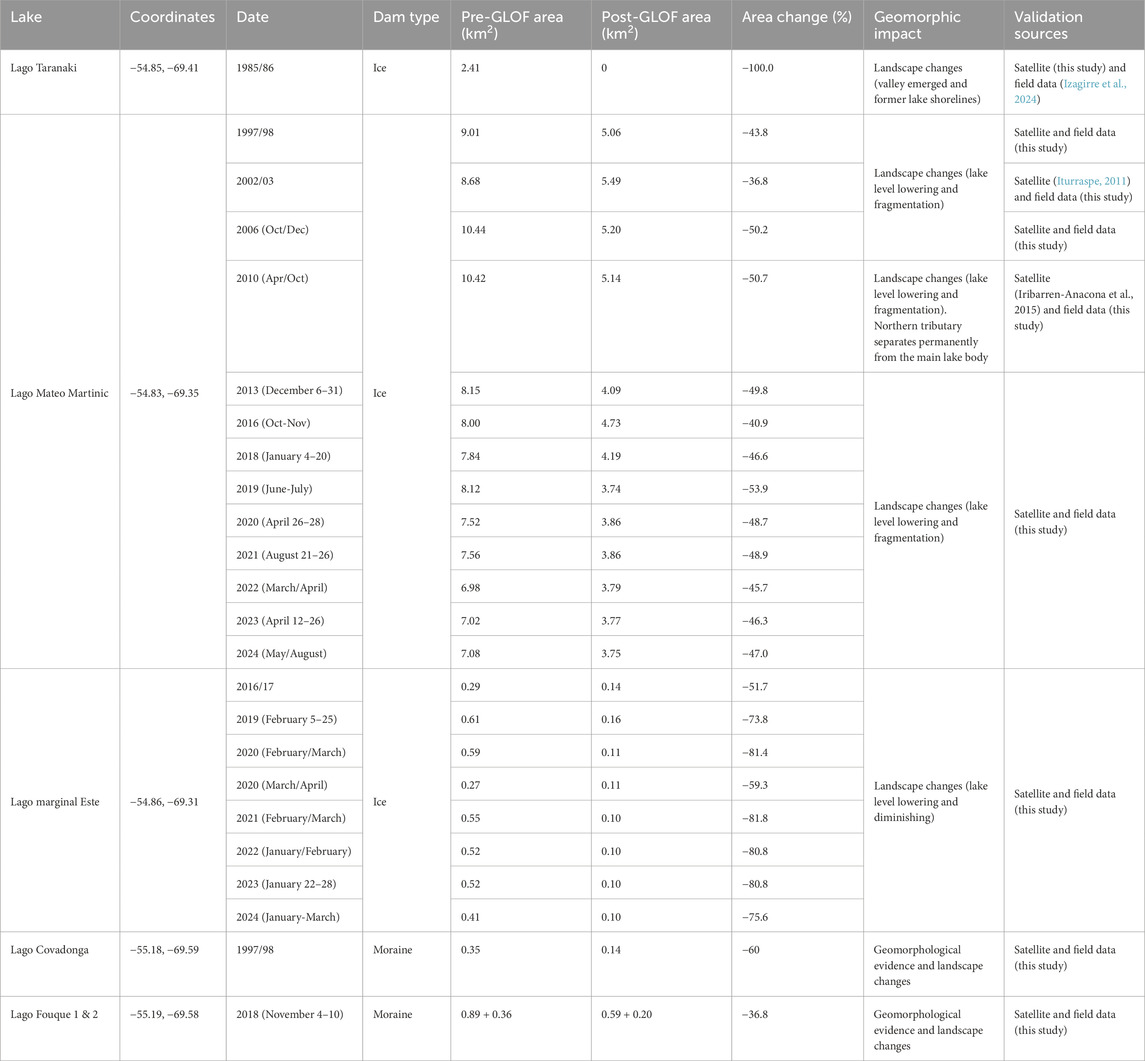
Table 4. Inventory of previously documented and undocumented outflow events and glacial lake outburst floods (GLOFs) in the Cordillera Darwin and Cloue Icefields (1945–2024) derived from multi-temporal satellite imagery, field observations and local reports.
The Roncagli/Alemania glacier area in the southeastern part of the CDI provides multiple examples of ice-dammed lake drainage (Figure 2). Here, one of the earliest documented outflows occurred between 14 May 1985 and 26 February 1986 at Lago Taranaki (Supplementary Figure S1) — a large ice-dammed lake named by a New Zealander mountaineering expedition during the austral summer of 1970/71 (Banks and Radcliffe, 1972). Due to the limited availability of satellite imagery prior to this drainage event, earlier events are difficult to identify. However, high-resolution aerial photographs from the austral summer of 1984 (acquired by the Servicio Aerofotogramétrico de Chile, SAF) and a low-resolution satellite image from 1985 show the lake at full capacity. In contrast, the satellite image from 1986 shows a completely drained lake that did not refill in the following years. Therefore, the former area of Lago Taranaki is now a side valley with rich glacial geomorphological features such as several former lake shorelines and an extensive glaciolacustrine deposit (Izagirre et al., 2024).
Upstream of the Roncagli/Alemania glacier, the ice-dammed Lago Mateo Martinic (6.5 km2 in 2024) showed cyclic partial outflows between 1997 and 2024. Annual satellite observations revealed that the lake area repeatedly decreased by 40%–50% (from ∼10.5 km2 to ∼4.0 km2) after each ice dam failure. At the same time, the lake required a shorter period of time in recent years to refill to its maximum storage capacity and outflow again (Table 4). Since 2010, the northern tributary has been separated from the main lake basin. A smaller ice-dammed lake, Lago marginal Este (0.4 km2 in 2024), located on the opposite edge of the glacier, also showed repeated drainage events in the period 2016–2024 (Supplementary Figure S2).
At the southernmost edge of the study region, a first major GLOF was reconstructed based on interviews with sailors, who reported extensive driftwood at Fiordo Fouque, eastern edge of the Cloue Icefield, in March 1998. Satellite imagery and field observations at Lago Covadonga provide clear evidence of a large GLOF event that occurred between 5 March 1997 and 4 February 1998 (Figure 4). A comparison of coregistered aerial imagery (1996) and Landsat imagery (1997 and 1998) shows a 60% reduction in lake extent after the event (from 0.35 km2 to 0.14 km2), with a conspicuous breached dam on the terminal moraine visible on the 2002 Landsat-7 imagery. Field observations carried out in March 2016 confirmed the outburst path and showed a drop in lake level of about 34 m and an approximately 185 m wide breach through the terminal moraine. This GLOF released a total water volume of 8.3 ± 1.2 x 10⁶ m3.
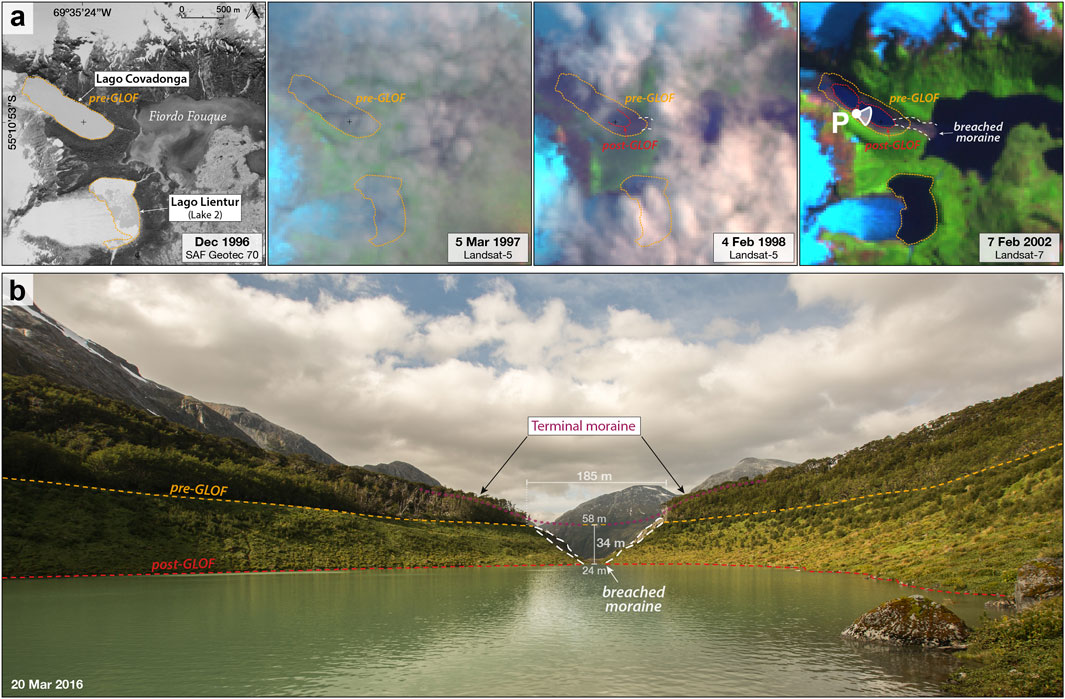
Figure 4. Evolution of Lago Covadonga and geomorphological evidence and landscape changes of a glacier lake outburst flood (GLOF) in the inner part of Fiordo Fouque, Cloue Icefield. (a) Time series of aerial and satellite images showing the transition of Lago Covadonga before and after the GLOF event. The coregistered aerial image from December 1996 (SAF Geotec 70) and the false-colour Landsat-5 images from 5 March 1997 and 4 February 1998 show the extent of the lake before and after the GLOF event (outlined in yellow and red, respectively). The false-colour Landsat-7 image of 7 February 2002 clearly highlights the breached dam on the terminal moraine (breached moraine) and the extent of the lake after the GLOF. The location of the ground photograph (P) acquired in the field is also indicated. (b) Ground photograph from 20 March 2016 looking across Lago Covadonga towards the terminal moraine. The lake level before and after the GLOF is marked and shows a deep excavation on the moraine, which allowed the lake level to drop by about 34 m and a horizontal break width of ∼185 m. This geomorphological evidence confirms the occurrence and extent of the GLOF event between 5 March 1997 and 4 February 1998.
The most recent event was noted by a sailboat entering the inner part of Fiordo Fouque in late March 2019. The crew onboard reported extensive wood debris floating in the sea and a large opening in the moraine that allowed passage into the previously moraine-dammed lake by a lifting-keel sailboat. Once inside, they observed that another lake, located at a higher elevation and connected to the previous one by a stream, also had a breached moraine. Subsequent satellite imagery analysis revealed that the event occurred sometime between 4 and 10 November 2018 (Figure 5), when the higher-elevation moraine-dammed lake (informally named Lake 1) catastrophically drained into the lower moraine-dammed lake (Lake 2), which then outburst into the fjord, carving a large breached dam through the impounding terminal moraine (Supplementary Figure S3). Field surveys in 2024, supported by UAV-derived photogrammetry, quantified the breached moraine dimensions (130 m wide, 30 m high) and estimated a lake level lowering of 30 m and 22 m for Lakes 1 and 2, respectively (Figure 6). These two connected GLOFs released a total water volume of 28.3 × 10⁶ m3 (Table 5).
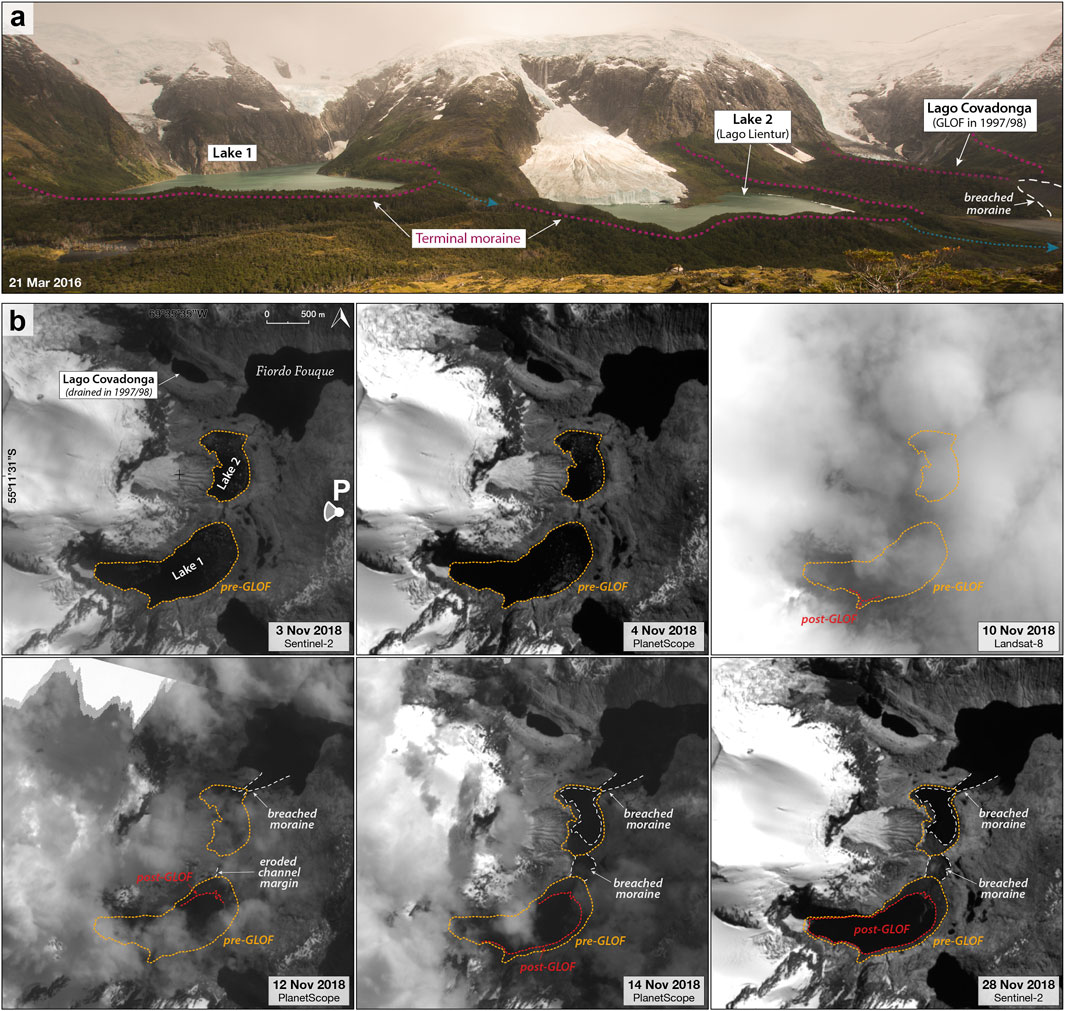
Figure 5. The 2018 glacial lake outburst flood (GLOF) event in the inner part of Fiordo Fouque, Cloue Icefield. (a) Ground photograph acquired on 21 March 2016 showing the three moraine-dammed lakes: Lake 1 (upper) and Lake 2 or Lago Lientur (lower), connected by a river system (blue dotted arrows) that flows into the fjord and Lago Covadonga (in the background) is also visible with its breached moraine from the 1997/98 event. (b) Sequence of satellite images (NIR-band) showing the evolution of the 2018 GLOF event. The outlines of Lake 1 and Lake 2 before the GLOF event (in yellow) are based on Sentinel-2 (3 November) and PlanetScope (4 November) imagery. The location of the ground photograph (P) acquired in the field is also indicated. A significant drainage event occurred between 4 and 10 November, which is barely visible on the Landsat-8 image (10 November). The reduction in lake area following the GLOF event (in red) is confirmed by PlanetScope and Sentinel-2 images from 12, 14 and 28 November. The event was characterised by the catastrophic drainage of Lake 1 into Lake 2, followed by a secondary outburst of Lake 2 into the Fiordo Fouque, which breached the terminal moraine and connected the former lake to the fjord system.
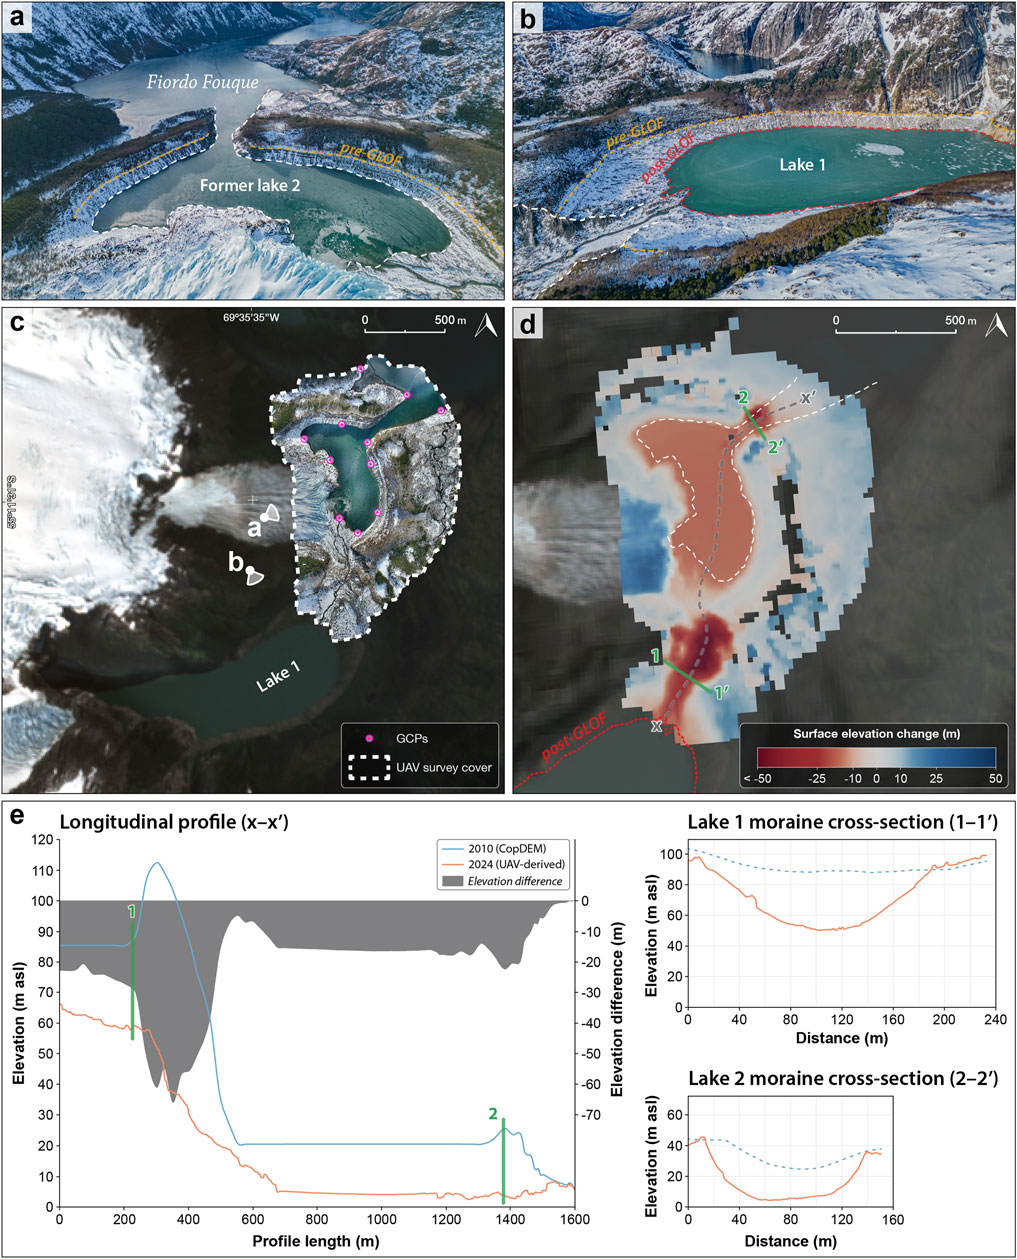
Figure 6. Geomorphic impacts and elevation changes due to the cascading GLOF event in November 2018 in the inner part of Fiordo Fouque, derived from UAV-based photogrammetry and DEM differencing. (a,b) Oblique UAV images from 15 August 2024 show the outlet areas of the former Lake 2 and Lake 1, respectively. The pre-GLOF lake level (in yellow) and the post-GLOF level (in red) of Lake 1 are shown, as both still had a clearly pronounced vegetation difference in 2024, which was slightly obscured by the snow cover. (c) Detailed map of the study site based on a Sentinel-2 satellite image from 4 March 2024 showing the UAV survey area (dashed line) and the synthetic ground control points (GCPs) used for georeferencing. The location of the previous aerial photographs (a/b) is also indicated. (d) Surface elevation change map (2010 CopDEM vs. 2024 UAV-derived DEM) showing ∼35 m erosion on both breached moraines and a 22 m drop in the water level of former Lake 2. (e) Longitudinal profile (x-x′) along the centre flow line of the breached moraines, showing the pre-GLOF (2010 CopDEM) and post-GLOF (2024 UAV-derived DEM) surfaces and the elevation differences. The cross-sections through the breached moraine dam areas of Lake 1 (1–1′) and former Lake 2 (2–2′) are also shown (right panels).

Table 5. Summary of lake area, elevation change and estimated change in water volume associated with the Fouque 2018 GLOF. The areas (km2) before (pre-GLOF) and after (post-GLOF) are given for the upper (Lake 1) and lower (Lake 2) lakes, along with the mean lake areas used to estimate volume change. The elevation change (m) corresponds to the measured surface elevation difference derived from digital elevation models. The volume change is given in millions of cubic metres (106 m3).
5 Discussion
5.1 Evolution of glacial lakes and their characteristics
The evolution of glacial lakes in the Cordillera Darwin and Cloue Icefields between 1945 and 2024 highlights a regional transformation driven by glacier retreat after the LIA, climate warming and topographic controls. The shift from ice-dammed to moraine-dammed lakes—evidenced by the decline of ice-dammed lake area from 71.6% (1945) to 14.8% (2024) of total area in this study—aligns with global patterns of glacial lake evolution (Shugar et al., 2020; Veh et al., 2025), which have been observed elsewhere in Patagonia (Loriaux and Casassa, 2013; Wilson et al., 2018), and in other regions such as Alaska (Wolfe et al., 2014; Rick et al., 2022, 2023), Iceland (Zhang T, et al., 2024) and High Mountain Asia (Gardelle et al., 2011; G. Zhang et al., 2019; Shugar et al., 2020). This transition reflects the destabilisation of ice dams due to glacier thinning and the exposure of terminal moraines that impound meltwater in overdeepened basins. The near-disappearance of large ice-dammed lakes, such as those documented in 1945, mirrors processes described by Loriaux and Casassa (2013), where ice-dam collapse led to rapid drainage of ice-contact lakes and subsequent replacement by moraine-dammed lake systems.
The dominance of small lakes, constituting 81.5% of the 2024 inventory, highlights widespread glacier fragmentation and meltwater ponding in peripheral deglacierised terrain. However, large lakes disproportionately contributed to total area (74%), driven by the expansion of moraine-dammed lakes such as Stoppani (3.6 km2), Pigafetta (2.8 km2) and Roncagli/Alemania (2.4 km2) in the CDI, in the Monte Sarmiento massif, and in the Cloue Icefield. This contrast parallels findings in the Himalayas, where small lakes dominate numerically, but larger lakes control total water storage (Gardelle et al., 2011). Similar trends have also been documented in the Southern Patagonia Icefield, where moraine-dammed lakes proliferated as glaciers retreated into steeper terrain (Wilson et al., 2018). Conversely, the modest but steady growth of bedrock-dammed lakes signals the gradual exposure of stable basins, a phenomenon observed in the European Alps and Cordillera Blanca as glaciers receded exposing bedrock overdeepenings (Emmer et al., 2015, 2020).
Regional heterogeneity in lake development reveals the influence of local topography and glacier dynamics. The CDI, hosting 59% of the total lake area in 2024, emerged as the hotspot of growth in the number and area of glacial lakes since 1986 (2.4% yr−1), driven by the retreat of large outlet glaciers into overdeepened valleys. A similar behaviour can be observed in the Cordón Navarro range (2.4% yr−1), where a gradual increase in lake area has occurred through the formation of lakes of similar size sized lakes rather than the enlargement of existing lakes (as the mean lake area remains stable from 0.37 km2 in 1986 to 0.42 km2 in 2024). In contrast, the number of glacial lakes in the Monte Sarmiento massif remained stable, but the area increased significantly (3.2% yr−1), resulting in a growth in mean lake area from 0.44 km2 in 1986 to 0.85 km2 in 2024. The Cloue Icefield doubled the number of glacial lakes and the area increased considerably (7.6% yr−1), mainly due to the appearance of large moraine-dammed lakes in the southern slope of the icefield.
Temporal trends emphasise the non-linear response of glacial lakes to climatic influences. The accelerated expansion of glacial lakes between 1986 and 2006 (2.7% yr−1) and 2019–2024 (2.0% yr−1) coincides with the increased warming and glacier mass loss in the Southern Andes region in the late 20th and early 21st centuries (Falaschi et al., 2019; San Martín et al., 2021; Zemp et al., 2025), and has accelerated considerably in the last decade (2015–2024; Dussaillant et al., 2025). Similarly, the CDI-wide average annual climatic mass balance shows a relatively positive period during 2007–2016 and an accelerated negative period after 2016 (Temme et al., 2025).
5.2 Drainage mechanisms of observed GLOFs and cyclic outflows
The documented GLOFs and cyclic outflows in the Cordillera Darwin and Cloue Icefields between 1985 and 2024 reveal different drainage mechanisms operating within the evolving deglacierising environment. The case studies highlight the interplay of dam stability thresholds, water pressure and erosion in initiating outflows and outburst floods, while emphasising the unique constraints imposed by the region’s low relief and coastal setting.
5.2.1 Cyclic ice-dammed outflows: Lago Mateo Martinic
The cyclical discharge dynamics at Lago Mateo Martinic show a clear transition from episodic (3–4 years) outflows (1997–2016) to almost annual outflows (2017–2024), which corresponds to the “jökulhlaup cycle” proposed by Evans and Clague (1994). This evolution reflects the progressive destabilisation of the ice dam due to the negative climatic mass balance of the Roncagli/Alemania glacier (glacier-wide average −0.88 m w.e. yr−1 during 2000–2023; Temme et al., 2025). While the increased meltwater input due to regional warming contributes to the faster refilling of the lake, the structural weakening of the ice dam itself (ice dam-wide average −5.2 m w.e. yr−1 during 2000–2023; Temme et al., 2025) appears to be the dominant influencing factor, which presumably lowers the flotation threshold required for subglacial drainage reactivation. The temporal shift towards annual outflows after 2017 correlates strongly with the accelerated negative glacier mass balance rates reported by Dussaillant et al. (2025), where the Roncagli/Alemania glacier experienced rates of −1.32 m w.e. yr−1 in the period 2017–2024, which is about 68% above the average of the study period (−0.79 m w.e. yr−1 from 1976 to 2024) and well above −0.82 m w.e. yr−1 observed in the period 1997–2016. This acceleration is in line with Temme et al. (2025), who assume that the CDI is entering a state of accelerated mass loss due to increasing surface melting.
The decisive factor is that the thinning of the ice dam triggers a positive feedback loop: reduced ice thickness and increased thermo-erosion along the subglacial conduits during each outflow event progressively weaken the integrity of the ice dam, and successive outflows further enlarge the drainage pathways (Walder and Costa, 1996; Carrivick et al., 2017). At Lago Mateo Martinic, this is evidenced by the gradual reduction in area after the outflows, where partial drainage leaves a residual lake in contact with the glacier and long-term glacier retreat and thinning gradually lowers the maximum lake level. The detachment of the northern tributary lake in 2010 and shortening refill intervals indicate the proximity of a critical threshold beyond which a complete collapse of the ice dam becomes inevitable (Evans and Clague, 1994), as occurred at Lago Taranaki in 1985/86.
Globally, such behaviour follows predictable patterns. Regional studies from Iceland to Alaska document cyclic outflow events associated with the degradation of the ice dams (Thorarinsson, 1939; Post and Mayo, 1971; Wolfe et al., 2014), while modern analyses show negative trends in magnitude and increasing drainage frequency for more than 1,500 ice-dammed lakes (Veh et al., 2023). This applies to specifically analysed ice-dammed lakes such as Summit Lake and Tulsequah Lake in British Columbia (Mathews and Clague, 1993; Geertsema and Clague, 2005), Hidden Creek Lake, Ice Lake, Suicide Basin and Strandline Lake in Alaska (Anderson et al., 2003; Wilcox et al., 2014; Kienholz et al., 2020; Rick et al., 2023), as well as Catalina Lake and Russell Lake in Greenland (Grinsted et al., 2017; Dømgaard et al., 2023). In particular, Patagonian analogues such as Lago Cachet 2 and Laguna de los Témpanos reflect the evolution of Lago Mateo Martinic (Dussaillant et al., 2010; Friesen et al., 2015; Aniya et al., 2020), with the recent catastrophic drainage of Lago Greve potentially signalling a new phase of regional instability (Hata et al., 2022). Conversely, exceptions such as Desolation Lake in Alaska (increasing volume despite decreasing ice dam; Lützow et al., 2025) and Gornersee in the Alps (stable volume but earlier seasonal drainage; Huss et al., 2007) illustrate the role of local glaciological controls.
5.2.2 Moraine-dammed GLOFs: Lago Covadonga and Fouque system
In the Fiordo Fouque lake system, catastrophic moraine failures show that the initial flooding or seepage may be driven by hydrostatic pressure, but the subsequent breaching process is dominated by hydrodynamic forces as high-velocity flow incises and rapidly enlarges the outlet channel (Richardson and Reynolds, 2000; Balmforth et al., 2008; Westoby et al., 2014). The Lago Covadonga (1997/98) and Fouque-cascading (2018) events exemplify this process, where >30 m deep breaches formed through terminal moraines, providing morphological evidence of erosive hydrodynamic pressures acting on poorly consolidated material (Costa and Schuster, 1988; Korup and Tweed, 2007; Neupane et al., 2019). This intense erosion during initial breach formation dramatically amplifies flood magnitude by rapidly enlarging outlet channels, as shown by the 185 m wide breached moraine at Lago Covadonga and the 200/130 m wide breached moraines at Lake 1 and 2, respectively. In both cases, the well-preserved breached moraines and marked shifts between lake levels before and after the GLOF events indicate rapid drainage due to moraine failures, consistent with high magnitude GLOFs spilling into the Fiordo Fouque as reported by local eyewitnesses.
While the exact trigger for the initial failures in both cases remains uncertain, the steep valley walls surrounding both Lago Covadonga and upper Lake 1 are highly susceptible to landslides, rockfalls or ice avalanches that can generate displacement and seiche waves, resulting in dam overtopping and hydrodynamic erosion—consistent with global patterns where mass movements trigger most documented moraine dam failures (Richardson and Reynolds, 2000; Emmer and Cochachin, 2013; Westoby et al., 2014). The absence of seismic activity during this period—despite two magnitude 4.8 and 4.9 earthquakes 340 km away on the Scotia plate on 6 and 8 November 2018 respectively—also suggests that a tectonic trigger was unlikely, which in turn supports mass movements as a more likely trigger mechanism (Iribarren Anacona et al., 2015b; Wood et al., 2024). Other possible climate-related triggers include intense and/or prolonged rainfall, glacier/snow melt, permafrost thaw or melting of ice cores in moraine dams, which could lead to moraine failure and lake outburst (Richardson and Reynolds, 2000; Westoby et al., 2014; Haeberli et al., 2017; Wilson et al., 2019; Colavitto et al., 2024).
The 1997/98 Lago Covadonga GLOF exhibits striking similarities to other moraine-dammed single-lake failures worldwide. Particularly, the estimated water volume release of ∼8.3 × 10⁶ m3 places it within the mid-range of Patagonian events like Engaño 1977, Ventisquero Negro 2009 and Chileno 2015 (Iribarren Anacona et al., 2015a; Worni et al., 2012; Wilson et al., 2019), and similar to other events such as Taraco 1935, Dig Tsho 1985, Rejieco 1991, Lugge Tsho 1994, Tsho Ga 2009 and Ranzeria Co 2013 in the Himalayas (Vuichard and Zimmermann, 1987; Watanbe and Rothacher, 1996; Liu et al., 2014; Veh et al., 2019), Nostetuko 1983, Queen Bess 1997 and Elliot Creek 2020 in British Columbia (Blown and Church, 1985; Clague and Evans, 2000; Geertsema et al., 2022), Rasac 2023 in Peru (Emmer et al., 2025), and Maud 1992 in New Zealand (McSaveney, 2002). These comparisons are particularly meaningful as all occurred in high relief regions where steep topography typically amplifies flood impacts, contrasting sharply with Lago Covadonga’s low-gradient coastal environment.
Furthermore, the cascading nature of the Fouque 2018 GLOF event—in which outburst of the upstream lake (Lake 1) catastrophically overloaded the downstream dam (Lake 2) — illustrates the compound processes and susceptibility of interconnected lakes to fail in a cascading process (Kirschbaum et al., 2019; Sharma et al., 2023; Demberel et al., 2024). This sequence released 28.3 × 10⁶ m3 of water and emphasises how regional deglacierisation creates new process chains through hydrological connectivity (Iribarren Anacona et al., 2023). Globally, such cascading events are rarely reported, but they represent an emerging risk as proglacial lakes expand in retreating landscapes and form at higher elevations over existing lakes (Wolfe et al., 2014; Wang et al., 2015; Emmer et al., 2020; Veh et al., 2023; Zhang T, et al., 2024). Therefore, the greatest potential cascading effect must consider the presence of other lakes upstream, as even a small volume released could trigger the outburst of a lower-lying lake or lake complex (Rounce et al., 2016; Falatkova et al., 2019; Allen et al., 2022). An illustrative example is the cascading GLOF in 2021 over a seven-lake chain in Mongolia’s Tsambagarav mountain (Demberel et al., 2024) and Patagonia’s El Gato creek lakes in 2014, where the upper lake drained into the lower lake causing the moraine dam failure and GLOF downstream (Colavitto et al., 2024). In other cases, the lower-lying lake attenuated the flood, largely reducing the impact of the GLOF downstream (Emmer et al., 2022; Nie et al., 2020). It can be concluded that the cascading nature of the Fouque 2018 GLOF was primarily influenced by the amount of water released, as well as the longitudinal profile (steepness and distance) of the terrain in the lakes’ hydrological system. This event, although not hazardous and largely attenuated by the fjord system, could be categorised as a high magnitude event due to the total volume of water released, while the longitudinal profile between the two lakes before the outburst was rather short (270 m) and steep (67 m). The geomorphological evidence and the rapid landscape changes confirm that this was a high magnitude GLOF compared to other moraine-dammed GLOFs in modern times (Costa & O’Connor, 1995; Emmer, 2017; Emmer et al., 2022).
5.2.3 Landscape context and geomorphological implications
The low coastal relief fundamentally limits the geomorphological impact of GLOFs in Tierra del Fuego. In contrast to events in high relief regions such as the Himalayas or the Andes, where steep gradients generate high-energy floods with widespread downstream impacts (Jacquet et al., 2017; Cook et al., 2018; Dahlquist and West, 2022; O’Connor et al., 2022), the limited elevation difference between lakes and fjords (often <100 m) and the attenuation of flood effects by downstream lakes in Patagonia and Tierra del Fuego restricts potential energy and erosive power (Iribarren Anacona et al., 2015b).
In addition, the largest (>2 km2) moraine-dammed lakes in the study region have naturally developed low-gradient outlet channels that are incised into the moraine dams (e.g., Lovisato, Pigafetta, Dalla Vedova, Roncagli/Alemania and Stoppani), thus maintaining a stable lake level and limiting the occurrence and magnitudes of GLOFs (Veh et al., 2025). In contrast, some large (1–2 km2) moraine-dammed lakes have an abrupt (short and steep) gradient between moraine dams and sea level and poorly developed outlet channels (e.g., Conway in the Monte Sarmiento massif, some lakes in the inner part of Fiordo Parry or the largest lake on the southern slope of Cordón Navarro range). Therefore, they could be considered as potential GLOF sites in the future, and if this occurs, local geomorphological and landscape changes with limited downstream sediment transport can be expected, as shown by the 22–34 m lake level drops and deep breached moraines at Lago Covadonga and the Fouque-cascade. Large boulders and woody debris from outbursts are usually deposited within fjord heads instead of being transported far downstream. This is in sharp contrast to high relief GLOFs, which can devastate valleys more than 100 km from the source (Richardson and Reynolds, 2000; Osti and Egashira, 2009; Veh et al., 2020; Taylor et al., 2023).
The documentation of these low-gradient coastal outflows and outbursts extends the environmental scope of GLOF studies beyond high-altitude continental mountains (Lützow et al., 2023). While recent work has investigated GLOF-related sedimentary and geomorphological impacts in Patagonian-Fuegian fjords (Bertrand et al., 2017; Vandekerkhove et al., 2021; Piret et al., 2022), our results shed particular light on how glacial drainage interacts with low-lying coastal landscapes during deglacierisation—a process that is less well-documented in such maritime, low-lying areas. This provides new insights into the drainage mechanisms and landform signatures of GLOFs in environments where hydraulic gradients and sediment availability differ markedly from high-mountain systems.
6 Conclusion
The rapid retreat of glaciers in the Cordillera Darwin and Cloue Icefields of Tierra del Fuego over the last 8 decades has led to profound changes in the region’s glacial lake systems, with significant implications for landscape evolution. This study shows a substantial growth in the number and area of glacial lakes since 1945, with the total number of lakes increasing by 461% (from 33 to 185) and the total area by 124% (from 28.2 to 63.3 km2). This growth reflects the transition from ice-dammed lakes, which were predominant in the mid-20th century, to moraine-dammed systems, which now account for over 80% of the total lake area. The increase in small lakes highlights widespread glacier fragmentation, while large lakes, although smaller in number, dominate water storage and underline their hydrological importance in deglacierising environments.
The decisive factor for this change is the interplay of climatic warming, glacier retreat and topographic controls. The CDI became the epicentre of lake development (59% of the total lake area), which was driven by the retreat of the outlet glaciers into overdeepened valleys. The Monte Sarmiento massif experienced the most rapid growth (16-fold increase in area), while the Cloue Icefield transitioned to freshwater calving systems. The temporal acceleration of lake expansion (1986–2006 and 2019–2024) coincided with increased regional warming and glacier mass loss observed throughout Patagonia.
The study documents previously unrecorded GLOFs, including the Fouque 2018 event—the largest in the region—which released 28.3 × 10⁶ m3 of water through cascading failure of two interconnected moraine-dammed lakes. The cyclic partial outflows of the ice-dammed Lago Mateo Martinic (1997–2024) illustrates the progressive destabilisation of its ice dam, which exhibits mass loss rates nearly six times greater than the glacier-wide average. In addition, historical reports of a 1997/98 GLOF in Fiordo Fouque highlights the region’s susceptibility to GLOFs. Although these events are not hazardous in this sparsely populated area, they highlight the susceptibility of ice dams to hydrostatic failure under prolonged meltwater input and the failure of moraine dams due to the increase in hydrodynamic pressure caused by mass movements. The trigger mechanisms, including prolonged warming episodes and cascading interactions between lakes, are consistent with global patterns, emphasizing the need for a holistic assessment of glacial lake systems.
By integrating historical aerial imagery, satellite data, UAV photogrammetry and field observations, this work contributes to a better understanding of glacial lake evolution in a remote, understudied region. This study highlights Tierra del Fuego archipelago an important natural laboratory for the study of climate-induced glacier retreat, lake formation and drainage dynamics. It extends the geographic scope of documented GLOFs to the southernmost Andes and provides insights into the complex interplay of geomorphologic, climatic and glacial processes that shape deglacierising environments. The results contribute to a global framework for understanding glacial hazards and emphasize the accelerating transformation of mountain regions in the wake of climate change.
Data availability statement
The original contributions presented in the study are included in the article/Supplementary Material, further inquiries can be directed to the corresponding author.
Ethics statement
Ethical approval was not required for the studies involving humans because the participants provided written informed consent to participate in this study. The studies were conducted in accordance with the local legislation and institutional requirements. The participants provided their written informed consent to participate in this study.
Author contributions
EI: Validation, Methodology, Investigation, Writing – review and editing, Formal Analysis, Data curation, Software, Writing – original draft, Conceptualization. GC: Validation, Investigation, Writing – review and editing. ID: Investigation, Writing – review and editing, Validation. EM: Data curation, Investigation, Writing – review and editing, Formal Analysis. RW: Writing – review and editing, Investigation, Validation. CR: Writing – review and editing, Investigation, Formal Analysis, Methodology, Data curation. SF: Funding acquisition, Project administration, Supervision, Conceptualization, Resources, Writing – review and editing. IA: Resources, Project administration, Funding acquisition, Supervision, Writing – review and editing, Conceptualization.
Funding
The author(s) declare that financial support was received for the research and/or publication of this article. This work was supported by the University of the Basque Country UPV/EHU under grant PIF17/182 and the Basque Government under consolidated research groups IT-1029-16 and IT1678-22, and by the Spanish Government through MDM-2017-0714 and CEX2021-001201-M, funded by MCIN/AEI/10.13039/501100011033. The fieldwork campaign in 2016 was partly funded by the National Geographic Society (#EC0757-15), the Royal Geographical Society (Geographical Field Grant), the British Mountaineering Council (Expeditions Grant) and the Council of Azpeitia (Joxe Takolo Grant) in the Basque Country.
Acknowledgments
The authors would like to thank the Corporación Nacional Forestal (CONAF) for permission to conduct research in the Alberto de Agostini National Park. Special thanks to the Universidad de Magallanes, Cruceros Australis Expedition Cruises, Lindblad Expeditions, Northanger and Kotik sailboats and the Uncharted project for their logistical support. We thank Planet Labs Inc. for providing free access to high-resolution Planet imagery as part of their license for the Education and Research Program. EI and EM would like to thank Keri-Lee Pashuk for her valuable advice on the Fouque 1997/98 GLOF and Keri, Ibai Rico and Caesar Schinas for their support during the 2016 expedition. EI would like to thank Denis Chevallay and Igor Belly for their valuable advice on the Fouque 2018 GLOF and their continued logistical support in Puerto Williams. Finally, the authors would also like to thank Daniel Falaschi and two reviewers for their detailed reviews, which contributed significantly in refining the final manuscript.
Conflict of interest
The authors declare that the research was conducted in the absence of any commercial or financial relationships that could be construed as a potential conflict of interest.
The handling editor DF declared a past co-authorship with the author ID.
Generative AI statement
The author(s) declare that no Generative AI was used in the creation of this manuscript.
Any alternative text (alt text) provided alongside figures in this article has been generated by Frontiers with the support of artificial intelligence and reasonable efforts have been made to ensure accuracy, including review by the authors wherever possible. If you identify any issues, please contact us.
Publisher’s note
All claims expressed in this article are solely those of the authors and do not necessarily represent those of their affiliated organizations, or those of the publisher, the editors and the reviewers. Any product that may be evaluated in this article, or claim that may be made by its manufacturer, is not guaranteed or endorsed by the publisher.
Supplementary material
The Supplementary Material for this article can be found online at: https://www.frontiersin.org/articles/10.3389/feart.2025.1641167/full#supplementary-material
References
Allen, S. K., Rastner, P., Arora, M., Huggel, C., and Stoffel, M. (2016). Lake outburst and debris flow disaster at Kedarnath, June 2013: hydrometeorological triggering and topographic predisposition. Landslides 13 (6), 1479–1491. doi:10.1007/s10346-015-0584-3
Allen, S. K., Sattar, A., King, O., Zhang, G., Bhattacharya, A., Yao, T., et al. (2022). Glacial lake outburst flood hazard under current and future conditions: worst-case scenarios in a transboundary Himalayan basin. Nat. Hazards Earth Syst. Sci. 22 (11), 3765–3785. doi:10.5194/nhess-22-3765-2022
Anderson, S. P., Walder, J. S., Anderson, R. S., Kraal, E. R., Cunico, M., Fountain, A. G., et al. (2003). Integrated hydrologic and hydrochemical observations of Hidden Creek Lake jökulhlaups, Kennicott Glacier, Alaska. J. Geophys. Res. Earth Surf. 108 (F1). doi:10.1029/2002JF000004
Aniya, M., Dusaillant, A., O’Kuinghttons, J., Barcaza, G., and Bravo, S. (2020). GLOFs of Laguna de los Témpanos, glacier-dammed side lake of Glaciar Steffen, Hielo Patagónico Norte, Chile, since 1974. Bull. Glaciol. Res. 38 (0), 13–24. doi:10.5331/bgr.20R01
Balmforth, N. J., von Hardenberg, J., Provenzale, A., and Zammett, R. (2008). Dam breaking by wave-induced erosional incision. J. Geophys. Res. Earth Surf. 113 (F1). doi:10.1029/2007JF000756
Banks, N., and Radcliffe, P. (1972). New Zealand Tierra del Fuegian Expedition 1970. N. Z. Alp. J. 24, 6–19.
Benn, D. I., Warren, C. R., and Mottram, R. H. (2007). Calving processes and the dynamics of calving glaciers. Earth-Science Rev. 82 (3–4), 143–179. doi:10.1016/j.earscirev.2007.02.002
Bertrand, S., Lange, C. B., Pantoja, S., Hughen, K., Van Tornhout, E., and Wellner, J. S. (2017). Postglacial fluctuations of Cordillera Darwin glaciers (southernmost Patagonia) reconstructed from Almirantazgo fjord sediments. Quat. Sci. Rev. 177, 265–275. doi:10.1016/j.quascirev.2017.10.029
Blown, I., and Church, M. (1985). Catastrophic lake drainage within the Homathko River basin, British Columbia. Can. Geotechnical J. 22 (4), 551–563. doi:10.1139/t85-075
Bolch, T., Buchroithner, M. F., Peters, J., Baessler, M., and Bajracharya, S. (2008). Identification of glacier motion and potentially dangerous glacial lakes in the Mt. Everest region/Nepal using spaceborne imagery. Nat. Hazards Earth Syst. Sci. 8 (6), 1329–1340. doi:10.5194/nhess-8-1329-2008
Bown, F., Rivera, A., Zenteno, P., Bravo, C., and Cawkwell, F. (2014). “First Glacier Inventory and Recent Glacier Variation on Isla Grande de Tierra Del Fuego and Adjacent Islands in Southern Chile,” in Global land ice measurements from space. Editors J. S. Kargel, G. J. Leonard, M. P. Bishop, A. Kääb, and B. H. Raup (Berlin Heidelberg: Springer), 661–674. doi:10.1007/978-3-540-79818-7_28
Braun, M. H., Malz, P., Sommer, C., Farías-Barahona, D., Sauter, T., Casassa, G., et al. (2019). Constraining glacier elevation and mass changes in South America. Nat. Clim. Change 9 (2), 130–136. doi:10.1038/s41558-018-0375-7
Carrasco, J. F., Casassa, G., and Rivera, A. (2002). “Meteorological and climatological aspects of the Southern Patagonia icefield,” in The patagonian icefields: a unique natural laboratory for environmental and climate change studies. Editors G. Casassa, F. V. Sepúlveda, and R. M. Sinclair (Springer US), 29–41. doi:10.1007/978-1-4615-0645-4_4
Carrivick, J. L., and Tweed, F. S. (2013). Proglacial lakes: character, behaviour and geological importance. Quat. Sci. Rev. 78, 34–52. doi:10.1016/j.quascirev.2013.07.028
Carrivick, J. L., and Tweed, F. S. (2016). A global assessment of the societal impacts of glacier outburst floods. Glob. Planet. Change 144, 1–16. doi:10.1016/j.gloplacha.2016.07.001
Carrivick, J. L., Davies, B. J., James, W. H. M., Quincey, D. J., and Glasser, N. F. (2016). Distributed ice thickness and glacier volume in southern South America. Glob. Planet. Change 146, 122–132. doi:10.1016/j.gloplacha.2016.09.010
Carrivick, J. L., Tweed, F. S., Ng, F., Quincey, D. J., Mallalieu, J., Ingeman-Nielsen, T., et al. (2017). Ice-dammed Lake drainage evolution at Russell Glacier, West Greenland. Front. Earth Sci. 5, 100. doi:10.3389/feart.2017.00100
Carrivick, J. L., Davies, M., Wilson, R., Davies, B. J., Gribbin, T., King, O., et al. (2024). Accelerating glacier area loss across the andes since the little ice age. Geophys. Res. Lett. 51 (13), e2024GL109154. doi:10.1029/2024GL109154
Choi, C. (2008). Tierra del Fuego: the beavers must die. Nature 453 (7198), 968. doi:10.1038/453968a
Clague, J. J., and Evans, S. G. (2000). A review of catastrophic drainage of moraine-dammed lakes in British Columbia. Quat. Sci. Rev. 19 (17), 1763–1783. doi:10.1016/S0277-3791(00)00090-1
Colavitto, B., Allen, S., Winocur, D., Dussaillant, A., Guillet, S., Muñoz-Torrero Manchado, A., et al. (2024). A glacial lake outburst floods hazard assessment in the patagonian andes combining inventory data and case-studies. Sci. Total Environ. 916, 169703. doi:10.1016/j.scitotenv.2023.169703
Cook, K. L., Andermann, C., Gimbert, F., Adhikari, B. R., and Hovius, N. (2018). Glacial lake outburst floods as drivers of fluvial erosion in the Himalaya. Science 362 (6410), 53–57. doi:10.1126/science.aat4981
Costa, J. E., and O’Connor, J. E. (1995). “Geomorphically effective floods,” in Natural and anthropogenic influences in fluvial geomorphology (American Geophysical Union AGU), 45–56. doi:10.1029/GM089p0045
Costa, J. E., and Schuster, R. L. (1988). The formation and failure of natural dams. GSA Bull. 100 (7), 1054–1068. doi:10.1130/0016-7606(1988)100<1054:TFAFON>2.3.CO;2
Cunningham, W. D. (1995). Orogenesis at the southern tip of the Americas: the structural evolution of the Cordillera Darwin metamorphic complex, southernmost Chile. Tectonophysics 244 (4), 197–229. doi:10.1016/0040-1951(94)00248-8
Dahlquist, M. P., and West, A. J. (2022). The imprint of erosion by glacial lake outburst floods in the topography of central Himalayan rivers. Earth Surf. Dyn. 10 (4), 705–722. doi:10.5194/esurf-10-705-2022
Davies, B. J., and Glasser, N. F. (2012). Accelerating shrinkage of Patagonian glaciers from the little Ice age (∼AD 1870) to 2011. J. Glaciol. 58 (212), 1063–1084. doi:10.3189/2012JoG12J026
Davies, B. J., Darvill, C. M., Lovell, H., Bendle, J. M., Dowdeswell, J. A., Fabel, D., et al. (2020). The evolution of the patagonian ice sheet from 35 ka to the present day (PATICE). Earth-Science Rev. 204, 103152. doi:10.1016/j.earscirev.2020.103152
Demberel, O., Dash, C., Dugersuren, B., Bayarmaa, M., Seong, Y. B., Chakraborty, E., et al. (2024). Flooding (or breaching) of inter-connected proglacial lakes by cascading overflow in the arid region of Western Mongolia (Mt. Tsambagarav, Mongolian Altai). J. Mt. Sci. 21 (10), 3215–3233. doi:10.1007/s11629-024-9054-5
Dirección General de Aguas (DGA) (2022). “Inventario Público de Glaciares, actualización 2022,” in Ministerio de Obras Públicas, Dirección General de Aguas Unidad de Glaciología y Nieves. Available online at: https://dga.mop.gob.cl/Paginas/InventarioGlaciares.aspx (Accessed January 10, 2025).
Dirección General de Aguas (DGA) (2023). “Asesoría y Consultoría de Apoyo para un Inventario Público de Lagos Glaciares: informe Final,” in Ministerio de Obras Públicas, Dirección General de Aguas, Unidad de Glaciología y Nieves.
Dømgaard, M., Kjeldsen, K. K., Huiban, F., Carrivick, J. L., Khan, S. A., and Bjørk, A. A. (2023). Recent changes in drainage route and outburst magnitude of the russell glacier ice-dammed lake, West Greenland. Cryosphere 17 (3), 1373–1387. doi:10.5194/tc-17-1373-2023
Dussaillant, A., Benito, G., Buytaert, W., Carling, P., Meier, C., and Espinoza, F. (2010). Repeated glacial-lake outburst floods in patagonia: an increasing hazard? Nat. Hazards 54 (2), 469–481. doi:10.1007/s11069-009-9479-8
Dussaillant, I., Berthier, E., Brun, F., Masiokas, M., Hugonnet, R., Favier, V., et al. (2019). Two decades of glacier mass loss along the andes. Nat. Geosci. 12 (10), 802–808. doi:10.1038/s41561-019-0432-5
Dussaillant, I., Hugonnet, R., Huss, M., Berthier, E., Bannwart, J., Paul, F., et al. (2025). Annual mass change of the world’s glaciers from 1976 to 2024 by temporal downscaling of satellite data with in situ observations. Earth Syst. Sci. Data 17 (5), 1977–2006. doi:10.5194/essd-17-1977-2025
Emmer, A. (2017). Geomorphologically effective floods from moraine-dammed lakes in the Cordillera Blanca, Peru. Quat. Sci. Rev. 177, 220–234. doi:10.1016/j.quascirev.2017.10.028
Emmer, A., and Cochachin, A. (2013). The causes and mechanisms of moraine-dammed lake failures in the Cordillera Blanca, North American Cordillera, and himalayas. AUC Geogr. 48 (2), 5–15. doi:10.14712/23361980.2014.23
Emmer, A., Merkl, S., and Mergili, M. (2015). Spatiotemporal patterns of high-mountain lakes and related hazards in western Austria. Geomorphology 246, 602–616. doi:10.1016/j.geomorph.2015.06.032
Emmer, A., Harrison, S., Mergili, M., Allen, S., Frey, H., and Huggel, C. (2020). 70 years of lake evolution and glacial lake outburst floods in the Cordillera Blanca (Peru) and implications for the future. Geomorphology 365, 107178. doi:10.1016/j.geomorph.2020.107178
Emmer, A., Wood, J. L., Cook, S. J., Harrison, S., Wilson, R., Diaz-Moreno, A., et al. (2022). 160 glacial lake outburst floods (GLOFs) across the Tropical Andes since the Little Ice Age. Glob. Planet. Change 208, 103722. doi:10.1016/j.gloplacha.2021.103722
Emmer, A., Vilca, O., Salazar Checa, C., Li, S., Cook, S., Pummer, E., et al. (2025). Causes, consequences and implications of the 2023 landslide-induced Lake rasac glacial lake outburst flood (GLOF), Cordillera huayhuash, Peru. Nat. Hazards Earth Syst. Sci. 25 (3), 1207–1228. doi:10.5194/nhess-25-1207-2025
Evans, S. G., and Clague, J. J. (1994). Recent climatic change and catastrophic geomorphic processes in mountain environments. Geomorphology 10 (1), 107–128. doi:10.1016/0169-555X(94)90011-6
Falaschi, D., Lenzano, M. G., Villalba, R., Bolch, T., Rivera, A., and Lo Vecchio, A. (2019). Six decades (1958–2018) of geodetic glacier mass balance in Monte San Lorenzo, patagonian andes. Front. Earth Sci. 7, 326. doi:10.3389/feart.2019.00326
Falatkova, K., Šobr, M., Neureiter, A., Schöner, W., Janský, B., Häusler, H., et al. (2019). Development of proglacial lakes and evaluation of related outburst susceptibility at the adygine ice-debris complex, northern tien Shan. Earth Surf. Dyn. 7 (1), 301–320. doi:10.5194/esurf-7-301-2019
Faria, S. H., Carrascal, D. R., and Ruiz, L. (2021). “Regional fact sheet – mountains,” in Climate change 2021: the physical science basis. Contribution of working group I to the sixth assessment report of the intergovernmental panel on climate change. Editors V. Masson-Delmotte, P. Zhai, A. Pirani, S. L. Connors, C. Péan, and S. Berger Available online at: https://www.ipcc.ch/report/ar6/wg1/resources/factsheets (Accessed January 20, 2025).
Fernandez, R. A., Anderson, J. B., Wellner, J. S., and Hallet, B. (2011). Timescale dependence of glacial erosion rates: a case study of marinelli glacier, Cordillera Darwin, southern patagonia. J. Geophys. Res. Earth Surf. 116 (F1). doi:10.1029/2010JF001685
Friesen, B. A., Nimick, D. A., McGrath, D. J., Cole, C. J., Wilson, E. M., Noble, S. M., et al. (2015). Documenting 35 years of land cover change: Lago cachet dos drainage, Chile [map]. U.S. Geol. Surv. doi:10.3133/sim3332
Gardelle, J., Arnaud, Y., and Berthier, E. (2011). Contrasted evolution of glacial lakes along the Hindu Kush Himalaya mountain range between 1990 and 2009. Glob. Planet. Change 75 (1–2), 47–55. doi:10.1016/j.gloplacha.2010.10.003
Garreaud, R., Lopez, P., Minvielle, M., and Rojas, M. (2013). Large-scale control on the Patagonian climate. J. Clim. 26 (1), 215–230. doi:10.1175/JCLI-D-12-00001.1
Geertsema, M., and Clague, J. J. (2005). Jökulhlaups at tulsequah glacier, northwestern British Columbia, Canada. Holocene 15 (2), 310–316. doi:10.1191/0959683605hl812rr
Geertsema, M., Menounos, B., Bullard, G., Carrivick, J. L., Clague, J. J., Dai, C., et al. (2022). The 28 November 2020 landslide, tsunami, and outburst flood – a hazard Cascade associated with rapid deglaciation at elliot creek, British Columbia, Canada. Geophys. Res. Lett. 49 (6), e2021GL096716. doi:10.1029/2021GL096716
Gilbert, A., Vincent, C., Wagnon, P., Thibert, E., and Rabatel, A. (2012). The influence of snow cover thickness on the thermal regime of Tête rousse Glacier (Mont Blanc range, 3200 m a.s.l.): consequences for outburst flood hazards and glacier response to climate change. J. Geophys. Res. Earth Surf. 117 (F4). doi:10.1029/2011JF002258
González, I. (2019). “Glaciares del Fiordo De Agostini,” in Fiordos: una geografía particular, una mirada a los ecosistemas del Fiordo De Agostini. Editor C. Silva de Carvalho (Punta Arenas: Ediciones CEQUA), 59–82.
Gorsic, S., Corona, C., Manchado, A. M.-T., Lopez-Saez, J., Allen, S., Ballesteros-Cánovas, J. A., et al. (2025). Coupling tree-ring and geomorphic analyses to reconstruct the 1950s massive Glacier Lake Outburst flood at grosse glacier, Chilean patagonia. Sci. Total Environ. 961, 178368. doi:10.1016/j.scitotenv.2025.178368
Grinsted, A., Hvidberg, C. S., Campos, N., and Dahl-Jensen, D. (2017). Periodic outburst floods from an ice-dammed lake in east Greenland. Sci. Rep. 7 (1), 9966. doi:10.1038/s41598-017-07960-9
Haeberli, W., Schaub, Y., and Huggel, C. (2017). Increasing risks related to landslides from degrading permafrost into new lakes in de-glaciating mountain ranges. Geomorphology 293, 405–417. doi:10.1016/j.geomorph.2016.02.009
Harrison, S., Winchester, V., and Glasser, N. (2007). The timing and nature of recession of outlet glaciers of Hielo Patagónico Norte, Chile, from their Neoglacial IV (Little Ice age) maximum positions. Glob. Planet. Change 59 (1–4), 67–78. doi:10.1016/j.gloplacha.2006.11.020
Harrison, S., Kargel, J. S., Huggel, C., Reynolds, J., Shugar, D. H., Betts, R. A., et al. (2018). Climate change and the global pattern of moraine-dammed glacial lake outburst floods. Cryosphere 12 (4), 1195–1209. doi:10.5194/tc-12-1195-2018
Hata, S., Sugiyama, S., and Heki, K. (2022). Abrupt drainage of lago greve, a large proglacial lake in Chilean patagonia, observed by satellite in 2020. Commun. Earth and Environ. 3 (1), 190–198. doi:10.1038/s43247-022-00531-5
Herrera, A. H., Lencinas, M. V., Manríquez, M. T., Miller, J. A., and Pastur, G. M. (2020). Mapping the status of the North American beaver invasion in the Tierra del Fuego archipelago. PLOS ONE 15 (4), e0232057. doi:10.1371/journal.pone.0232057
Holm, K., Bovis, M., and Jakob, M. (2004). The landslide response of alpine basins to post-Little ice age glacial thinning and retreat in southwestern British Columbia. Geomorphology 57 (3), 201–216. doi:10.1016/S0169-555X(03)00103-X
Holmlund, P., and Fuenzalida, H. (1995). Anomalous glacier responses to 20th century climatic changes in Darwin Cordillera, southern Chile. J. Glaciol. 41 (139), 465–473. doi:10.3189/s0022143000034808
Huggel, C., Kääb, A., Haeberli, W., Teysseire, P., and Paul, F. (2002). Remote sensing based assessment of hazards from glacier lake outbursts: a case study in the Swiss Alps. Can. Geotechnical J. 39 (2), 316–330. doi:10.1139/t01-099
Hugonnet, R., McNabb, R., Berthier, E., Menounos, B., Nuth, C., Girod, L., et al. (2021). Accelerated global glacier mass loss in the early twenty-first century. Nature 592 (7856), 726–731. doi:10.1038/s41586-021-03436-z
Huss, M., Bauder, A., Werder, M., Funk, M., and Hock, R. (2007). Glacier-dammed lake outburst events of Gornersee, Switzerland. J. Glaciol. 53 (181), 189–200. doi:10.3189/172756507782202784
Hyades, P. (1887). Mission scientifique du cap Horn. Paris: Gauthier-Villars, 1882–1883. Geologie (Tome IV).
Iribarren Anacona, P., Norton, K. P., and Mackintosh, A. (2014). Moraine-dammed lake failures in Patagonia and assessment of outburst susceptibility in the Baker Basin. Nat. Hazards Earth Syst. Sci. 14 (12), 3243–3259. doi:10.5194/nhess-14-3243-2014
Iribarren Anacona, P., Mackintosh, A., and Norton, K. (2015a). Reconstruction of a glacial lake outburst flood (GLOF) in the Engaño Valley, Chilean patagonia: lessons for GLOF risk management. Sci. Total Environ. 527–528, 1–11. doi:10.1016/j.scitotenv.2015.04.096
Iribarren Anacona, P., Mackintosh, A., and Norton, K. P. (2015b). Hazardous processes and events from glacier and permafrost areas: lessons from the Chilean and Argentinean andes. Earth Surf. Process. Landforms 40 (1), 2–21. doi:10.1002/esp.3524
Iribarren Anacona, P., Norton, K., Mackintosh, A., Escobar, F., Allen, S., Mazzorana, B., et al. (2018). Dynamics of an outburst flood originating from a small and high-altitude glacier in the Arid Andes of Chile. Nat. Hazards 94 (1), 93–119. doi:10.1007/s11069-018-3376-y
Iribarren Anacona, P., Sepúlveda, C., Berkhoff, J., Rojas, I., Zingaretti, V., Mao, L., et al. (2023). “Cascading impacts of GLOFs in fluvial systems: the Laguna espontánea GLOF in patagonia,” in Rivers of southern Chile and patagonia: context, Cascade process, geomorphic evolution and risk management. Editors C. Oyarzún, B. Mazzorana, P. Iribarren Anacona, and A. Iroumé (Springer International Publishing), 139–153. doi:10.1007/978-3-031-26647-8_8
Izagirre, E., Glasser, N., Menounos, B., Aravena, J.-C., Faria, S., and Antiguedad, I. (2024). The glacial geomorphology of the Cordillera Darwin Icefield, Tierra del Fuego, southernmost South America. J. Maps 20 (1), 2378000. doi:10.1080/17445647.2024.2378000
Jacquet, J., McCoy, S. W., McGrath, D., Nimick, D. A., Fahey, M., O’kuinghttons, J., et al. (2017). Hydrologic and geomorphic changes resulting from episodic glacial lake outburst floods: rio Colonia, patagonia, Chile. Geophys. Res. Lett. 44 (2), 854–864. doi:10.1002/2016GL071374
J. S. Kargel, G. J. Leonard, M. P. Bishop, A. Kääb, and B. H. Raup (2014). Global land ice measurements from space (Springer Berlin Heidelberg). doi:10.1007/978-3-540-79818-7
Kienholz, C., Pierce, J., Hood, E., Amundson, J. M., Wolken, G. J., Jacobs, A., et al. (2020). Deglacierization of a marginal basin and implications for outburst floods, mendenhall glacier, Alaska. Front. Earth Sci. 8, 137. doi:10.3389/feart.2020.00137
King, O., Bhattacharya, A., Bhambri, R., and Bolch, T. (2019). Glacial lakes exacerbate Himalayan glacier mass loss. Sci. Rep. 9 (1), 18145. doi:10.1038/s41598-019-53733-x
Kirschbaum, D., Watson, C. S., Rounce, D. R., Shugar, D. H., Kargel, J. S., Haritashya, U. K., et al. (2019). The state of remote sensing capabilities of cascading hazards over high Mountain Asia. Front. Earth Sci. 7, 197. doi:10.3389/feart.2019.00197
Koppes, M., Hallet, B., and Anderson, J. (2009). Synchronous acceleration of ice loss and glacial erosion, Glaciar Marinelli, Chilean Tierra del Fuego. J. Glaciol. 55 (190), 207–220. doi:10.3189/002214309788608796
Korup, O., and Tweed, F. (2007). Ice, moraine, and landslide dams in mountainous terrain. Quat. Sci. Rev. 26 (25), 3406–3422. doi:10.1016/j.quascirev.2007.10.012
Langhamer, L., Sauter, T., Temme, F., Werner, N., Heinze, F., Arigony-Neto, J., et al. (2024). Response of lacustrine glacier dynamics to atmospheric forcing in the Cordillera Darwin. J. Glaciol. 70, e8–e19. doi:10.1017/jog.2024.14
Liestøl, O. (1956). Glacier dammed Lakes in Norway. Norsk Geografisk Tidsskrift - Nor. J. Geogr. 15 (3–4), 122–149. doi:10.1080/00291955608542772
Liu, J.-J., Cheng, Z.-L., and Li, Y. (2014). The 1988 glacial lake outburst flood in Guangxieco Lake, Tibet, China. Nat. Hazards Earth Syst. Sci. 14 (11), 3065–3075. doi:10.5194/nhess-14-3065-2014
Lliboutry, L. (1956). Nieves y glaciares de Chile: Fundamentos de glaciología. Santiago de, Chile; : Ediciones de la Universidad de Chile. Available online at: https://libros.uchile.cl/1339.
Lliboutry, L. (1998). Glaciers of the wet andes USGS P 1386-I; glaciers of South America. U.S. Geological Professional Paper, 148–206. Available online at: https://pubs.usgs.gov/pp/p1386i/chile-arg/wet/ (Accessed January 13, 2025).
Lopez, P., Chevallier, P., Favier, V., Pouyaud, B., Ordenes, F., and Oerlemans, J. (2010). A regional view of fluctuations in glacier length in southern South America. Glob. Planet. Change 71 (1–2), 85–108. doi:10.1016/j.gloplacha.2009.12.009
Loriaux, T., and Casassa, G. (2013). Evolution of glacial lakes from the Northern Patagonia Icefield and terrestrial water storage in a sea-level rise context. Glob. Planet. Change 102, 33–40. doi:10.1016/j.gloplacha.2012.12.012
Lützow, N., Veh, G., and Korup, O. (2023). A global database of historic glacier lake outburst floods. Earth Syst. Sci. Data 15 (7), 2983–3000. doi:10.5194/essd-15-2983-2023
Lützow, N., Higman, B., Truffer, M., Bookhagen, B., Knuth, F., Korup, O., et al. (2025). Larger lake outbursts despite glacier thinning at ice-dammed desolation Lake, Alaska. EGUsphere, 1–29. doi:10.5194/egusphere-2024-2812
Marzeion, B., Cogley, J. G., Richter, K., and Parkes, D. (2014). Attribution of global glacier mass loss to anthropogenic and natural causes. Science 345 (6199), 919–921. doi:10.1126/science.1254702
Mathews, W. H., and Clague, J. J. (1993). The record of jökulhlaups from summit Lake, northwestern British Columbia. Can. J. Earth Sci. 30 (3), 499–508. doi:10.1139/e93-039
McSaveney, M. J. (2002). “Recent rockfalls and rock avalanches in Mount Cook national park, New Zealand,”. Catastrophic landslides: effects, occurrence, and mechanisms. Editors S. G. Evans, and J. V. Degraff (Geological Society of America), XV, 35–70. doi:10.1130/REG15-p35
Meier, W. J.-H., Grießinger, J., Hochreuther, P., and Braun, M. H. (2018). An updated multi-temporal glacier inventory for the patagonian andes with changes between the little ice age and 2016. Front. Earth Sci. 6, 62. doi:10.3389/feart.2018.00062
Melkonian, A. K., Willis, M. J., Pritchard, M. E., Rivera, A., Bown, F., and Bernstein, S. A. (2013). Satellite-derived volume loss rates and glacier speeds for the Cordillera Darwin icefield, Chile. Cryosphere 7 (3), 823–839. doi:10.5194/tc-7-823-2013
Mercer, J. H. (1967). Southern hemisphere glacier atlas (67-76-ES) Defense Technical Information Center. Earth Science Laboratory. Natick Laboratories, United States Army
Minowa, M., Schaefer, M., Sugiyama, S., Sakakibara, D., and Skvarca, P. (2021). Frontal ablation and mass loss of the Patagonian icefields. Earth Planet. Sci. Lett. 561, 116811. doi:10.1016/j.epsl.2021.116811
NASA Shuttle Radar Topography Mission (SRTM) (2013). Shuttle radar topography mission (SRTM) global. Distrib. by Opentopogr. doi:10.5069/G9445JDF
Neupane, R., Chen, H., and Cao, C. (2019). Review of moraine dam failure mechanism. Geomatics, Nat. Hazards Risk 10 (1), 1948–1966. doi:10.1080/19475705.2019.1652210
Nie, Y., Liu, W., Liu, Q., Hu, X., and Westoby, M. J. (2020). Reconstructing the chongbaxia tsho glacial lake outburst flood in the Eastern Himalaya: evolution, process and impacts. Geomorphology 370, 107393. doi:10.1016/j.geomorph.2020.107393
Osti, R., and Egashira, S. (2009). Hydrodynamic characteristics of the Tam Pokhari glacial lake outburst flood in the mt. Everest region, Nepal. Hydrol. Process. 23 (20), 2943–2955. doi:10.1002/hyp.7405
O’Connor, J. E., Clague, J. J., Walder, J. S., Manville, V., and Beebee, R. A. (2022). “6.36—Outburst floods,” in Treatise on geomorphology. Editors J. Jack, and F. Shroder Second Edition (Academic Press), 765–819. doi:10.1016/B978-0-12-818234-5.00007-9
Pietrek, A. G., and Fasola, L. (2014). Origin and history of the beaver introduction in South America. Mastozoología Neotropical 21 (2), 355–359.
Piret, L., Bertrand, S., Hawkings, J., Kylander, M. E., Torrejón, F., Amann, B., et al. (2021). High-resolution fjord sediment record of a receding glacier with growing intermediate proglacial lake (Steffen Fjord, Chilean Patagonia). Earth Surf. Process. Landforms 46 (1), 239–251. doi:10.1002/esp.5015
Piret, L., Bertrand, S., Nguyen, N., Hawkings, J., Rodrigo, C., and Wadham, J. (2022). Long-lasting impacts of a 20th century glacial lake outburst flood on a Patagonian fjord-river system (Pascua River). Geomorphology 399, 108080. doi:10.1016/j.geomorph.2021.108080
Planet Team (2024). “Planet application program interface,” in Space for life on Earth. Available online at: https://api.planet.com (Accessed January 10, 2025)
Porter, C., and Santana, A. (2003). Rapid 20th century retreat of ventisquero marinelli in the Cordillera Darwin icefield. An. Inst. Patagon. (Chile) 31, 17–26.
Post, A., and Mayo, L. R. (1971). Glacier dammed lakes and outburst floods in Alaska. U.S. Geol. Surv. 455. doi:10.3133/ha455
Quincey, D. J., Lucas, R. M., Richardson, S. D., Glasser, N. F., Hambrey, M. J., and Reynolds, J. M. (2005). Optical remote sensing techniques in high-mountain environments: application to glacial hazards. Prog. Phys. Geogr. Earth Environ. 29 (4), 475–505. doi:10.1191/0309133305pp456ra
Quincey, D. J., Richardson, S. D., Luckman, A., Lucas, R. M., Reynolds, J. M., Hambrey, M. J., et al. (2007). Early recognition of glacial lake hazards in the Himalaya using remote sensing datasets. Glob. Planet. Change 56 (1–2), 137–152. doi:10.1016/j.gloplacha.2006.07.013
Reynhout, S. A., Kaplan, M. R., Sagredo, E. A., Aravena, J. C., Soteres, R. L., Schwartz, R., et al. (2021). Holocene glacier history of northeastern Cordillera Darwin, southernmost South America (55°S). Quat. Res. 105, 166–181. doi:10.1017/qua.2021.45
Reynolds, J. M. (1992). “The identification and mitigation of glacier-related hazards: examples from the Cordillera Blanca, Peru,” in Geohazards: natural and man-made. Editors G. J. H. McCall, D. J. C. Laming, and S. C. Scott (Netherlands: Springer), 143–157. doi:10.1007/978-94-009-0381-4_13
Richardson, S. D., and Reynolds, J. M. (2000). An overview of glacial hazards in the Himalayas. Quat. Int. 65 (66), 31–47. doi:10.1016/S1040-6182(99)00035-X
Rick, B., McGrath, D., Armstrong, W., and McCoy, S. W. (2022). Dam type and lake location characterize ice-marginal lake area change in Alaska and NW Canada between 1984 and 2019. Cryosphere 16 (1), 297–314. doi:10.5194/tc-16-297-2022
Rick, B., McGrath, D., McCoy, S. W., and Armstrong, W. H. (2023). Unchanged frequency and decreasing magnitude of outbursts from ice-dammed lakes in Alaska. Nat. Commun. 14 (1), 6138. Article 1. doi:10.1038/s41467-023-41794-6
Rivera, A., Aravena, J. C., and Casassa, G. (1997). Recent fluctuations of Glaciar Pio XI, Patagonia: discussion of a glacial surge hypothesis. Mt. Res. Dev. 17 (4), 309–322. doi:10.2307/3674021
Roe, G. H., Baker, M. B., and Herla, F. (2017). Centennial glacier retreat as categorical evidence of regional climate change. Nat. Geosci. 10 (2), 95–99. doi:10.1038/ngeo2863
Rounce, D. R., McKinney, D. C., Lala, J. M., Byers, A. C., and Watson, C. S. (2016). A new remote hazard and risk assessment framework for glacial lakes in the Nepal Himalaya. Hydrology Earth Syst. Sci. 20 (9), 3455–3475. doi:10.5194/hess-20-3455-2016
San Martín, C. N., Ponce, J. F., Montes, A., Díaz Balocchi, L., Gorza, C., and Coronato, A. (2021). Proglacial landform assemblage in a rapidly retreating cirque glacier due to temperature increase since 1970, Fuegian Andes, Argentina. Geomorphology 390, 107861. doi:10.1016/j.geomorph.2021.107861
Santana, A., Porter, C., Butorovic, N., and Olave, C. (2006). Primero antecedentes climatológicos de estaciones automáticas (AWS) en el Canal Beagle, Magallanes, Chile. An. Inst. Patagon. (Chile) 34, 5–20.
Sharma, S., Talchabhadel, R., Nepal, S., Ghimire, G. R., Rakhal, B., Panthi, J., et al. (2023). Increasing risk of cascading hazards in the central Himalayas. Nat. Hazards 119 (2), 1117–1126. doi:10.1007/s11069-022-05462-0
Shugar, D. H., Burr, A., Haritashya, U. K., Kargel, J. S., Watson, C. S., Kennedy, M. C., et al. (2020). Rapid worldwide growth of glacial lakes since 1990. Nat. Clim. Change 10 (10), 939–945. doi:10.1038/s41558-020-0855-4
Skewes, O., Gonzalez, F., Olave, R., Ávila, A., Vargas, V., Paulsen, P., et al. (2006). Abundance and distribution of American beaver, Castor canadensis (Kuhl 1820), in Tierra del Fuego and Navarino islands, Chile. Eur. J. Wildl. Res. 52 (4), 292–296. doi:10.1007/s10344-006-0038-2
Strelin, J., and Iturraspe, R. (2007). Recent evolution and mass balance of Cordón Martial glaciers, Cordillera Fueguina Oriental. Glob. Planet. Change 59 (1–4), 17–26. doi:10.1016/j.gloplacha.2006.11.019
Sugiyama, S., Minowa, M., and Schaefer, M. (2019). Underwater ice terrace observed at the front of glaciar grey, a freshwater calving glacier in patagonia. Geophys. Res. Lett. 46 (5), 2602–2609. doi:10.1029/2018GL081441
Taylor, C., Robinson, T. R., Dunning, S., Rachel Carr, J., and Westoby, M. (2023). Glacial lake outburst floods threaten millions globally. Nat. Commun. 14 (1), 487. Article 1. doi:10.1038/s41467-023-36033-x
Temme, F., Sommer, C., Schaefer, M., Jaña, R., Arigony-Neto, J., Gonzalez, I., et al. (2025). Climate’s firm grip on glacier ablation in the Cordillera Darwin Icefield, Tierra del Fuego. Nat. Commun. 16 (1), 2677. doi:10.1038/s41467-025-57698-6
Thorarinsson, S. (1939). Chapter IX. The ice dammed lakes of Iceland with particular reference to their values as indicators of glacier oscillations. Geogr. Ann. 21 (3–4), 216–242. doi:10.1080/20014422.1939.11880679
Tweed, F. S., and Carrivick, J. L. (2015). Deglaciation and proglacial lakes. Geol. Today 31 (3), 96–102. doi:10.1111/gto.12094
Tweed, F. S., and Russell, A. J. (1999). Controls on the formation and sudden drainage of glacier-impounded lakes: implications for jökulhlaup characteristics. Prog. Phys. Geogr. 23 (1), 79–110. doi:10.1177/030913339902300104
Vandekerkhove, E., Bertrand, S., Torrejón, F., Kylander, M. E., Reid, B., and Saunders, K. M. (2021). Signature of modern glacial lake outburst floods in fjord sediments (Baker River, southern Chile). Sedimentology 68 (6), 2798–2819. doi:10.1111/sed.12874
Veh, G., Korup, O., von Specht, S., Roessner, S., and Walz, A. (2019). Unchanged frequency of moraine-dammed glacial lake outburst floods in the Himalaya. Nat. Clim. Change 9 (5), 379–383. Article 5. doi:10.1038/s41558-019-0437-5
Veh, G., Korup, O., and Walz, A. (2020). Hazard from Himalayan glacier lake outburst floods. Proc. Natl. Acad. Sci. 117 (2), 907–912. doi:10.1073/pnas.1914898117
Veh, G., Lützow, N., Kharlamova, V., Petrakov, D., Hugonnet, R., and Korup, O. (2022). Trends, breaks, and biases in the frequency of reported glacier Lake outburst floods. Earth’s Future 10 (3), e2021EF002426. doi:10.1029/2021EF002426
Veh, G., Lützow, N., Tamm, J., Luna, L. V., Hugonnet, R., Vogel, K., et al. (2023). Less extreme and earlier outbursts of ice-dammed lakes since 1900. Nature 614, 701–707. doi:10.1038/s41586-022-05642-9
Veh, G., Wang, B. G., Zirzow, A., Schmidt, C., Lützow, N., Steppat, F., et al. (2025). Progressively smaller glacier lake outburst floods despite worldwide growth in lake area. Nat. Water 3, 271–283. doi:10.1038/s44221-025-00388-w
Vuichard, D., and Zimmermann, M. (1987). The 1985 catastrophic drainage of a moraine-dammed Lake, khumbu Himal, Nepal: cause and consequences. Mt. Res. Dev. 7 (2), 91–110. doi:10.2307/3673305
Walder, J. S., and Costa, J. E. (1996). Outburst floods from glacier-dammed Lakes: the effect of mode of Lake drainage on flood magnitude. Earth Surf. Process. Landforms 21 (8), 701–723. doi:10.1002/(SICI)1096-9837(199608)21:8<701::AID-ESP615>3.0.CO;2-2
Wang, W., Xiang, Y., Gao, Y., Lu, A., and Yao, T. (2015). Rapid expansion of glacial lakes caused by climate and glacier retreat in the central Himalayas. Hydrol. Process. 29 (6), 859–874. doi:10.1002/hyp.10199
Watanbe, T., and Rothacher, D. (1996). The 1994 lugge Tsho Glacial Lake outburst flood, Bhutan himalaya. Mt. Res. Dev. 16 (1), 77–81. doi:10.2307/3673897
Westbrook, C. J., Cooper, D. J., and Anderson, C. B. (2017). Alteration of hydrogeomorphic processes by invasive beavers in southern South America. Sci. Total Environ. 574, 183–190. doi:10.1016/j.scitotenv.2016.09.045
Westoby, M. J., Glasser, N. F., Brasington, J., Hambrey, M. J., Quincey, D. J., and Reynolds, J. M. (2014). Modelling outburst floods from moraine-dammed glacial lakes. Earth-Science Rev. 134, 137–159. doi:10.1016/j.earscirev.2014.03.009
Wilcox, A. C., Wade, A. A., and Evans, E. G. (2014). Drainage events from a glacier-dammed lake, Bear Glacier, Alaska: remote sensing and field observations. Geomorphology 220, 41–49. doi:10.1016/j.geomorph.2014.05.025
Wilson, R., Carrión, D., and Rivera, A. (2016). Detailed dynamic, geometric and supraglacial moraine data for Glaciar Pio XI, the only surge-type glacier of the Southern Patagonia Icefield. Ann. Glaciol. 57 (73), 119–130. doi:10.1017/aog.2016.32
Wilson, R., Glasser, N. F., Reynolds, J. M., Harrison, S., Anacona, P. I., Schaefer, M., et al. (2018). Glacial lakes of the central and patagonian andes. Glob. Planet. Change 162, 275–291. doi:10.1016/j.gloplacha.2018.01.004
Wilson, R., Harrison, S., Reynolds, J., Hubbard, A., Glasser, N. F., Wündrich, O., et al. (2019). The 2015 chileno valley glacial Lake outburst flood, patagonia. Geomorphology 332, 51–65. doi:10.1016/j.geomorph.2019.01.015
Wolfe, D. F. G., Kargel, J. S., and Leonard, G. J. (2014). “Glacier-dammed ice-marginal Lakes of Alaska,” in Global land ice measurements from space. Editors J. S. Kargel, G. J. Leonard, M. P. Bishop, A. Kääb, and B. H. Raup (Springer), 263–295. doi:10.1007/978-3-540-79818-7_12
Wood, J. L., Harrison, S., Wilson, R., Emmer, A., Kargel, J. S., Cook, S. J., et al. (2024). Shaking up assumptions: earthquakes have rarely triggered Andean glacier Lake outburst floods. Geophys. Res. Lett. 51 (7), e2023GL105578. doi:10.1029/2023GL105578
Worni, R., Stoffel, M., Huggel, C., Volz, C., Casteller, A., and Luckman, B. (2012). Analysis and dynamic modeling of a moraine failure and glacier lake outburst flood at Ventisquero Negro, Patagonian Andes (Argentina). J. Hydrology 444–445, 134–145. doi:10.1016/j.jhydrol.2012.04.013
Zemp, M., Frey, H., Gärtner-Roer, I., Nussbaumer, S. U., Hoelzle, M., Paul, F., et al. (2015). Historically unprecedented global glacier decline in the early 21st century. J. Glaciol. 61 (228), 745–762. doi:10.3189/2015JoG15J017
Zemp, M., Huss, M., Thibert, E., Eckert, N., McNabb, R., Huber, J., et al. (2019). Global glacier mass changes and their contributions to sea-level rise from 1961 to 2016. Nature 568 (7752), 382–386. doi:10.1038/s41586-019-1071-0
Zemp, M., Jakob, L., Dussaillant, I., Nussbaumer, S. U., Gourmelen, N., Dubber, S., et al. (2025). Community estimate of global glacier mass changes from 2000 to 2023. Nature 1–7, 382–388. doi:10.1038/s41586-024-08545-z
Zhang, G., Bolch, T., Allen, S., Linsbauer, A., Chen, W., and Wang, W. (2019). Glacial lake evolution and glacier–lake interactions in the Poiqu River basin, central Himalaya, 1964–2017. J. Glaciol. 65 (251), 347–365. doi:10.1017/jog.2019.13
Zhang, G., Bolch, T., Yao, T., Rounce, D. R., Chen, W., Veh, G., et al. (2023). Underestimated mass loss from lake-terminating glaciers in the greater Himalaya. Nat. Geosci. 16 (4), 333–338. doi:10.1038/s41561-023-01150-1
Zhang, G., Carrivick, J. L., Emmer, A., Shugar, D. H., Veh, G., Wang, X., et al. (2024). Characteristics and changes of glacial lakes and outburst floods. Nat. Rev. Earth and Environ. 5 (6), 447–462. doi:10.1038/s43017-024-00554-w
Keywords: glacial lakes, GLOF, Cordillera Darwin Icefield, Tierra del Fuego, Patagonia
Citation: Izagirre E, Casassa G, Dussaillant I, Miles ES, Wilson R, Rada C, Faria SH and Antiguedad I (2025) Evolution of glacial lakes and southernmost GLOFs in the Cordillera Darwin and Cloue Icefields (Tierra del Fuego) between 1945–2024. Front. Earth Sci. 13:1641167. doi: 10.3389/feart.2025.1641167
Received: 04 June 2025; Accepted: 28 August 2025;
Published: 17 September 2025.
Edited by:
Daniel Falaschi, CONICET Argentine Institute of Nivology, Glaciology and Environmental Sciences (IANIGLA), ArgentinaReviewed by:
Adam Emmer, University of Graz, AustriaMariana Correas-Gonzalez, CONICET Argentine Institute of Nivology, Glaciology and Environmental Sciences (IANIGLA), Argentina
Copyright © 2025 Izagirre, Casassa, Dussaillant, Miles, Wilson, Rada, Faria and Antiguedad. This is an open-access article distributed under the terms of the Creative Commons Attribution License (CC BY). The use, distribution or reproduction in other forums is permitted, provided the original author(s) and the copyright owner(s) are credited and that the original publication in this journal is cited, in accordance with accepted academic practice. No use, distribution or reproduction is permitted which does not comply with these terms.
*Correspondence: Eñaut Izagirre, ZW5hdXQuaXphZ2lycmVAZWh1LmV1cw==