 Wenya Jiang1,2,3
 Yuchen Liu
- 1State Key Laboratory of Petroleum Resources and Prospecting, China University of Petroleum, Beijing, China
- 2College of Geosciences, China University of Petroleum, Beijing, China
- 3PetroChina Dagang Oilfield Company, Tianjin, China
- 4Northeast Petroleum University, Daqing, China
This study focused on the typical lithofacies of well QY12-1-1 in Qikou Sag, carried out geochemical experiments, multi-temperature pyrolysis experiments and stepwise solvent extraction of soluble organic matter analysis, and established quantitative evaluation techniques for different occurrence states of medium mature shale. Shale oil with different lithologic facies and different occurrence states in the core section of the Shahejie Formation in the Qikou Sag was quantitatively evaluated. An improved four-step pyrolysis scheme of 300°C, 375°C, 400°C, and 600°C was developed to experimentally analyze shale oil core samples. The results indicated that the free oil content of the Es3 shale in the Qikou Sag was 1.1–8.06 mg/g (average of 4.19 mg/g); the mobile oil content accounted for 54.72%. The adsorbed oil content was 2.2–3.73 mg/g, with an average of 2.05 mg/g. The mobile, heavy free, and adsorbed oil contents were high in the thin, medium, and thick-lamellar mixed shale, as well as in the thin and medium-laminated calcareous shale. The mobile, heavy free, and adsorbed oil contents in the thin-layered mixed shale exceeded that in the medium-laminated felsic shale, with the thin-laminated felsic and thick-layered mixed shales exhibiting the content values. The newly established characterization method of hydrocarbons with different occurrence states exhibited good correlation with the conventional pyrolysis methods and the distributed solvent extraction results. Therefore, the proposed method can be used to study the occurrence mechanism of shale oil and a rapid evaluation of shale oil content.
Introduction
The successful exploitation of marine shale formations in North America has reshaped the global energy landscape (EIA U.S., 2022; Breyer, 2012; Wood, 2011; Camp et al., 2013). In China, significant discoveries have been made while exploring continental shale oil in large basins, such as the Ordos, Songliao, and Bohai Bay. These discoveries have revealed the broad prospect for increasing oil storage and production and sustainable development in continental basins (Zou et al., 2022; Jiao et al., 2020; Gao et al., 2023; Guo et al., 2023; Xu et al., 2025). Shale oil exploration practices indicate that the shale formations having commercial mining potential are characterized by high oil content. The occurrence forms of shale oil primarily include the free and adsorbed states (Zhang et al., 2012; Zou, 2013). It is generally believed that free oil is crucial to shale oil production under the current technical conditions. Moreover, its content is a key factor affecting the commercial exploitation of shale oil (Jiang et al., 2016a; Tinnin et al., 2014; Liu et al., 2019). Therefore, the accurate characterization of the oil content of shale formations and the analysis of the quantities of shale oil in different states are of great significance for investigating the occurrence and enrichment laws of shale oil and optimizing favorable target areas for shale oil exploration (Li et al., 2017; Song et al., 2013).
Continental shale formations have strong heterogeneity, manifested in rapid lithology and lithofacies changes, as well as significant differences in the storage space and pore structure of shale (He et al., 2023; Fu et al., 2022; Zhao et al., 2023). These factors result in diverse occurrence forms of shale oil. However, the primary controlling factors for the enrichment of sweet spots remain unclear. Based on the characteristics of shale oil in different occurrence states, scholars have extensively explored several quantitative characterization methods (Jiang et al., 2016b; Pan and Liu, 2009; Yu et al., 2017; Chen and Zhang, 2017; Li et al., 2017; Li et al., 2018; Abrams et al., 2017; Romero-Sarmiento et al., 2016; Zhang et al., 2020). The current methods are stepwise solvent extraction and multi-temperature pyrolysis. In the stepwise solvent extraction method, multiple extractions of shale oil samples using solvents of varying polarities and conditions are involved. Owing to the different occurrence spaces and molecular polarities of the hydrocarbons, the free oil occurring in large pores and fractures is preferentially extracted. However, e the adsorbed oil in smaller pores or near pore walls, with stronger molecular polarity, requires more polar solvents and longer extraction times. Consequently, the shale oil quantity in different states can be quantitatively studied by employing reasonable extraction solvents and methods (Pan and Liu, 2009; Yu et al., 2017; Chen and Zhang, 2017). However, the operation is complex, requires high experimental acumen, and is plagued by challenges in terms of controlling the particle size. Moreover, the pore structure of the shale may cause the simultaneous extraction of free and adsorbed oil. The multi-temperature pyrolysis method involves characterization by setting temperature nodes to cause the shale oil in different occurrence states to release in segments. This method exploits the different thermal release temperatures of light hydrocarbons, heavy hydrocarbons, adsorbed hydrocarbons, and kerogen. Compared with the conventional two-stage pyrolysis, it can distinguish between adsorbed hydrocarbons and hydrocarbons pyrolyzed from kerogen. Moreover, it can more accurately characterize the occurrence state of shale oil. Although the multi-temperature stage pyrolysis method addresses several issues such as incomplete separation of conventional pyrolysis components and heavy hydrocarbon loss in conventional pyrolysis, there exists no unitive method suitable for every region (Jiang et al., 2016b; Li et al., 2017; Li et al., 2018; Abrams et al., 2017; Romero-Sarmiento et al., 2016; Zhang et al., 2020).
This study investigated the oil content and hydrocarbon occurrence states in typical lithological-facies types of organic-rich shale formations. Consequently, the free, adsorbed, and movable oil contents in the typical lithology-lithofacies types of the shale formation of the Shahejie Formation in the Qikou Sag were obtained. The results of this study provide reliable technical parameters for the selection of sweet spot intervals and calculation of shale oil resources.
Geological background
The Qikou Sag is located in the central–northern part of the Huanghua Depression. It is a sedimentary sag that has been developing since the Oligocene (Figure 1). Its structural pattern, characterized by more sags and fewer bulges and multiple sedimentation centers, has shaped the Paleogene features in the Qikou Sag, including various slope types. In the planar direction, the sag is centered around the Qikou main sag, with five broad and gentle slope structural areas extending from north to south, namely the Beitang Slope, Banqiao Slope, Qibei Slope, Qinan Slope, and Chenghai Slope (Zhao et al., 2016; Zhao et al., 2017). Thick mud shales have developed in the middle and lower parts of the slope zones. These not only serve as abundant sources of oil and gas for conventional oil and gas reservoirs, but the content of retained hydrocarbons provides favorable conditions shale oil accumulation (Zhou et al., 2020; Zhou et al., 2021).
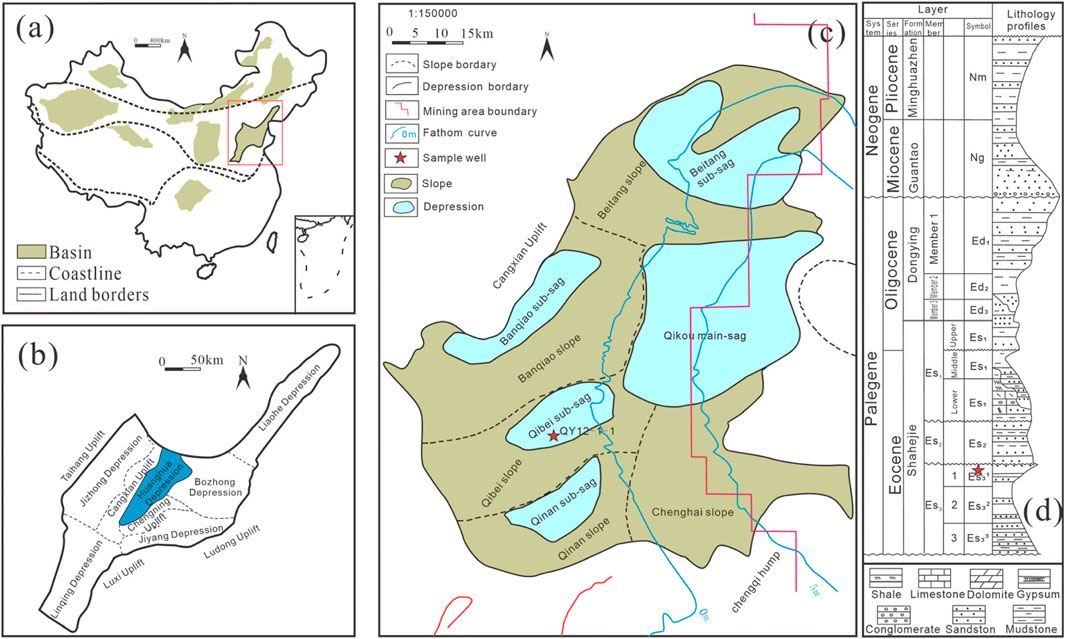
Figure 1. (a) Simplified view of the outline of China. (b) Simplified distribution map of the tectonic units in the Bohai Bay Basin. (c) Enlarged view of the Qikou Sag of the Huanghua Depression of the Bohai Bay Basin. (d) Composite stratigraphic columnar section of the Bohai Bay Basin.
The Paleogene of the Qikou Sag developed several sets of source rocks of the Es3 member, Es2 member, Es1 member, and Dongying Formation (Figure 1d). The Es3 member is one of the main hydrocarbon generating strata. Influenced by the source supply of the Cangxian, Gangxi, and Kongdian–Yangsanmu uplifts, the clastic material supply was sufficient. The near-provenance area, lake bay area, semi-deep lake area, and semi-deep lake-deep lake are dominated by the felsic shale, calcareous shale, mixed shale, and shale oil and gas (Pu et al., 2023), respectively. According to Zhou et al. (2024), most shale samples are characterized by high organic matter content (TOC content range of 0.6–1.3 wt%), and kerogen primarily are types II1 and II2. The distribution of Ro ranges across 0.8%–1.2%, with an average value of 0.92%, and the Tmax ranges across 435°C–450°C. The source rocks in this area are in the stage of medium maturity. This study focused on the Es3 member of the Shahejie Formation in the Qibei sub-sag, which has a high conventional oil and gas exploration degree and abundant data.
Samples and methods
Conventional pyrolysis method
Tis study performed a rock pyrolysis analysis using the Rock-Eval VI pyrolyzer equipped with a flame ionization detector. The pyrolysis steps and instrument parameters were adopted from the studies by Lafargue et al. (1990) and Behar et al. (2001). In our study, we measured 68 mudstone core samples of Es3 intervals from the QY12-1-1 well within the Qikou Sag of the Bohai Bay Basin.
Mineral composition
The total mineral composition of the specimens was obtained using X-ray diffraction modes with randomly oriented powders. The mineral composition was tested using a Bruker D33 PHASER X-ray diffractometer. Specimen preparation, experimental device, and analysis were described in detail using the Profex software (Gasparik et al., 2012).
Multi-temperature pyrolysis
In this study, the range of 150°C–600°C was divided into nine temperature segments (150°C–225°C, 225°C–250°C, 250°C–300°C, 300°C–325°C, 325°C–350°C, 350°C–375°C, 375°C–400°C, 400°C–425°C, and 425°C–450°C). Pyrolytic chromatography (PY–GC) was performed to explore the characteristics of the pyrolytic components. The commonly used heating rate of 25°C/min was used as the heating rate, and the residence time of 3 min was set for each temperature level. The specific heating program and related parameters were as follows. Heating was done starting from room temperature (20°C) to 300°C at a heating rate of 25°C/min and the temperature was set as constant for 3 min to obtain the S1-1 peak. Subsequently, heating was done up to 375°C and the temperature was kept constant for 3 min to obtain the S1-2 peak. Thereafter, heating was undertaken till 400°C and the temperature was constant for 3 min to obtain S2-1. Finally, heating was done till 650°C and the temperature was kept constant for 3 min to obtain the S2-2 peak. Here, the S1-1 peak represents the light oil components, the S1-2 peak represents the light and medium oil components, the S2-1 peak is primarily composed of heavy and polar compounds (resins + asphaltenes), and the S2-2 peak primarily comprises the hydrocarbons produced by the thermal decomposition of kerogen in the rock. The sum of S1-1 and S1-2 represents the amount of free oil in the shale. In addition, in terms of mobility speculation, as S1-1 characterizes light oil and it reflects the amount of actually movable oil, the sum of S1-1 and S1-2 reflects the maximum amount of movable oil. Further, the S2-1 peak represents the amount of adsorbed oil (heavy hydrocarbons and the hydrocarbons mutually soluble with kerogen) in the shale, and the S2-2 peak represents the remaining hydrocarbon generation potential of kerogen in the shale (Jiang et al., 2016a).
Stepwise solvent extraction of soluble organic matter
We employed the successive extraction method with different solvent combinations, including two solvent systems with different polarities: the weakly polar solvent was n-hexane and the strongly polar solvent combination was dichloromethane/methanol (volume ratio 93:7). To avoid the loss of light hydrocarbons owing to high temperatures, all extractions were performed at room temperature using ultrasonic-assisted cold extraction. This study followed the experimental methods of previous researchers (Qian et al., 2017; Zhang et al., 2019). It also should be noted that this stepwise extraction could not achieve a complete separation of different occurrence states of oil, but it has reflected the geological laws as much as possible (Qian et al., 2017; Zhang et al., 2019). The detailed steps are as follows.
Step1: The massive samples were weighed and placed separately in clean beakers. A certain amount of the weakly polar solvent n-hexane was added according to the solvent usage ratio, and the mixture was placed into an ultrasonic cleaner for ultrasonic treatment at 4,000 Hz for 10 min. Once completed the mixture was allowed to stand for 60 min. Thereafter, the extraction liquid was filtered and transferred to a new clean sample bottle and was numbered. The massive rock samples were washed three times with clean water and air dried for future use.
Step2: The air-dried massive samples were crushed into 200-mesh powder using a sample crusher. A certain amount of the sample was weighed and extracted with the weakly polar solvent n-hexane. The sample was put into an ultrasonic cleaner for ultrasonic treatment at 4,000 Hz for 10 min. Once completed, the sample was centrifuged at 4,000 r/min for 10 min. After solid–liquid separation, the extraction liquid was filtered and transferred to a new clean sample bottle and was numbered. The powdered sample was washed three times with clean water and air dried for future use.
Step3: A certain amount of the air-dried powdered sample in Step 2 was weighed and placed in a beaker. The strongly polar solvent dichloromethane was added according to the ratio of 1:5, and mixture was put into an ultrasonic cleaner for ultrasonic treatment at 4,000 Hz for 10 min. After completion, the sample was centrifuged at 4,000 r/min for 10 min. Following solid–liquid separation, the extraction liquid was filtered and transferred to a new clean sample bottle and was numbered. The collected extraction liquid was volatilized with the solvent at a low temperature, and then the extract was quantitatively determined by constant weight. Consequently, the extraction yield of each time was calculated.
The n-hexane extraction of the bulk sample in Step 1 reflects the small-molecule free oil, which is the movable oil. The n-hexane extraction of the powdered samples in Step 2 reflects the medium-to-large-molecule free oil. Finally, the cold extraction of dichloromethane:methanol (93:7) from the powdered sample in Step 3 reflects the bound oil.
Results
Mineral composition and rock facies types
The shale mineral composition of the Es3 member of Shahejie Formation is complex, primarily comprising quartz, plagioclase, calcite, iron dolomite, clay minerals, and a small amount of siderite and pyrite. The quartz content ranges as 12.21%–51.38%, with an average content of 30.74%. The content of plagioclase ranges as 2.2%–24.6%, with an average content of 7.7%. The content of ferridolomite in the carbonate minerals ranges as 0%–49.25%, with an average content of 8.29%. Further, the calcite content is 5.1%–43.2%, with an average of 18.09%. Finally, the average clay mineral content is 28.98%, which is primarily composed of illite, illite/monzite, chlorite, and a small amount of kaolinite. With clay, felsic (quartz and feldspar), and carbonate (calcite and dolomite) minerals as the three end-elements and 50% of each mineral content as the dividing line, the shale in the study area is divided into four rock types (Figure 2). According to the distribution of shale points in the three-terminal element diagram, the shale of the Es3 member of the Shahejie Formation is primarily mixed shale, followed by felsic shale. According to the sedimentary structure and the thickness of the sedimentary layer, the fine-grained sedimentary rocks can be divided into thin laminar (<1 mm), medium laminar (1–5 mm), thick laminar (5–1 cm), thin laminar (1–10 cm) and thick laminar (>10 cm). In this study, 12 lithofacies were classified through core observation and thin section identification (Table 1). The shales of the Es3 member in the Qikou Sag mainly develop four lithofacies (i.e., thin-lamellar mixed shale (Figure 3a), meso-lamellar mixed shale (Figure 3b), thin-layered mixed shale (Figure 3c), and thick-layered mixed shales (Figure 3d)). Calcareous shale occurs in the form of interlayers and can be divided into thin-lamellar calcareous shale (Figures 3e,h,i), meso-lamellar calcareous shale (Figure 3F), and thick-lamellar calcareous shale (Figure 3g). Felsic shales are sporadically developed and occur in the form of intercalations (Figures 3k–m).
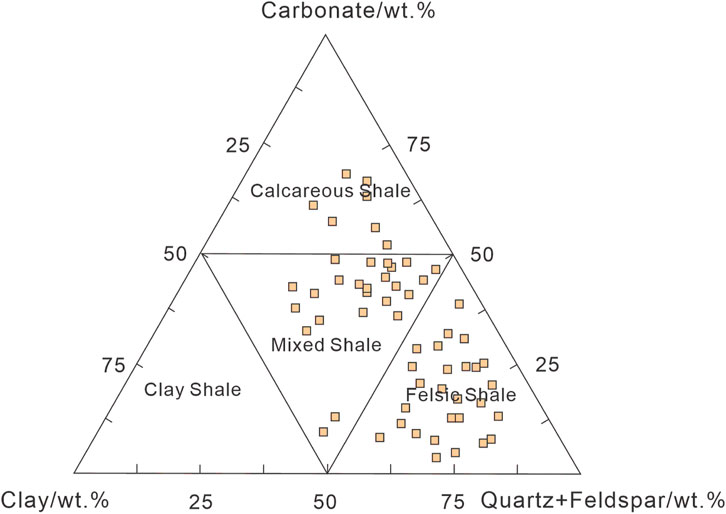
Figure 2. Mineral composition of the Es3 member of the Shahejie Formation.
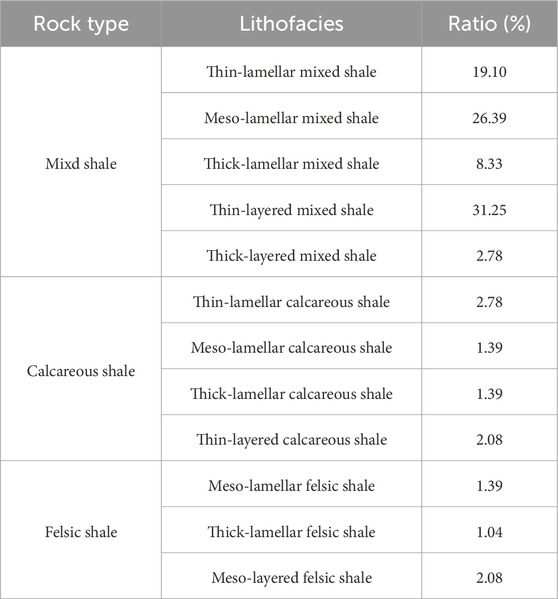
Table 1. Rock facies types of the Es3 member of Shahejie Formation.
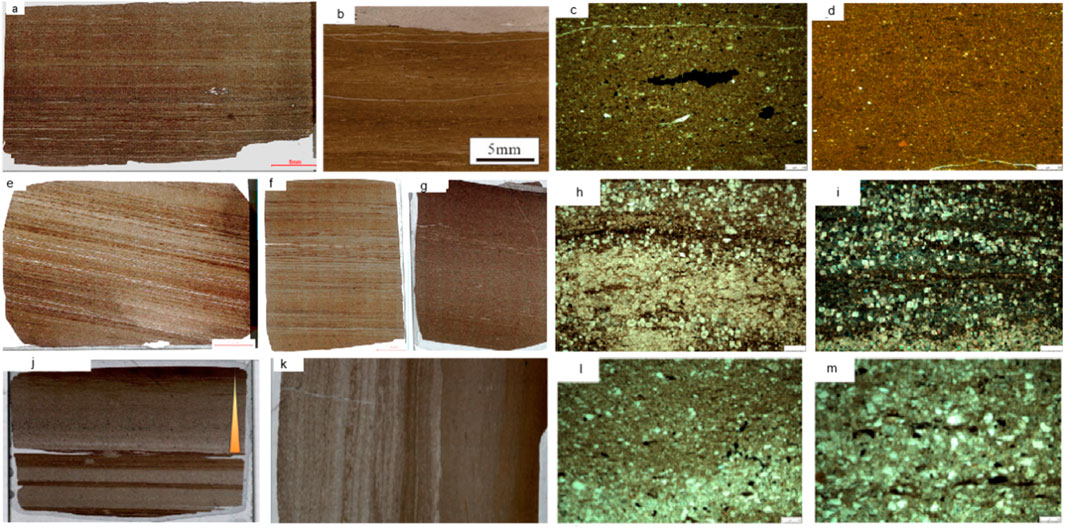
Figure 3. The microscopic photos of samples from the third section of the Qikou Sag. (a)-The thin-lamellar and meso-lamellar mixed shale interbedding, Well QY 12-1-1, 4,018.37 m; (b)-The thick-lamellar mixed shale (under single polarized light), Well QY 12-1-1, 4,016.03 m; (c)-The thin-layered mixed shale with low clay content (under single polarized light), Well QY 12-1-1, 4,043.73 m; (d)-The thick-layered mixed shale with high clay content (under single polarized light), Well QY 12-1-1, 4,066.73 m; (e)-The thin-lamellar calcareous shale, Well QY 12-1-1, 3,997.24 m; (f)-The meso-lamellar calcareous shale and thin-lamellar calcareous shale interbedding thin sections, Well QY12-1-1, 4,000.02 m; (g)-The thick-lamellar and thin-lamellarcalcareous shale interbedding thin sections, Well QY 12-1-1, 4,014.04 m; (h)-The thin-lamellar calcareous shale thin section (under single polarized light), Well F39X1, 4,382.30 m; (i)-The thin-lamellar calcareous shale thin section (under crossed polarized light), Well F39X1, 4,382.30 m; (j)-The meso-lamellar mixed shale and thin-lamellar felsic shale interbedding thin sections, Well F39X1, 4,372.90 m; (k)-The meso-lamellar felsic shale thin sections (under single polarized light), Well QY 12-1-1, 4,064.56 m; (l)-The meso-lamellar felsic shale thin section (under single polarized light), Well QY 12-1-1, 4,064.56 m; (m)-The meso-lamellar felsic shale thin section (under single polarized light), Well QY 12-1-1, 4,064.56 m.
Organic geochemical characterization
Based on the measured TOC, S1, and S2 of 68 samples from the Es3 member of the QY12-1-1 well, the TOC content of the Es3 member ranges as 0.43%–2.46%, with an average value of 1.23%. Approximately 75% of the samples had TOC content less than 2%, and the remaining 25% had TOC content greater than 2.0% and less than 4.0%. The content of S1 ranged as 0.36–5.89 mg/g, with an average value of 2.14 mg/g. The content of S2 ranged as 0.13–6.06 mg/g, with an average of 2.12 mg/g. The content of S1+S2 ranged as 0.72–11.64 mg/g, with an average value of 4.26 mg/g, and most of the samples ranged as 2–6 mg/g, which is a good source rock. According to the relative relationship between the S1 + S2 content, the hydrogen index (HI) content and the TOC content, the source rocks of the Es3 member in the study area are good source rocks. The Tmax-HI diagram was used to systematically evaluate the source rock types of the Es3 member. The HI of the Es3 member ranged as 71.40–361.83, with an average value of 232.20. The organic matter types of the Es3 member were primarily types Ⅱ1 and Ⅱ2, and a small amount of organic matter was of type Ⅲ (Figure 4).
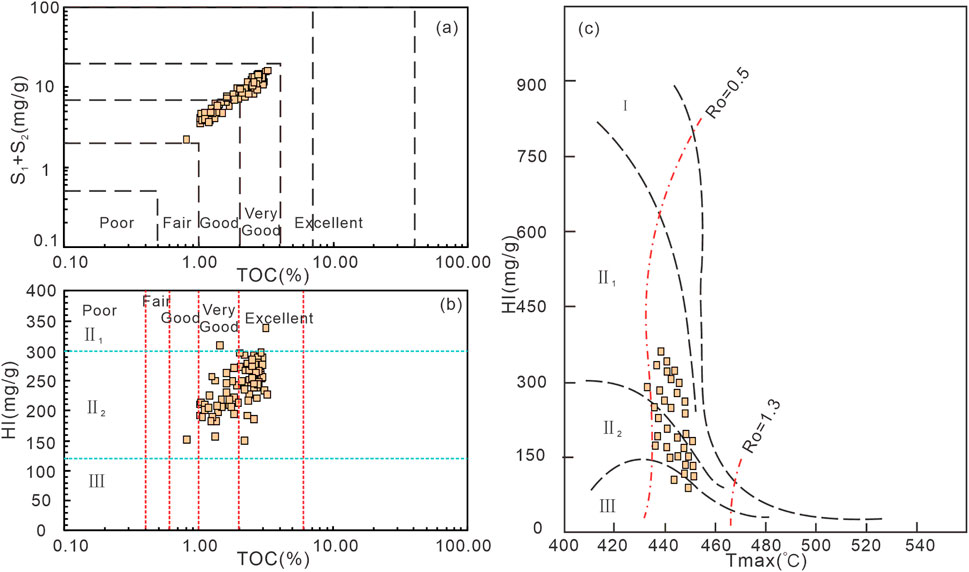
Figure 4. (a) Correlations between total organic carbon (TOC) and the amount of S1 + S2 in the Es3 member. (b) TOC versus the hydrogen index (HI) of the Es3 member. (c) Plot of the temperature of maximum hydrocarbon generation (Tmax) versus the HI of the Es3 member.
Multiple isothermal stages pyrolysis results
The results of the multiple isothermal stages of pyrolysis show that the pyrolysis products below 300°C are primarily normal alkanes. At 200°C, the main peak is C15. In addition, the signal value decreases sharply after C19 and gradually disappears after C25. From 200°C to 225°C, the main peak carbon number is C17. Compared with 200°C, high-carbon n-alkanes with more C19 are obtained, and the signal value extending to C25. Moreover, 225°C–250°C and 250°C–275°C have similar characteristics, wherein the main peak carbon number is C19 and C21, respectively, and an increasing heavy hydrocarbon component. At 300°C–375°C, a very small amount of olefins and light hydrocarbons (from the cracking of a small amount of colloidal asphaltenes) was observed, but more heavy n-alkanes were contained. After 375°C, light hydrocarbons and olefin were identified, showing the characteristics of cracked hydrocarbons. After 400°C, methane appeared, and the unsaturated hydrocarbon content greatly increased, indicating that kerogen began to crack (Figure 5). Therefore, a multi-temperature pyrolysis scheme suitable for the characterization of the occurrence state of shale oil in the Es3 member of the Qikou Sag was established: the amount of mobile oil was measured at 300°C for 3 min, that of medium and heavy free oil was measured at 375°C for 3 min, that of adsorbed oil was measured at 400°C for 3 min, and that of cracked hydrocarbon of kerogen was measured at 650°C (Figure 6).
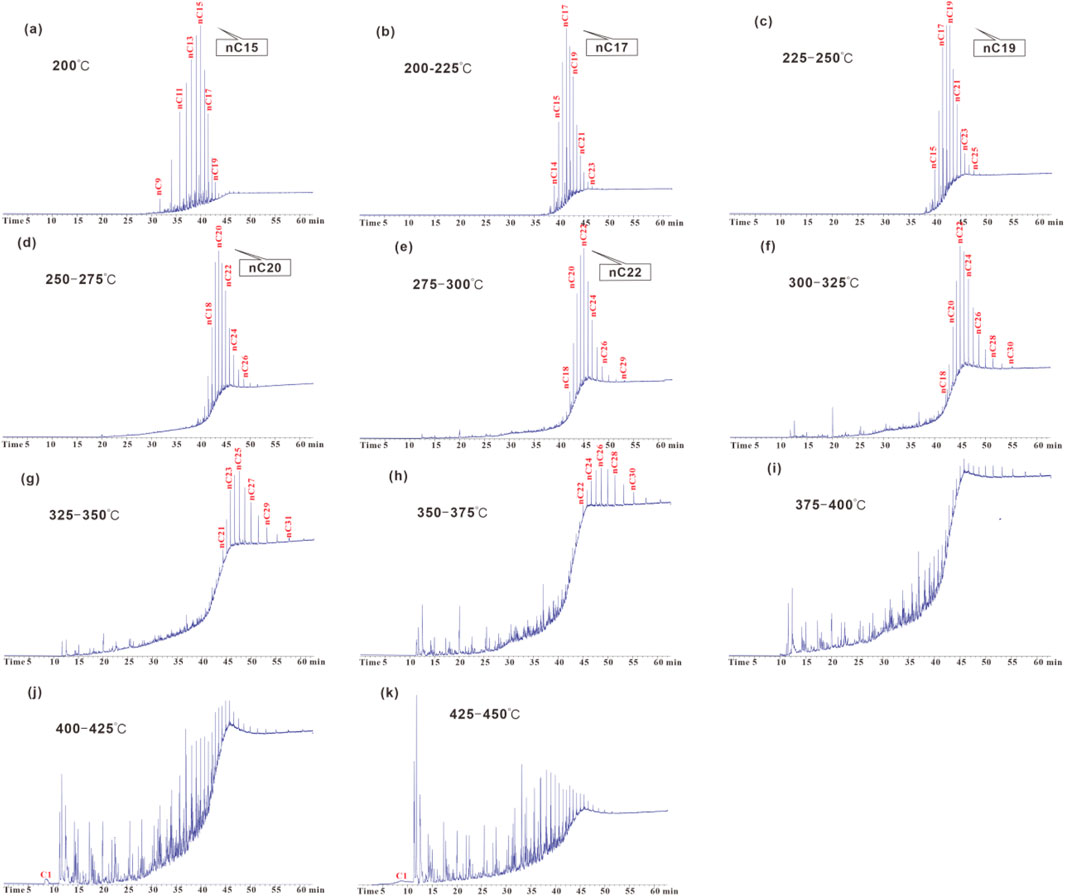
Figure 5. Pyrolysis gas chromatography characteristics with different temperatures of shale from the third member of the Shahejie Formation.
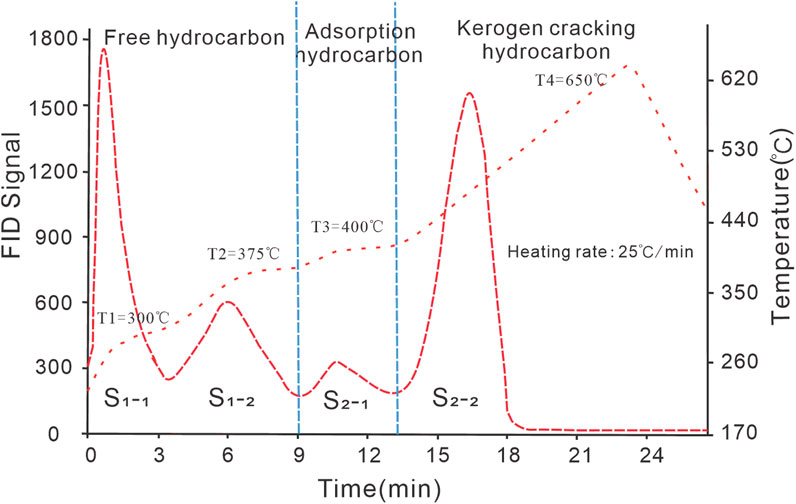
Figure 6. Newly established multi-temperature pyrolysis scheme.
In terms of absolute content, the free oil content of the Es3 shale in the Qikou Sag ranged as 1.1–8.06 mg/g, with an average value of 4.19 mg/g. The mobile oil content accounted for 54.72%. The adsorbed oil content ranged as 2.2–3.73 mg/g, with an average value of 2.05 mg/g. A comparison of the established hydrocarbon characterization methods with conventional pyrolysis methods revealed a strong correlation between the total free oil from pyrolyzed hydrocarbon and the pyrolysis free oil in the Es3 member of the Shahejie Formation of well QY 12-1-1. The correlation coefficient reached 0.92 (Figure 7).
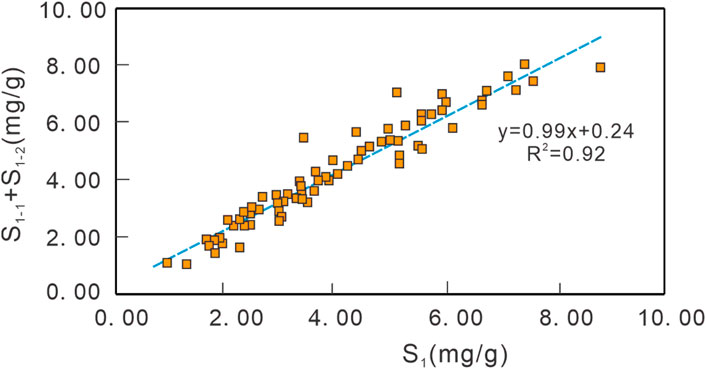
Figure 7. Relationship between S1 and (S1-1+S1-2) from the third member of Shahejie Formation Distribution of solvent extraction results.
This study selected mixed shale and calcareous shale samples with good oil content across different lithofacies to perform a comparative analysis of shale oil occurrence states and verify the reliability of the established multi-temperature pyrolysis scheme. According to the proportion of extracts per unit mass of the sample and the proportion of extracts across different steps, the pyrolysis results after the second step of extraction showed that almost no residual hydrocarbon remained below 300°C. Further, the hydrocarbon content detected at 300°C–375°C was only approximately 0.09 mg/g, and the extraction rate of free oil at this stage exceeded 97%. Further, the multi-temperature pyrolysis experiment of the samples after solvent extraction confirmed the rationality of the characterization of shale-free oil by pyrolysis of hydrocarbons before reaching 375°C (Table 2; Figure 8).
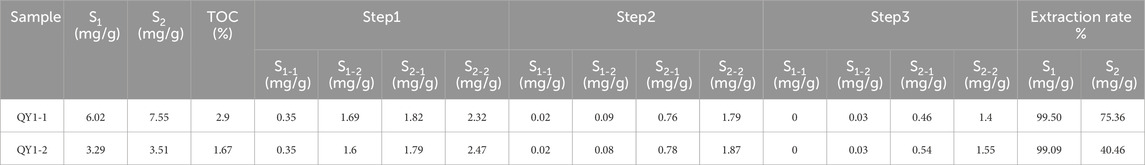
Table 2. Multi-temperature pyrolysis results from stepwise extraction.
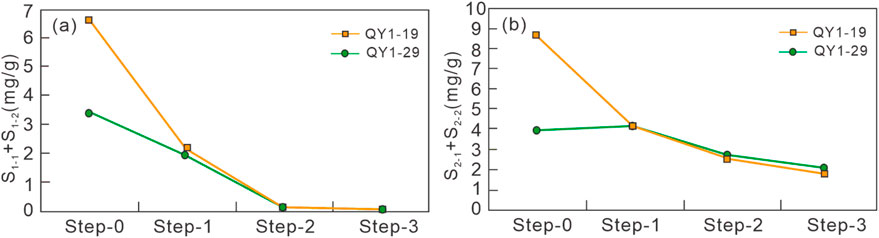
Figure 8. Quantitative variation of S1-1+S1-2 and S2-1+S2-2 values among each pyrolysis steps of the Stepwise Solvent Extraction.
Discussion
Oil bearing characteristics of different lithofacies
The multi-temperature pyrolysis data showed that the contents of mobile, heavy free, and adsorbed oil were high in the thin, medium, and thick-lamellar mixed shale, as well as in thin- and medium-lamellar calcareous shale. Among these, the thin-lamellar mixed shale exhibited higher contents of all three oil types than that in the medium- and thin-lamellar felsic shale. The content of the three types of thick-layered mixed shale was the lowest. In terms of relative content, the movable, heavy free, and adsorbed oil accounted for 55%, 33%, and 12% in the Es3 member of the Shahejie Formation. The proportion of free oil in each lithofacies exceeded 80%, of which the mobile, heavy free, and adsorbed oil accounted for 48%–72%, 25%–37%, and 3%–15%, respectively (Figure 9).
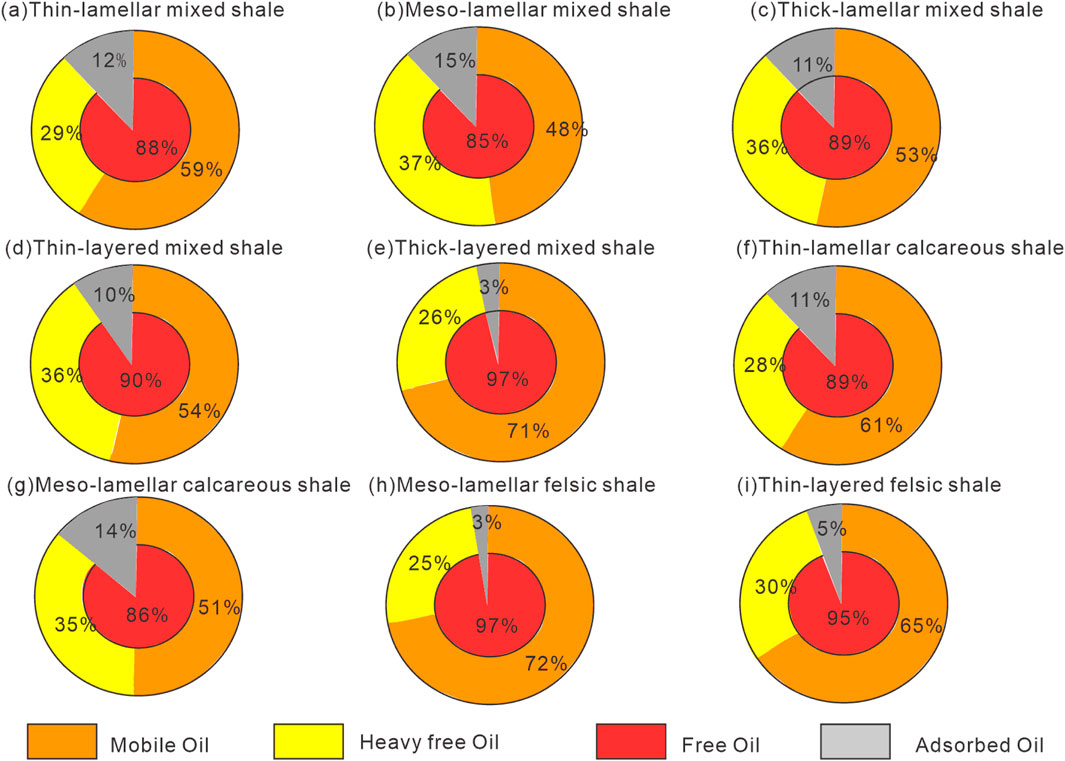
Figure 9. Occurrence states of shale oil in different facies of the third member of the Shahejie Formation.
Based on the pyrolysis total oil content and asphalt “A” data, the oil content follows this order: Thin-lamellar mixed shale ≈ meso-lamellar mixed shale ≈ thick-lamellar mixed shale > thin-lamellar calcareous shale > meso-lamellar calcareous shale > thin-lamellar mixed shale > thin-lamellar felsic shale > mexo-lamellar felsic shale > thick-lamellar mixed shale (Figure 10).
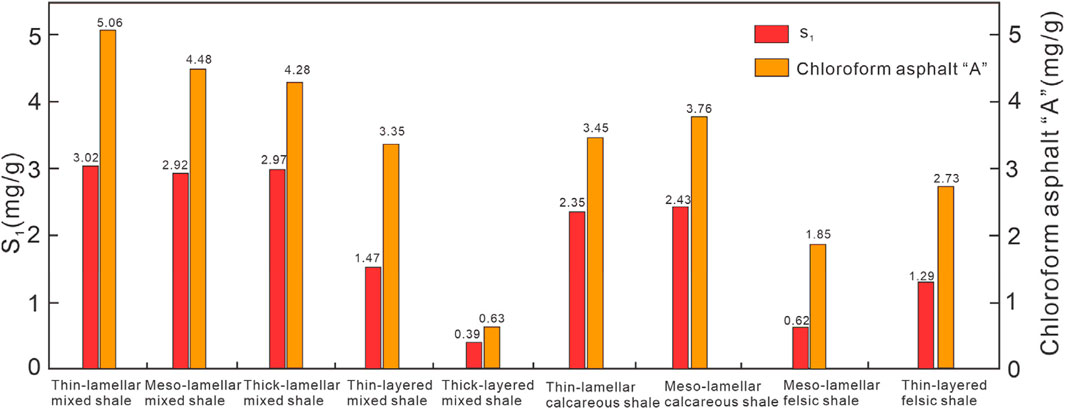
Figure 10. Pyrolysis oil content and chloroform asphalt “A” content of different rock types in the shale of the third member of the Shahejie Formation.
In order to explore the paleo-depositional environment during the formation of different lithofacies in the Shahejie Formation, this study collected 68 major trace element samples of the shale in the Shahejie Formation (The element analysis data is derived from Jiang (2025)). Among them, the elements Sr, Ni, and V have good indicators for changes in salinity (Berner and Raiswell, 1984). When the Sr content is greater than 500 μg/g, the Ni content is greater than 40 μg/g, and the V content is less than 86 μg/g, it indicates a brine (marine) sedimentary environment; when the Sr content is less than 200 μg/g, the Ni content is between 20 and 25 μg/g, and the V content is between 110 and 113 μg/g, it indicates a freshwater (continental) sedimentary environment (Nelson, 1967; Wen et al., 2008; Bai et al., 2020). The Sr content of the third member of the Shahejie Formation is 158.32–670.16 μg/g, with an average content of 408.58 μg/g; the Ni content is 23.4–77.4 μg/g, with an average content of 42.8 μg/g; the V content is 56.6–113 μg/g, with an average content of 82.53 μg/g. It is determined that the salinity of the Shahejie Formation shale in the third section first increases and then decreases from bottom to top. The overall salinity can be divided into two segments. The upper segment belongs to a semi-salty to salty depositional environment, and the lower segment is in a freshwater to semi-salty depositional environment. The paleoclimate is considered to be the main factor affecting the source and development of organic matter. It directly controls the organic matter source of the sedimentary lake basin, the preservation of organic matter after deposition, and the input of external clastic materials, thereby affecting the development of organic-rich mudstone, the abundance of organic matter, the type of organic matter, and the oil generation potential (Tribovillard et al., 2006; Wang et al., 2021; Liu et al., 2022). This study selected the Sr/Cu, Al2O3/MgO, Mg/Ca, and Si/Al ratios to comprehensively characterize the changes in paleoclimate of the Shahejie Formation. Combined with the longitudinal changes of Al2O3/MgO, Mg/Ca, Si/Al, and Sr/Cu climate indicators, the climate change of the third member of Shahejie Formation is further divided into different geochemical layers of different climates. The humidity from bottom to top decreases first and then increases. The organic matter content of the upper section of the Shahejie Formation is relatively dry and cold, with a relatively quiet water body, and a high paleosalinity level. The paleo-productivity is relatively high, the water body is in anoxic conditions, and the reduction degree is relatively high, which is conducive to the preservation of organic matter. The carbonate content of this section is relatively high, mainly developing laminated mixed shale, laminated calcareous shale, and layered calcareous shale, mainly with the high organic matter content. The lower section has a relatively warm and humid climate, and the water depth increases. At this time, the water body is relatively turbulent, with gravity flow events. The main development is thin-layered mixed shale, thick-layered mixed shale, and felsic shale. The salinity decreases, the nutrients are diluted, and the productivity level is relatively low. The lake is still in an anoxic state, and the organic matter content is relatively low (Figure 11).
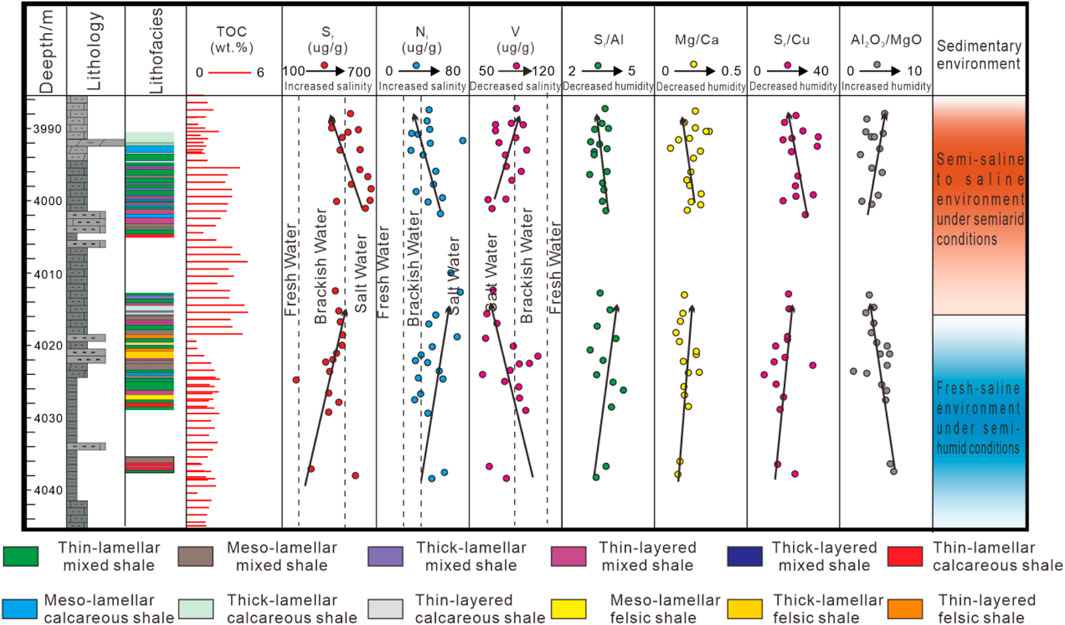
Figure 11. Comparison of shale paleoenvironmental parameters in different lithofacies of Well QY12-1-1 in the third member of the Shahejie Formation (The element analysis data is derived from Jiang (2025)) Quantitative evaluation of shale oil occurrence state.
Overall, the oil content of different rock facies is mainly controlled by the sedimentary environment. The lamellar mixture and calcareous shale develop when aquatic organisms (such as plankton and algae) flourish, the organic matter content is high, the types are poor, and during calm water conditions. The diameter of the pore throat is large, and the reservoir performance is superior, resulting in the highest oil content. The content, type and reservoir properties of the organic matter in the lamellar mixed shale are inferior to those in the lamellar shale, so the oil content is inferior. The deposition rate of the thick-bedded mixed shale is fast, and the organic matter is difficult to preserve. It also exhibits poor sorting, undeveloped pores, and the lowest oil content. When felsic shale is deposited, the terrigenous input is high, the water is turbulent, the organic matter content is low, and the type is poor. Most of the pores are cemented, and the reservoir performance is poor. However, owing to its originally favorable physical properties, certain large pores remain preserved. This allows shale oil to migrate from the lamellar and lamellar shale into them; thus, the oil content exceeds that of the thick-lamellar mixed shale.
The source rock of the Es3 member of well QY 12-1-1 is a pressure-maintained coring section with a core range of 3,991.80–4,037.75 m. The lithology is primarily dark gray and gray-black mudstone. Oil content was analyzed using closed frozen fragment pyrolysis of typical samples from the core section of well Qiye 12-1-1, as shown in Figure 9. Based on the TOC content, pyrolytic free hydrocarbon S1 and OSI, the four shale oil enrichment layers of A (3,992.5–4,001.8 m), B (4,004.7–4,006.1 m), C (4,012.2–4,020.5 m), and D (4,022.1–4,024.3 m) were determined (Figure 12).
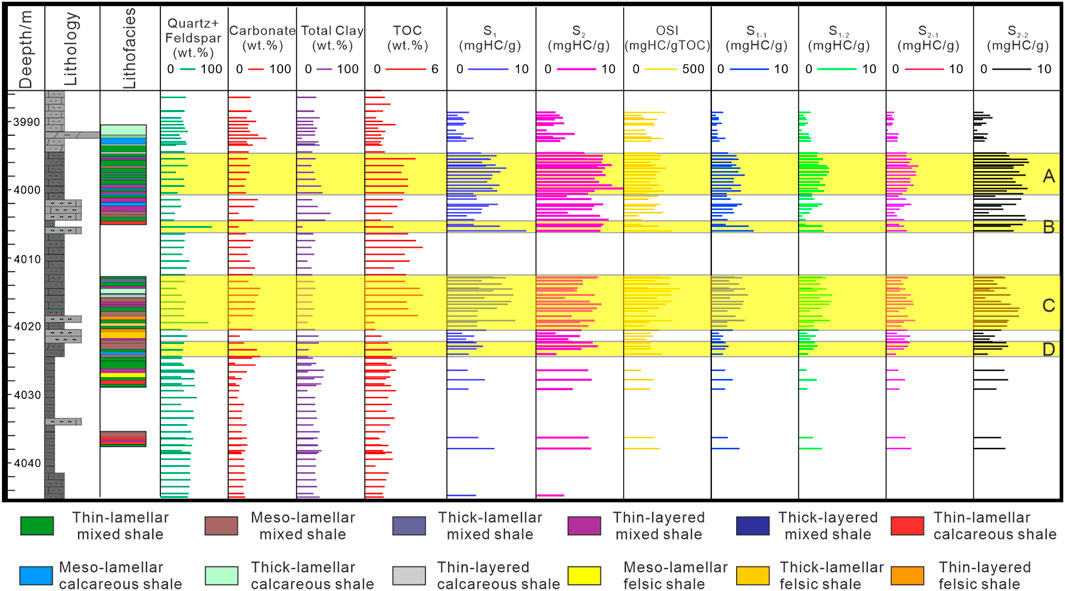
Figure 12. Prediction of sweet point development segments in Well QY12-1-1based on TOC content, S1, OSI and multiple isothermal stages pyrolysis.
At the depth of 3,992.5–4,001.8 m, the TOC ranged as 0.8%–3.1%, with an average of 2.1%. The pyrolytic free hydrocarbon S1 was relatively high, primarily ranging as 1.0–6.8 mg/g, with an average of 3.79 mg/g. The OSI ranged from 100 to 242 mgHC/gTOC, with an average of 177 mgHC/gTOC. The content of free oil S1-1 was between 0.5 and 3.8 mg/g, with an average of 2.1 mg/g. The content of free oil S1-2 was primarily 0.4 and 3.5 mg/g, with an average of 1.99 mg/g. The content of bound oil S2-1 ranged as 0.22–3.73 mg/g, with an average of 2.03 mg/g. The percentage of free oil/total oil was within 57%–83%, with an average of 68%.
The TOC content at a relatively high depth (4,004.7–4,006.1 m) was within 2.94%–3.24%, with an average of 3.06%. The pyrolytic free hydrocarbon S1 was relatively high, ranging as 3.01–8.93 mg/g, with an average of 5.96 mg/g. The OSI ranged from 100 to 275 mgHC/gTOC, with an average of 192 mgHC/gTOC. The content of free oil S1-1 ranged as 1.67–4.86 mg/g, with an average of 3.6 mg/g. The content of free oil S1-2 was within 0.84–2.88 mg/g, with an average of 2.14 mg/g. The content of bound oil S2-1 ranged as 1.5–2.3 mg/g, with an average of 1.98 mg/g. The percentage of free oil/total oil was within 62%–77%, with an average of 72%.
The TOC at the depth of 4,012.2–4,020.5 m was within 1.11%–2.81%, with an average of 2.36%. The pyrolytic free hydrocarbon S1 was relatively high, ranging as 2.44–7.69 mg/g, with an average of 5.14 mg/g. The OSI mainly ranged as 123–321 mgHC/gTOC, with an average of 217 mgHC/gTOC. The content of free oil S1-1 ranged as 1.81–4.22 mg/g, with an average of 2.86 mg/g. The content of free oil S1-2 ranged as 1.28–3.84 mg/g, with an average of 2.59 mg/g. The content of bound oil S2-1 ranged as 1.46–3.35 mg/g, with an average of 2.29 mg/g. The percentage of free oil/total oil was within 63%–75%, with an average of 69%.
At the depth range of 4,022.1–4,024.3 m, the TOC average was 2.38%. The average pyrolysis free hydrocarbon S1 was 3.35 mg/g. OSI averaged at 156 mgHC/gTOC. The average content of the free oil S1-1 was 1.8 mg/g. The average content of the free oil S1-2 was 1.9 mg/g. The content of bound oil S2-1 was 2.3 mg/g on average. The free oil/total oil percentage averaged 62%. Therefore, the total and free oil contents of these four shale oil-enriched formations were high, and the proportion of light free oil was relatively high, which is the “sweet spot” segment of exploration and development.
Conclusion
Based on the quantitative characterization of different occurrence states in medium-high maturity continental shale oil, the primary conclusions of this study are as follows.
1. A four-step pyrolysis scheme at 300°C, 375°C, 400°C, and 600 °C was established by improving the existing multi-temperature pyrolysis method. Using this new approach, shale oil core samples from the Qibei Sag were analyzed. Results showed that the free oil content of the Es3 shale of the Qikou Sag ranged as 1.1–8.06 mg/g, with an average value of 4.19 mg/g. Mobile oil accounted for 54.72%. The adsorbed oil content ranged as 2.2–3.73 mg/g, with an average value of 2.05 mg/g. The newly established characterization method of hydrocarbons with different occurrence states correlated well with the conventional pyrolysis methods and the distributed solvent extraction results, rendering it a practical tool for studying shale oil occurrence mechanism and for rapid evaluation of shale oil content.
2. Based on the multi-temperature pyrolysis and asphalt “A” data, higher contents of mobile, heavy free, and adsorbed oil were observed in thin-, medium-, and thick-lamellar mixed shales, as well as in thin- and medium-laminated calcareous shales. In contrast, medium-lamellar felsic shales and thick-layered mixed shales exhibited lower values, with the lowest content found in thin-laminated felsic shales.
3. The oiliness of different lithofacies is primarily controlled by the sedimentary environment. The laminar mixture and calcareous shale were formed in calm, organic-rich aquatic environment, leading to higher oil content. The content, type, and reservoir properties of the organic matter in the lamellar mixed shale were inferior to those in the lamellar shale; thus, the oil content was inferior. The deposition rate of the thick-bedded mixed shale was high, rendering it difficult to preserve organic matter. This is characterized by poor sorting, undeveloped pores, and the lowest oil content. During the deposition of felsic shale, terrigenous input was high, water conditions were turbulent, the organic matter content was low, and the type was poor. Most of the pores were cemented, and the reservoir performance was poor.
Data availability statement
The original contributions presented in the study are included in the article/supplementary material, further inquiries can be directed to the corresponding author.
Author contributions
WJ: Conceptualization, Writing – original draft, Writing – review and editing. YL: Data curation, Methodology, Writing – review and editing. LG: Formal Analysis, Software, Writing – review and editing. GL: Investigation, Resources, Supervision, Writing – review and editing. JF: Project administration, Validation, Visualization, Writing – review and editing.
Funding
The author(s) declare that financial support was received for the research and/or publication of this article. Our research was supported by the National Major Science and Technology Project “Reservoir Formation Mechanism and Distribution of Remaining Resources of the Bohai Bay Basin Oil and Gas System (2024ZD1400101)”, and the National Key Research and Development Program Project “Application Demonstration of Risk Assessment in Strategic Resource Development Zones (2022YFF0801204)”.
Conflict of interest
Authors WJ, LG, and JF were employed by PetroChina Dagang Oilfield Company.
The remaining authors declare that the research was conducted in the absence of any commercial or financial relationships that could be construed as a potential conflict of interest.
Generative AI statement
The author(s) declare that no Generative AI was used in the creation of this manuscript.
Publisher’s note
All claims expressed in this article are solely those of the authors and do not necessarily represent those of their affiliated organizations, or those of the publisher, the editors and the reviewers. Any product that may be evaluated in this article, or claim that may be made by its manufacturer, is not guaranteed or endorsed by the publisher.
References
Abrams, M. A., Gong, C. R., Gamier, C., and Sephton, M. A. (2017). A new thermal extraction protocol to evaluate liquid rich unconventional oil in place and in-situ fluid chemistry. Mar. Petroleum Geol. 88, 659–675. doi:10.1016/j.marpetgeo.2017.09.014
Bai, J., Xu, X., Chen, S., Liu, W., Liu, C., and Zhang, C. (2020). Sedimentary characteristics and paleo-environment restoration of the first member of qingshankou formation in Qian'an area, changling sag, songliao basin: a case study of jiyeyou 1 well. Geol. China 47 (1), 220–235. doi:10.12029/gc20200118
Behar, F., Beaumont, V., and Penteado, H. L. D. B. (2001). Rock-eval 6 technology: performances and developments. Oil. Gas Sci. Tech. Revue D Ifp Energies Nouvelles 56, 111–134. doi:10.2516/OGST:2001013
Berner, R. A., and Raiswell, R. (1984). C/S method for distinguishing freshwater from marine sedimentary rocks. Geology 12 (6), 365. doi:10.1130/0091-7613(1984)12<365:cmfdff>2.0.co;2
Breyer, J. A. (2012). Shale reservoirs-giant resources for the 21st century. Tulsa: American Association of Petroleum Geologists.
Camp, W., Diaz, E., and Wawak, B. (2013). Electron microscopy of shale hydrocarbon reservoirs. Tulsa, Oklahoma: American Association of Petroleum Geologists.
Chen, X., and Zhang, M. (2017). Composition characteristics of the saturated hydrocarbon of the sequential extracts from the oil-bearing shales with different polarity reagents. Petroleum Geol. Dev. Daqing 36 (3), 168–174. doi:10.3969/J.ISSN.1000-3754.2017.03.030
EIA U.S. (2022). U. S. Energy information administration. Annual energy outlook 2022. Washington, DC: U.S. Department of Energy. Available online at: https://www.eia.gov/outlooks/aeo/electricity_generation.Php.
Fu, J., Niu, X., Li, M., Liu, X., Li, S., Guo, Q., et al. (2022). Breakthrough and significance of risk exploration in the 3rd sub-member, 7th member of yanchang formation in ordos basin. Acta Pet. Sin. 43, 760–769. doi:10.7623/syxb202206002
Gao, J., Li, X., Cheng, G., Luo, H., and Zhu, H. (2023). Structural evolution and characterization of organic-rich shale from macroscopic to microscopic resolution: the significance of tectonic activity. Adv. Geo-Energy Res. 10 (2), 84–90. doi:10.46690/ager.2023.11.03
Gasparik, M., Ghanizadeh, A., Bertier, P., Gensterblum, Y., Bouw, S., and Krooss, B. M. (2012). High-pressure methane sorption isotherms of Black shales from the Netherlands. Energy & Fuels 26 (8), 4995–5004. doi:10.1021/ef300405g
Guo, X., Ma, X., Li, M., Qian, M., and Hu, Z. (2023). Mechanisms for lacustrine shale oil enrichment in Chinese sedimentary basins. Oil & Gas Geol. 44, 1333–1349. doi:10.11743/ogg20230601
He, W., Liu, B., Zhang, J., Bai, L., Tian, S., and Chi, Y. (2023). Geological characteristics and key scientific and technological problems of gulong shale oil in songliao basin. Earth Sci. 48, 49–62. doi:10.3799/dqkx.2022.320
Jiang, C. Q., Chen, Z. H., Mort, A., Milovic, M., Robinson, R., Stewart, R., et al. (2016a). Hydrocarbon evaporative loss from shale core samples as revealed by rock-eval and thermal desorption-gas chromatography analysis: its geochemical and geological implications. Mar. Pet. Geol. 70, 294–303. doi:10.1016/j.marpetgeo.2015.11.021
Jiang, Q., Li, M., Qian, M., Li, Z., Li, Z., Huang, Z., et al. (2016b). Quantitative characterization of shale oil in different occurrence states and its application. Petroleum. Geol. Exp. 38 (6), 842–849. doi:10.11781/sysydz201606842
Jiao, F., Zou, C., and Yang, Z. (2020). Geological theory and exploration & development practice of hydrocarbon accumulation inside Continental source kitchens. Petroleum Explor. Dev. 47 (6), 1067–1078. doi:10.11698/PED.2020.06.01
Lafargue, E., Espitalie, J., Jacobsen, T., and Eggen, S. (1990). Experimental simulation of hydrocarbon expulsion. Org. Geochem. 16, 121–131. doi:10.1016/0146-6380(90)90032-u
Li, Z., Liu, P., Qian, M., Li, M., Cao, T., Tao, G., et al. (2018). Quantitative comparison of different occurrence oil for lacustrine shale: a case from cored interval of shale oil special drilling Wells in dongying depression, Bohai Bay basin. J. China Univ Mining Tech. 47, 1252–1263.
Li, Z., Qian, M., Li, M., Jiang, Q., Liu, P., Rui, X., et al. (2017). Oil content and occurrence in low-medium mature organic-rich lacustrine shales:a case from the 1st member of the Eocene-Oligocene shahejie formation in well Luo-63 andYi-21, bonan subsag, Bohai Bay basin. Oil. Gas Geol. 38 (3), 448–466. doi:10.11743/ogg20170304
Liu, B., Bai, L., Chi, Y., Jia, R., Fu, X., and Yang, L. (2019). Geochemical characterization and quantitative evaluation of shale oil reservoir by two-dimensional nuclear magnetic resonance and quantitative grain fluorescence on extract: a case study from the qingshankou formation in southern songliao basin, northeast China. Mar. Petroleum Geol. 46 (06), 561–573. doi:10.1016/j.marpetgeo.2019.06.046
Liu, Z., Wang, P., Nie, H., Li, P., and Li, Q. (2022). Enrichment conditions and favorable prospecting targets of Cambrian shale gas in middle-upper yangtze. Science. Techn.J. Central. South. Univ. 53, 3694–3707.
Nelson, B. (1967). Sedimentary phosphate method for estimating paleosalinities. Science 158 (3803), 917–920. doi:10.1126/science.158.3803.917
Pan, C. C., and Liu, D. Y. (2009). Molecular correlation of free oil, adsorbed oil and inclusion oil of reservoir rocks in the tazhong uplift of the tarim basin, China. Org. Geochem. 40, 387–399. doi:10.1016/j.orggeochem.2008.11.005
Pu, X., Ma, C., Guo, B., Zhou, K., Bian, C., Ma, J., et al. (2023). Shale lithofacies characteristics and shale oil bearing differences in the Es3 of qibei subsag qikou sag, Bohai Bay basin. J. Northeast. Petroleum. University 47, 55–69.
Qian, M., Jiang, Q., Li, M., Li, Z., Liu, P., Ma, Y., et al. (2017). Quantitative characterization of extractable organic matter in lacustrine shale with different occurrences. Petroleum Geol. Exp. 39 (2), 278–286. doi:10.11781/sysydz201702278
Romero-Sarmiento, M. F., Pillot, D., Letort, G., Lamoureux-Var, V., Garcia, B., Huc, A. Y., et al. (2016). New rock-eval method for characterization of unconventional shale resource systems. Oil. Gas. Sci. Technol. 71, 37. doi:10.2516/ogst/2015007
Song, G. Q., Zhang, L. Y., Lu, S. F., Xu, X. Y., Zhu, R. F., and Wang, M. (2013). Resource evaluation method for shale oil and its application. Earth Sci. Front. 20, 221–228.
Tinnin, B., Bello, H., and McChesney, M. (2014). Multi-source data integration to predict well performance: Eagle ford sweet spot mapping. San Antonio: AAPG/STGS Eagle Ford Plus Adjacent Plays & Extensions Workshop.
Tribovillard, N., Algeo, T., Lyons, T., and Riboulleau, A. (2006). Trace metals as paleoredox and paleoproductivity proxies: an update. Chem. Geol. 232 (1/2), 12–32. doi:10.1016/j.chemgeo.2006.02.012
Wang, Y., Shen, J., Qiu, Z., Li, X., Zhang, L., Zhang, Q., et al. (2021). Characteristics and environmental significance of concretion in the Lower Cambrian qiongzhusi formation in the middle-upper yangtze area. Nat. Gas. Geosci. 32 (9), 1308–1323. doi:10.1016/j.jnggs.2021.12.004
Wen, H., Zhang, R., Tang, F., Zhang, A., Sang, T., Chen, S., et al. (2008). Reconstruction and analysis of paleosalinity and paleoenvironment of the chang 6 member in the gengwan region, ordos basin. Acta Petrol. Sin. 28 (1), 114–120. doi:10.1002/clen.200700058
Xu, J., Wu, Q., Cheng, X., Li, K., Zhao, Y., Wei, J., et al. (2025). Micro-charging and accumulation of shale oil in lamellar shale interbedded with siltstones, dongying depression, Bohai Bay basin. Mar. Petroleum Geol. 174 (2025), 107298. doi:10.1016/j.marpetgeo.2025.107298
Yu, S., Wang, X. L., Xiang, B. L., Ren, J., Ertin, L., Wang, J., et al. (2017). Molecular and carbon isotopic geochemistry of crude oils and extracts from Permian source rocks in the northwestern and central junggar basin, China. Org. Geochem. 113, 27–42. doi:10.1016/j.orggeochem.2017.07.013
Zhang, H., Huang, H., Li, Z., and Liu, M. (2019). Oil physical status in lacustrine shale reservoirs—A case study on Eocene shahejie formation shales, dongying depression, east China. Fuel 257 (12), 116027. doi:10.1016/j.fuel.2019.116027
Zhang, H., Huang, H., Li, Z., and Liu, M. (2020). Comparative study between sequential solvent-extraction and multiple isothermal stages pyrolysis: a case study on Eocene shahejie formation shales, dongying depression, east China. Fuel 263, 116591. doi:10.1016/j.fuel.2019.116591
Zhang, J., Lin, L., Li, Y., Zhu, L., Xing, Y., and Jiang, S. (2012). Classification and evaluation of shale oil. Earth Sci. Front. 19, 322–331.
Zhao, W., Zhu, R., Liu, W., Bai, B., Wu, S., Bian, C., et al. (2023). Advances in theory and technology of non-marine shale oil exploration in China. Petroleum Sci. Bull. 04, 373–390. doi:10.3969/j.issn.2096-1693.2023.04.029
Zhao, X., Pu, X., Zhou, L., Shi, Z., Han, W., and Zhang, W. (2017). Geologic characteristics of deep water deposits and exploration discoveries in slope zones of fault Lake basin: a case study of Paleogene shahejie formation in banqiao-qibei slope, qikou sag, Bohai Bay basin. Petroleum Explor. Dev. 44 (2), 171–182. doi:10.1016/s1876-3804(17)30022-8
Zhao, X., Zhou, L., Xiao, D., Pu, X., and Jiang, W. (2016). Hydrocarbon accumulation and exploration practice of slope area in qikou sag. Acta petrolei. Sinica. 37, 1–9. doi:10.7623/syxb2016S2001
Zhou, L., Chen, C., Yang, F., Li, H., Liu, G., Cui, Y., et al. (2024). Accumulation models and exploration practice of tight oil and gas in the deep sag areas of Continental fault basins: a case study of huanghua depression in Bohai Bay basin. Acta. Pet. Sin. 45 (5), 755–770. doi:10.7623/syxb202405001
Zhou, L., Han, G., Ma, J., Chen, C., Yang, F., Zhang, L., et al. (2020). Palaeoenvironment characteristics and sedimentary model of the lower submember of member 1 of shahejie formation in the Southwestern margin of qikou sag. Acta Pet. Sin. 41 (8), 903–917. doi:10.7623/syxb202008001
Zhou, L., Han, G., Yang, F., Ma, J., Mou, L., Zhou, K., et al. .(2021). Geological characteristics and shale oil exploration of Es3(1) in qikou sag, Bohai Bay basin. Oil. Gas. Geolo. 42(2), 443–455.
Zou, C., Yang, Z., Cui, J., Zhu, R., Hou, L., and Tao, S. (2013). Formation mechanism, geological characteristics and development strategy of nonmarine shale oil in China. Petroleum Explor. Dev. 40 (1), 14–26. doi:10.1016/S1876-3804(13)60002-6
Keywords: multiple isothermal stages pyrolysis, shale oil, occurrence states, Shahejie formation, Qikou sag
Citation: Jiang W, Liu Y, Gao L, Liu G and Feng J (2025) Quantitative characterization of different occurrence states in medium maturity continental shale oil: a case study on eocene Shahejie formation shales, Qikou Sag, East China. Front. Earth Sci. 13:1641438. doi: 10.3389/feart.2025.1641438
Received: 05 June 2025; Accepted: 24 July 2025;
Published: 12 August 2025.
Edited by:
Muhsan Ehsan, Bahria University, PakistanCopyright © 2025 Jiang, Liu, Gao, Liu and Feng. This is an open-access article distributed under the terms of the Creative Commons Attribution License (CC BY). The use, distribution or reproduction in other forums is permitted, provided the original author(s) and the copyright owner(s) are credited and that the original publication in this journal is cited, in accordance with accepted academic practice. No use, distribution or reproduction is permitted which does not comply with these terms.
*Correspondence: Guangdi Liu, bGdkQGN1cC5lZHUuY24=