Abstract
To support the European Green Deal and accelerate climate mitigation, the CCUS ZEN project conducted a high-level technical screening of Carbon Capture, Utilization, and Storage (CCUS) value chains in the Baltic and Mediterranean regions. These regions were chosen, since they have lower maturity levels for CCUS compared with the current development in the North Sea region. The study mapped industrial carbon dioxide (CO2) emission sources, potential storage sites, transport infrastructure, and utilization options. Emission clusters and hubs were identified based on volume, location, and industry type, while for each mapped storage site, information was gathered about the type of reservoir (deep saline aquifer or depleted hydrocarbon field), the onshore or offshore location, the capacity of the reservoir and the Storage Readiness Level, indicating the maturity of the capacity evaluation. Transport options included pipelines, shipping, and multimodal solutions were presented. This study defined unique high-level technical CCUS value chain screening workflow for mapping of emitters, infrastructures to storage screening. An open geographical information system was used for mapping the emitters and storage sites from previous reports, and to illustrate emission clusters and possible transport routes, both existing and future infrastructures. The screening revealed significant CO2 emission sources and storage capacities across the regions, with notable clusters in Poland, Germany, Italy, and Turkey. The Baltic region showed three times the storage capacity of the Mediterranean region. Eight promising CCUS value chains were defined, integrating source-sink matching and infrastructure feasibility. A detailed case study of Southern Italy and Greece was presented, to demonstrate the potential for regional CCUS deployment, highlighting challenges such as data availability, storage capacity uncertainty, transport possibilities and stakeholder coordination. This study will provide a foundation for further development and stakeholder engagement in CCUS planning across Europe.
1 Introduction
There is a strong ambition to accelerate the deployment of Carbon, Capture, Utilization, and Storage (CCUS) throughout Europe, as a part of the European Green Deal (European Commission, 2019), the European Climate Law and to increase climate energy and climate targets for 2030 (Tumara et al., 2024). As part of this, the EU funded network project CCUS ZEN has connected CCUS actors in Europe, to identify promising value chains and to share knowledge and experience. We carried out a high-level technical mapping focused on emission sources, storage sites, transport infrastructure, utilization options and renewables, alongside non-technical mapping including stakeholder needs, regulations, climate policies and funding opportunities (Figure 1). These aspects should be considered when CCUS value chain are to be developed further after the initial technical high-level screening. One of the objectives was to explore the potential for CCUS value chain deployment in two regions with lower maturity level for CCUS compared to the current development in the North Sea region. A high-level screening of promising value chains has been carried out for two selected regions: the Baltic Sea region and the Mediterranean Sea region (Ringstad et al., 2023). The overall screening workflow was tested in the two geographical regions, with different geological storage sites (aquifers and depleted oil and gas fields) and led to the definition of 8 CCUS value chains, several with different transport solutions included, using ships or pipelines or a combination (Gravaud et al., 2024).
FIGURE 1

Overview of work tasks in the CCUS ZEN project, with the regional high-level technical mapping marked in the green box.
2 Methodology and input data for high-level CCUS technical value chain screening
Several studies have been carried out focusing on high-level CCUS value chain screening with scenario developments (Jakobsen and Brunsvold, 2011), infrastructures (Kjärstad and Johnsson, 2009; European Commission, 2024) and storage sites (Anthonsen et al., 2014a; Anthonsen et al., 2014b). The high-level CCUS technical value chain can be subdivided into four main parts covering mapping of CO2 emitters, infrastructure screening, storage sites screening and utilization as a final part in the puzzle (Lothe et al., 2025) (see Figure 2). For each part of the value chain, several key input parameters are listed without ranking the importance, costs, or effort to get enough data to draw solid conclusions.
FIGURE 2

Principal sketch presenting the main components to consider in the high-level technical CCUS value chain screening.
As part of the high-level CCUS technical screening, an open geographical information system (QGIS) has been used for mapping the emitters and storage sites from previous reports, and to illustrate emission clusters and possible transport routes, both existing and future infrastructures. The aim is to carry out a first qualitative high-level screening, a more quantitative assessment of potential CCUS value chains are presented by Shogenova et al. (2025).
2.1 Mapping of emitters
Inspection of the emission sources in each geographical region leads to the identification of promising sites for CO2 capture. The focus is on identifying clusters of emitters, where CO2 could be captured from different industrial sites and gathered at a hub before the transport to storage. Standalone emitters could also be identified as promising for CCUS value chains, depending on their amount of emission, location, and type of industry. For each emission source, information about the facility is collected (facility name, company, location, coordinates, and industrial sector), along with information about the facility’s emissions (annual amount of CO2 emitted, emissions trend, share of biomass, and waste-to-energy) (see Table 1).
TABLE 1
| Attribute name | Unit | Type | Input type | Description |
|---|---|---|---|---|
| Emitter ID | Text | Automatic fill | Unique identifier for emitting facility | |
| Facility name | Text | Manual | Name of facility, which is used to discern different facilities from the same company | |
| Facility ID | Numeric | Manual | The facility identifier assigned by ENDRAVA | |
| Company name | Text | Manual | Company responsible for emission | |
| Region | Text | List | Name of the region: Baltic Sea or Mediterranean Sea | |
| Country | Text | List | Name of country where the facility is located | |
| Country Code | Text | Automatic fill | International Organization for Standardization (ISO) country code | |
| Latitude | Decimal degrees | Numeric | Manual | Latitude geographic coordinates (WGS84) |
| Longitude | Decimal degrees | Numeric | Manual | Longitude geographic coordinates (WGS84) |
| State | Text | Manual | Name of state where the facility is located (city or town closest to the emitter) | |
| Industry sector | Text | Select from list | Adapt from second level of NACE (the Statistical classification of economic activities in the European Community) hierarchy | |
| Status | Text | Select from list | Status of emission source | |
| CO2 reported | t/y | Numeric | Manual | The total CO2 emissions reported in E-PRTR report (both fossil and biogenic origin) CO2 emissions |
| Biomass | t/y | Numeric | Manual | Latest biogenic CO2 emissions (reported by E-PRTR or estimated by ENDRAVA) |
| Year reported | Numeric | Manual | Year to which the report relates. It should be the most recent data available | |
| Reported basis | Text | Manual | Reference to data source and/or method of averaging if appropriate | |
| CO2 estimated | t/y | Numeric | Manual | The latest estimated CO2 emission by Endrava if the reported (E-PRTR) data is not available |
| Year estimated | Numeric | Manual | Year to which the estimate relates | |
| Estimate basis | Text | Manual | Estimation method or reference (Endrava) | |
| Latest ETS verified emissions | t/y | Numeric | Manual | Fossil-based CO2 emissions reported in 2021 in EU ETS |
| Emission trend | Text | Select from list | Trend in emission year on year (Growing, Falling, or Stable?) If the latest total CO2 emissions > the average of last 5 years’ CO2 emissions “Growing” If the latest total CO2 emissions < the average of last 5 years’ CO2 emissions “Falling” If the latest total CO2 emissions = the average of last 5 years’ CO2 emissions “Stable” |
|
| Shut year | Numeric | Manual | The year the emission source closed or is projected to close | |
| Information source | Text | Manual | Primary source(s) of information | |
| Remarks | Text | Manual | Any other relevant information | |
| CO2 emissions ALL | t/y | Numeric | Automatic fill | Concatenation of CO2 estimated, and CO2 reported |
Overview of emission attribute name with descriptions.
The CO2 emission database in CaptureMap, provided by Endrava is sourced from the EU Emissions Trading System (EU-ETS) and the European Pollutant Release and Transfer Register (E-PRTR). The EU-ETS data mainly includes fossil-based CO2 emissions, whereas the E-PRTR includes both fossil-based and biogenic CO2 emissions. The E-PRTR dataset only includes the facilities with CO2 emissions above 100 kt/y, while the EU-ETS dataset also includes the facilities with smaller emission volumes (<100 kt/y). Since CaptureMap uses the E-PRTR system as their basis for facilities in European countries, many facilities with CO2 emissions less than 100 kt/y are not included in the database.
Data from CaptureMap were used for mapping CO2 emissions sources in the Baltic Sea region (Denmark, Sweden, Finland, Germany, Estonia, Latvia, Lithuania and Poland) and the Mediterranean Sea region (France, Spain, Italy and Greece). The emission data were quality-checked, and amended where necessary, by the CCUS ZEN partners in Denmark, Sweden, Finland, Estonia, Latvia, Lithuania, Poland and France.
Since Turkey is not covered in the CaptureMap database, this emission mapping was carried out using methodology described in IPCC (2006), see also Ringstad et al. (2023). Due to the unavailability of annual, sector-based CO2 emission data, the mapping of CO2 emission sources in Turkey has been restricted to emissions from the leading sectors in terms of CO2 emissions, namely, the refineries and petrochemical industry, power plants, iron and steel industry, and cement industry. The reported CO2 emissions are in general from 2021, except for some facilities where only older data were available. Clusters are defined, with the total amount of emissions, the number of facilities in the cluster, and the share of each industrial sector in the total emissions.
2.2 Mapping of infrastructures
For the infrastructure screening, we looked at existing infrastructure relevant for CO2-transport with emphasis on pipelines (onshore and offshore), existing natural gas corridors, waterways and ports. Existing pipelines could either be reused if they have the specifications needed (e.g., temperature and pressure limitations and material) or the pipeline corridor can be used as a route for a new CO2 pipeline. If transport using pipelines or waterways is not an option, also railways and road (lorries) are evaluated.
There are multiple ways to transport CO2 which include pipelines, ships, trucks/lorries or railways. All methods are often combined with pre- and/or post-processes such as compression and drying of the CO2 stream, removal of impurities, liquefaction and intermediate storage solutions. Larger CO2 quantities, such as usually expected for a CO2 cluster require either a pipeline or ships, or a combination of both. This sub-section presents a high-level comparison between the two transportation methods.
The best transportation is often a combination of multiple methods that balance costs with convenience, practicality and in compliance with safety, legal and environmental requirements. Pipelines are commonly the most economical way to transport large quantities of CO2 over short to medium distances. On the other hand, pipelines are not a temporary flexible infrastructure and must primarily be considered for long-term operations. They require a high initial investment, but reduced OPEX. Re-utilisation of existing infrastructure may, therefore, be a key for such projects. OPEX may also be reduced by combining processes like drying or compression with the emitter’s industrial processes which produce heat or cold. Construction of a CO2 pipeline should consider the environmental impacts and routes may need to be adopted to minimize impact on protected areas. The risk to residential or densely populated areas may also need to be considered when planning CO2 pipelines. Pipelines can transport CO2 at gaseous, liquid or supercritical phases. Currently, there are approximately 8,000 km of onshore CO2 pipeline in the US. In Norway, one offshore CO2 100-kilometres long pipeline has been built as part of the Northern Light project, from Øygarden to Aurora Field, and one 160-kilometre pipeline from Melkøya to the Snøhvit Field.
Shipping is a more flexible operation and is viable for longer distances but also for small volumes. While the capital expenditure (CapEx) costs are lower and the ships can be repurposed after the project closure, the operational expenditure (OpEx) costs are a main decision driver. Residential areas are not an obstacle in ship traffic and compliance to environmental restrictions is easier. On the other hand, ship-based transport is dependent on the existence of suitable harbours and is limited to the sea and waterways. Shipping logistics commonly require a large intermediate storage, and CO2 can only be transported in liquid phase. Commonly today, 1,500–3,000 tonnes vessels are used in the food industry, and the transport conditions are 15 bar and −28°C. It is foreseen that the ship size for CCS project will be larger, but it depends on the logistic chain.
For transportation the mapping tool developed in the CO2LOS project was used to identify opportunities in ship transport or barges, while Project of Common Interest (PCI) Transparency Platform, combined with OpenStreetMap, was used for pipelines. Additionally, the European Network of Transmission Systems Operators for Gas (ENTSOG) provides a yearly updated map with an overview of existing gas pipeline infrastructure and projections for future development.
2.3 Mapping of storage sites
There are two main categories for underground carbon dioxide storage: saline aquifers and depleted oil and gas production reservoirs. Other geological storage options, like mineral carbonisation in basaltic rocks, were not considered, since such sites have not been mapped in detail.
The amount of CO2 to be stored underground depends significantly on the media for the storage and the injectivity. The subsurface storage aquifers can be defined as a regional aquifer, a storage assessment unit, which has an upper limit defined by where the CO2 will be in supercritical phase (approximately below 800 m depth, depending on pressures and temperature variations). The lower limit is defined by the porosity and permeability of the reservoir units and will be defined on what is considered an acceptable injection rate. This work utilizes the classification of storage structures based on the methodology outlined in Gammer et al. (2011). Several methods ex to calculate storage capacity. The storage capacity may in general terms be described as the pore volume of the aquifer in the storage assessment unit region multiplied with the storage efficiency factor (fraction of pore space where CO2 “can” be injected). In the CCUS ZEN project, the capacity formulas Vangkilde-Pedersen et al. (2009) have been used:where: MCO2 = calculated estimate storage capacity (in kg), A = considered area (regional or trap aquifer) (in m2), h = average thickness of the regional or trap aquifer suitable for CO2 storage (in m), NG = average net to gross ratio of regional and trap aquifer (in %). This factor represents all the formation irregularities within the bulk volume, Φ = average reservoir porosity of the effectively porous rocks in the regional or trap aquifer (in %), ρCO2 = CO2 density at reservoir conditions (in kg/m3) and Seff is storage efficiency factor (in %).
The screening of potential storage sites in the two geographical regions is carried out based on publicly available data from projects such as GESTCO, GeoCapacity (e.g., Vangkilde-Pedersen et al., 2009), CO2STOP (e.g., Poulsen et al., 2014), NORDICCS (e.g., Anthonsen et al., 2014a; Lothe et al., 2016), Strategy CCUS (e.g., Veloso, 2021), PilotSTRATEGY, and national projects. For each mapped storage site, information is gathered about the type of reservoir (deep saline aquifer or depleted hydrocarbon field), the onshore or offshore location, the capacity of the reservoir (mean value), and the Storage Readiness Level (SRL) indicating the maturity of the capacity evaluation based on Akhurst et al. (2021). Detailed description of the use of attribute names and data listed is defined in Tables 2, 3.
TABLE 2
| Name | Description |
|---|---|
| Option List | Options to choose parameters to be filled in from a list |
| Storage Unit | Geographic information about the storage unit |
| Reservoir* | Detailed technical information about reservoir unit. Facultative |
| Seal* | Information about the seal. Facultative |
| Capacity | Information required for selecting storage efficiency and data on methods and values of existing storage capacity estimates from previous studies and projects |
| Maturity | Types of information available and temporal development information |
Description of main information areas with color code. The defined color code is used in Table 3.
TABLE 3
| Attribute name | Unit | Type | Input type | Description |
|---|---|---|---|---|
| Storage_id | Alphanumeric | Automatic fill | Unique identifier for this storage unit. Country code and number | |
| Region | Text | Select from list | Name of the region: Baltic Sea or Mediterranean Sea | |
| Country | Text | Select from list | Name of country | |
| Country_code | Text | Automatic fill | ISO country code (two first letters in capital) | |
| Storage_type | Text | Select from list | Deep Saline aquifer, Hydrocarbon Field, Sloping saline aquifer, Salt caverns | |
| Formation | Text | Manual | Name of storage formation | |
| Storage_unit | Text | Manual | Name of storage unit | |
| Daughter_unit | Text | Manual | Name of daughter unit, usually a well-defined structure with closure | |
| Prospect_unit | Text | Manual | Name of prospect unit | |
| Field_hc_content | Text | Select from list | Hydrocarbon type: oil, gas, condensate. Only for hydrocarbon fields | |
| Field_status | Text | Select from list | Status of DHF: Producing, Suspended, Abandoned. Only for hydrocarbon fields | |
| Field_closure | Date | Manual | Expected date of closure for a producing HC field | |
| Date_entered | Date | Manual | Date of data entry | |
| On_off_shore | Text | Select from list | Onshore or offshore | |
| Data_source | Text | Manual | Reference from the data source | |
| Remarks | Text | Manual | Any other relevant information | |
| Area_expected | km^2 | Numeric | Manual | Representative area, expected |
| Area_net_to_gross | % | Numeric | Manual | Expected net to gross for storage area |
| Depth_top | m | Numeric | Manual | Average depth to top of unit or at representative borehole. Maybe needed for cost estimates: approximate depth of injection wells |
| Thickness | m | Numeric | Manual | Representative thickness, expected gross thickness |
| Porosity_type | Text | List | Indicate if primary or secondary porosity type | |
| Porosity_expected | % | Numeric | Manual | Representative porosity, expected |
| Permeability | mD | Numeric | Manual | Representative permeability, expected |
| Compressibility | 1/MPa | Numeric | Manual | Representative bulk compressibility |
| Temperature | °C | Numeric | Manual | Representative temperature |
| Pressure | MPa | Numeric | Manual | Representative pressure |
| CO2_density | kg/m^3 | Numeric | Manual | Representative CO2 density, expected |
| Data_source | Text | Manual | References to literature from where data are extracted | |
| Remarks | Text | Manual | Any other relevant information | |
| Seal | Text | Manual | Name of the primary seal, the main seal providing containment to the storage site | |
| Seal_lithology | Text | Manual | Representative lithology | |
| Seal_thickness | m | numeric | Manual | Number of secondary seals, low permeability units above the primary seal that provide secondary containment if the primary seal fails |
| Nb_secondary_seals | numeric | Manual | Number of secondary seals | |
| Names_secondary_seals | Text | Manual | Names of secondary seals | |
| Data_source | Text | Manual | References to literature from where data are extracted | |
| Remarks | Text | Manual | Any other relevant information | |
| Boundary_condition | Text | Select from list | Boundary condition of the prospect: Open, closed, semi-closed, unknown | |
| Sef_class | Text | Select from list | Storage Efficiency class: Global, Regional, Local. Only for saline aquifers | |
| Sef_estimate | % | Numeric | Manual | Storage Efficiency Factor. Only for saline aquifers |
| Capacity_mean | Mt | Numeric | Manual | Previous expected storage capacity of unit |
| Capacity_min_p90 | Mt | Numeric | Manual | Previous expected minimum storage capacity of unit |
| Capacity_p50 | Mt | Numeric | Manual | Previous expected P50 storage capacity of unit |
| Capacity_max_p10 | Mt | Numeric | Manual | Previous expected maximum storage capacity of unit |
| Capacity_estimation_calculation | Text | Select from list | Calculations from: Analytical equation, modelling or injection test | |
| Cal_methodology | Text | Select from list | Methodologies applied in capacity and injectivity estimates | |
| Data_source | Text | Manual | References to literature from where data are extracted | |
| Remarks | Text | Manual | Any other relevant information | |
| Projected_year | Year | Manual | Projected year of operation start, depending on maturity and Storage Readiness Level (SRL) | |
| Storage_readiness_level | Number | Select from list | Storage Readiness Level (SRL): 1–9 (based on Akhurst et al., 2021) | |
| Seismic_survey | Text | Select from list | Have information from seismic survey | |
| Info_wells | Cross | Manual | Cross if you have information about wells | |
| Nb_wells | Number | Manual | Number of wells | |
| Modeling | Cross | Manual | Information from modelling | |
| Base_line_data | Cross | Manual | Carrying out monitoring | |
| Injection_tests | Cross | Manual | Carrying out injection test | |
| Surface_issues | Text | Select from list | Characteristics of the surface that can complicate the storage | |
| Remarks | Text | Manual | Any other relevant information |
Attribute name with unit, type and description summarized for storage unit, reservoir, seal, capacity and maturity, as defined in Table 1.
2.4 Mapping of utilization
Carbon Capture and Utilization includes many technologies that can capture CO2 directly from the air or from industrial facilities. These technologies utilize CO2 as feedstocks to produce products like chemicals, fuels, and materials. Further details and descriptions of various types of CCU technologies can be found in IEA (2019), Chavez and Partenie (2020), and NASEM (2019). The primary source for the high-level screening of utilization is the CO2 Value European database on CCU, which has been developed through previous EU projects like SCOT and IMPACTS9. This database contains approximately 250 ongoing and upcoming projects at different Technology Readiness Level (TRL; more details are listed in Ringstad et al. (2023).
3 Results of the high-level screening mapping
Figure 3 shows the results of the high-level screening of the Baltic and Mediterranean regions, highlighting marked emission sources and storage sites. The number of facilities and CO2 emission sources varies significantly between countries, including significant emitters in both regions (Table 4). Large clusters of emitters are found in Poland and Germany in the Baltic region, as well as in Italy and Turkey in the Mediterranean Sea region. A comparison of the summarized numbers for the two regions reveals that the number of facilities and the annual CO2 emissions are in the same range, with around 800 facilities and approximately 700 Mtpa (million tons per annum) in emissions. In the Baltic Sea region, large deep saline aquifers with significant storage capacities are mapped for Denmark, totalling 16,042 Mt (note that depleted hydrocarbon fields are excluded from this total), and for Poland, which has a storage capacity of 8,885 Mt, including both aquifers and hydrocarbon fields. In the southern region, Spain, Italy, and Greece demonstrate significant storage capacities, ranging from approximately 3.1–4.8 Gt, as illustrated in Table 5. Overall, the Baltic Sea region has three times more mapped storage capacities than the Mediterranean Sea region, with 33 Mt compared to 13.5 Mt, as shown in Table 5.
FIGURE 3

High level mapping of emission sources and storages sites for the Baltic region (dark green colour) and Mediterranean region (light green colour). Natura 2000 area is marked with purple colours.
TABLE 4
| Country | Number of facilities | CO2 emissions [tpa] |
|---|---|---|
| Denmark | 33 | 11,834 |
| Sweden | 95 | 51,036 |
| Finland | 74 | 46,033 |
| Germany | 405 | 365,840 |
| Estonia | 13 | 8,643 |
| Latvia | 3 | 1,654 |
| Lithuania | 9 | 5,588 |
| Poland | 164 | 189,159 |
| Sum Baltic Sea region | 796 | 689,347 |
| France | 258 | 99,995 |
| Spain | 199 | 90,475 |
| Italy | 204 | 120,538 |
| Greece | 39 | 32,242 |
| Turkey | 175 | 357,888 |
| Sum Mediterranean region | 875 | 701,137 |
Number of facilities and corresponding CO2 emissions for countries in the CCUS ZEN Baltic Sea and Mediterranean Sea regions.
TABLE 5
| Country | Number of deep saline aquifers | Number of hydrocarbon fields | Total capacity (Mt) | References |
|---|---|---|---|---|
| Denmark | 27 | Not included | 16,042 | Hjelm et al. (2020), Anthonsen et al. (2014b) |
| Sweden | 9 | 0 | 3,420 | Mortensen et al. (2021), Lothe et al. (2016) |
| Finland | 0 | 0 | 0 | - |
| Germany | 34 | Not included | 3,539 | Anthonsen et al. (2014b), Poulsen et al. (2014) |
| Estonia | 0 | 0 | 0 | - |
| Latvia | 17 | 0 | 1,172 | Šliaupiene (2014), Shogenov et al. (2013a), Shogenov et al. (2013b), Shogenova et al., 2009, Simmer (2018) |
| Lithuania | 12 | 5 | 299 | Poulsen et al. (2014), Shogenov et al. (2013a), Šliaupienė and Šliaupa (2011) |
| Poland | 55 | 39 | 8,885 | Wójcicki et al. (2014). Pers. com. Wójcicki et al. (2023): Calculated based on the pore volume published in Anthonsen et al. (2014b) and using the CSFL methodology with SEF = 20% which is comparable to other German and Polish site calculations |
| Sum Baltic Sea region | 33,357 | |||
| France | 4 | 20 | 739 | Vangkilde-Pedersen et al. (2009), Veloso (2021) |
| Spain | 17 | Not included | 4,816 | Vangkilde-Pedersen et al. (2009), Poulsen et al. (2014), Veloso (2021) |
| Italy | 14 | 11 | 4,699 | Vangkilde-Pedersen et al. (2009) |
| Greece | 5 | 2 | 3,174 | Vangkilde-Pedersen et al. (2009), Koukouzas et al. (2021) |
| Turkey | Not evaluated | 109 | 109 | Bas and Akpulat (2019) |
| Sum Mediterranean Sea region | 13,537 |
Potential storage sites in the CCUS ZEN Baltic Sea and Mediterranean Sea regions.
3.1 Identification of promising CCUS value chains
After the first screening of the mapped information, several emission clusters were identified, as well as storage options, and possible transport and intermediate storage solutions. Eight CCUS value chains were defined: four in the Baltic region and four in the Mediterranean region. This was based on a sink-source matching approach that considered estimated captured volumes and potential storage capacities. Value chains definition also handles transport scenarios and utilization projects (Figure 4, see also (Gravaud et al., 2024; Gravaud et al., 2025).
FIGURE 4

Location of identified CCUS value chains in the CCUS ZEN regions (Baltic and Mediterranean Sea). Red lines are pipelines, yellow lines are ship transport, dark lines mark emission cluster hubs. Reworked from Gravaud et al. (2024).
4 Example of a CCUS value chain; the Italian-Greece scenario
CCS projects and storage sites have been planned and evaluated in Italy for the past few decades; however, none have been carried out at full scale. The Brindisi CCS Project in southern Italy was evaluated by Enel and ENI using post-combustion technology, but the project was halted in 2016. The first CCS Hub in Italy, the Ravenna Carbon Capture and Storage (CCS) project, located in northeast Italy, started to inject in 2024, with Eni and Snam as operators (Figure 5). For phase 1, 25,000 tons of CO2 emitted from Eni’s natural gas treatment plant in Casalbosetti, Ravenna, are transported by pipeline and stored offshore Ravenna in a depleted gas field, with a potential impact of 10 Mtpa by 2030. Given that the Ravenna CCS project is ongoing in northern Italy, we will focus on mapping the potential CCUS value chain in southern Italy. In this article, we will further explore the Bradanica storage site onshore, southwest of Taranto (Figure 5).
FIGURE 5
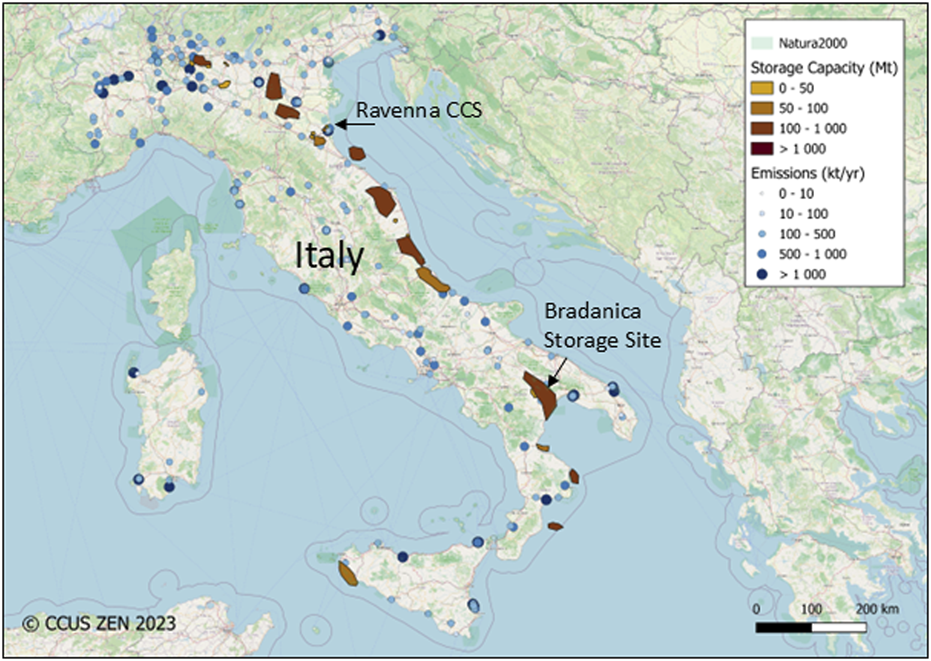
Overview map of Italy with CO2 storage sites and emission sources marked. In addition is the location for the Ravenna CCS and the Bradanica storage site shown.
4.1 Storage site
There are several potential CO2 storage sites in Italy, both onshore and offshore, that have been mapped in the last decade (Donda et al., 2011; Civile et al., 2013; Barison et al., 2023). The CCUS ZEN project primarily had access to onshore site information as shown in Figure 6. Focusing on the southern part of Italy, where there are also large CO2 emitters, the Bradanica site, situated close to Taranto city, could be a possible storage site. The potential storage reservoir consists of Late Pliocene sands and silty sands with marl and conglomerates in places, pinching out towards the eastern carbonate platform (Donda et al., 2011). These deposits have been interpreted as basin floor sandstone lobes (Patacca and Scandone, 2001), where flexure deformation occurred during the Plio-Pleistocene. The reservoir unit is locally more than 800 m thick, with an effective thickness of 650 m. The assumed caprock, clay and silty clay deposited from Late Pliocene are more than 1,500 m thick in some areas (Donda et al., 2011). From the CO2 storage capacity estimates in Donda et al. (2011), the reservoir has a storage capacity of 344 Mt, assuming an efficiency of 1%. If assuming a storage efficiency of 4%, 1,376 Mt can be stored, assuming a porosity value of 25% (Table 6).
FIGURE 6

Overview map of Mediterranean 4, with CO2 storage onshore in southern Italy at Bradanica Storage Site. Several CO2 emitter hubs are mapped in the area. From southwest we have Priolo Gargallo, Messina, Cantanzaro emission hubs, and from east we have Brindisi and Taranto. Yellow dashed lines show possible ship transport from France and Croatia. Reworked from Gravard et al. (submitted).
TABLE 6
| Daughter unit | Seal | Seal_lithology | Seal_thickness, m | Secondaryseals | Boundary_condition | Seff, % | Capacity mean, Mt | SRL | Seismic_survey | Wells | Abandoned wells | Modeling | Base_line data |
|---|---|---|---|---|---|---|---|---|---|---|---|---|---|
| Late Pliocene | Calabria, Late Pliocene | Clay and silty clay | 1,000 | - | Closed | 1–4 | 344–1,376 | 2 | 2D | 1 | 1 | - | - |
Properties of the Bradanica CO2 storage site in the Med-4 value chain.
4.2 Emission sources
In the southern part of Italy, we have identified several large CO2 emitter hubs (Figure 5). The ones situated the closest to the possible storage site are the Taranto cluster and the Brindisi cluster.
Taranto is a coastal city in Apulia, southern Italy with one of the largest steel plants in Europe. The ArcelorMittal (Ilva steelworks) is one of the largest point emitters in Italy. The numbers listed in this report show 5.2 Mtpa of CO2, while unofficial calculations, including the two thermoelectric power plans, sum up to around 10 Mtpa of CO2 (based on the Environmental Declaration verified by EMAS in 2016). Thus, by only including official numbers, there are several emitters in the area, e.g., three refineries and one power plant, that are also to be part of a CCS hub (see Table 7). Figure 7 shows a pie chart for Taranto cluster, including also the two smallest emitters. The Taranto cluster then sums up to 12.4 Mtpa with the main sources from iron and steel plan, power, and refineries.
TABLE 7
| Type of industry | CCUS contribution in % | Source | Comments |
|---|---|---|---|
| Chemicals | 35 | IEA (2020) report | Several other means such as electrification, process efficiency, fuel change exists. We will use values from IEA. |
| Iron and steel | 25 | IEA (2020) report | The industry is looking at several other decarbonisation pathways and changes in their processes |
| Refineries | 50 | Assumption | Other means such as electrification, process efficiency, fuel charge exits. However, refineries must also use their by-product as fuel so there are more non-reducible emissions. Hence, an average value is proposed |
| Power | 50 | Assumption | Average value taken with the assumption that some of the power plant will convert to biogenic fuel |
| Cement/lime | 65 | IEA (2020) report | Process emissions are still to be managed |
| Hydrogen | 85 | Assumption | Less other decarbonisation options for existing installations exists, unless changing the whole plant to Green H2, therefor a high percentage is proposed |
Summary of CO2 emitter sector, and CCUS contribution used in the calculations.
FIGURE 7

Pie chart presenting three of the emission hubs at southern part of Italy, the Taranto Cluster, Brindisi cluster and Priolo Gargallo.
Thus, based on the IEA (2020) report and our own work, we assume that not all CO2 emitted will be stored in the underground. We assume that the percentage of captured CO2 varies by industry sector. We have used the same cut off, with the same reasoning as described more in detail in Shogenova et al. (2024a), for the Mediterranean value chain. A summary of the assumptions made is presented in Table 7. Table 8 shows the summary emissions for the different clusters in Southern Italy and Greece, respectively. Even with a large cut off, for instance, for the iron and steel industry and power, there are still large emissions, specially from southern Italy, but also from the Athens emission hub.
TABLE 8
| Cluster name | Total CO2 emissions (tpa) | Number of emitters | CO2 emissions for storage (tpa) | Transport mode | Distance (KM) |
|---|---|---|---|---|---|
| Taranto cluster | 12,410 764 | 7 | 4,965 582 | ||
| Brindisi cluster | 6,891 000 | 4 | 3,369 000 | ||
| Priolo Garallo cluster | 7 205 000 | 9 | 3,534 500 | ||
| Messina cluster | 3,818 000 | 3 | 1,909 000 | ||
| Catanzaro | 1,346 000 | 1 | 673,000 | ||
| Total Southern Italy | 31,670 764 | 24 | Pipeline | 513 | |
| Agioi Theodoroi cluster | 2,753 000 | 2 | 1,376 500 | ||
| Lavrion | 1,394 000 | 1 | 697,000 | ||
| Athen cluster | 5,275 000 | 5 | 2,775 650 | ||
| Total Athen, Greece | 9,422 000 | 8 | Ship | 900 | |
| Total Med-4 (Southern Italy and Athen) | 41,092 764 | 32 | 19,300 232 |
Overview of total CO2 emissions (tpa), number of emitters, CO2 emissions for storage, transport mode and distance for CO2 clusters in southern Italy and Greece.
5 Discussion
The European Union and the United Kingdom are major energy consumers and CO2 emitters, accounting for 12% of global emissions. The EU announced the Green Deal in 2019 to establish a roadmap for reducing emissions by at least 55% by 2030 and achieving zero emissions by 2050 (European Commission, 2019). Carbon capture and storage can be an important technology to contribute to fulfilling this ambition. In this article, we present a high-level CCUS value screening workflow and emphasize the main components needed in such a screening and workflow (Figure 2). The workflow has been tested in two regions in Europe that are less mature in terms of CCS: the Baltic and Mediterranean regions, with a more detailed case study presented for Italy-Greece. We will discuss several challenges in mapping a CCUS value chain, starting with the identification of emitters.
One of the results from the high-level CCUS screening in the two regions is that the number of emitters and the volume of emissions are in the same range for the Baltic and Mediterranean regions, with between 800–875 facilities and emissions approximately 700 Mtpa. For storage capacity, there are larger differences, with three times larger storage capacities mapped in the Baltic region compared to the Mediterranean region. One reason for this, is the easier access to data for the CCUS ZEN project in the Baltic region. More data has been made available in the Baltic over the last 3 decades. In the Mediterranean Sea, we did not have access to data for offshore France, we had little information from Italy and insufficient data available for the Castellon storage site in Spain, owned by the REPSOL oil company, which is currently planning detailed exploration for CO2 storage in the TarraCO2 project.
Reducing uncertainty in storage capacity, storage injectivity, and the longevity of a storage site is important. One major bottleneck at present is the lack of open geological datasets, including both 2D and 3D seismic datasets, and/or data from wells for potential storage formations. The underlying datasets needed, such as interpreted 2D seismic or 3D seismic data from existing wells, geological models, and/or reservoir models, are seldom publicly available. Scarce data coverage poses a major challenge in many regions, and in the CCUS ZEN project, the mapping of storage sites heavily relied on previous research projects. Since the screening of potential storage sites was based on publicly available data, it resulted in varying mapping coverage.
Another challenge related to mapping storage sites is the capacity of these potential storage locations. Indeed, databases present many sites with insufficient storage capacity for an operational CCS project to take place. For example, in Southern France, existing capacity data are on the order of a few tens of Mt, or even smaller, per site. Consequently, it is challenging to find sufficient storage capacity for the identified emission clusters and to build large-scale value chains. This is also a reason why transnational scenarios were developed. Finland lacks any storage potential, as it only has bedrock, and therefore the selected value chain suggested in CCUS ZEN involves pipeline or ship transport from Helsinki, Finland, to Rødby, a storage site in Denmark (Gravaud et al., 2024). Sweden has sedimentary deposits in the Baltic Sea, such as the Cambrian Faludden Formation, but with low storage potential, e.g., dipping aquifers with small natural closures (e.g., Lothe et al., 2016). However, the structures continue southwards on the Polish side and may serve as a potential storage structure.
For emission sources, there are complexities in deciding which industrial sites should be prioritized for CCS. The emission sources are subdivided based on the type of industry, varying from refineries, chemicals, power, hydrogen, energy from waste, cement, paper and pulp, iron and steel, and others. For some industries, CCS is the obvious option to reduce emissions (e.g., cement industry), while in other cases, CCS may be one of several options (with some form of electrification often being another). The level of CO2 emissions in the future and the longevity of an industrial plant can also be factors in considering the deployment of CCS. However, information on this is difficult to obtain. It can be commercially sensitive, and there may also be political considerations that are hard to assess. For this reason, in this high-level screening, only the current emission levels from different industries are considered.
When choosing the emitter hub, several factors were evaluated. The type of industry, the number of emission sources, and, importantly, the location are very important factors. If there are several large industry clusters that can share common infrastructure, such as pipelines and/or buffer storage and/or ship transport, this can be crucial for building out an emission hub. In addition, the possibility of sharing a storage site would be beneficial for the emitters and for the owner of the storage site. The possible choice of storage sites are very much dependent on the transport infrastructure needed and the possible costs. In a high-level screening, only different options with distance in kilometres are shown.
For CO2 emitters, a hub structure is attractive (Wang, 2024) to reduce the risk for each industry actor. A hub structure also minimizes the risk that transport, and storage infrastructure will be underutilized. A hub with more emitters will be less dependent on the emissions of a single industrial site for maintaining a high degree of utilization. In the screening, the total emissions amount of the clusters and the storage capacities are considered. However, it is recognized that actual total CO2 emission volumes should be treated with caution. On one hand, the total amount of the clusters’ emissions does not exactly represent the amount of captured CO2 but rather a maximum, as not 100% of the emissions would necessarily be captured. For some industries, transitioning to renewables or biogenic feedstocks may be more attractive and easier to implement.
In the example from Southern Italy, the high-level mapping for the entire CCUS value chain is essential to evaluate obstacles. Currently, Ravenna CCS has already started to inject CO2 in their hub, and significant efforts are being made in Greece to clarify the offshore site Prinos for CO2 storage (Koukouzas et al., 2009). However, as we see from the CO2 emission hubs, there are potentially several emitter hubs in Southern Italy, where CO2 can be transported via pipelines to the onshore Bradanica storage site. The storage capacity is around 344 Mt, assuming a storage efficiency of 1%, while using a storage efficiency of 4% results in around 1,276 Mt CO2. Assuming an injection rate of 2 Mtpa in two wells, the storage site could be used for a minimum of 172 years. If we are less conservative, assuming a storage efficiency of 2%, the site could store for hundreds of years. Most likely, more injection wells could be an option, but to resolve this and de-risk the storage site, detailed reservoir modelling should be carried out. To develop a high-level value chain, all present and future stakeholders along the value chain need to be informed and aligned. Several key actors and driving forces will shape CCUS value chains, and these should be involved in the workflow. There is a strong interdependency among stakeholders with different interests, from industry emitters to transport and storage owners. To reduce risks, both economically and in terms of time spent, partnerships (or collaboration between stakeholders) across the value chain should be established.
Non-technical parameters influencing CCUS value chain developments include social, political, regulatory aspects, as well as economics, monitoring, reporting and verification and contracting. Communication with regulators, local public and non-governmental organisations and rising their awareness are always needed, but it is a time-consuming process (Honegger et al., 2024).
The export of CO2 to offshore storage sites needs CO2 storage regulations to be implemented internationally; (London Protocol (LP) 2009 Amendment to article 6, or/and its Provisional Application) and regionally (Helsinki Convention in the Baltic (HELCOM) and Barcelona Convention in the Mediterranean region), in addition to national regulations and permits needed for CO2 storage both in onshore and offshore sites. At the present time LP 2009 Amendment to article 6 is implemented only in some studied countries of the Baltic Sea region (Denmark, Finland, Sweden and Estonia - among 13 countries implemented it in total). Denmark, Finland and Sweden are among nine countries in total which deposited declaration to allow for the Provisional Application of the 2009 amendment to article 6 of the LP. These regulations are not yet implemented in the Mediterranean Sea region, although there are some plans of Italy to do this including cooperation with France and Greece for bilateral agreements (IMO, 2025; Shogenova et al., 2024b).
The CO2 storage is banned in the Baltic Sea now, according to the HELCOM, but The HELCOM recently decided to prepare in 2025–2026 the EIA (Environmental Impact Assessment) for CO2 storage under the seabed in the Baltic Sea (information from personal communication of authors with national ministries). According to the initial Protocol of the Barcelona Convention CO2 storage is permitted in the Mediterranean Sea. Public acceptance of CCUS technology in the studied regions is from low to medium with higher number of „medium” countries in the Baltics (Honegger et al., 2024).
The national regulations in the regions are developed in different directions. In the Baltic Sea Region, there are positive examples of Poland recently permitted CO2 storage offshore and already prepared permitting regulations for onshore storage (to be published soon), and Latvia working in 2025 on CCS regulations towards its full implementation and possible permitting of CO2 storage.
However, there is a negative example in the neighbouring Lithuania, which has banned any CO2 injection since 2020, after CO2 storage was initially permitted after full implementation of EU CCS Directive in 2011–2012 (Shogenova et al., 2013; Shogenova et al., 2021). These examples are clear signs of the increasing public awareness and acceptance of the technology in Poland and Latvia and low public acceptance in Lithuania. The Nordic countries are good examples of the positive influence of the non-technical issues, including policies and national financial support, on fast development of the CCUS technology, especially successful in Denmark with large numbers of very good storage sites and significant storage capacity.
6 Summary
The CCUS technical value chain screening involved mapping CO2 emitters, infrastructure, storage sites, and utilization options using an open geographical information system. Emission sources were mapped to identify CO2 capture sites, focusing on clusters for efficient transport to storage in the Baltic and Mediterranean regions. Data from the EU Emissions Trading System and the European Pollutant Release and Transfer Register were used for this mapping.
Existing and future CO2 transport infrastructure was evaluated, including pipelines and shipping options, with a focus on combining methods for efficiency and compliance with regulations. Potential storage sites were categorized into saline aquifers and depleted reservoirs, with capacity estimates based on previous studies. The screening considered various geological data sources. CCU technologies were explored, utilizing CO2 for producing chemicals and fuels, with data sourced from the CO2 Value European database.
The screening revealed significant emitters in both regions, with around 800–875 facilities in each region emitting approximately 700 Mtpa. The Baltic region had larger mapped storage capacities than the Mediterranean. Eight CCUS value chains were developed based on emitter clusters and storage options, with a focus on transport scenarios.
7 Conclusions and recommendations
The high-level CCUS value chain screening has been summarised in
Figure 2, with mapping of emitters, transport infrastructure and storage sites, and utilization as a theme closely connected to capture screening. High-level CCUS value chain screening is the first step, evaluating the main tasks and research tasks that need to be addressed. The screening should serve as a tool to engage relevant stakeholders for further collaboration and in-depth analysis in the future. Subsequently, more input data, further analysis and modelling are needed to mature and qualify a CCUS value chain. Based on the technical screening work performed, the following main recommendations can be made for the further development of CCUS value chains.
• Improve geological knowledge to decrease uncertainties related to storage capacity and leakage risks;
• Improve access to data: aim for open data and sharing of data. This is especially important for dataset linked to storage sites, to mature the site and level the Storage Readiness Level;
• Consider emitters from hard-to-abate industries (cement, etc.) as potential anchors for the clusters;
• Design the value chain from an industrial and regional reality to provide a solution to an identified need;
• Recognise that non-technical aspects, such as legal regulations, social acceptance and economic factors, are important factors also for the technical mapping. This aspect has not been included in the current high-level CCUS value chain screening.
Statements
Data availability statement
The raw data supporting the conclusions of this article will be made available by the authors, without undue reservation.
Author contributions
AL: Conceptualization, Writing – original draft, Writing – review and editing. IG: Conceptualization, Writing – review and editing. CR: Writing – review and editing, Conceptualization, Funding acquisition. ES: Writing – review and editing, Funding acquisition, Project administration. RS: Writing – review and editing, Supervision. AS: Methodology, Supervision, Writing – review and editing. KS: Writing – review and editing, Data curation. LS: Methodology, Writing – review and editing, Data curation. AW: Data curation, Writing – review and editing. ÇS: Data curation, Writing – review and editing. BY: Data curation, Writing – review and editing. SB: Data curation, Writing – review and editing. KA: Data curation, Writing – review and editing. AP: Writing – review and editing.
Funding
The author(s) declare that financial support was received for the research and/or publication of this article. This study is supported by the CCUS ZEN project which has received funding from the European Union’s Horizon Europe research and innovation programme under grant agreement No 101075693. CCUS ZEN is grateful for the contribution given by the networking partners BGR (Federal Institute of Geosciences and Natural Resources, Germany), SGU (Geological Survey of Sweden) and IGME (Geological and Mining Institute of Spain, Spanish National Research Council) to the mapping of potential storage sites in their respective countries. We are also grateful to CERTH (Centre for research and technology Hellas) for their contribution to the capacity estimates for storage sites in Greece.
Conflict of interest
The authors declare that the research was conducted in the absence of any commercial or financial relationships that could be construed as a potential conflict of interest.
Generative AI statement
The author(s) declare that no Generative AI was used in the creation of this manuscript.
Any alternative text (alt text) provided alongside figures in this article has been generated by Frontiers with the support of artificial intelligence and reasonable efforts have been made to ensure accuracy, including review by the authors wherever possible. If you identify any issues, please contact us.
Publisher’s note
All claims expressed in this article are solely those of the authors and do not necessarily represent those of their affiliated organizations, or those of the publisher, the editors and the reviewers. Any product that may be evaluated in this article, or claim that may be made by its manufacturer, is not guaranteed or endorsed by the publisher.
Supplementary material
The Supplementary Material for this article can be found online at: https://www.frontiersin.org/articles/10.3389/feart.2025.1641951/full#supplementary-material
References
1
Akhurst M. Kirk K. Neele F. Grimstad A. Bentham M. Bergmo P. (2021). Storage Readiness Levels: communicating the maturity of site technical understanding, permitting and planning needed for storage operations using CO2. Int. J. Greenh. Gas Control110, 103402. 10.1016/j.ijggc.2021.103402
2
Anthonsen K. L. Aagaard P. Bergmo P. E. Gislason S. R. Lothe A. E. Mortensen G. M. et al (2014a). Characterisation and selection of the most prospective CO2 storage sites in the Nordic region. Energy Procedia63, 4884–4489. 10.1016/j.egypro.2014.11.519
3
Anthonsen K. L. Bernstone C. Feldrappe H. (2014b). Screening for CO2 storage sites in southeast North Sea and southwest Baltic Sea. Energy Procedia63 (2014), 5083–5092. 10.1016/j.egypro.2014.11.538
4
Barison E. Donda F. Merson B. Le Gallo Y. Reveillere A. (2023). An insight into underground hydrogen storage in Italy. Sustainability15, 6886. 10.3390/su15086886
5
Bas D. Akpulat O. (2019). Technical assistance for developed analytical basis for formulating Strategies and actions towards low carbon development – Turkey capacity report 2019. EuropeAid/136032/IH/SER/TR.
6
Chavez E. Partenie O. (2020). Global CCU infrastructure market assessment, ECCSELRATE, 13. Deliverable D1.3.
7
Civile D. Zecchin M. Forlin E. Donda F. Volpi V. Merson B. et al (2013). CO2 geological storage in the Italian carbonate successions. Int. J. Greenh. Gas Control19, 101–116. 10.1016/j.ijggc.2013.08.010
8
Donda F. Volpi V. Persoglia S. Parushev D. (2011). CO2 storage potential of deep saline aquifers: the case of Italy. Int. J. Greenh. Gas Control, 327–335. 10.1016/j.ijggc.2010.08.009
9
European Commission (2019). A European green deal. Available online at: https://ec.europa.eu/info/strategy/priorities-2019-2024/european-green-deal_en.
10
European Commission (2024). Communication from the commission to the european parliament, the council, the european economic and social committee and the committee of the regions towards an ambitious Industrial Carbon Management for the EU. (COM/2024/62).
11
Gammer D. Green A. Holloway S. Smith G. (2011). “The energy technologies institute's UK CO2 storage appraisal project (UKSAP),” in SPE Offshore Europe Oil and Gas Conference and Exhibition, Aberdeen, UK, 6–8 September 2011. SPE number 148426.
12
Gravaud I. Shogenova A. Shogenov K. Sousa L. H. Wójcicki A. Lothe A. E. et al (2024). Deliverable 1.2 Identification of promising CCUS value chains in the two ZEN regions for further analyses in WP3. Open report in EU Horizon Europe CCUS ZEN. Project 101075693.
13
Gravaud I. Lopez A. Koumentis I. Lothe A. E. Shogenova A. Bouvier L. et al (2025). Developing CCUS in Mediterranean region – technical evaluation of promising value chains. Submitted to International Greenhouse Gas Control.
14
Hjelm L. Anthonsen K. L. Dideriksen K. Nielsen C. M. Nielsen L. H. Mathiesen A. (2020). Evaluation of the CO2 storage potential in Denmark (GEUS rapport 2020/46).
15
Honegger M. Oh S. Schmitt F. Poralla M. Ombudstvedt I. Ostgaard L. et al (2024). “Making CCU and CCS hubs and clusters happen: overcoming non-technical challenges,” in Perspectives climate research on behalf of the CCUS ZEN project, D2.3 of CCUS ZEN project (Freiburg i.B., Germany), 70.
16
IEA (2019). Putting CO2 to use: creating value from emissions, 86.
17
IEA (2020). CCUS in clean energy transitions. Paris: IEA. Available online at: https://www.iea.org/reports/ccus-in-clean-energy-transitions,Licence:CCBY4.0.
18
IMO (2025). Status of IMO treaties: comprehensive information on the status of multilateral Conventions and instruments in respect of which the International Maritime Organization or its Secretary-General performs depositary or other functions, 20 June (2025). Available online at: https://wwwcdn.imo.org/localresources/en/About/Conventions/StatusOfConventions/Status%202025.pdf.
19
IPCC (2006). in IPCC guidelines for national greenhouse gas inventories, prepared by the national greenhouse gas inventories programme. Editors EgglestonH. S.BuendiaL.MiwaK.NgaraT.TanabeK. (Japan: IGES).
20
Jakobsen J. P. Brunsvold A. (2011). Development of scenarios for carbon capture and storage ECCO - European value chain for CO2. Energy Procedia4, 2677–2684. 10.1016/j.egypro.2011.02.168
21
Kjärstad J. Johnsson F. (2009). Ramp-up of large-scale CCS infrastructure in Europe. Energy Procedia2009, 4201–4208. 10.1016/j.egypro.2009.02.230
22
Koukouzas N. Ziogou F. Gemeni V. (2009). Preliminary assessment of CO2 geological storage opportunities in Greece. Int. J. Greenh. Gas Control3, 502–513. 10.1016/j.ijggc.2008.10.005
23
Koukouzas N. Tyrologou P. Karapanos D. Carneiro J. Pereira P. de Mesquita Lobo Veloso F. et al (2021). Carbon capture, utilisation and storage as a defence tool against climate change: current developments in west Macedonia (Greece). Energies14 (11), 3321. 10.3390/en14113321
24
Lothe A. E. Bergmo P. E. S. Emmel B. U. Mortensen G. M. (2016). “CO2 storage capacity estimates for a Norwegian and a Swedish aquifer using different approaches - from theoretical volumes, basin modelling to reservoir models,” in Geologic carbon sequestration: understanding reservoir concepts. Editor SinghT. N. (Springer International Publishing), 98–117.
25
Lothe A. E. Gravaud I. Falck da Silva E. Skagestad R. Shogenova A. Shogenov K. et al (2025). Deliverable 1.3 A framework for regional high-level technical screening of promising CCUS value chains. Open report in EU Horizon Europe CCUS ZEN. Project 101075693.
26
Mortensen G. M. Sopher D. (2021). Rapportering av regeringsuppdrag. Geologisk lagring av koldioxid i Sverige och i grannländer - status och utveckling 2021. Swedish: Sveriges geologiska undersökning.
27
NASEM (2019). Gaseous carbon waste stream utilization – status and research needs.
28
Patacca E. Scandone P. (2001). “Late thrust propagation and sedimentary response in the thrust-bet-foredeep system of the Southern Apennines (Pliocene-Pleistocene),” in Anatomy of an Oregon: the apeninnes and adjacent mediterranean basins. Editors VaiG. G.MariniI. P. (Kluwer Academic Publishers), 401–440.
29
Poulsen N. Holloway S. Neele F. Smith N. A. Kirk K. (2014). CO2STOP final report. Assessment of CO2 storage potential in Europe 2014. Available online at: https://energy.ec.europa.eu/publications/assessment-co2-storage-potential-europe-co2stop_en.
30
Ringstad C. Falck da Silva E. Skagestad R. Heyn R. Biragnet C. Frykman P. et al (2023). Deliverable 1.1 High-level regional mapping of CO2 emission sources, utilization industry and infrastructure in the Baltic Sea and Mediterranean Sea regions. Open report in EU Horizon Europe CCUS ZEN. Project 101075693.
31
Shogenov K. Shogenova A. Vizika-Kavvadias O. (2013a). “Petrophysical properties and capacity of prospective for CO2 geological storage Baltic offshore and onshore structures,” in Energy procedia. (5036−5045) (Elsevier). 10.1016/j.egypro.2013.06.417
32
Shogenov K. Shogenova A. Vizika-Kavvadias O. (2013b). Potential structures for CO2 geological storage in the Baltic Sea: case study offshore Latvia. Bull. Geol. Soc. Finl.85 (1), 65–81. 10.17741/bgsf/85.1.005
33
Shogenova A. Sliaupa S. Vaher R. Shogenov K. Pomeranceva R. (2009). The Baltic Basin: structure, properties of reservoir rocks and capacity for geological storage of CO2. Est. J. Earth Sci.58 (4), 259–267. 10.3176/earth.2009.4.04
34
Shogenova A. Piessens K. Ivask J. Shogenov K. Martínez R. Flornes K. et al (2013). CCS Directive transposition into national laws in Europe: progress and problems by the end of 2011. Energy Procedia37, 7723–7731. 10.1016/j.egypro.2013.06.718
35
Shogenova A. Nordbäck N. Sopher D. Shogenov K. Niemi A. Juhlin C. et al (2021). “Carbon neutral baltic Sea Region by 2050: myth or reality?,” in 15th international conference on greenhouse gas control technologies, GHGT-15, 15-18 march 2021, abu dhabi, UAE. Elsevier, 1–12. SSRN. 10.2139/ssrn.3817722
36
Shogenova A. Shogenov K. Sousa L. H. Bonto M. Gravaud I. Lopez A. et al (2024a). Deliverable 3.1 CCUS value chains for the two CCUS ZEN regions selected for further development in WP4. Open report in EU Horizon Europe CCUS ZEN. Project 101075693.
37
Shogenova A. Shogenov K. Fantini M. Ferrari K. Guasti E. Martinelli F. et al (2024b). “Regulatory and political readiness of southern Europe for industrial implementation of CCUS technology: a case study from Italy and Greece,” in Proceedings of the 17th Greenhouse Gas Control Technologies Conference (GHGT-17) 20–24 October 2024. 10.2139/ssrn.5061103
38
Shogenova A. Shogenov K. Gravaud I. Sousa L. Wójcicki A. Lothe A. E. et al (2025). D3.3 A generic framework for selection of the most promising CCUS value chains. Open report in EU Horizon Europe CCUS ZEN. Project 101075693.
39
Simmer K. (2018). Estonian-Latvian transboundary carbon dioxide capture, transport and storage (CCS) scenario for the cement industry. Master Thesis: Tallinn University of Technology, 1–48.
40
Šliaupiene R. (2014). Prospects of CO2 geological storage in the Baltic sedimentary basin. Vilnius: Summary of doctoral dissertation, 38. Available at: https://epublications.vu.lt/object/elaba:2176185/index.html.
41
Šliaupienė R. Šliaupa S. (2011). Prospects for CO2 geological storage in deep saline aquifers of Lithuania and adjacent territories. Geologija53 (3), 121–133. Available at: https://mokslozurnalai.lmaleidykla.lt/publ/1392-110X/2011/3/Sliaupiene.pdf.
42
Tumara D. Uihlein A. Hidalgo Gonzalez I. (2024). Shaping the future CO2 transport network for Europe. Luxembourg: Publications Office of the European Union. 10.2760/582433,JRC136709
43
Vangkilde-Pedersen T. Anthonsen K. Smith N. Kirk K. Van der Meer B. Le Gallo Y. et al (2009). Assessing European capacity for geological storage of carbon dioxide – the EU GeoCapacity project. Energy Procedia, 2663–2670. 10.1016/j.egypro.2009.02.034
44
Veloso F. M. L. (2021). Maturity level and confidence of storage capacities estimates in the promising regions, 125. EU H2020 STRATEGY CCUS Project 837754, Report.
45
Wang R. (2024). Status and perspectives on CCUS clusters and hubs. Unconv. Resour.4 (2024), 100065. 10.1016/j.uncres.2023.100065
46
Wójcicki A. Nagy S. Lubaś J. Chećko J. Tarkowski R. (2014). Assessment of formations and structures suitable for safe CO2 storage (in Poland) including the monitoring plans 2014. Available online at: https://skladowanie.pgi.gov.pl/twiki/pub/CO2/WebHome/seq-summ.pdf.
Summary
Keywords
CCUS, value chain, screening, Europe, CCS
Citation
Lothe AE, Gravaud I, Ringstad C, Silva EFd, Skagestad R, Shogenova A, Shogenov K, Sousa L, Wójcicki A, Sınayuç Ç, Yıldırım B, Bülbül S, Anthonsen KL and Perimenis A (2025) A framework for regional high-level technical screening of promising CCUS value chains. Front. Earth Sci. 13:1641951. doi: 10.3389/feart.2025.1641951
Received
05 June 2025
Accepted
18 August 2025
Published
18 September 2025
Volume
13 - 2025
Edited by
Arshad Raza, King Fahd University of Petroleum and Minerals, Saudi Arabia
Reviewed by
Muhammad Adeem Abbas, University of New South Wales, Australia
Fahad Khan, King Fahd University of Petroleum and Minerals, Saudi Arabia
Updates
Copyright
© 2025 Lothe, Gravaud, Ringstad, Silva, Skagestad, Shogenova, Shogenov, Sousa, Wójcicki, Sınayuç, Yıldırım, Bülbül, Anthonsen and Perimenis.
This is an open-access article distributed under the terms of the Creative Commons Attribution License (CC BY). The use, distribution or reproduction in other forums is permitted, provided the original author(s) and the copyright owner(s) are credited and that the original publication in this journal is cited, in accordance with accepted academic practice. No use, distribution or reproduction is permitted which does not comply with these terms.
*Correspondence: Ane Elisabet Lothe, aneelisabet.lothe@sintef.no
Disclaimer
All claims expressed in this article are solely those of the authors and do not necessarily represent those of their affiliated organizations, or those of the publisher, the editors and the reviewers. Any product that may be evaluated in this article or claim that may be made by its manufacturer is not guaranteed or endorsed by the publisher.