 Weisheng Zhao
 Xiangru Liu2
- 1School of Architectural Engineering, Neijiang Normal University, Neijiang, China
- 2State Key Laboratory of Intelligent Construction and Healthy Operation and Maintenance of Deep Underground Engineering, China University of Mining and Technology, Xuzhou, China
Fractured rock masses are widely distributed in geological and engineering fields, and their microcrack evolution and propagation mechanisms directly affect structural stability. To investigate these mechanisms in defective rocks, this study establishes a numerical model of pre-fabricated parallel double-fissure red sandstone using particle flow code (PFC2D). The fissures, inclined at a 45° angle to the direction of the applied stress, simulate microcrack initiation, propagation, and coalescence under different confining pressures. The results indicate that an increase in confining pressure causes the failure mode of the specimen to shift from tensile splitting failure to shear failure, a mechanism primarily controlled by the coalescence of tensile microcracks. At the fissure tips, reverse wing cracks initially form and further develop into reverse shear planes under high confining pressure conditions. The microcrack shear-tensile ratio (MSTR) is positively correlated with confining pressure and peak strength. The number of tensile microcracks at the peak stress increases stepwise with increasing confining pressure, with critical confining pressures identified at 0 MPa, 10 MPa, and 20 MPa. In contrast to tensile microcracks, shear microcracks are more sensitive to the confining pressure, indicating that higher confining pressures more easily induce shear microcrack initiation, although their quantity remains significantly lower than that of tensile microcracks. Numerical analysis further reveals that the stress concentration at the fissure tips, compression-induced tensile effects, and the deflection of contact force directions are the primary driving factors for the initiation, propagation, and coalescence of microcracks. This study provides a theoretical basis for predicting the fracture behavior of defective rock masses and offers valuable insights for engineering applications such as tunneling, slope stability, and underground excavation, where confining pressure critically influences rock failure mechanisms.
1 Introduction
The microcrack propagation behavior of rock directly controls the progressive failure process of engineering rock masses (Shandilaya and Roshankhah, 2024). As a natural material, rock contains numerous fractures, joints, micropores, and weak interlayers, all of which can significantly influence the initiation, propagation, and coalescence of cracks (Li H. et al., 2024; Li et al., 2024b; Wang J. et al., 2024). Under triaxial stress conditions, variations in confining pressure lead to changes in the stress distribution around fractures, thereby altering crack propagation paths and failure modes (Duan et al., 2023; Zhang et al., 2023a; He et al., 2025). Therefore, investigating the microcrack propagation characteristics and mechanisms of defective rock is essential for obtaining a deeper understanding of the stability of rock engineering structures, providing both theoretical insights and practical guidance.
Fissure models can be used to simulate actual rock mass structures, predict failure modes, and enhance the reliability of engineering designs (Ko et al., 2024; Li J. et al., 2025). Compared with single-fissure models, double-fissure models more accurately represent real engineering conditions and can better reveal the influence of fissure interactions on rock mechanical behavior. Previous studies have shown that variations in rock bridge length and inclination angle significantly affect microcrack propagation direction and coalescence patterns (Zhu and Yu, 2020). Rock strength decreases with increasing fissure inclination, whereas fissures with the same inclination but different orientations exhibit a higher compressive strength (Pan et al., 2019). Additionally, the geometric shape of fissures and the presence of filling materials impact peak stress (Zhuang and Zhou, 2020). Although prior research has explored the effects of rock bridge length, preset fissure inclination, and geometric characteristics on crack propagation and failure behavior, the microcrack evolution characteristics and propagation mechanisms under different confining pressures for specific double-fissure inclinations remain insufficiently studied.
In recent years, advanced experimental techniques such as high-speed photography, scanning electron microscopy (SEM), CT scanning, digital image correlation (DIC), and acoustic emission monitoring have been widely used to observe the initiation, propagation, and coalescence of cracks (Zhao et al., 2018; Yuan et al., 2020; Zhang et al., 2023b; Liang et al., 2025). For example, Wong and Einstein (2009) employed a high-speed camera and SEM to monitor the crack propagation process in gypsum and marble specimens under uniaxial compression, and analyzed the mechanical mechanisms of crack evolution from both macroscopic and microscopic perspectives. Tang (2020) used SEM to observe microcrack propagation in marble specimens during compression, revealing the evolution of micro- and macrocracks under different loading conditions. Zheng et al. (2025) utilized CT imaging to study the internal crack propagation patterns in rock subjected to explosive loading. Huang et al. (2020), Yang (2011), and Yang et al. (2013) monitored rock crack propagation using photographic and acoustic emission techniques, and analyzed the effects of coplanar fissures on crack propagation modes. However, these experimental methods generally suffer from limitations, such as the inability to directly observe crack propagation during testing and the inability to directly reflect the evolution of the internal stress field, leading to crack propagation analysis primarily remaining at a qualitative level.
Currently, numerical simulation methods have become effective approaches for analyzing the stability of rock mass structures and quantitatively evaluating rock specimens (Wu et al., 2023; Li et al., 2024c; Li H. et al., 2025; Bahri et al., 2025; Rajabian and Vahedifard, 2025). Among them, the particle flow code (PFC), which is based on the discrete element method, can effectively characterize the development of microcracks and the mechanical behavior of rock (Sarfarazi et al., 2024; Xu et al., 2024). For example, Zhang et al. (2019), Abharian et al. (2022), Gong et al. (2025), Haeri et al. (2022), Wang X. et al. (2021), and Liu et al. (2020) used PFC2D to study crack propagation characteristics in sandstone, basalt, granite, and rock-like materials. However, most of these studies focused on crack propagation mechanisms in fractured rock under uniaxial compression, whereas studies on microcrack propagation mechanisms under different confining pressures are relatively limited.
Therefore, on the basis of uniaxial compression tests of pre-fabricated red sandstone specimens with double fissures, this study established a parallel double-fissure model and simulated its microcrack propagation characteristics using the PFC2D program. The distribution patterns of microcrack types and quantities under different confining pressure conditions were analyzed. Additionally, by dynamically tracking and recording the distribution characteristics of interparticle contact forces and parallel bond forces, the microscopic mechanisms of crack propagation were revealed. These findings provide a theoretical foundation for understanding and predicting the fracture behavior of defective rock masses, offering important insights for tunneling, slope stability analysis, and underground excavation.
2 Materials and methods
2.1 Materials and numerical model
This study employed PFC2D to numerically simulate the microcrack propagation process in red sandstone. The simulated red sandstone exhibited a medium-grained crystalline structure with a uniform particle distribution and an average density of approximately 2,400 kg/m3, with relevant physical properties referenced from the literature (Yang et al., 2013). To analyze the microcrack propagation characteristics of red sandstone with double fissures, a rectangular numerical model measuring 80 mm × 160 mm was constructed, incorporating two pre-fabricated fissures. The inclination angle of the fissures was set at α = 45°, the fissure length at 2a = 16 mm, the fissure width at d = 2.5 mm, the rock bridge length at 2b = 22 mm, and the rock bridge inclination angle at β = 90°, as shown in Figure 1. The model consisted of particles with a minimum radius of 0.3 mm and a particle size ratio (maximum/minimum) of 1.5, resulting in the generation of 26,298 circular particles, 52,116 bonds, and 68,283 contacts. The micromechanical parameters of the red sandstone numerical model were set according to the parameters provided by Yang et al. (2014), as detailed in Table 1.
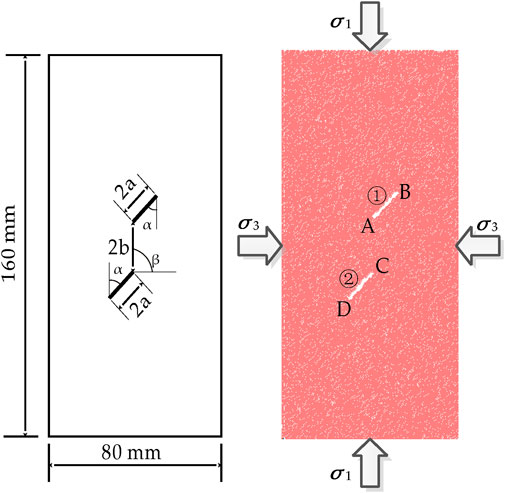
Figure 1. Numerical model and parameters.
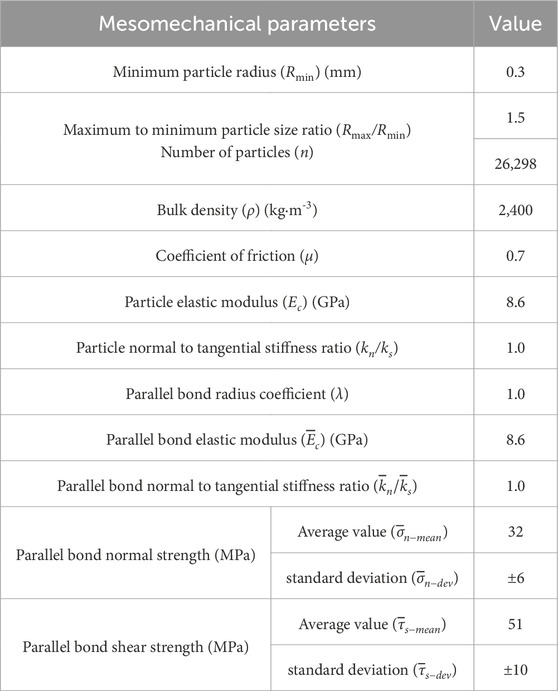
Table 1. Mesomechanical parameters of the numerical specimens (Yang et al., 2014).
In particle flow simulations, the interaction between bonded particles is typically modeled using either a contact bond model or a parallel bond model. The parallel bond model is mechanically more complex than the contact bond model is, enabling the simulation of more refined contact behaviors and fissure mechanisms. It is better suited for representing the bonding characteristics of actual rock materials, whereas the contact bond model is more appropriate for simpler contact mechanics analyses (Lee and Jeon, 2011; Zhu and Yu, 2020). Therefore, to investigate the crack propagation characteristics of red sandstone with double fissures, this study adopted the parallel bond model as the interaction model between particles, as illustrated in Figure 2.
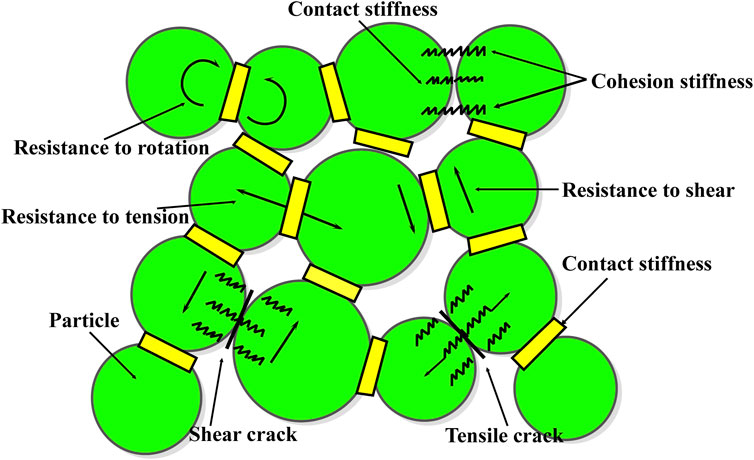
Figure 2. Parallel bond model (Cho et al., 2007).
2.2 Loading and analysis scheme
For the numerical simulations, a combination of servo-controlled loading and strain control was employed. Specifically, during the entire compression test, axial stress was applied to the upper and lower axial loading plates at a constant loading rate, whereas the lateral loading plates maintained a constant confining pressure through a servo control mechanism. The test was terminated when the axial stress of the specimen decreased to 80% of its peak stress.
Microcrack propagation is driven by changes in internal stress within the specimen. To investigate the microcrack propagation process under different stress levels, five key stress stages were selected for analysis: 60% of pre-peak stress, 80% of pre-peak stress, peak stress, 90% of post-peak stress, and 80% of post-peak stress. At these stress stages, the distribution characteristics of interparticle contact forces and parallel bond forces were dynamically tracked, recorded, and analyzed to explore the micromechanical mechanisms governing crack propagation.
2.3 Verification of micromechanical parameters
To validate the rationality of the micromechanical parameters listed in Table 1, uniaxial compression tests were conducted on physical specimens of sandstone with double fissures using an MTS815.02 testing machine. Simultaneously, corresponding compression simulations were performed on numerical specimens. The stress-strain curves for both the physical and numerical specimens are presented in Figure 3, whereas their uniaxial compressive strength (UCS) and elastic modulus values are detailed in Table 2.
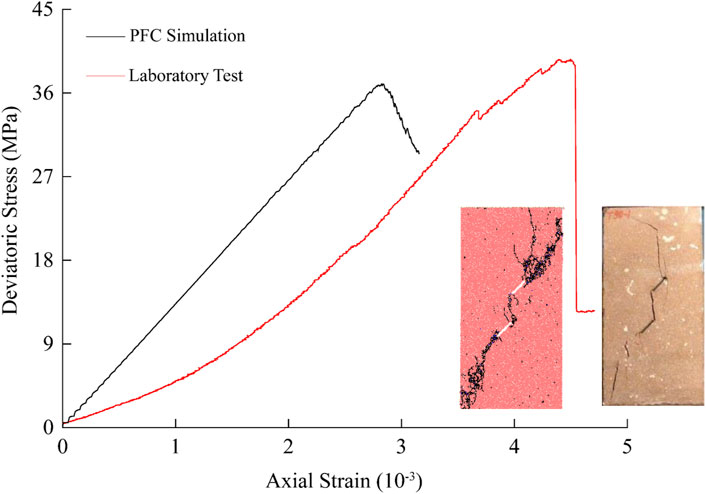
Figure 3. Comparison of stress-strain curves and fracture modes.

Table 2. Macromechanical parameters of rock.
As shown in Figure 3, the failure patterns of the numerical and physical rock specimens were highly consistent. Both specimens exhibited tensile splitting failure in the upper portion, with the rock bridge showing tensile coalescence. Additionally, the failure surface inclinations in the lower part of the specimens were nearly identical. These observations indicated that the selected micromechanical parameters not only effectively captured the strength and deformation characteristics of the actual rock specimens but also accurately reproduced their fracture patterns, further validating the rationality of the micromechanical parameter selection.
Although the stress-strain curve from the numerical simulation did not perfectly match that of the physical specimen (Figure 3), the compressive strength and elastic modulus of the numerical specimen were closely aligned with those of the physical specimen (Table 2), demonstrating that the numerical model effectively represented the actual mechanical properties of the rock. The numerical specimen exhibited a lower strain than did the physical specimen, primarily because of the compaction stage in the numerical modeling process. In contrast, the physical specimen underwent a pore closure stage during loading, resulting in differences in the initial deformation characteristics.
3 Results
3.1 Microcrack propagation characteristics
Figure 4 shows the microcrack distribution characteristics of the double-fissure red sandstone under different the confining pressures. In the figure, red represents tensile microcracks, black represents shear microcracks, and green represents pre-fabricated fissures. As shown in Figure 4, the number of microcracks gradually increased with loading. The dominant crack type was tensile microcracks, which were mainly concentrated near the failure surface, whereas shear microcracks were more sparsely distributed.
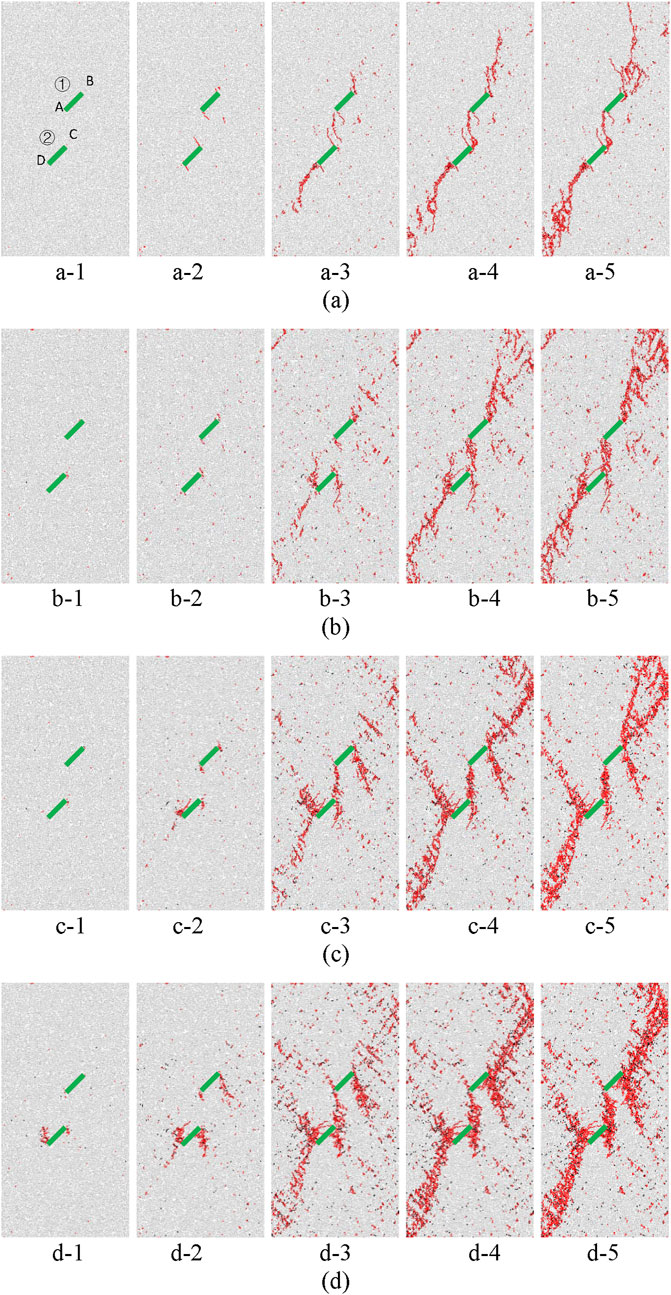
Figure 4. Crack distribution in red sandstone with double fissures under different confining pressures and deviatoric stresses. The subfigure labels (a–d) represent different confining pressure conditions, whereas secondary subfigure labels a-1, a-2, …, a-5, b-1, …, d-5 represent the pre-peak deviatoric stress values (e.g., a-1–a-3) and post-peak deviatoric stress values (e.g., a-4–a-5) under the corresponding confining pressure conditions. For specific values, please refer to Table 3.
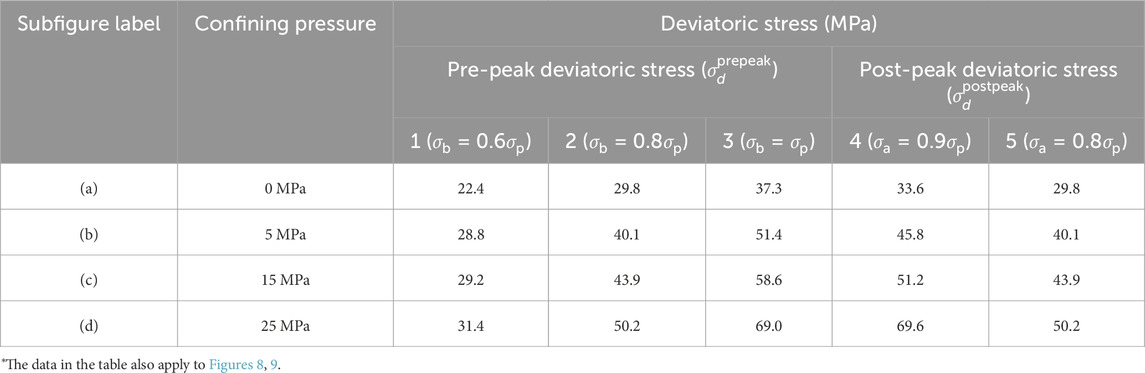
Table 3. Values of confining pressure for the subfigure labels and deviatoric stress for the secondary subfigure labels in Figure 4.
3.1.1 Unconfined condition
Under unconfined conditions (σ3 = 0 MPa), when the specimen reached the pre-peak stress σb = 0.6σp (i.e., deviatoric stress σdev = 22.4 MPa) (Figure 4a–1), only five tensile microcracks initiated inside the specimen. As the load increased, shear microcracks began to appear, whereas the number of tensile microcracks significantly increased to 66 (σb = 0.8σp, Figure 4a–2). These microcracks were primarily concentrated at the tips of pre-fabricated fissures ① and ②, forming wing cracks, which propagated perpendicularly to the fissure inclination angle.
During loading to peak strength (Figure 4a–3), the wing crack at point B of pre-fabricated fissure ① changed direction and propagated upward along the maximum principal stress (σ1) direction. Moreover, numerous tensile microcracks parallel to σ1 emerged at the rock bridge, and at point D of pre-fabricated fissure ②, many microcracks formed along the fissure inclination direction, eventually leading to macroscopic secondary cracks. Notably, wing crack propagation was suppressed at points A, C, and D.
During the post-peak stage, microcracks continued to propagate within the specimen. When the post-peak stress σa = 0.9σp (σdev = 33.2 MPa) (Figure 4a–4), the number of tensile microcracks increased to 1,001, whereas the number of shear microcracks increased to 30, with shear microcracks primarily distributed near the rock bridge and point D. The wing crack at point B continued to extend upward along the maximum principal stress direction, whereas the secondary crack at point A propagated downward to point C, resulting in tensile coalescence of the rock bridge. At point D, the secondary crack deflected and formed a concentrated tensile microcrack zone in the lower-left corner of the specimen. When the post-peak stress further decreased to σa = 0.8σp (σdev = 29.5 MPa) (Figure 4a–5), the wing crack at point B extended to the top of the specimen, and the microcrack at point D propagated to the lower-left bottom, resulting in complete coalescence of the secondary cracks in the specimen.
3.1.2 Confining pressure of 5 MPa
When the confining pressure increased to σ3 = 5 MPa, in the early loading stage of the pre-peak phase, microcracks were randomly distributed within the specimen (Figure 4b–1). As the load increased, the number of microcracks gradually increased. When the pre-peak stress σb = 0.8σp (Figure 4b–2), tensile microcracks concentrated at the tips of pre-fabricated fissures, forming wing cracks perpendicular to the fissure inclination angle. However, compared with the unconfined case, the wing crack propagation length was significantly shorter.
At peak strength (Figure 4b–3), secondary cracks developed at the outer tips of pre-fabricated fissures ① and ② (points B and D) and propagated parallel to the fissure inclination angle. Simultaneously, reverse wing cracks appeared at points C and D, propagating in a direction parallel to the maximum principal stress.
In the post-peak stage, when the post-peak stress σa = 0.9σp (Figure 4b–4), the secondary crack at point B connected with the upper secondary cracks and extended towards the top of the specimen, while the secondary crack at point A extended downward to point C, leading to tensile coalescence of the rock bridge. At point D, the secondary crack propagated along the fissure inclination direction towards the lower-left side of the specimen, forming the primary failure surface beneath fissure ②. After the full coalescence at these locations, the reverse wing cracks at points C and D ceased further propagation. Moreover, the number of shear microcracks increased significantly in the crack coalescence region, although tensile microcracks remained dominant.
When the post-peak stress decreased further to σa = 0.8σp (Figure 4b–5), the secondary crack at point B extended to the top of the specimen. Since the rock bridge and the lower portion of fissure ② had coalesced, the secondary cracks in the specimen almost fully coalesced. The primary failure surface above pre-fabricated fissure ① formed an angle of approximately 70° with respect to the horizontal plane, whereas the primary failure surface below fissure ② was parallel to the fissure direction.
3.1.3 Influence of increasing the confining pressure
As the confining pressure increased, reverse wing cracks progressively formed at the fissure tips in the pre-peak stage. When the confining pressure (σ3) reached 15 MPa, reverse wing cracks began to appear in the pre-peak stage. Furthermore, with increasing confining pressure, reverse wing cracks occurred earlier, i.e., a decreasing pre-peak load ratio (the ratio of pre-peak load to the peak load). For example, at σ3 = 15 MPa, the pre-peak load ratio at which reverse wing cracks appeared was 0.8 (Figure 4c–2), whereas at σ3 = 25 MPa, this ratio decreased to 0.6 (Figure 4d–1). The primary failure surfaces of pre-fabricated fissures ① and ② were approximately parallel to the fissure inclination angle, forming an angle of approximately 45° with respect to the horizontal plane.
Additionally, as the confining pressure increased, the reverse wing cracks at points B, C, and D widened. With further loading, the reverse wing cracks at points B and D continued to propagate, showing a tendency to evolve into reverse shear secondary cracks. These cracks eventually connected with pre-fabricated fissures ① and ② at points B and D, forming two secondary crack bands in a near-conjugate relationship (Figures 4c–5,d–5). Moreover, after the formation of the primary failure surface, the reverse wing crack at point C exhibited a significantly reduced propagation rate and nearly ceased expansion after reaching peak load.
3.2 Variation in microcrack number
Figure 5 presents the number of microcracks at the peak strength point under different confining pressures. The total number of microcracks increased with increasing confining pressure, with tensile microcracks significantly outnumbering shear microcracks. The number of tensile cracks increased stepwise with increasing confining pressure. Within the confining pressure intervals of 5–10 MPa and 15–20 MPa, the rate of change in tensile microcrack number is approximately six cracks/MPa and 27 cracks/MPa, respectively, indicating a relatively moderate increase. In contrast, within the intervals of 0–5 MPa, 10–15 MPa, and 20–25 MPa, the rate of change increases significantly, with similar values across these three ranges. The average rate of change in tensile microcracks within these intervals is approximately 138 cracks/MPa. For shear microcracks, the rate of change gradually increases with confining pressure, rising from 16 cracks/MPa in the 0–5 MPa interval to 58 cracks/MPa in the 20–25 MPa interval. Overall, the total number of microcracks exhibits higher rates of change in the intervals of 0–5 MPa, 10–15 MPa, and 20–25 MPa, showing a clear upward trend with increasing confining pressure, ranging from 156 cracks/MPa in the 0–5 MPa interval to 186 cracks/MPa in the 20–25 MPa interval.

Figure 5. Number of microcracks at peak strength under different confining pressures.
Figure 6 shows the relationship between the number of microcracks and the stress-strain curve under a confining pressure of 15 MPa. In the initial loading stage, almost no microcracks are observed within the specimen. Microcrack initiation begins only around point a (σb = 0.6σp). As the load continues to increase, the rate of change in the number of microcracks gradually rises until reaching point e (σa = 0.9σp). Specifically, prior to the peak stress, the rate of change in total microcrack number with respect to strain increases from 4,262 cracks per 1% strain during the linear elastic stage (ab segment) to 14,763 cracks per 1% strain during the yield stage (cd segment). Upon reaching the peak stress, the rate reaches its maximum: during the de segment, the rate of change in total microcrack number is 44,018 cracks per 1% strain. However, after point e, this rate decreases to 30,786 cracks per 1% strain.
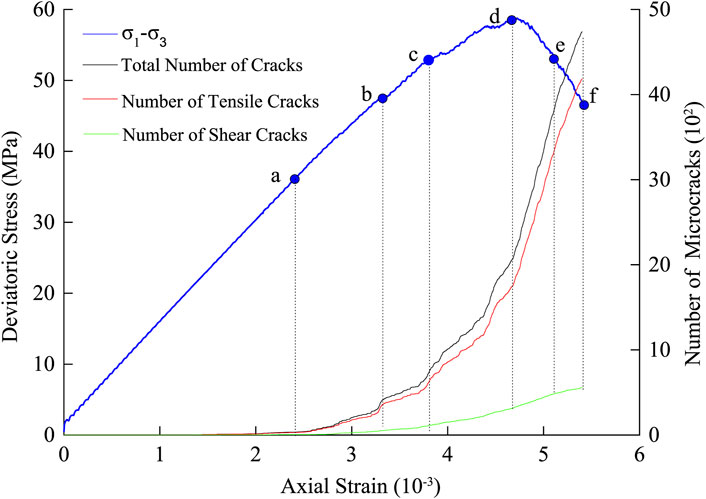
Figure 6. Relationship between the number of microcracks and the stress-strain curve (confining pressure of 15 MPa).
When the load reached point b (σb = 0.8σp), the number of microcracks inside the specimen began to increase rapidly, while the number of shear microcracks also started to grow steadily. As loading progressed to point c (σb = 0.9σp), the growth rate of microcracks further accelerated, and the specimen transitioned into the nonlinear elastic stage during the b–c phase. At the peak stress point d, the crack propagation rate reached its maximum, accompanied by the most intense crack expansion. During the c–d phase, the specimen entered the yielding stage, and slight fluctuations appeared in the stress-strain curve. After passing peak point d, the crack propagation rate continued to rise. However, after reaching point e, although the number of microcracks continued to increase, its growth rate started to decline.
The relationships between the MSTR and both confining pressure and peak strength are shown in Figure 7. As illustrated, the MSTR increases linearly with both parameters but consistently remains well below 1. Specifically, at a confining pressure of 0 MPa, the MSTR is 0.023, rising to 0.304 at 25 MPa. Fitting results show that the slopes of the MSTR with respect to confining pressure and peak strength are 0.01106/MPa and 0.005/MPa, respectively, indicating that confining pressure has a more pronounced effect on the generation of shear microcracks. Nevertheless, the number of shear microcracks remains significantly lower than that of tensile microcracks throughout.
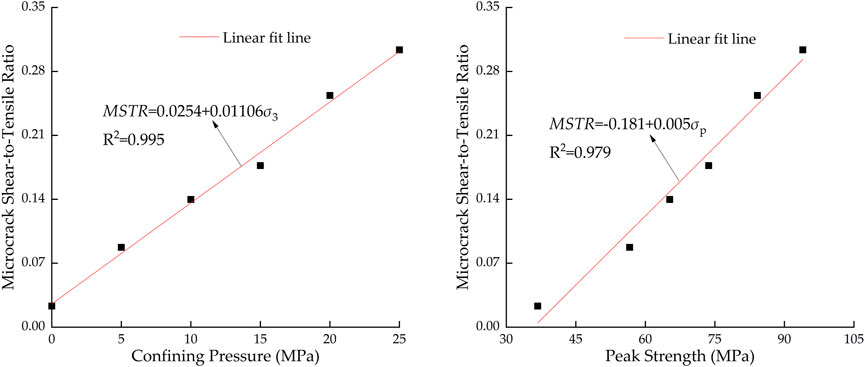
Figure 7. Relationships between shear-to-tensile ratio, confining pressure, and peak strength.
3.3 Distribution and evolution of interparticle contact forces
Figure 8 shows the distribution of interparticle contact forces within double-fissure red sandstone under different confining pressures. In the figure, black represents compressive stress, red represents tensile stress, and green represents pre-fabricated fissures. Throughout the entire experiment, the contact forces between the particles were predominantly compressive.
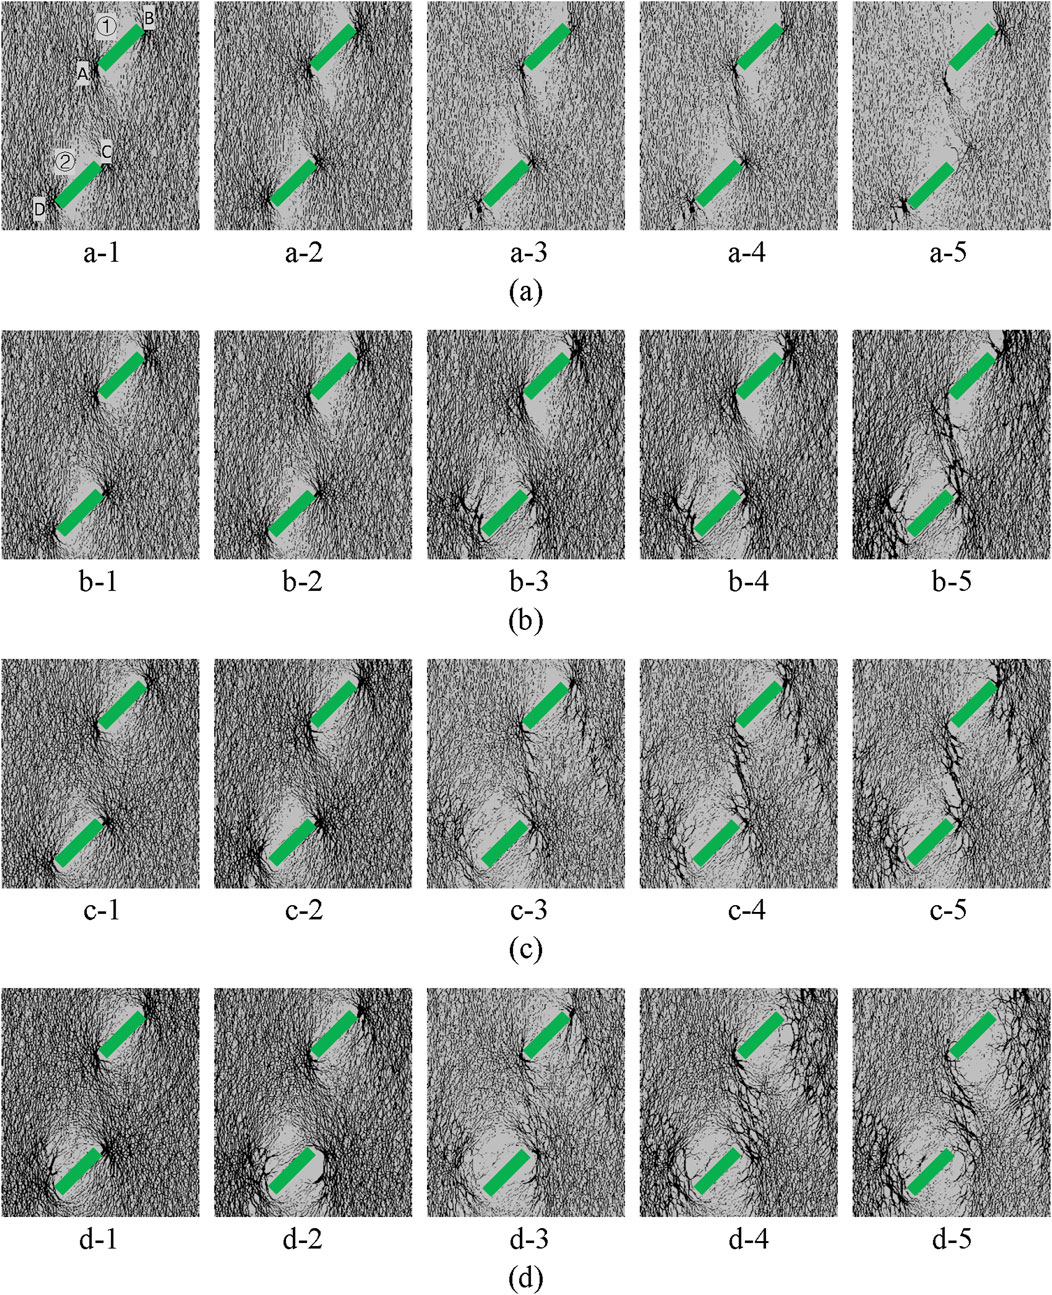
Figure 8. Distribution of contact forces in red sandstone with double fissures under different confining pressures and deviatoric stresses. The subfigure labels (a–d) represent different confining pressure conditions, whereas secondary subfigure labels a-1, a-2, …, a-5, b-1, …, d-5 represent the pre-peak deviatoric stress values (e.g., a-1–a-3) and post-peak deviatoric stress values (e.g., a-4–a-5) under the corresponding confining pressure conditions. For specific values, please refer to Table 3.
At a given confining pressure level, during the pre-peak stage when the applied load was relatively low (e.g., σb = 0.6σp), a contact force concentration zone formed at the fissure tips, whereas the contact forces in the rest of the specimen were relatively uniformly distributed. As the load increased, the contact force concentration zone gradually shifted away from the fissure tips, and the maximum contact force progressively increased. During the post-peak stage, the contact force chains in the rock bridge region became increasingly sparse, and the maximum contact force first increased but then decreased. For example, under σ3 = 0 MPa, when σb = 0.6σp, the maximum contact force was 42.6 kN. At the peak strength, the maximum contact force increased to 98.7 kN. During the post-peak stage, the maximum contact force initially increased to 110 kN (σa = 0.9σp) and subsequently decreased to 99.7 kN (σa = 0.8σp).
In the initial loading stage, the contact force chains near the rock bridge are uniformly distributed. As the load increases toward the peak strength, these force chains begin to concentrate along the line connecting the tips of the rock bridge cracks, while becoming sparser in the surrounding areas. After the peak load, particularly when the post-peak strength drops to 0.8 times the peak value, contact force chains in parts of the rock bridge region disappear, resulting in a more scattered and banded distribution. However, with increasing confining pressure, the contact force chains within the specimen become progressively denser under the same pre-peak load ratio, and the direction of contact forces on both sides of the fissures gradually shifts from vertical to align with the inclination of the pre-fabricated fissures.
3.4 Distribution and evolution of parallel bond forces
Figure 9 shows the distribution of parallel bond forces within double-fissure red sandstone under different confining pressures, where black represents compressive stress, red represents tensile stress, and green represents pre-fabricated fissures.
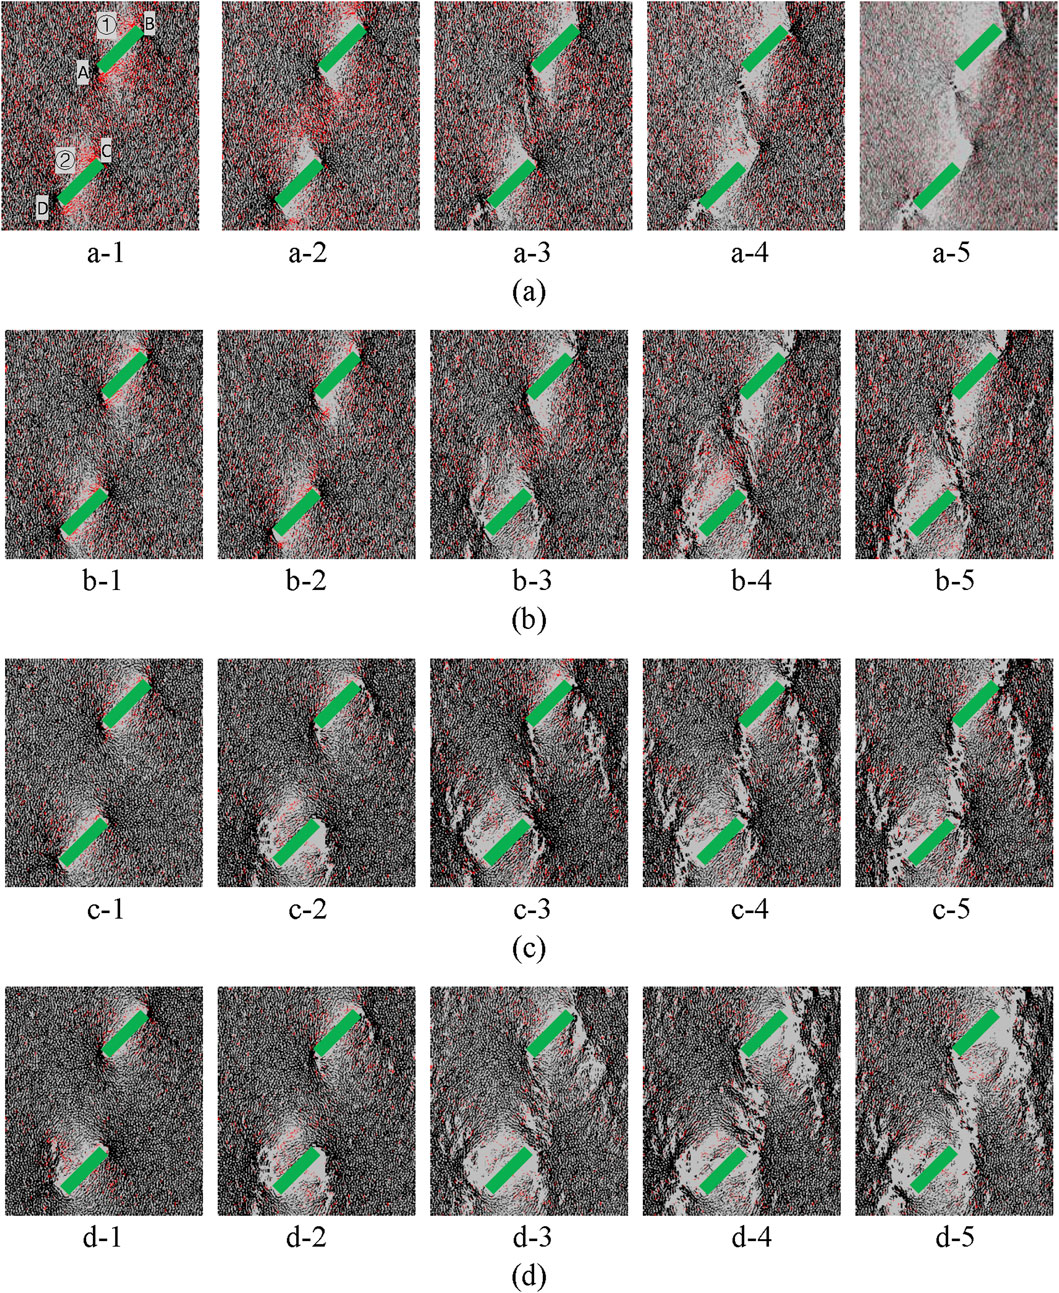
Figure 9. Distribution of parallel bond strengths in red sandstone with double fissures under different confining pressures and deviatoric stresses. The subfigure labels (a–d) represent different confining pressure conditions, whereas secondary subfigure labels a-1, a-2, …, a-5, b-1, …, d-5 represent the pre-peak deviatoric stress values (e.g., a-1–a-3) and post-peak deviatoric stress values (e.g., a-4–a-5) under the corresponding confining pressure conditions. For specific values, please refer to Table 3.
As shown in Figure 9, when σb = 0.6σp, the parallel bond compressive stress was concentrated at the fissure tips, whereas the parallel bond tensile stress was primarily distributed on both sides of the pre-fabricated fissures. As the load increases to σb = 0.8σp, the tensile stress regions on both sides of the fissures extended upward and downward, whereas tensile stress concentration began to appear in the rock bridge region.
At peak strength, the compressive stress concentration at the fissure tips decreased, whereas the compressive stress in the rock bridge region intensified. As loading continued in the post-peak stage, the density of both parallel bond compressive and tensile stress distributions gradually decreased, indicating a continuous attenuation of parallel bond forces in the post-peak phase.
With increasing confining pressure, the parallel bond compressive stress remained primarily concentrated at the fissure tips, suggesting that the location of the compressive stress concentration zone was independent of the confining pressure. As the confining pressure increased, the rock bridge region was predominantly subjected to parallel bond compressive stress, whereas the area of parallel bond tensile stress concentration gradually diminished.
4 Discussion
4.1 Microcrack propagation path and failure mechanism
The crack propagation characteristics under different confining pressures indicate that the crack propagation process is closely related to the confining pressure. The confining pressure suppresses the propagation of wing cracks at the fissure tips while promoting the initiation and propagation of reverse wing cracks. Under high confining pressure, this process eventually leads to the formation of a reverse shear plane. This finding is consistent with the studies of Yavari et al. (2021), Wang J. et al. (2021), and Wu et al. (2024) on materials such as concrete, further validating the influence of confining pressure on crack propagation.
The underlying mechanism is that, compared with unconfined conditions (uniaxial compression), a low confining pressure imposes an additional lateral constraint, reducing the tensile stress at the fissure tips and thereby inhibiting wing crack propagation. Consequently, under a low confining pressure, the development of wing cracks is significantly suppressed. However, at higher confining pressures, the tensile stress at the fissure tips is further inhibited (see Figure 9), leading to a shift in the crack propagation mode and the formation of reverse wing cracks.
Furthermore, as the confining pressure increases (see Figure 9), the overall failure mode of the specimen gradually transitions from tensile splitting failure to shear failure. The inclination angle of the primary failure surface on the right side of crack ① progressively changes from 90° to align with the pre-fabricated crack inclination angle (45°). This observation aligns with the findings of Li and Ghassemi (2021) and Du et al. (2021), further confirming the effect of confining pressure on failure modes. Specifically, under confining pressure, as the applied load increases, the local tensile stress exceeds the local tensile strength, leading to the formation of tensile cracks. With the accumulation and coalescence of these tensile cracks, a failure surface extending in the shear direction eventually develops. Notably, although the failure mode under confining pressure appears to be shear failure, the formation of the failure surface is primarily governed by the expansion and coalescence of tensile microcracks.
4.2 Growth in the number of microcracks
The variation trend in the number of microcracks with confining pressure (Figure 5) shows that tensile microcracks follow a stepwise increase as the confining pressure increases, indicating that 0 MPa, 10 MPa, and 20 MPa are critical confining pressures at which the number of tensile cracks surges. In the 0–5 MPa, 10–15 MPa, and 20–25 MPa ranges, the growth rate of tensile microcracks is relatively high and remains similar across these intervals. In contrast, the growth rate of shear microcracks gradually increases with increasing confining pressure, leading to an overall increase in the growth rate of total microcracks at the critical confining pressure thresholds. This finding aligns with the results of Wang Z. et al. (2024) in their study on the effect of confining pressure on crack quantity in marble specimens, further confirming the role of confining pressure in the crack propagation mechanism.
The relationship between the microcrack quantity and the stress-strain curve (Figure 6) indicates that in the early to mid-stage of the linear elastic phase (with a pre-peak load ratio of approximately 0.6, point a in Figure 6), the number of microcracks inside the specimen remains relatively low. However, in the late linear elastic phase and continuing until the post-peak load ratio reaches 0.9 (point e in Figure 6), the number of tensile microcracks exhibits an approximately exponential increase, whereas the number of shear microcracks also show nonlinear growth, with an accelerating growth rate. This phenomenon can be attributed to the stress concentration effect at the tips of pre-fabricated fissures. Before point a, the parallel bond strength between particles is lower than the interparticle contact force, resulting in limited microcrack initiation. However, as the load increases, once the parallel bond strength reaches or exceeds the interparticle contact force, microcracks begin to form. The increasing stress concentration near newly formed microcracks further accelerates the generation of additional microcracks.
However, when the post-peak load ratio decreases to less than 0.9, the number of both tensile and shear microcracks continues to increase, but the growth rate decreases. We speculate that this may be due to the coalescence of secondary cracks into a fully developed failure surface in the post-peak stage. At this stage, deformation is primarily concentrated along the failure surface, and the reduction in post-peak strength limits the formation of new microcracks, thereby slowing their growth rate.
The analysis of the MSTR as a function of the confining pressure and peak strength (Figure 7) reveals that the MSTR is positively correlated with both parameters, indicating that shear microcracks are more sensitive to the confining pressure than tensile microcracks are. This finding is consistent with the studies of Zhang et al. (2021) and Yu and Duan (2021) on crack propagation in coal specimens. However, although the MSTR increases with increasing confining pressure and peak strength, and shear microcracks exhibit higher sensitivity to the confining pressure, the MSTR value remains below 0.35, indicating that the number of shear microcracks is significantly lower than that of tensile microcracks. While the overall failure mode of the specimen appears to be shear failure, its fundamental cause is still the coalescence of tensile microcracks.
4.3 Influence of particle interaction forces on crack propagation
The distribution of contact forces indicates that when the pre-peak load ratio is relatively low (e.g., σb/σp = 0.6), the contact force is primarily concentrated at the tips of the double fissures, suggesting that microcracks initiate at the fissure tips. As the pre-peak load ratio increases to 0.8, the overall contact force increases, and the concentration zone gradually shifts away from the fissure tips. This shift leads to the formation of wing cracks (Figures 4a–2,b–2) and reverse wing cracks (Figure 4c–2), while also promoting the further expansion of reverse wing cracks (Figure 4d–2). When the pre-peak load ratio reaches 1 (i.e., at peak strength), the contact force chains in the rock bridge region gradually become sparse, indicating a reduction in compression between particles. This reduction facilitates the progressive propagation, coalescence, and eventual linkage of secondary cracks in the rock bridge region.
These findings further confirm that the redistribution of contact forces is a driving mechanism for crack propagation. Specifically, the shift in the concentration zone of contact forces (caused by increased loading), the intensified concentration of compressive stress, and the deflection in the contact force direction (caused by increased confining pressure) are the key factors promoting the initiation, propagation, and coalescence of microcracks.
The distribution of parallel bond forces reveals that as the load increases, the parallel bond tensile stress on both sides of the fissures transfers toward the rock bridge region, where the tensile stress reaches its maximum. This suggests that the rock bridge region is the primary zone for the initiation of tensile microcracks. However, a compressive stress concentration zone remains at the fissure tips (Figure 9), indicating that the fissure tips still experience significant compressive stress.
Figures 8, 9 show that the formation of wing cracks at the fissure tips is primarily due to the concentration of compressive stress, leading to the fracture of parallel bonds. In contrast, both the wing cracks and reverse wing cracks in Figure 4 mainly consist of tensile microcracks, indicating that parallel bond failure is predominantly tensile in nature. This phenomenon can be explained by the compression-induced tensile effect, whose fundamental mechanism is illustrated in Figure 10. Similar conclusions have been reported by Zheng et al. (2020) and Suknev (2011) in their studies on rock and rock-like materials, further supporting this interpretation.
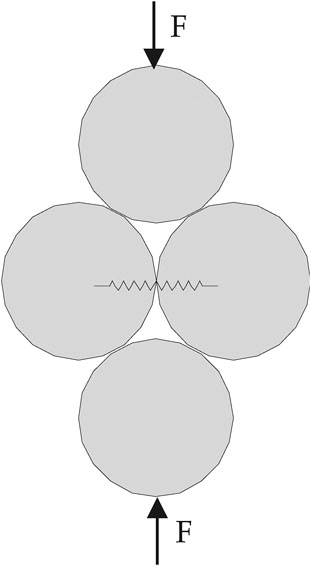
Figure 10. Physical and mechanical mechanisms of compression-induced tensile failure (Potyondy and Cundall, 2004).
Additionally, the density of parallel bond forces gradually decreases in the post-peak stage as loading continues. This may be attributed to the progressive coalescence of microcracks, forming macro-scale secondary cracks, coupled with a decrease in specimen strength. This redistribution of stress ultimately leads to the overall attenuation of parallel bond forces.
5 Conclusion
In this study, the PFC2D program was used to simulate the crack propagation process in pre-fissured red sandstone with double fissures under different confining pressures. The microscopic mechanical mechanisms of crack propagation were investigated, leading to the following conclusions:
(1) The crack propagation process within the specimen is closely related to the confining pressure. With increasing confining pressure, reverse wing cracks tend to form at the fissure tips, and under high confining pressure, reverse shear planes develop. The coalescence of the rock bridge is primarily caused by the concentration of tensile microcracks, and the coalescence mode remains tensile failure, independent of the confining pressure. As the confining pressure increases, the failure mode of the specimen gradually transitions from tensile splitting failure to shear failure. Moreover, the inclination angle of the primary failure surface on the right side gradually tends to shift from 90° to 45°, aligning with the fissure inclination. However, despite the macroscopic manifestation of shear failure, its fundamental mechanism is still the coalescence of tensile microcracks.
(2) Crack propagation is most intense near the peak strength, and the number of tensile microcracks increases stepwise with increasing confining pressure at the peak strength. At critical confining pressures (0 MPa, 10 MPa, and 20 MPa), the growth rate of tensile cracks undergoes a sudden change. Additionally, shear microcracks are more sensitive to the confining pressure, as the presence of confining pressure facilitates their initiation. However, the number of shear microcracks remains significantly lower than that of tensile microcracks.
(3) The compression-induced tensile effect at the fissure tips and the redistribution of contact forces are the primary driving mechanisms for crack propagation. The distribution of parallel bond forces is strongly consistent with the distribution of cracks. The location of the parallel bond compressive stress concentration zone is independent of the confining pressure and is consistently observed at the fissure tips, where the compression-induced tensile effect promotes the initiation of tensile microcracks. As the confining pressure increases, the degree of compressive stress concentration intensifies, and the direction of the contact forces gradually shifts from vertical to horizontal, further facilitating the initiation, propagation, and coalescence of microcracks. With the coalescence of the rock bridge region, the transmission path of interparticle contact forces is obstructed. Moreover, the compressive stress concentration zones within the rock bridge region exhibit a banded pattern.
Data availability statement
The original contributions presented in the study are included in the article/supplementary material, further inquiries can be directed to the corresponding author.
Author contributions
WZ: Funding acquisition, Writing – original draft, Formal Analysis, Visualization, Conceptualization, Project administration, Writing – review and editing. XL: Formal Analysis, Data curation, Resources, Methodology, Software, Writing – original draft, Investigation. WH: Supervision, Investigation, Writing – review and editing, Data curation.
Funding
The author(s) declare that financial support was received for the research and/or publication of this article. This work was supported by Neijiang Normal University (2024ZDZ03) and Neijiang Science and Technology Incubating Project (2024NJJCYJNJSY022).
Conflict of interest
The authors declare that the research was conducted in the absence of any commercial or financial relationships that could be construed as a potential conflict of interest.
Generative AI statement
The author(s) declare that no Generative AI was used in the creation of this manuscript.
Publisher’s note
All claims expressed in this article are solely those of the authors and do not necessarily represent those of their affiliated organizations, or those of the publisher, the editors and the reviewers. Any product that may be evaluated in this article, or claim that may be made by its manufacturer, is not guaranteed or endorsed by the publisher.
References
Abharian, S., Sarfarazi, V., Marji, M. F., and Rasekh, H. (2022). Experimental and numerical evaluation of the effects of interaction between multiple small holes and a single notch on the mechanical behavior of artificial gypsum specimens. Theor. Appl. Fract. Mech. 121, 103462. doi:10.1016/j.tafmec.2022.103462
Bahri, M., Romero-Hernández, R., Mascort-Albea, E. J., Soriano-Cuesta, C., and Jaramillo-Morilla, A. (2025). Predicting maximum surface displacement from mechanized twin tunnel excavation in seville using machine learning and FLAC3D simulation. Geotech. Geol. Eng. 43, 70. doi:10.1007/s10706-024-02969-0
Cho, N., Martin, C. D., and Sego, D. C. (2007). A clumped particle model for rock. Int. J. Rock Mech. Min. Sci. 44, 997–1010. doi:10.1016/j.ijrmms.2007.02.002
Du, H., Dai, F., Wei, M., Li, A., and Yan, Z. (2021). Dynamic compression–shear response and failure criterion of rocks with hydrostatic confining pressure: an experimental investigation. Rock Mech. Rock Eng. 54, 955–971. doi:10.1007/s00603-020-02302-0
Duan, K., Jiang, R., Li, X., Wang, L., and Yang, Z. (2023). Examining the influence of the loading path on the cracking characteristics of a pre-fractured rock specimen with discrete element method simulation. J. Zhejiang Univ.-Sci. A 24, 332–349. doi:10.1631/jzus.A2200235
Gong, X., Zhao, C., Chen, H., Zhang, G., Zhang, B., and Xing, J. (2025). Crack evolution and mechanical behavior of granite with topological flaws under uniaxial compression. Geotech. Geol. Eng. 43, 19. doi:10.1007/s10706-024-02981-4
Haeri, H., Sarfarazi, V., and Fatehi Marji, M. (2022). Static and dynamic response of rock engineering models. Iran. J. Sci. Technol. Trans. Civ. Eng. 46, 327–341. doi:10.1007/s40996-020-00564-w
He, S., Tan, W., Li, H., Wang, Y., Niu, P., and Qin, Q. (2025). Mineralogical and lithofacies controls on gas storage mechanisms in organic-rich marine shales. Energy Fuels 39, 3846–3858. doi:10.1021/acs.energyfuels.4c05685
Huang, Y.-H., Yang, S.-Q., Li, W.-P., and Hall, M. R. (2020). Influence of super-critical CO2 on the strength and fracture behavior of brine-saturated sandstone specimens. Rock Mech. Rock Eng. 53, 653–670. doi:10.1007/s00603-019-01933-2
Ko, B. H., Moallemi, S., Dang, H. K., and Yacoub, T. (2024). “A comprehensive comparison between discrete fracture network and generalized anisotropic material behavior for modeling jointed rock mass,” in 58th U.S. Rock mechanics/geomechanics symposium, (golden, Colorado, USA: ARMA). doi:10.56952/ARMA-2024-0085
Lee, H., and Jeon, S. (2011). An experimental and numerical study of fracture coalescence in pre-cracked specimens under uniaxial compression. Int. J. Solids Struct. 48, 979–999. doi:10.1016/j.ijsolstr.2010.12.001
Li, H., Duan, H., Qin, Q., Zhao, T., Fan, C., and Luo, J. (2025a). Characteristics and distribution of tectonic fracture networks in low permeability conglomerate reservoirs. Sci. Rep. 15, 5914. doi:10.1038/s41598-025-90458-6
Li, H., He, S., Radwan, A. E., Xie, J., and Qin, Q. (2024a). Quantitative analysis of pore complexity in lacustrine organic-rich shale and comparison to marine shale: insights from experimental tests and fractal theory. Energy Fuels 38, 16171–16188. doi:10.1021/acs.energyfuels.4c03095
Li, J., Li, H., Jiang, W., Cai, M., He, J., Wang, Q., et al. (2024b). Shale pore characteristics and their impact on the gas-bearing properties of the longmaxi formation in the luzhou area. Sci. Rep. 14, 16896. doi:10.1038/s41598-024-66759-7
Li, J., Wei, J., Yuan, G., and Shi, Y. (2024c). Study on the influence mechanism of porosity on the mechanical properties, deformation and failure characteristics of coal samples. J. Min. Strata Control Eng. 6, 67–80. doi:10.13532/j.jmsce.cn10-1638/td.20240519.001
Li, J., Zhang, Q., Jiang, W., Li, H., Li, L., Xue, T., et al. (2025b). Lithological controls on pore structure and their implications for deep shale gas reservoir quality in the Longmaxi formation, Luzhou area, southern Sichuan basin, China. Energy Fuels 39, 1541–1558. doi:10.1021/acs.energyfuels.4c05247
Li, Y., and Ghassemi, A. (2021). Rock failure envelope and behavior using the confined Brazilian test. J. Geophys. Res. Solid Earth 126, e2021JB022471. doi:10.1029/2021JB022471
Liang, X., Liu, Z., Peng, K., Wang, H., Zhang, S., and Yuan, C. (2025). Failure prediction of fissured rock under freeze-thaw cycles based on critical slowing down theory of acoustic emission multi-parameter. Results Eng. 25, 103874. doi:10.1016/j.rineng.2024.103874
Liu, B., Zhou, Y., Gao, Y.-T., and Xu, C. (2020). Experimental and numerical study on crack development characteristics between two cavities in rock-like material under uniaxial compression. Theor. Appl. Fract. Mech. 109, 102755. doi:10.1016/j.tafmec.2020.102755
Pan, W., Wang, X., Liu, Q., Yuan, Y., and Zuo, B. (2019). Non-parallel double-crack propagation in rock-like materials under uniaxial compression. Int. J. Coal Sci. Technol. 6, 372–387. doi:10.1007/s40789-019-0255-4
Potyondy, D. O., and Cundall, P. A. (2004). A bonded-particle model for rock. Int. J. Rock Mech. Min. Sci. 41, 1329–1364. doi:10.1016/j.ijrmms.2004.09.011
Rajabian, A., and Vahedifard, F. (2025). Seismic stability analysis of anchored concave slopes. Transp. Geotech. 51, 101505. doi:10.1016/j.trgeo.2025.101505
Sarfarazi, V., Fu, J., Haeri, H., Tahmasebi Moez, M., and Khandelwal, M. (2024). Experimental and numerical investigation on crack propagation for a zigzag central cracked Brazilian disk. Comput. Part. Mech. 11, 2909–2922. doi:10.1007/s40571-024-00762-7
Shandilaya, S., and Roshankhah, S. (2024). “Failure mechanisms in jointed rock slopes concerning the dip angle of continuous joints,” in 58th U.S. Rock mechanics/geomechanics symposium, (golden, Colorado, USA: ARMA). doi:10.56952/ARMA-2024-0827
Suknev, S. V. (2011). Tensile fracturing in gypsum under uniform and nonuniform distributed compression. J. Min. Sci. 47, 573–579. doi:10.1134/S1062739147050054
Tang, H. (2020). Multi-scale crack propagation and damage acceleration during uniaxial compression of marble. Int. J. Rock Mech. Min. Sci. 131, 104330. doi:10.1016/j.ijrmms.2020.104330
Wang, J., Liu, W., and Shen, J. (2021a). Investigation on the fracturing permeability characteristics of cracked specimens and the formation mechanism of inrush channel from floor. Shock Vib. 2021, 8858733. doi:10.1155/2021/8858733
Wang, J., Ma, Z., Cong, Y., Yu, Q., Dong, L., and Wang, L. (2024a). Microscopic cracks identification and nonlinear creep model of shale under creep-disturbance loading. Results Eng. 24, 103314. doi:10.1016/j.rineng.2024.103314
Wang, X., Xia, Z., Li, P., and Liu, H. (2021b). Numerical study on strength and failure behavior of rock with composite defects under uniaxial compression. Energies 14, 4418. doi:10.3390/en14154418
Wang, Z., Li, S., Wang, J., Li, A., Wang, W., Feng, C., et al. (2024b). Evolution mechanism and quantitative characterization of initial micro-cracks in marble under triaxial compression. J. Zhejiang Univ.-Sci. A 25, 586–595. doi:10.1631/jzus.A2300159
Wong, L. N. Y., and Einstein, H. H. (2009). Crack coalescence in molded gypsum and carrara marble: Part 1. Macroscopic observations and interpretation. Rock Mech. Rock Eng. 42, 475–511. doi:10.1007/s00603-008-0002-4
Wu, G., Wang, W., and Peng, S. (2024). Analytical solution of the stress field and plastic zone at the tip of a closed crack. Front. Earth Sci. 12, 1370672. doi:10.3389/feart.2024.1370672
Wu, S., Hao, W., Yao, Y., and Li, D. (2023). Investigation into durability degradation and fracture of cable bolts through laboratorial tests and hydrogeochemical modelling in underground conditions. Tunn. Undergr. Space Technol. 138, 105198. doi:10.1016/j.tust.2023.105198
Xu, R., Dou, B., Zhao, Y., Peng, W., and Li, Z. (2024). Numerical investigation on the influence of secondary flaw lengths on the mechanical characteristics and cracking behaviour of red sandstone containing orthogonal cross flaws. Int. J. Numer. Anal. Methods Geomech. 48, 2592–2614. doi:10.1002/nag.3743
Yang, S.-Q. (2011). Crack coalescence behavior of brittle sandstone samples containing two coplanar fissures in the process of deformation failure. Eng. Fract. Mech. 78, 3059–3081. doi:10.1016/j.engfracmech.2011.09.002
Yang, S.-Q., Huang, Y.-H., Jing, H.-W., and Liu, X.-R. (2014). Discrete element modeling on fracture coalescence behavior of red sandstone containing two unparallel fissures under uniaxial compression. Eng. Geol. 178, 28–48. doi:10.1016/j.enggeo.2014.06.005
Yang, S.-Q., Liu, X.-R., and Jing, H.-W. (2013). Experimental investigation on fracture coalescence behavior of red sandstone containing two unparallel fissures under uniaxial compression. Int. J. Rock Mech. Min. Sci. 63, 82–92. doi:10.1016/j.ijrmms.2013.06.008
Yavari, M., Haeri, H., Sarfarazi, V., Fatehi Marji, M., and Lazemi, H. A. (2021). On propagation mechanism of cracks emanating from two neighboring holes in cubic concrete specimens under various lateral confinements. J. Min. Environ. 12. doi:10.22044/jme.2021.10834.2054
Yu, W., and Duan, H. (2021). Numerical simulation study on crack evolution characteristics of coal specimen subjected to conventional compression loading. Geotech. Geol. Eng. 39, 4983–4996. doi:10.1007/s10706-021-01807-x
Yuan, Y., Shao, Z., Qiao, R., Fei, X., and Cheng, J. (2020). Thermal response and crack propagation of mineral components in olivine basalt under microwave irradiation. Arab. J. Geosci. 13, 589. doi:10.1007/s12517-020-05494-5
Zhang, H., Wang, L., Li, J., Deng, H., and Xu, X. (2023a). Study on the mechanical properties of unloading damaged sandstone under cyclic loading and unloading. Sci. Rep. 13, 7370. doi:10.1038/s41598-023-33721-y
Zhang, H., Yang, G., Li, H., Du, W., and Wang, J. (2023b). Pixel-wise detection algorithm for crack structural reconstruction based on rock CT images. Autom. Constr. 152, 104895. doi:10.1016/j.autcon.2023.104895
Zhang, L., Ren, T., Li, X., and Tan, L. (2021). Acoustic emission, damage and cracking evolution of intact coal under compressive loads: experimental and discrete element modelling. Eng. Fract. Mech. 252, 107690. doi:10.1016/j.engfracmech.2021.107690
Zhang, Y., Shao, Z., Wei, W., and Qiao, R. (2019). PFC simulation of crack evolution and energy conversion during basalt failure process. J. Geophys. Eng. 16, 639–651. doi:10.1093/jge/gxz036
Zhao, C., Ma, C., Zhao, C., Du, S., and Bao, C. (2018). Crack propagation simulation of rock-like specimen using strain criterion. Eur. J. Environ. Civ. Eng. 22, s228–s245. doi:10.1080/19648189.2017.1359677
Zheng, B., Qi, S., Huang, X., Liang, N., and Guo, S. (2020). Compression-induced tensile mechanical behaviors of the crystalline rock under dynamic loads. Materials 13, 5107. doi:10.3390/ma13225107
Zheng, Q., Li, P., Xu, Y., Cheng, B., Hu, H., Shi, H., et al. (2025). Crack propagation and CT imaging of internal cracks in rocks damaged by pre-compression under explosive loading. Ain Shams Eng. J. 16, 103302. doi:10.1016/j.asej.2025.103302
Zhu, J., and Yu, H. (2020). Analysis of crack propagation characteristics of rock-like material with double closed cracks under uniaxial compression. Geotech. Geol. Eng. 38, 6499–6509. doi:10.1007/s10706-020-01451-x
Keywords: pre-fabricated fissure, microcrack evolution, microcrack propagation mechanism, confining pressure, contact force, parallel bond force
Citation: Zhao W, Liu X and He W (2025) Numerical study on the microcrack propagation mechanism in pre-fabricated red sandstone with double fissures under different confining pressures. Front. Earth Sci. 13:1642176. doi: 10.3389/feart.2025.1642176
Received: 06 June 2025; Accepted: 07 July 2025;
Published: 14 July 2025.
Edited by:
Hu Li, Sichuan University of Science and Engineering, ChinaReviewed by:
Shiwan Chen, Guizhou University, ChinaJianwei Li, Inner Mongolia University of Science and Technology, China
Copyright © 2025 Zhao, Liu and He. This is an open-access article distributed under the terms of the Creative Commons Attribution License (CC BY). The use, distribution or reproduction in other forums is permitted, provided the original author(s) and the copyright owner(s) are credited and that the original publication in this journal is cited, in accordance with accepted academic practice. No use, distribution or reproduction is permitted which does not comply with these terms.
*Correspondence: Weisheng Zhao, endzX2N1bXRAMTYzLmNvbQ==
†ORCID: Weisheng Zhao, orcid.org/0000-0002-9825-7503