 Xiang Yang1
 Jiabo Geng
 Xiang Lan
- 1School of Economics and Management, Jiangxi University of Science and Technology, Ganzhou, China
- 2School of Emergency Management and Safety Engineering, Jiangxi University of Science and Technology, Ganzhou, China
Mining activities may trigger hazards such as mountain subsidence. To predict the extent of mountain subsidence and analyze the evolutionary characteristics of mountain subsidence, the optical images and Small Baseline Subset InSAR (SBAS-InSAR) method were used, and the mountain subsidence was circled and interpreted. The cumulative subsidence in the area from 2024 to 2026 was predicted by combining the long short-term memory (LSTM) method, and the mountain surface subsidence slip was derived using MatDEM. The results of the study show that mountain surface subsidence begins with the formation of a primary subsidence zone, which slowly leads to the formation of primary and secondary subsidence zones. Under the influence of the penetrating channel, the primary and secondary subsidence areas merge to form a larger subsidence area. The subsidence area gradually disintegrates into several small areas during the sliding process, and the small areas underneath contribute to the main force of the subsidence movement, with a substantial slip displacement. Based on this study, it is concluded that the accuracy of the results obtained from the LSTM method is higher than that of the numerical simulation results, and the maximum cumulative subsidence is expected to reach 2,180 mm in 2026.
1 Introduction
Underground mining will result in destruction of rock formation, and this will further lead to mountain surface subsidence and collapse (Gao et al., 2022). If the mining area is located on a mountain, this will lead to mountain surface subsidence (Wang et al., 2022). In 2006, unregulated mining had resulted in a landslide of approximately 1.9 × 10⁶ m3 at the Madaling mine site in Guizhou Province, China (Zhao et al., 2016). In 2013, mining at the Australian coal mine Nattai North triggered a catastrophic slope collapse, destroying a natural water reservoir (Fathi Salmi et al., 2017). In 2023, a coal mine in the Inner Mongolia Autonomous region of China collapsed due to the activity in an underground mining area, resulting in a massive surface collapse and the loss of 53 lives (Zhang N et al., 2024).
The mechanism of mountain surface subsidence is complex and diverse, and the accuracy of subsidence prediction is difficult to assess (Du et al., 2019). There are currently two methods for studying mountain surface subsidence caused by underground mining. The first one is based on the results of Small Baseline Subset InSAR (SBAS-InSAR) and uses the long short-term memory (LSTM) method to predict mountain surface subsidence for scientific hazard prevention and control (Lin et al., 2022). Mirmazloumi et al. proposed an early alert (EA) detector toolbox that combines SBAS-InSAR data with the LSTM method and concluded that the LSTM method can provide effective early warning and monitoring of surface subsidence (Mirmazloumi et al., 2023). Li et al. constructed the LS model by integrating the InSAR results with the LSTM method through a weighting method, which can effectively predict the temporal development of mountain surface subsidence (Li et al., 2021). Chen et al. proposed a mountain subsidence prediction model by combining SBAS InSAR results with the LSTM neural network and concluded that the LSTM neural network can accurately predict the subsidence trend with a slight overall error (Chen B. et al., 2022). The second method is a combination of numerical simulation experiments and similar physical simulation experiments. Shi et al. demonstrated the reliability of the numerical simulation method in predicting mining-induced mountain surface subsidence based on multiple prediction methods (Shi et al., 2021). Cao et al., based on numerical simulation and in situ monitoring results, concluded that the mountain surface subsidence pattern of underground avalanche mining is a cyclic pattern of slow development, sudden damage, and slow development (Cao et al., 2016).
With global climate change and the impact of underground mining activities, the number of hazards such as mountain surface subsidence will increase. The prediction of mountain surface subsidence faces new challenges, and new research methods are urgently needed. Therefore, a research method combining SBAS-InSAR, LSTM, and numerical simulation was proposed. The research method is shown in Figure 1. First, based on the GF-2 optical remote sensing satellite images, the study area was circled and deciphered to get the sedimentation changes in the study area in all the years. On this basis, the cumulative subsidence of the study area was obtained using the SBAS-InSAR method, and the value was used to predict and analyze the subsidence of the area from 2024 to 2026 using the LSTM method. After that, the surface slip and local area particle movement trajectories were derived using MatDEM software and compared with the subsidence obtained using the LSTM method. Finally, based on the above findings, the mechanism of mountain subsidence is derived.
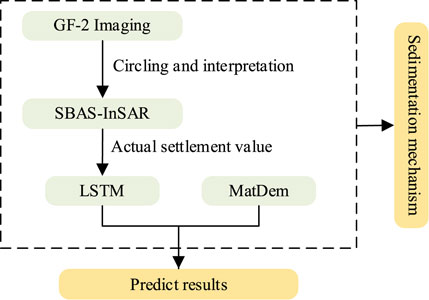
Figure 1. Summary of the research methodology.
2 Study site
2.1 Regional overview
As shown in Figure 2a, the study area is located in Yingtan City, Jiangxi Province, China, and the terrain belongs to the middle–low mountainous terrain, with mountain ranges spreading from east to west, with an average elevation of 200 m above sea level. As shown in Figure 2b, more than 10 years ago, a large-scale collapse occurred in the Yinlu Ling mine section, forming the old collapse area, which is located in the high part of the hill, with a collapse area of approximately 64,000 m2, and mining has been stopped now. As shown in Figure 2c, after 2010, the center of gravity of mining has shifted to the south section area, and the increasingly formed mining airspace has led to the gradual occurrence of geological hazards such as subsidence and landslides on the surface of the ground. As shown in Figure 2d, from an aerial photograph of the site in June 2023, it can be found that a concave subsidence area was formed centered on the middle of the mountain, with an east–west width of approximately 260 m, a north–south length of approximately 350 m, and a subsidence area of approximately 57,000 m2. Several tension cracks and trap zones were formed at the top of the ground surface, and a small portion of the trees slid into the slump crater.
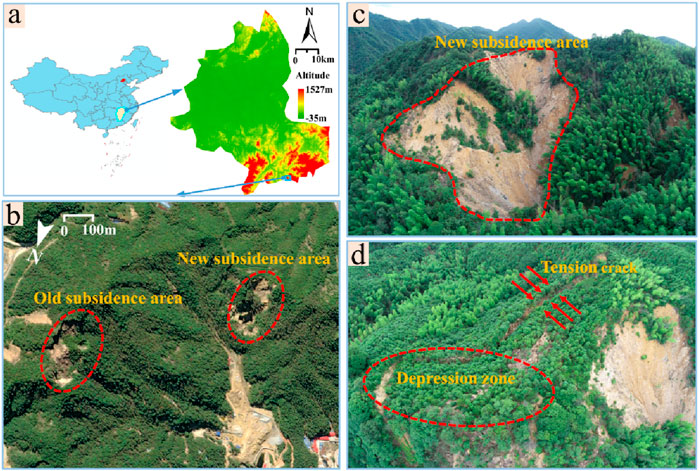
Figure 2. Information map of the study area. (a) Location of the study area. (b) Location of the new and old collapsed areas; data are obtained from Google Maps. (c) Front view of the new collapsed area. (d) Top view of the new collapsed area. (c,d) are obtained from Unmanned Aerial Vehicle.
2.2 Geological composition
The highest elevation of the study area is 288 m, and the slope of the terrain is 25°–35°. The water content of the internal rock fissures is poor, and most of the precipitation is discharged as surface runoff, while a small portion seeps into the ground to form fissure water. The stratigraphy of the mine is poorly developed and fragmented, with uniform but loose and fragile soils susceptible to breakage and subsidence. The rock structures are, in order, Quaternary (Q4), Middle Permian Qixia Formation (P2q), Lower Carboniferous Zishan Formation (C1z), Upper Permian Leping Formation (P3l), Upper Cretaceous Maodian Formation (K2m), and Lower Nanhua Lower Shangshi Formation (Nh1s). Figure 3 shows the distribution of stratigraphic properties in the study area.
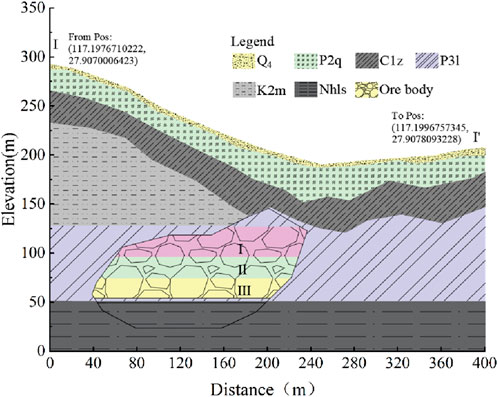
Figure 3. Distribution of stratigraphic properties in the study area.
2.3 Mining methods
The altitude of the mining area is between 150 m and 280 m; the ore body is located below the local erosion datum, and the main ore body is covered by the Quaternary System, which is a hidden ore body. The ore body has a strike extension of 50–250 m, a tendency extension of 50–320 m, and an average thickness of 3.19–12.17 m. The mining method is the bottomless pillar segmental chipping method, and the mining direction is the vertical height direction, first the upper middle section and then the lower middle section. The mining stratification height is 12–14 m, without top and bottom pillars. As shown in Figure 4, the area above +150 m was mined earlier years ago, and mining below +150 m did not start until 2015. From 2015 to 2022, the main focus is on mining the middle section from +150 m to +100 m, using a top–down mining sequence. The ore body is more evenly distributed, with medium quality, and the annual mining volume is roughly equal. After 2023, it enters the middle section from +100 m to +50 m, which is more difficult to mine, but the mining method is still the bottomless pillar segmental avalanche mining and does not involve the infill mining method.
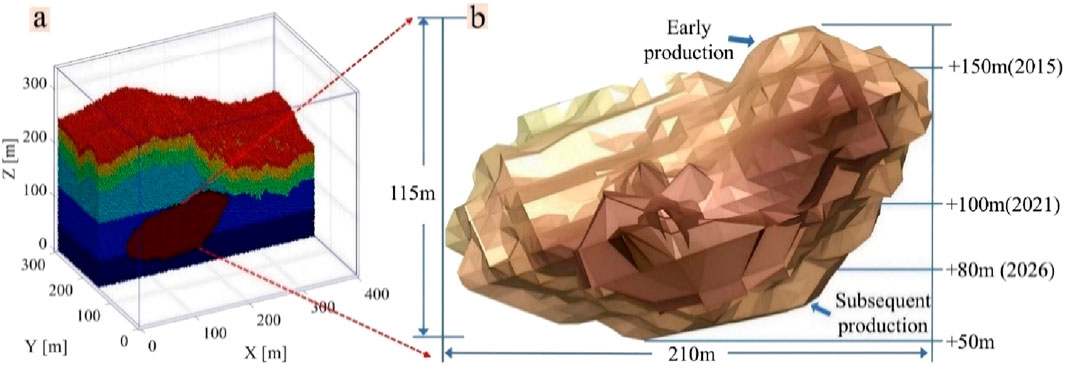
Figure 4. Schematic diagram of ore body hosting and mining. (a) Ore body location. (b) Ore body mining plan.
3 Methods
3.1 GF-2 remote sensing imagery
High-resolution multi-temporal satellite imagery was used for visual interpretation of subsidence evolution and macroscopic identification of subsidence deformation (Travelletti et al., 2012; Xu et al., 2023). The GF-2 remote sensing satellite was applied to remote sensing monitoring of mines, geological disaster investigation, and monitoring. The satellite has an orbital altitude of 631 km, an orbital inclination of 97.9080°, several bands of 4, a resolution of usually 0.81 m, and a revisit time of 5 days.
3.2 Principles and processes of SBAS
The SBAS-InSAR technique, proposed by Berardino in 2002, is a monitoring method based on synthetic aperture radar interferometry (Li S. et al., 2022). The core of this technique is based on the phase difference analysis of multiple radar images for mountain surface subsidence monitoring and measurement. As shown in Figure 5, interferometric image pairs with spatiotemporal baselines less than a certain threshold are selected from the multi-scene SAR images of the study area to generate multi-view interferograms. Then, the interferometric pairs with good coherence are selected to remove the flat-earth phase using the track parameters, and the terrain phase is eliminated using high-precision DEM. Based on the high-precision sedimentation time series obtained using the least squares method (LSM) processing, the singular value decomposition (SVD) method is used to jointly solve multiple small baseline sets to obtain the sedimentation series for the whole period (Li Y. et al., 2022).
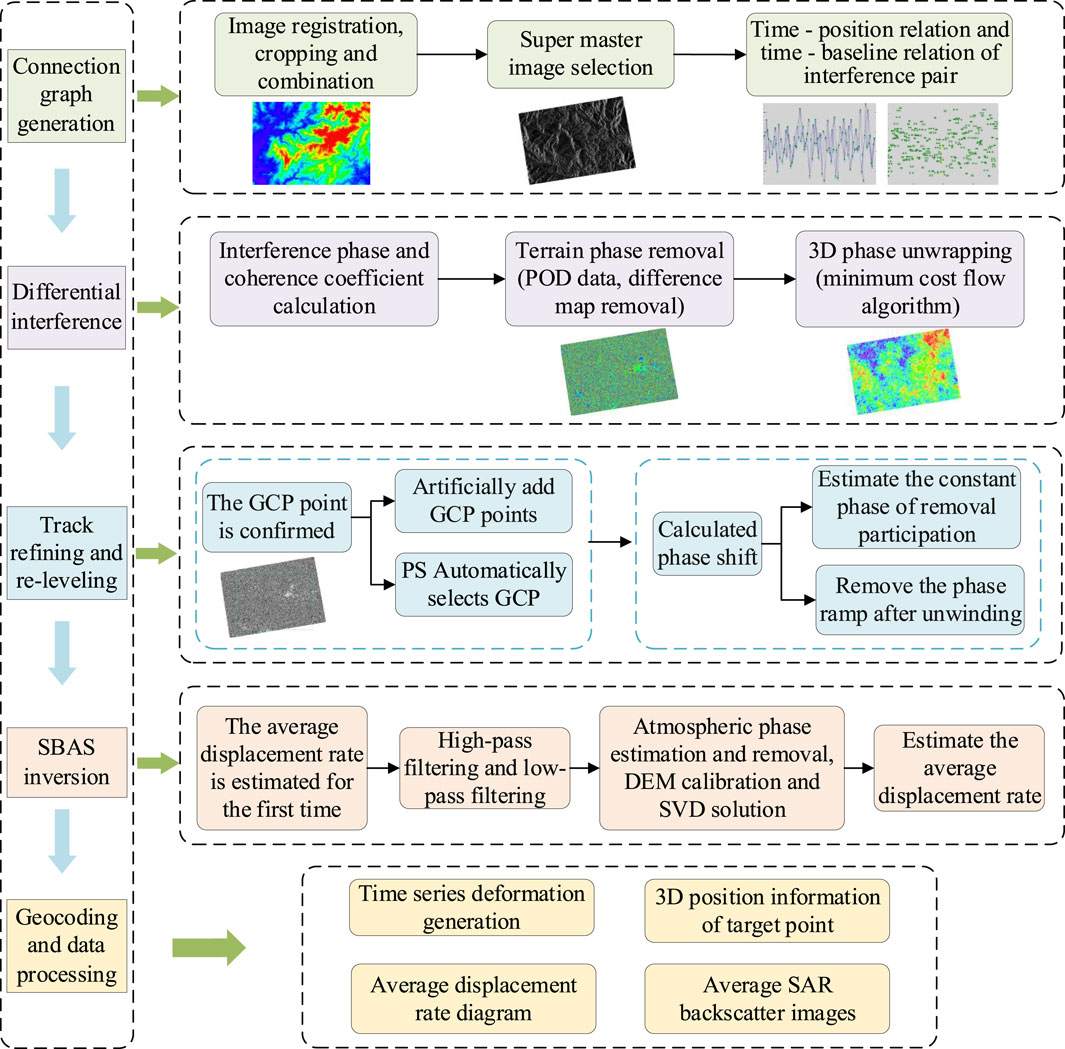
Figure 5. Flowchart of SBAS-InSAR technology processing.
3.3 MatDEM subsidence principle
Matrix discrete element MatDEM software, which is used to construct models by stacking and cementing particles (Zhu et al., 2023), can effectively simulate rockfall and mountain surface subsidence caused by underground ore mining. Linear elastic modeling is the most important feature in MatDEM software, using normal and tangential springs instead of the mutual contact of soil particles, with normal springs providing tensile strength and tangential springs providing shear strength (Figure 6) (Cai et al., 2022). The formulas provided by Geng et al. (2023) can be used to calculate the tensile strength and shear strength. In Equation 1,
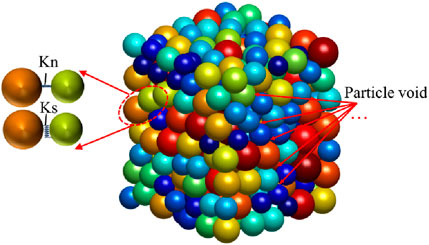
Figure 6. Elastic contact of particles.
where
To determine whether the particles have relative movement, it is concluded that if the contact particles are stretching, there is no movement. If it is under compression, it is simplified into a sliding model, and the mathematical relationship between shear resistance, tangential force, and friction factor is constructed in MatDEM, which can be calculated using Equation 2 (Song et al., 2022).
where
3.4 LSTM principles
The LSTM neural network can learn the sequential dependencies between observations and is, therefore, suitable for time-series prediction (Qin et al., 2021). First, the SBAS results are arranged according to the time series, imported into the LSTM model, and several iterative operations are performed to derive the predicted values. The LSTM process and architecture are shown in Figure 7.
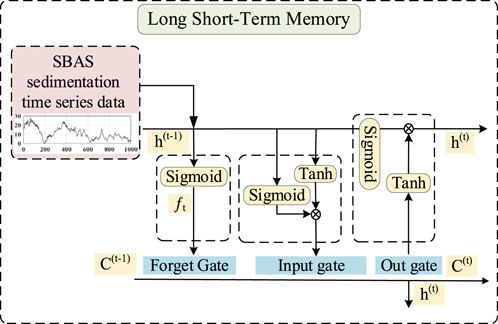
Figure 7. LSTM process and architecture.
4 Results
4.1 Mountain subsidence circling and interpretation
Based on the optical remote sensing satellite GF-2, satellite image data were obtained from the China center for Resources Satellite Data and Application (https://data.cresda.cn). We used ENVI version 5.6 software (http://www.exelisvis.com) for radiometric calibration, atmospheric correction, and orthorectification of the multispectral data. The panchromatic and multispectral data were processed for geometric alignment, image fusion, and mosaic cropping. A total of nine representative images from 2015 to 2023 were screened in this processing. The surface subsidence process of the mountain in the mining area is shown in Figure 8.
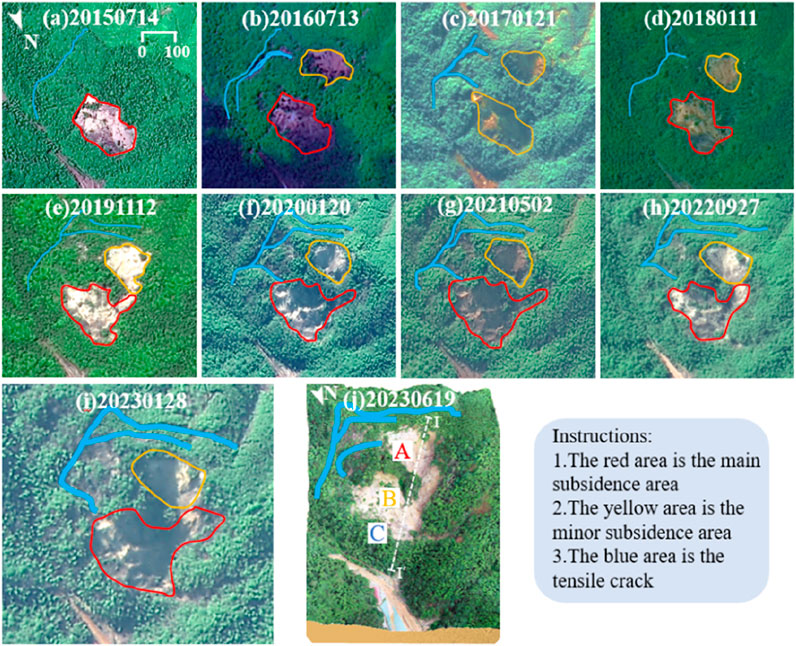
Figure 8. The mountain surface subsidence in the mining area at different times. (a–i) 2015–2023. (j) 3D live image. Satellite image data for GF-2 were obtained from China Center for Resources Satellite Data and Application (https://data.cresda.cn). The images were processed using ENVI version 5.6 software (http://www.exelisvis.com).
As shown by the 2015 image, there were original areas of prismatic subsidence on the mountain, but the subsidence is not obvious. This indicates that the mining area formed by early mining has affected the stability of the mountain, naming it as the main subsidence area. In 2016, a slip area with a shape similar to an ellipse was generated above the main subsidence area. The scale of subsidence was smaller than that of the main subsidence area, which was named as the secondary subsidence area. In 2017 and 2018, there was a further increase in the extent and degree of subsidence in both the main and secondary subsidence areas. In 2019, tensile cracks appear at the top of slopes and ridges above the secondary subsidence area, and small stockpiled soil layers can be observed below the surface. In 2020–2022, a penetration channel is formed between the main and secondary subsidence areas. Loose rock from the secondary subsidence area slides through this channel into the primary subsidence area, and the degree of mountain surface subsidence increases further. The number of tension cracks increases in 2023, and the crack width also increases. The area of the penetration channel approximately doubles from 2021, and the extent and degree of regional subsidence further increase.
In June 2023, a field survey of the study area was carried out using Metashape 2.0 software to generate a 3D live image; see Figure 8j. There is subsidence at the surface, and two large tension cracks can be observed more clearly at the back edge of the landslide. The largest tensile crack has a length of 246 m, a maximum decrease of 6.7 m, and a maximum gap width of 2.2 m. The existence of primary subsidence areas and tension cracks in satellite images was verified. For the subsequent convenience of the study, the main and secondary subsidence areas are named as areas A and B, respectively, and the accumulation subsidence area is named as C area. The I–I' profile line is plotted.
4.2 SBAS-InSAR time-series analysis
The C-band Sentinel-1A radar satellite images launched by ESA were used for mine subsidence detection. A total of 100 views of ascending data covering the study area from 2015 to 2023 were selected, using the interferometric wide-swath mode with VV polarization, a spatial resolution of 5 m × 20 m, and a multi-looking factor of 2:6. The surrounding environment of the Baojia mine is complex, and several large-scale mining enterprises are present. To estimate the subsidence threshold of the Baojia mining area, SBAS-InSAR analyses were carried out where several mining areas are located, and the subsidence thresholds were derived as (−150 mm; +60 mm). Digital elevation model (DEM) data with a resolution of 0.03 m were plotted using the field data as alignment data to remove the effect of topographic relief. To exclude the effect of geometric distortion on landslide identification, DEM gradient maps, along with SAR intensity maps, were used to participate in the validation of the identified landslides (Liu X et al., 2018). The distribution of their temporal and spatial baselines is shown in Figure 9.
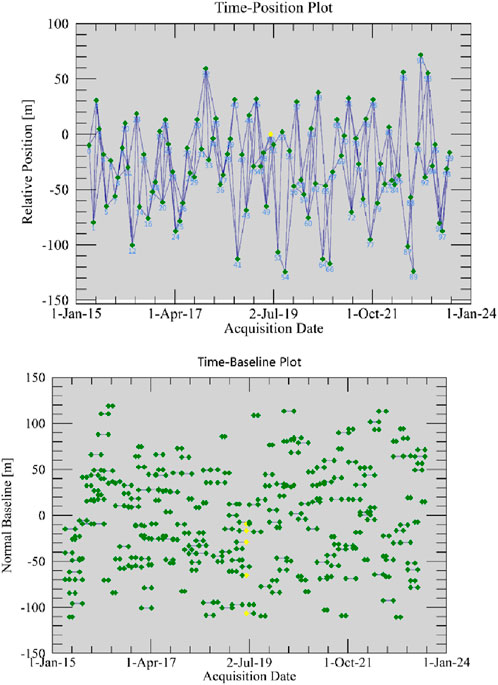
Figure 9. Time baseline (left) and space baseline (right).
Figure 10 shows the cumulative subsidence change curves for areas A, B, and C from 2015 to 2023. Between 2015 and 2017, the change in subsidence in areas A and B was small and in the subsidence deformation latency period. The maximum cumulative subsidence in areas A and B was 192 mm and 439 mm, respectively, and the average cumulative subsidence was 99 mm and 245 mm, respectively. During this period, the subsidence deformation in B area was higher than that in A area, and the deformation in C area was basically stable without obvious fluctuation. From 2018 to 2020, the subsidence deformation changes in A and B areas increased and entered the developmental period of subsidence deformation. The uplift deformation occurred in C area and entered the developmental period of uplift deformation. The maximum amount of subsidence in A and B areas increased by 739 mm and 814 mm, respectively, and the average amount of subsidence in A and B areas increased by 599 mm and 661 mm, respectively. The maximum amount of uplift deformation in C area was 262 mm, and the average amount of uplift was 151 mm. After 2020, A and B areas entered a period of accelerated subsidence, and the cumulative amount of subsidence in A area was larger than that in B area. The rate of uplift in C area accelerated significantly and entered a period of accelerated uplift, and the maximum amount of subsidence in A and B areas was 1,680 mm and 1,392 mm, respectively, while the average amount of subsidence in A and B areas was 1,471 mm and 1,289 mm, respectively; the maximum amount of uplift in C area was 945 mm, and the average amount of uplift was 651 mm.
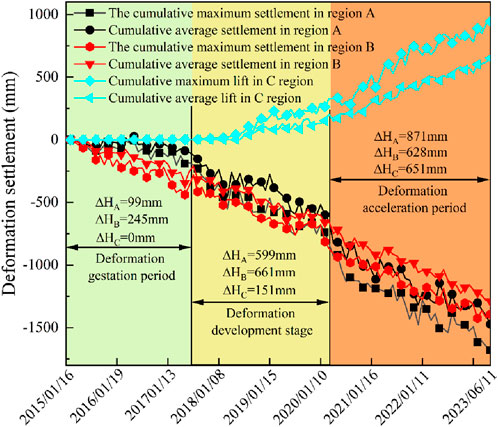
Figure 10. Cumulative subsidence time series of areas A, B, and C.
4.3 Numerical simulation analysis
To derive the amount of subsidence in A, B, and C areas and quantify the amount of geotechnical slip in the process of surface subsidence from the perspective of numerical simulation, a 1:1 numerical simulation model was constructed with a length of 400 m, a width of 300 m, and a height of 300 m. The number of particles was 1 million, the dispersion coefficient was 0.2, and the distribution of particle size was 1.2–1.8 m. The simulation model is shown in Figures 4a,b.
4.4 Rock mechanics parameters
A sufficient number of representative rock blocks were selected for indoor sample processing at +80 m mid-section, +100 m mid-section, +150 m mid-section, and drilling sampling at +200 m and +250 m. The rock mechanical parameters of the study area were obtained, as shown in Table 1. MatDEM can convert rock mechanical parameters into micromechanical parameters of stacked particles, which can lead to discrete meta-stacked materials with specific elastic modulus and strength properties (Yu et al., 2023) Using MatDem’s inbuilt macro–micro mechanical property conversion formula (Liu, 2021), the micro-rock mechanical parameters were obtained, as shown in Table 2.
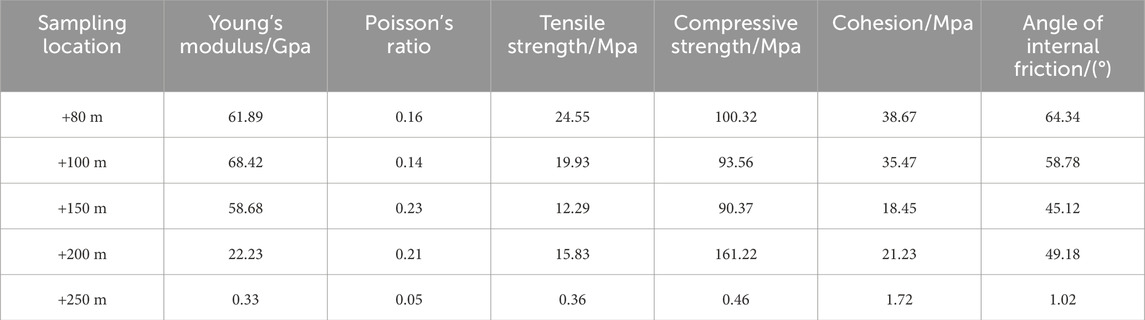
Table 1. Rock mechanical parameters.
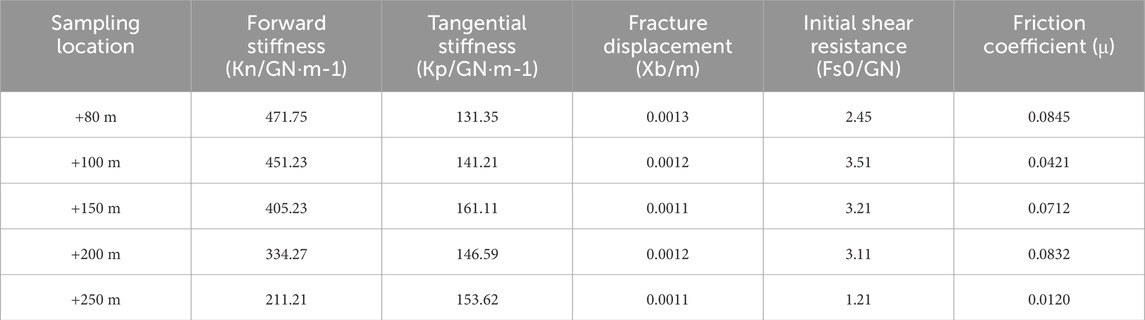
Table 2. Microscopic rock mechanical parameters.
4.5 Cumulative slip changes in mountain surfaces
Figures 11a–i show that the amount of surface slip gradually increases with the advancement of mining. This may be because continuous mining disturbance and the effect of self-gravity on the rock and soil aggravate the change from a stable to an unstable state, and the surface settles significantly. Under the action of the penetration channel, the rock and soil in the upper area sink and slide downward to the bottom of the surface, which makes the rock and soil in the bottom area pile to be uplifted. In 2015–2017, the amount of rock and soil slip was small, with the maximum amount of slip being 23.5 m. From 2018 to 2023, the amount of surface slip increases significantly. The change process corresponds to the period of subsidence development and subsidence acceleration obtained from SBAS-InSAR analysis, and the maximum slip is 121.8 m. As shown in Figures 11j–l, the maximum cumulative slip at the surface will reach 140 m from 2024 to 2026, and the slipped particles gradually accumulate in the bottom area.
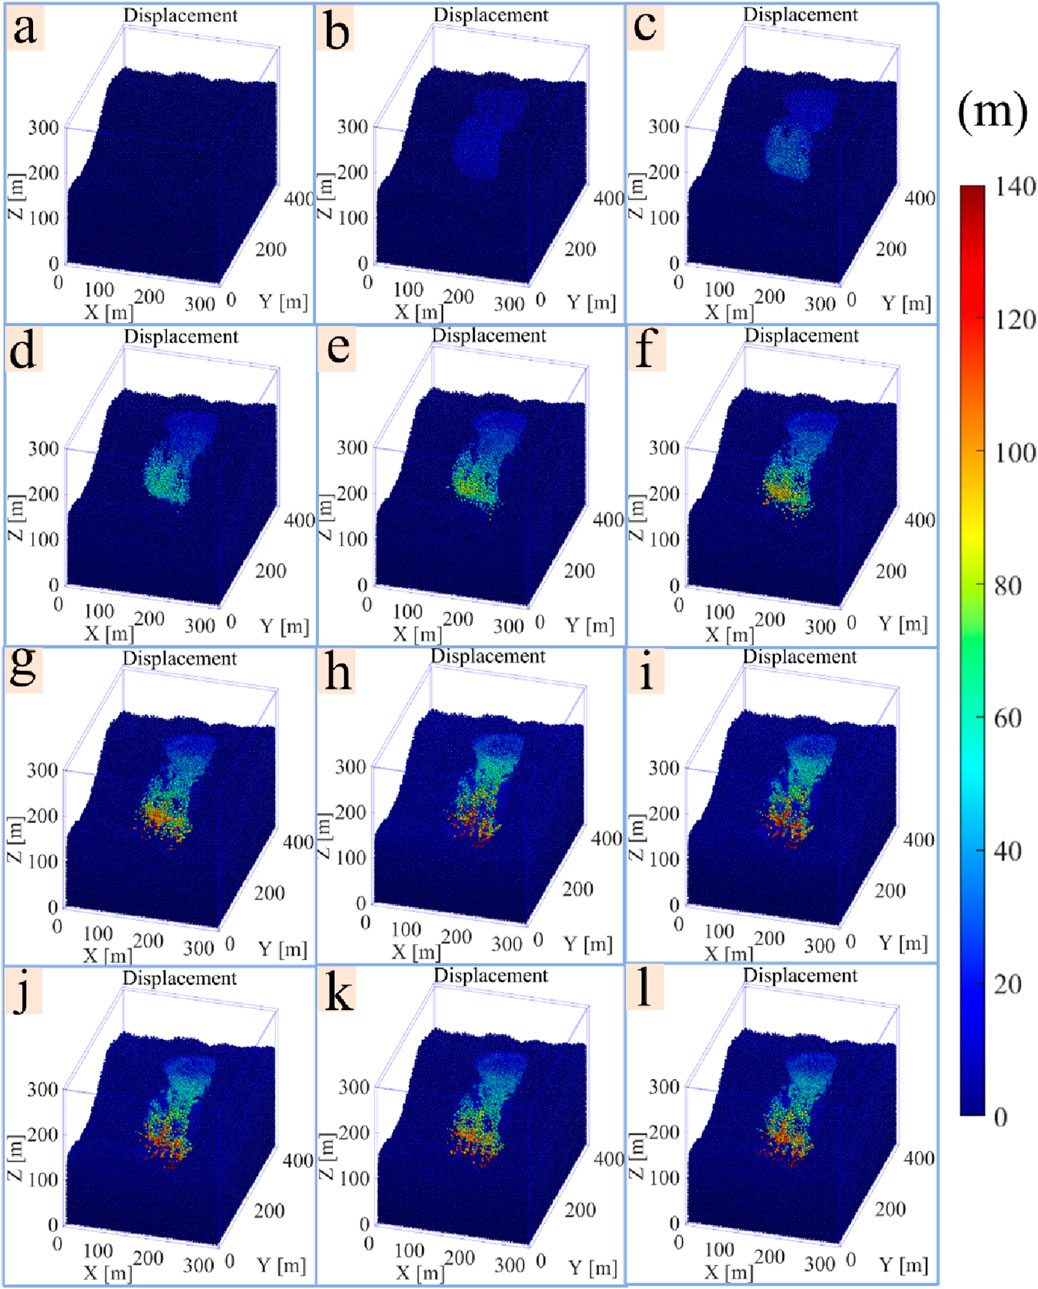
Figure 11. Variation in the mountain surface cumulative slip. (a–l) corresponding to 2015 to 2026.
4.6 Localized regional particle trajectories
To investigate the process of change in the subsidence region, area A was analyzed, and its particles were calibrated and tracked. During the sliding process, the subsidence area does not move or slide as a whole, but the whole gradually disintegrates into several small areas. The small area underneath is the main force behind the subsidence activity, with large particle (geotechnical) slip displacements. As shown in Figures 12a–c, the overall slip in area A is small, but the slip in the lower area is large, with a maximum of 21 m, and a tendency of disintegration occurs. As in Figures 12d–f, the slip in the bottom area continues to increase, and area A disintegrates into the upper and lower areas, with a maximum slip of 109 m. As in Figures 12g–l, the slip in the lower area continues to increase and disintegrate into smaller areas.
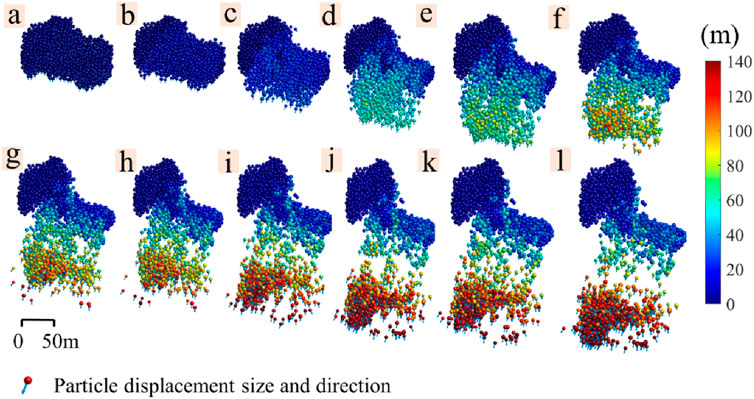
Figure 12. Trajectory of particle change in the A region. (a–l) corresponding to 2015 to 2026.
According to the sliding characteristics of the particles, during the subsidence process, the change interval of area A can be divided into the tension cracking zone, central sliding deformation zone, and accumulation uplift zone. The tension-cracking zone is formed by stretching and fracture deformation, which provides a source of material for the subsidence activity. The central sliding deformation zone presents the whole sliding characteristics along the sliding surface and consists of primary and secondary deformation areas. It is an extremely unstable area in the subsidence activity of the mountain. The accumulation and uplift zone is a soil–rock mixture formed by the collapse of the upper rock mass, and the rock and soil in this area are accumulated.
5 Discussion
5.1 A multi-source approach to predicting mountain subsidence
5.1.1 LSTM prediction of mountain subsidence
Based on the InSAR monitoring results, the SBAS-InSAR monitoring data from 2015 to 2023 in A, B, and C areas were selected for prediction. Through rigorous testing, the subsidence data from the initial 70 months were utilized as the training set, while the subsequent 30 months served as the test set. Ultimately, leveraging a dataset over 100 months, we successfully projected subsidence values for the following 30 months. The selection criterion for determining the historical sequence length was based on smooth error changes and low error values. After extensive training iterations, it was determined that an optimal historical sequence length (L) was 5 (L = 5). Additionally, we conducted a maximum of 600 training cycles with an initial learning rate of 0.005, which decreased to 0.001 after completing 125 training cycles using a learning rate decline factor of 0.2.
The training and prediction results of the LSTM model on the original temporal subsidence data are illustrated in Figure 13. As shown in Figures 13a–d, the training set data are collected from 2015 to 2020. It can be found that the LSTM training curves can highly fit the SBAS-InSAR curves in the areas with and without subsidence changes, and the maximum difference value is 11.3 mm. The validation set data are collected from 2021 to 2023, which continues to maintain a high correlation with the SBAS-InSAR curve, with a maximum difference value of 13.5 mm. The LSTM method yields low mean absolute error (MAE) and root mean square error (RMSE) of 18.3 mm and 21.7 mm, respectively, and the correlation reaches 0.99. This suggests that the model has good capability for capturing fluctuating changes in the time series, and the data have a good ability to reflect these changes. It is expected that the maximum cumulative sedimentation in 2026 will reach −2,180 mm, −1885 mm, and 1,040 mm in A, B, and C areas, respectively.
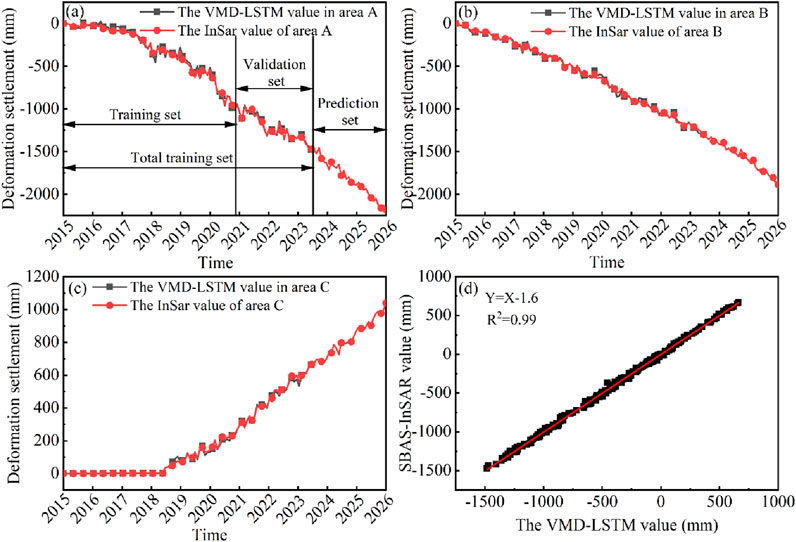
Figure 13. LSTM prediction results. (a–c) correspond to areas A, B, and C. (d) Correlation analysis.
5.1.2 Comparison of numerical simulation results with LSTM prediction
The LOS settling in the InSAR calculation is the combined displacement in the vertical and north–south directions. In the discrete element calculation, the subsidence displacement is the difference between the displacements of the first and second (in ∆T time) runs taken in the vertical direction. Therefore, after obtaining the subsidence displacement in MatDEM, the displacement in the LOS direction should be obtained to discuss the subsidence data derived from InSAR. The specific conversion process refers to the research results of Chen YHY et al. (2022).
As shown in Figure 14a, the numerical simulation calculates the average subsidence results of A, B, and C areas from 2015 to 2026. The simulation results show that the average subsidence of A, B, and C areas gradually increases from 2015 to 2023. The average subsidence of areas A, B, and C in 2023 was −1811 mm, −1725 mm, and 731 mm, respectively. From 2024 to 2026, the subsidence rate will increase and enter the accelerated subsidence period. The maximum cumulative subsidence will reach −2,564 mm, −2,307 mm, and 1,206 mm, respectively. Figure 14b shows the correlation analysis between the SBAS-InSAR results and the numerical simulation results from 2015 to 2023. The mean absolute error (MAE) and the root-mean-square error (RMSE) are 152 mm and 115 mm, respectively, with correlation coefficient R2 = 0.92, and they are highly correlated.
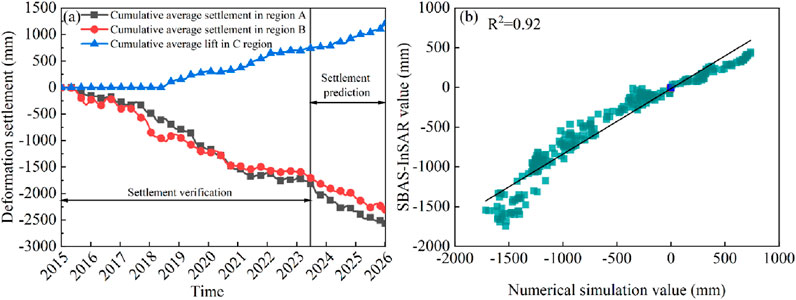
Figure 14. (a) Cumulative subsidence in the ABC area. (b) Discrepancy between SBAS-InSAR and numerical simulation results.
As shown in Table 3, the LSTM model predictions are better than the numerical simulation results. Taking the SBAS-InSAR data as the benchmark, the MAEs of the two models are 18.3 mm and 152 mm, respectively. The RMSEs of the two models are 21.7 mm and 115 mm, respectively. Although the accuracy of the numerical simulation results is not as good as that of the LSTM model results, the trend of the subsidence curves of the two models is the same. The simulation results of the two models are also of the reference value.
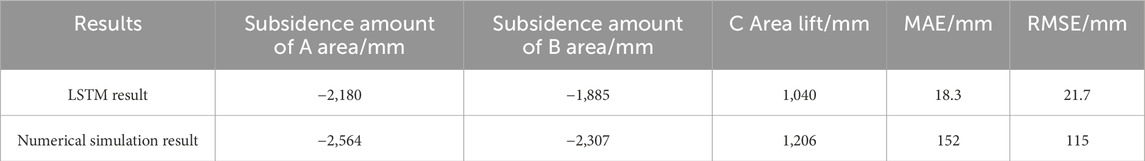
Table 3. Prediction and accuracy assessment of cumulative subsidence in 2026.
5.2 Analysis of mountain subsidence mechanisms
There are various mechanisms of mountain subsidence, and different areas have different mining methods and topographic and geological environments (Bagheri-Gavkosh et al., 2021; Yuan et al., 2021). The Baojia mine belongs to the low-altitude, medium geological condition, shallow mining category, with an average altitude of 200 m and a minimum distance from the highest point of mining to the surface of only more than 80 m. The average annual rainfall is 1,282 mm, and the water content of the rock fissures inside the mine is poor. Most of the precipitation is drained away by surface drains and other facilities, and a small portion of it seeps into the ground to form fissure water. Therefore, the subsidence of the mountain exhibits an evolutionary process and mechanism influenced by underground mining and the self-gravity of the rock layers. In response to the period from 2015 to 2026, the formation mechanism of the Baojia mountain subsidence activity can be divided into three stages.
5.2.1 Stage 1: deformation latency
The Baojia Mine is a low-altitude, medium geological condition, shallow mining mine, with a minimum distance from the highest point of mining to the surface of just over 80 m. Mine subsidence activities in this environment are strongly influenced by underground mining. From Figures 8a–c, between 2015 and 2017, mining operations in Area A caused subsidence in parts of the mountain, forming primary and secondary subsidence areas. During subsequent mining operations, these areas gradually expanded and became high-risk areas. As a result of the actual local conditions, during this phase, the subsidence phenomenon was not significant. There was no activity such as the fall of trees or the movement of bushes, and the activity in the subsidence areas could not be easily detected without the use of tools.
5.2.2 Stage 2: stretch-cracking developmental stage present
From Figures 8d–g, between 2018 and 2021, areas of subsidence accelerate, tensile and dehiscence cracks increase, and the extent of primary and secondary deformation areas increases. During this timeframe, the Ⅱ orebody area has been mined. As the mining method at the Baojia Mine is the bottomless pillar segmental avalanche method, the increasing extent of the airspace area with continued mining may result in the bending and positional movement of the overlying rock strata and may also lead to the formation of two types of cracks in the strata above the airspace area under the effect of continued disturbances: (1) horizontal detachment cracks between the strata and (2) longitudinal cracks as a result of opening up of major joints perpendicular to the coal seam. Eventually, many cracks were created in the ground, which were distributed above the mining areas and spread outward from the primary and secondary subsidence areas. At this stage, the subsidence areas were evident, and the fall of trees and the movement of shrubs could be observed. This is related to the nature of the surface rock formations. The surface rock strata in the mine area are Q4 strata, which are mainly dominated by yellow gravel-bearing silty clay with yellow muddy breccia and sporadic distribution of lumps and stones. The rock structure is loose and easy to slide.
5.2.3 Stage 3: creep-slip period
From Figures 8h,i, the Ⅲ ore body area will be mined. As the mining workings continued to advance, existing and new fractures widened and deepened, which accelerated deformation and increased the risk of subsidence occurring. During this phase, many localized rock slides occurred due to the driving effect of the slide, creating areas of subsidence of greater extent. The specific performance is first to form a main subsidence area, and with the passage of time, under the action of fissure development and tensile cracks, a secondary subsidence area is formed, and the main and secondary subsidence areas are fused under the influence of the penetrating channel to form a larger main subsidence area.
6 Conclusion
The amount of mountain subsidence and the mechanism of mountain subsidence are predicted. Based on the multi-source method to study the mountain subsidence caused by underground mining in Baojia Mine, Jiangxi Province, China, the following conclusions are drawn.
1. Mountain surface subsidence begins with the formation of a primary subsidence zone, which slowly leads to the formation of primary and secondary subsidence zones. Under the influence of the penetrating channel, the main and secondary subsidence areas merge to form a larger subsidence area. From 2015 to 2023, the maximum subsidence of the main and secondary subsidence areas reached 1,680 mm and 1,392 mm, respectively, and the maximum lift of the accumulation area was 651 mm. The largest tensile crack at the back edge of the landslide was 246 m in length, with a maximum decrease of 6.7 m and the maximum width of the gap of 2.2 m. The maximum length of the tension crack at the back edge of the landslide was 246 m, with a maximum decrease of 6.7 m, and the maximum width of the gap was 2.2 m.
2. The amount of surface rock and soil sliding gradually increases with the advancement of mining and is expected to reach 140 m in 2026. The change interval of the main subsidence area can be classified into the tension cracking zone, the central sliding and deformation zone, and the accumulation and uplift zone. It is considered that the subsidence area is not overall translating or sliding during the sliding process, but the whole gradually disintegrates into several small areas. The small area which is underneath is the main force of the subsidence movement, and the geotechnical slip displacement is larger.
3. Based on this study, it was concluded that the accuracy of the results obtained using the LSTM method is higher than that of the numerical simulation results, with MAEs of 18.3 mm and 152 mm, respectively, and RMSEs of 21.7 mm and 115 mm, respectively, and that the LSTM method predicts that the maximum deformations of areas A, B, and C will reach −2,180 mm, −1885 mm, and 1,040 mm, respectively, in 2026.
4. The Baojia mine is a low-altitude, medium-geology, shallow mining mine, where surface stability is susceptible to the effects of mining. The subsidence mechanism of this mountain can be divided into three stages. (1) Deformation latency: The surface of the mountain body forms the contour of the main and secondary subsidence areas. The subsidence phenomenon is not obvious, and there is no tree collapse or scrub movement. Without using tools, the subsidence area is not easy to be found. (2) Stretching and cracking development period: Horizontal separation cracks and longitudinal cracks developed from the mining area resulted in tensile cracks and cracking cracks on the surface and spread outward from the main and secondary subsidence areas. The range of the main and secondary deformation areas increased; the subsidence phenomenon was obvious, and the collapse of trees and the movement of shrubs could be observed. (3) Creep-slip period: Under the influence of underground mining and the self-gravity of the rock layer, many localized rock slides occurred due to the pushing effect of the sliding body. This resulted in the formation of a wider area of subsidence and an area of accretionary uplift at the foot of the slope.
Data availability statement
The original contributions presented in the study are included in the article/supplementary material; further inquiries can be directed to the corresponding author.
Author contributions
XY: Writing – review and editing, Writing – original draft, Methodology, Conceptualization, Investigation. JG: Conceptualization, Investigation, Supervision, Writing – original draft, Methodology, Data curation, Writing – review and editing. XL: Writing – original draft, Data curation, Methodology, Conceptualization, Investigation, Writing – review and editing. ST: Software, Writing – original draft, Data curation, Writing – review and editing, Conceptualization, Methodology. QC: Writing – original draft, Data curation, Writing – review and editing, Investigation, Conceptualization.
Funding
The author(s) declare that financial support was received for the research and/or publication of this article. This work was funded by the National Natural Science Foundation of China (52364013), the China Postdoctoral Science Foundation Funded Project (2022M722924), the Natural Science Foundation of Jiangxi Province (20232BAB214035), and the Jiangxi Provincial Thousand Talents Plan Project (jxsq2023102146).
Conflict of interest
The authors declare that the research was conducted in the absence of any commercial or financial relationships that could be construed as a potential conflict of interest.
Generative AI statement
The author(s) declare that no Generative AI was used in the creation of this manuscript.
Publisher’s note
All claims expressed in this article are solely those of the authors and do not necessarily represent those of their affiliated organizations, or those of the publisher, the editors and the reviewers. Any product that may be evaluated in this article, or claim that may be made by its manufacturer, is not guaranteed or endorsed by the publisher.
References
Bagheri-Gavkosh, M., Hosseini, S. M., Ataie-Ashtiani, B., Sohani, Y., Ebrahimian, H., Morovat, F., et al. (2021). Land subsidence: a global challenge. Sci. Total Environ. 778, 146193. doi:10.1016/j.scitotenv.2021.146193
Cai, G., Li, J., Liu, S., Li, J., Han, B., He, X., et al. (2022). Simulation of triaxial tests for unsaturated soils under a tension–shear state by the discrete element method. Sustainability 14 (15), 9122. doi:10.3390/su14159122
Cao, S., Song, W., Deng, D., Lei, Y., and Lan, J. (2016). Numerical simulation of land subsidence and verification of its character for an iron mine using sublevel caving. Int. J. Min. Sci. Technol. 26 (2), 327–332. doi:10.1016/j.ijmst.2015.12.020
Chen, B., Yu, H., Zhang, X., Li, Z., Kang, J., Yu, Y., et al. (2022a). Time-varying surface deformation retrieval and prediction in closed mines through integration of SBAS InSAR measurements and LSTM algorithm. Remote Sens. 14 (3), 788. doi:10.3390/rs14030788
Chen, Y. H. Y., Zhang, L. F., Chen, B. S., He, X., Pu, H. Y., Cao, S. P., et al. (2022b). Surface deformationprediction based on TS-InSAR technology and long short-term memory networks. J. Remote Sens. 26 (7), 1326–1341. doi:10.11834/jrs.20221457
Du, S., Feng, G., Wang, J., Feng, S., Malekian, R., and Li, Z. (2019). A new machine-learning prediction model for slope deformation of an open-pit mine: an evaluation of field data. Energies 12 (7), 1288. doi:10.3390/en12071288
Fathi Salmi, E., Nazem, M., and Karakus, M. (2017). Numerical analysis of a large landslide induced by coal mining subsidence. Eng. Geol. 217, 141–152. doi:10.1016/j.enggeo.2016.12.021
Gao, L., Kang, X., Gao, L., and Ma, Z. (2022). Study of the stability of the surface perilous rock in a mining area. Energies 15 (4), 1542. doi:10.3390/en15041542
Geng, J., Wang, Z., Lan, X., Li, X., and Zhang, D. (2023). Numerical simulation and safety distance analysis of slope instability of ionic rare Earth tailings in different rainy seasons. Geomatics, Nat. Hazards Risk 14 (1), 2277127. doi:10.1080/19475705.2023.2277127
Li, H., Zhu, L., Dai, Z., Gong, H., Guo, T., Guo, G., et al. (2021). Spatiotemporal modeling of land subsidence using a geographically weighted deep learning method based on PS-InSAR. Sci. Total Environ. 799, 149244. doi:10.1016/j.scitotenv.2021.149244
Li, S., Xu, W., and Li, Z. (2022a). Review of the SBAS InSAR Time-series algorithms, applications, and challenges. Geodesy Geodyn. 13 (2), 114–126. doi:10.1016/j.geog.2021.09.007
Li, Y., Zuo, X., Xiong, P., You, H., Zhang, H., Yang, F., et al. (2022b). Deformation monitoring and analysis of kunyang phosphate mine fusion with InSAR and GPS measurements. Adv. Space Res. 69 (7), 2637–2658. doi:10.1016/j.asr.2021.12.051
Lin, Z., Sun, X., and Ji, Y. (2022). Landslide displacement prediction model using time series analysis method and modified LSTM model. Electronics 11 (10), 1519. doi:10.3390/electronics11101519
Liu, C. (2021). Matrix discrete element analysis of geological and geotechnical engineering. Springer.
Liu, X., Zhao, C., Zhang, Q., Peng, J., Zhu, W., and Lu, Z. (2018). Multi-temporal loess landslide inventory mapping with C-X-and L-band SAR datasets—A case study of heifangtai loess landslides, China. Remote Sens. 10 (11), 1756. doi:10.3390/rs10111756
Mirmazloumi, S. M., Wassie, Y., Nava, L., Cuevas-González, M., Crosetto, M., and Monserrat, O. (2023). InSAR time series and LSTM model to support early warning detection tools of ground instabilities: mining site case studies. Bull. Eng. Geol. Environ. 82 (10), 374. doi:10.1007/s10064-023-03388-w
Qin, C., Shi, G., Tao, J., Yu, H., Jin, Y., Lei, J., et al. (2021). Precise cutterhead torque prediction for shield tunneling machines using a novel hybrid deep neural network. Mech. Syst. Signal Process. 151, 107386. doi:10.1016/j.ymssp.2020.107386
Shi, Y., Zhao, M., and Hao, J. (2021). Study on numerical models in predicting surface deformation caused by underground coal mining. Geotechnical Geol. Eng. 39 (6), 4457–4473. doi:10.1007/s10706-021-01775-2
Song, D., Quan, X., Liu, M., Liu, C., Liu, W., Wang, X., et al. (2022). Investigation on the seismic wave propagation characteristics excited by explosion source in high-steep rock slope site using discrete element method. Sustainability 14 (24), 17028. doi:10.3390/su142417028
Travelletti, J., Delacourt, C., Allemand, P., Malet, J.-P., Schmittbuhl, J., Toussaint, R., et al. (2012). Correlation of multi-temporal ground-based optical images for landslide monitoring: application, potential and limitations. ISPRS J. Photogrammetry Remote Sens. 70, 39–55. doi:10.1016/j.isprsjprs.2012.03.007
Wang, F., Ren, Q., Jiang, X., Jiang, A., Zhao, C., and Liu, W. (2022). Engineering geology and subsidence mechanism of a Mountain surface in the daliang Lead–zinc ore mine in China. Bull. Eng. Geol. Environ. 81 (11), 488. doi:10.1007/s10064-022-02983-7
Xu, Q., Zhao, B., Dai, K., Dong, X., Li, W., Zhu, X., et al. (2023). Remote sensing for landslide investigations: a progress report from China. Eng. Geol. 321, 107156. doi:10.1016/j.enggeo.2023.107156
Yu, H., Liu, Z., Zhang, Y., Luo, T., Tang, Y., Zhang, Q., et al. (2023). The disintegration mechanism analysis of soft rock due to water intrusion based on discrete element method. Comput. and Geosciences 171, 105289. doi:10.1016/j.cageo.2022.105289
Yuan, M., Li, M., Liu, H., Lv, P., Li, B., and Zheng, W. (2021). Subsidence monitoring base on SBAS-InSAR and slope stability analysis method for damage analysis in mountainous mining subsidence regions. Remote Sens. 13 (16), 3107. doi:10.3390/rs13163107
Zhang, N., Wang, Y., Zhao, F., Wang, T., Zhang, K., Fan, H., et al. (2024). Monitoring and analysis of the collapse at xinjing open-pit mine, Inner Mongolia, China, using multi-source remote sensing. Remote Sens. 16 (6), 993. doi:10.3390/rs16060993
Zhao, J., Xiao, J., Lee, M. L., and Ma, Y. (2016). Discrete element modeling of a mining-induced rock slide. SpringerPlus 5 (1), 1633. doi:10.1186/s40064-016-3305-z
Keywords: underground mining, mountain surface subsidence, remote sensing image, SBAS-InSAR, MatDEM
Citation: Yang X, Geng J, Lan X, Tang S and Chen Q (2025) Multi-source approach research on prediction and mechanism of mountain surface subsidence caused by underground mining . Front. Earth Sci. 13:1642350. doi: 10.3389/feart.2025.1642350
Received: 06 June 2025; Accepted: 28 July 2025;
Published: 02 September 2025.
Edited by:
Manoj Khandelwal, Federation University Australia, AustraliaCopyright © 2025 Yang, Geng, Lan, Tang and Chen. This is an open-access article distributed under the terms of the Creative Commons Attribution License (CC BY). The use, distribution or reproduction in other forums is permitted, provided the original author(s) and the copyright owner(s) are credited and that the original publication in this journal is cited, in accordance with accepted academic practice. No use, distribution or reproduction is permitted which does not comply with these terms.
*Correspondence: Xiang Lan, MjI0MTM4MTE1MkBxcS5jb20=