 Zheng Yao1†
 Peng Cui
- 1School of Civil Engineering, Nanjing Forestry University, Nanjing, China
- 2College of Marine Science and Engineering, Shanghai Maritime University, Shanghai, China
- 3College of Civil Engineering, Nanjing Tech University, Nanjing, China
- 4Weifang Hydraulic Architectural Design and Research Institute Co., Ltd., Weifang, China
- 5Department of Applied Physics and Electronics, Umea University, Umea, Sweden
To enhance the estimation of dredged soil shear strength in marine settings, this research conducted 1,600 direct shear tests under varying thermal conditions and multiple drying–wetting cycles. Drawing from the test data, a structured database was assembled, and a new learning framework was developed by combining the Logical Development Algorithm (LDA), Adaptive Boosting (BA), and Artificial Neural Networks (ANN). The motivation behind this hybridization lies in the need to effectively capture nonlinear interactions and latent logical patterns among influencing factors, which are often overlooked by traditional single-algorithm models. This approach marks a pioneering use of such a hybridized model for strength evaluation in dredged soils. For performance verification, four alternative predictive models were established, including LDA–ANN, support vector machines (SVM), Particle Swarm Optimization (PSO), and a GA-tuned BA–ANN. Comparative analysis demonstrated that the LDA–BA–ANN configuration delivered the highest prediction precision and computational speed over traditional models. Moreover, sensitivity studies revealed that normal stress, temperature, and initial density were the dominant influencing parameters, whereas moisture cycling and shear rate had relatively minor effects. An empirical equation was further extracted from the optimized model, offering a user-friendly solution for practical engineering applications without requiring machine learning proficiency.
1 Introduction
With the rapid development of coastal infrastructure, a large amount of dredged soil is produced during port construction and channel maintenance (Vyas et al., 2022; Wan et al., 2024; Zhou et al., 2025). This material is increasingly reused in marine engineering applications such as artificial island construction, port reclamation, and submarine foundation filling (Bai et al., 2025; Chao et al., 2024c; Chao et al., 2024d). The mechanical behavior of dredged soil, especially its shear strength, plays a vital role in ensuring the stability and safety of marine structures (Cui et al., 2024; Zhang et al., 2024). In coastal and offshore environments, facilities constructed with dredged soil are exposed to environmental loads such as temperature fluctuations and drying–wetting cycles caused by tides, rainfall, and solar radiation (Dong, 2020; Gong et al., 2024). These environmental factors can significantly influence the strength and deformation characteristics of dredged soil (Dong et al., 2017; Jung et al., 2024). Additionally, due to the presence of organic matter and thermally sensitive components, dredged soil may undergo thermal softening at elevated temperatures—sometimes exceeding 80°C—resulting in a considerable loss of shear strength (Chao et al., 2024c; Chao et al., 2025). However, the influence of temperature on the mechanical response of dredged soil has rarely been explored, mainly due to limitations in existing testing systems.
Meanwhile, drying–wetting cycles induced by alternating infiltration and evaporation in marine environments can lead to internal structural damage, including the dissolution of soluble materials, expansion of clayey components, and crack formation (Fan et al., 2023; Liu et al., 2023; Luo et al., 2025). These repeated changes can degrade the mechanical integrity of the soil mass (Lin et al., 2024; Luo et al., 2023; Tincopa and Bouazza, 2021). Therefore, both temperature and moisture variation are key environmental factors that must be considered when evaluating the performance of dredged soil in marine applications (Anjana et al., 2023; Bai et al., 2025). While laboratory tests have confirmed the effectiveness of certain treatments and mixtures, studies incorporating both temperature and drying–wetting effects remain limited (Francey and Rowe, 2023; Onyekwena et al., 2024). The development of advanced testing systems capable of simulating these environmental conditions offers a valuable opportunity to accurately assess the shear strength of dredged soil and support the rational design of marine engineering facilities.
Building predictive models from experimental data is a common method to extend test findings while overcoming constraints like high costs, labor intensity, and the need for specialized equipment (Cavalcante and Mascarenhas, 2021; Chao et al., 2023a). However, the shear strength of dredged soil is affected by various factors, including environmental conditions like temperature and drying–wetting cycles, as well as engineering parameters such as initial density and stress state (Cui et al., 2024; Schjønning et al., 2020; Yavari et al., 2016). The nonlinear interactions among these variables make it difficult to construct accurate empirical formulas using traditional statistical methods (Chao and Fowmes, 2021; Dong, 2020). In recent years, machine learning has garnered widespread attention in environmental engineering due to its powerful capabilities in modeling complex nonlinear relationships (Jiang et al., 2023; Liang et al., 2023). Nevertheless, its application to dredged soil strength prediction remains limited, and most existing models are overly simplified (Shiuly et al., 2022). Therefore, more advanced methods—particularly ensemble techniques like Adaptive Boosting combined with Backpropagation Artificial Neural Networks (BAANN)—present strong potential for improving prediction accuracy. However, due to the redundancy and noise inherent in high-dimensional experimental datasets, even advanced models like BAANN may suffer from reduced generalization performance and unstable learning outcomes (Chao et al., 2023a). To address this challenge, the Logical Development Algorithm (LDA), a recent feature extraction method capable of maximizing class separability and dimensionality reduction, is introduced into the modeling framework (Chao et al., 2024a; Chao et al., 2024b). By preprocessing input features through LDA, the model can focus on the most relevant variables, thereby enhancing learning efficiency and robustness (Chao et al., 2023b). The hybrid LDA-BA-ANN model thus combines the strengths of statistical dimensionality reduction and adaptive nonlinear learning, providing a more reliable and interpretable tool for predicting the strength behavior of dredged soils under complex conditions.
The performance of machine learning models heavily depends on hyperparameter selection (Shi et al., 2023; Thomoglou et al., 2020). Before modeling, effective hyperparameter optimization is essential to ensure reliable results (Lazaridis and Thomoglou, 2024; Thomoglou and Karabinis, 2021; Wang et al., 2024). Commonly used algorithms like Particle Swarm Optimization (PSO) and Genetic Algorithm (GA) have been widely implemented, but are often hindered by issues such as low computational efficiency and entrapment in local optima (Wang et al., 2022). To address these drawbacks, Chengyi et al. (2000) introduced a novel heuristic optimization method known as the Logical Development Algorithm (LDA), which accelerates optimization by parallelizing similarity and dissimilarity computations while preserving original data structures. Studies have confirmed that LDA surpasses traditional optimization methods in boosting the accuracy and performance of machine learning models (Chao et al., 2024a; Xu et al., 2024). However, its use in estimating the shear strength of dredged soil has not been explored before.
In this study, 1,600 direct shear tests were conducted with varying parameters including initial density (7–10 kN/m3), number of drying–wetting cycles (0–10), temperature (10°C–90°C), normal pressure (50–200 kPa), and shear rate (1–5 mm/min), thereby establishing a comprehensive experimental database. Based on this, an LDA-optimized BAANN model was developed to accurately predict the shear strength of dredged soil. To validate its robustness, additional models were built, including LDA-tuned ANN and SVM models, as well as GA- and PSO-tuned BAANN models. A sensitivity analysis was performed using the proposed model, and an analytical formula was derived to facilitate practical application by engineers without machine learning expertise. The LDA-optimized BAANN model provides a reliable and efficient tool for estimating the shear strength of dredged soil, enhancing the design and safety of marine engineering facilities and post-treatment applications on sealed sites.
2 Laboratory tests
2.1 Experimental apparatus
The custom-built large-scale temperature-controlled shear apparatus used in this study is composed of an internal shear system enclosed within an external temperature regulation chamber, as depicted in Figure 1. The apparatus is capable of maintaining a constant temperature environment ranging from −50°C to 200°C for durations up to 7 days. Utilizing this system, a series of temperature-controlled shear tests were conducted on dredged soil to evaluate its mechanical behavior under varying thermal conditions.
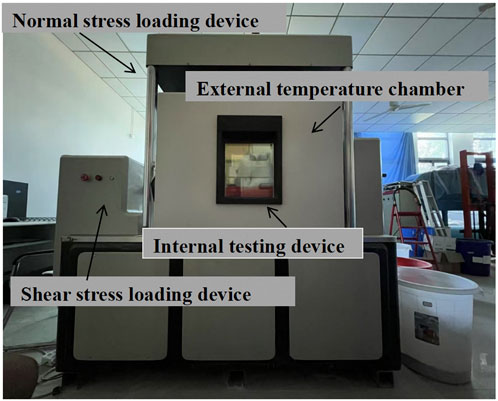
Figure 1. The self-developed large temperature-controlled shear apparatus.
2.2 Test materials
The dredged soil sample used in this study was freshly obtained and initially sieved to remove large impurities such as wood fragments, plastics, and paper, ensuring its suitability for subsequent geotechnical testing.
2.3 Experimental procedure
In this study, a total of 1,600 shear tests were carried out using a custom-designed shear apparatus. The system comprises upper and lower shear compartments, each with internal dimensions of 300 mm × 300 mm × 200 mm, forming a 300 mm × 300 mm shearing interface. The experimental procedure began with filling the lower shear box in four compacted layers (each 25 mm thick) of dredged soil, followed by installation and filling of the upper box using the same method. Each layer was tamped 16 times to ensure consistency, and the initial density of the soil was controlled by adjusting the total mass to achieve target densities of 7, 8, 9, and 10 kN/m3.
Upon completion of soil preparation, the shear box assembly was sealed within the external temperature-controlled chamber, where internal temperatures were adjusted to 10 °C, 30 °C, 50 °C, 70 °C, or 90 °C, depending on the test condition. The upper shear box was fixed, while the lower box was horizontally displaced to apply shearing along the interface, with displacement controlled at rates of 1, 2, 3, and 4 mm/min up to 55 mm. Simultaneously, vertical normal stress of 50, 100, 150, or 200 kPa was applied via the top loading plate.
To simulate environmental cycles, a drying–wetting system was incorporated. This involved submerging the sample in a surrounding water bath for 30 min, followed by a 30-min drying phase under target temperature conditions. The number of cycles was set to 0, 1, 2, 3, or 4. After completing the cycles, monotonic undrained shear testing was initiated. Throughout the process, shear force and displacement were recorded at 9-s intervals, with a total of 1,000 data points collected per test. Details of the testing program are summarized in Table 1.
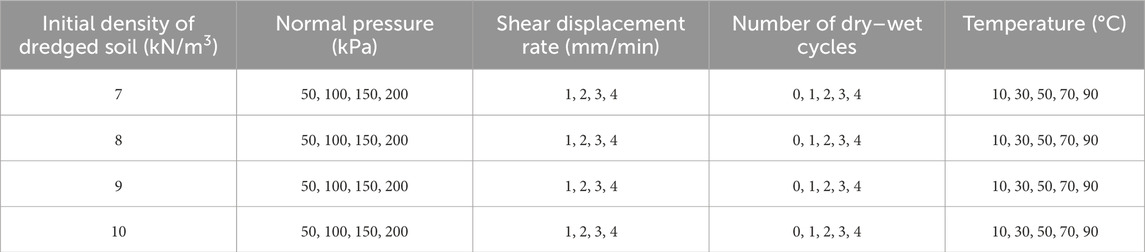
Table 1. The experimental scheme.
To ensure reproducibility of the experimental results, additional details regarding the shear testing procedure are provided as follows. Prior to shearing, a consolidation phase was applied under the designated normal stress for a duration of 30 min to allow soil particles to stabilize under load. All shear tests were conducted under undrained conditions, with no drainage permitted during the shearing process. It should be noted that pore water pressure was not directly measured or controlled, as the study focused primarily on evaluating the total stress response of the dredged soil under varying temperature and loading conditions. These test settings are consistent with practices adopted in similar temperature-controlled shear studies and provide a practical representation of field behavior in reclamation applications.
3 Machine learning algorithms
This study adopts three representative machine learning methods—Artificial Neural Network (ANN), support vector machines (SVM), and an enhanced hybrid model (BA-ANN)—to predict the mechanical behavior of dredged soil. To improve prediction accuracy and model performance, three optimization techniques are respectively integrated: Particle Swarm Optimization (PSO) is used to fine-tune the SVM model, Genetic Algorithm (GA) is applied to improve the BA-ANN framework, and Logical Development Algorithm (LDA) is utilized as a feature extraction and dimensionality reduction step for the ANN. A brief overview of these algorithms and their implementation strategies is presented below to clarify their roles and interrelations in the modeling framework. The LDA-BAANN model is shown in Figure 2.
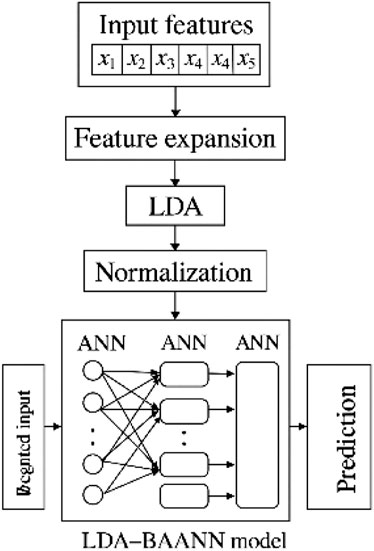
Figure 2. LDA-BAANN model.
3.1 ANN
Typically, the ANN model consists of hidden, input, and output layers (Chang and Lin, 2011; Moayedi and Jahed Armaghani, 2018; Yusof et al., 2014). In this study, the model’s layout is designed such that the variety of joints in the output and input layers directly matches the quantity of output and input variables. Specifically, there are five input variables and one output variable. The buried layer joint number (4) was found using the exhaustive method. The activation function of the developed ANN model was Levenberg-Marquardt Backpropagation Algorithm (LMBA).
3.2 SVM
SVM is adept at leveraging a modest dataset to execute regression analyses (Schölkopf and Smola, 2002; Smola and Schölkopf, 2004). Furthermore, SVM is capable of employing kernel functions to map specimens from a lower-dimensional space into a higher-dimensional one. This mapping process facilitates the conversion of nonlinear issues into linear ones, thereby enhancing the tractability of complex problems (Najjar et al., 2023; Zhang et al., 2023).
3.3 BA-ANN
The BA-ANN model is an ensemble learning approach that integrates multiple Artificial Neural Networks (ANNs) with identical architectures based on the principle of Bootstrap Aggregating, commonly known as Bagging (Kohestani et al., 2015; Pokharel et al., 2023). In this study, each base learner within the ensemble adopts the same network structure as outlined in the previously described ANN configuration (Zhao et al., 2023). By training these models on different resampled subsets of the original dataset and aggregating their predictions, the BA-ANN framework enhances model robustness and reduces overfitting. This method offers several advantages, including ease of implementation, reduced computational burden, high predictive accuracy, and strong generalization performance.
Comprehensive details regarding the configurations of the developed models are provided in Table 2.
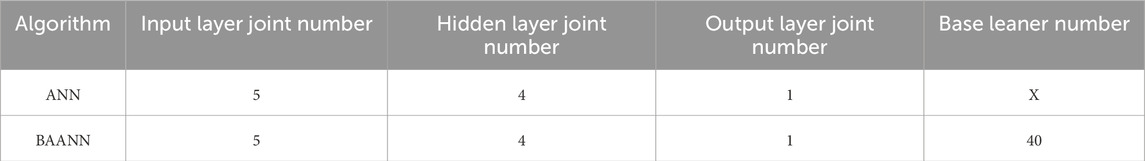
Table 2. The configurations for the adopted algorithms.
3.4 GA and PSO
Both of GA and PSO are heuristic population optimization algorithm. GA was constructed based on the principles of natural evolution (Kennedy and Eberhart, 1997). GA performs optimization by employing the fundamental activities of selection, crossover, and mutation. PSO originates from bird predation behavior. In PSO, the population’s particles denote potential solutions, with their velocities continually refined to ascertain the optimal solution for the given problem (Hogg et al., 2013).
4 Hyperparameters optimization
This study employs Genetic Algorithm (GA), Particle Swarm Optimization (PSO), and Logical Development Algorithm (LDA) to optimize the hyperparameters of the proposed machine learning models. The root means square error (RMSE), defined in Equation 1, serves as the fitness function guiding the optimization. Given that GA and PSO optimization techniques are well-established and extensively documented in the literature, this paper omits detailed descriptions of their operational mechanisms. The following is the general optimization procedure of LDA: (1) Generating individuals representing different hyperparameter values randomly. (2) Evaluating the fitness function (RMSE) of the individuals by adopting the machine learning models by adopting the k-CV approach (k = 10) and the training datasets. (3) Classifying the individuals as superior (Low RMSE value) and temporary (High RMSE value) based on the RMSE value. (4) By assigning persons with higher authority and individuals with temporary roles as centers, additional individuals are generated near each center to create superior and transitory subgroups accordingly. (5) Conducting similar taxi operations on the subgroups up to their maturity (The subgroup’s RMSE value is stable for continuous six iteration). (6) Assigning the RMSE value of the individuals at the center as the RMSE value of the relevant subgroup. (7) Conducting the dissimilation operation including replacing, abandoning, and supplying subgroups, and releasing individuals of the deserted subgroups. (8) Implementing similar taxi operation on the provided subgroups. (9) Continue iterating steps (4) to (8) until the RMSE of the provided subgroups is lower compared to that of the superior subgroups. (10) The individual positioned centrally within the superior subgroup, characterized by the lowest RMSE value, is deemed to be the globally optimal solution. (11) Using the hyperparameter value of the global best individual as the initial value for the proposed machine learning method.
where n denotes number of samples,
The control parameters for LDA, GA, and PSO are presented in Table 3. Additionally, Table 4 displays the optimization hyperparameter and the corresponding ranges for the optimization process. Table 5 presents five inputs and one output.
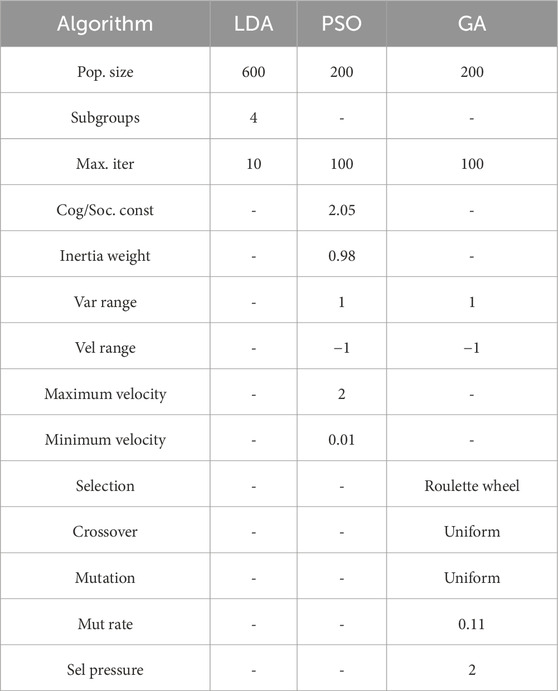
Table 3. The control variables for the optimization algorithm.
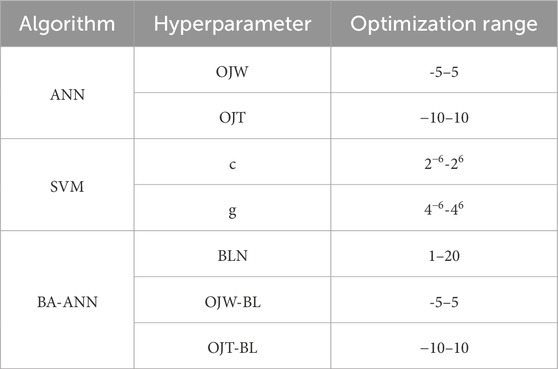
Table 4. The optimization hyperparameters.
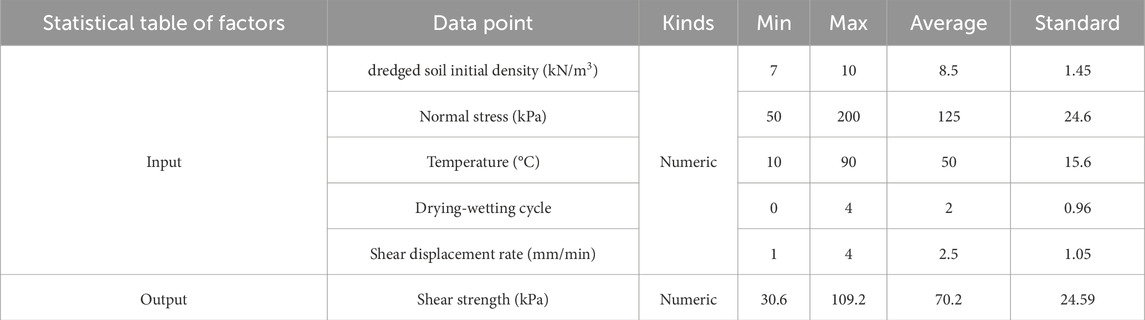
Table 5. The statistics.
4.1 Database construction and preprocessing
To facilitate the application of machine learning techniques, a structured dataset comprising 1,600 distinct records was compiled based on experimental observations. Among these, 1,280 samples (80%) were randomly allocated for algorithm training, and the remaining 320 samples (20%) were reserved for testing to evaluate model accuracy. Each entry in the dataset includes five influencing parameters: normal stress (P), dredged soil’s initial dry density (I), ambient temperature (T), number of drying-wetting cycles (D), and shear displacement rate (R). The predicted output is the shear strength (S) of the dredged soil. As depicted in Figure 3, the distribution of these input features is presented graphically, with the x-axis denoting the value ranges of each parameter and the y-axis showing how frequently each value appears in the dataset.
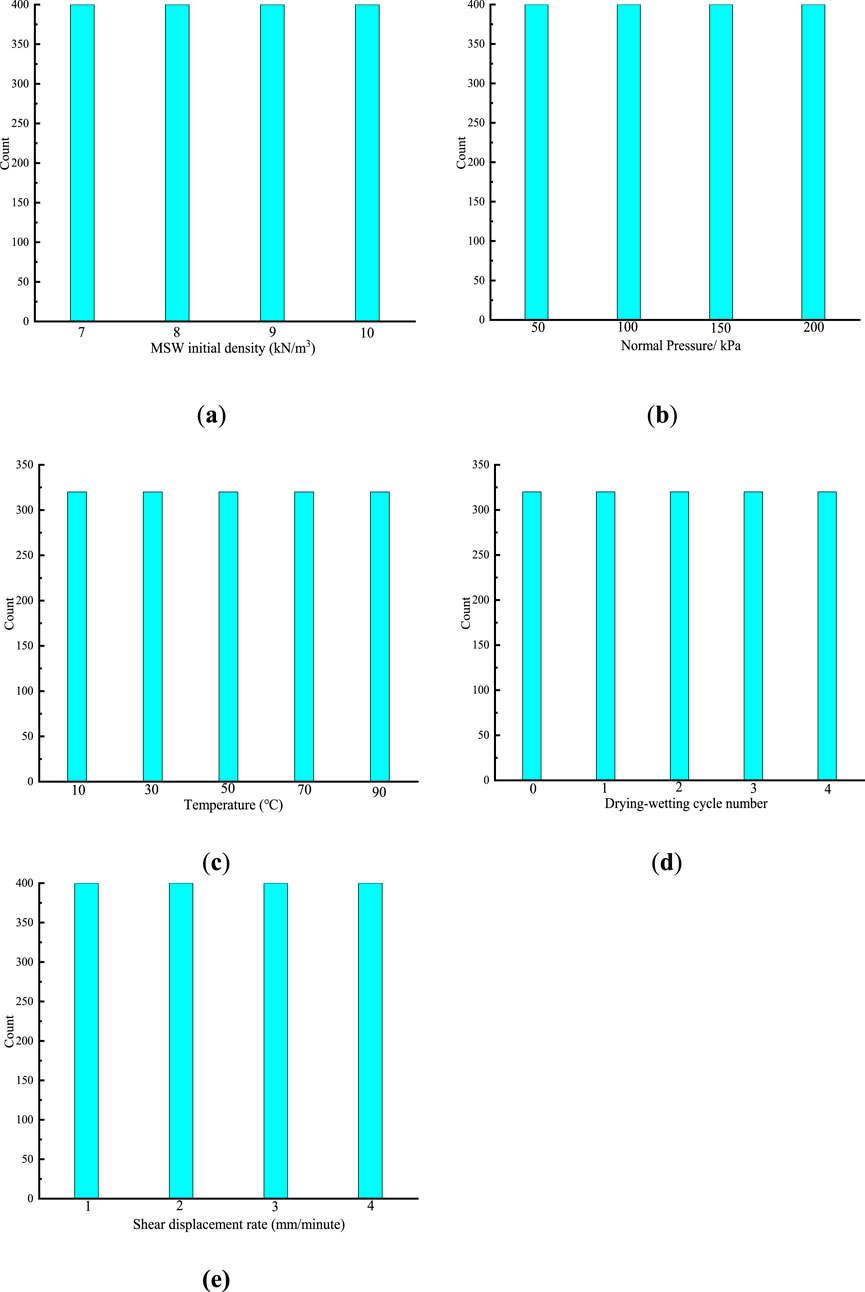
Figure 3. Data distributions for the database: (a) dredged soil initial density; (b) Normal Pressure; (c) Temperature; (d) Drying-wetting cycle number; (e) Shear displacement rate.
Prior to model training, the dataset was randomly split into training and testing subsets. To prevent data leakage and ensure unbiased model evaluation, normalization was performed exclusively on the training data. Specifically, for each input feature, the mean and standard deviation were computed from the training subset, and these statistics were used to standardize the training data to zero mean and unit variance. Subsequently, the testing data were normalized using the same training-derived parameters, without recalculating statistics from the test set. This approach guarantees that no information from the test set influences the model training or normalization process, thereby maintaining the integrity of model validation.
MATLAB was used to create the algorithms for the purpose of the research. As the normalization equation given in Equation 2 illustrates, standardizing multiple dimensions of the inputs and outputs is essential before beginning machine learning modeling in order to improve the projected accuracy and effectiveness of the machine learning methods.
where,
4.2 Performance evaluating approaches
To assess the predictive performance of the developed machine learning models, three evaluation metrics were used:
(i) Root Mean Square Error (RMSE), defined in Equation 1, measures the standard deviation of the differences between predicted and actual values. A lower RMSE indicates higher model accuracy.
(ii) Coefficient of Determination (R2), defined in Equation 3, evaluates the strength and direction of the linear relationship between predicted and observed values. R2 ranges from −1 to 1, where −1 and 1 represent perfect negative and positive correlations, respectively (Das and Basudhar, 2006; Zheng H. et al., 2024). The formula for Mean Absolute Percentage Error (MAPE) is given in Equation 4.
5 Predicting performance
5.1 Results for hyperparameter optimization
Figure 4 illustrates the detailed procedure of tuning the hyperparameters for the BA-ANN, ANN, and SVM models by leveraging the Logical Development Algorithm (LDA). This optimization process involves selecting the most relevant input features through dimensionality reduction, which not only enhances the efficiency of the models but also improves their predictive accuracy. During this step, LDA reduces redundancy among features and highlights those variables that contribute most significantly to the output. Subsequently, the refined feature sets are fed into the respective machine learning models, where hyperparameters such as learning rates, network architecture, and kernel parameters are systematically adjusted. The goal is to identify the optimal configuration that minimizes the prediction error, measured here primarily by RMSE, ensuring robust and reliable model performance.
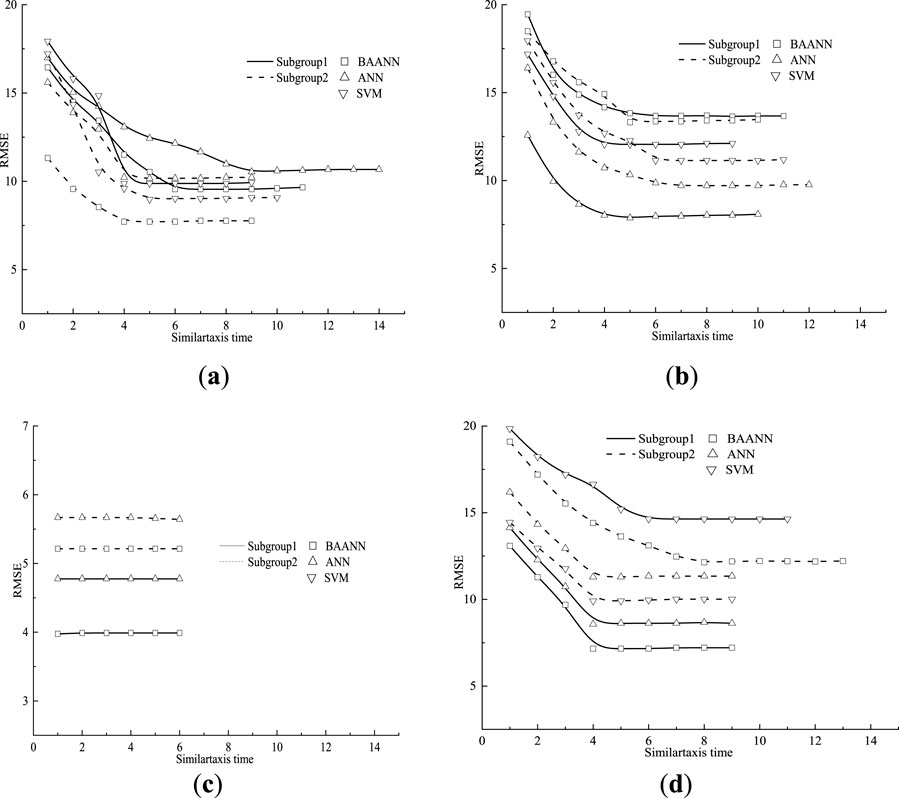
Figure 4. The variation trends of RMSE throughout the similar taxis procedure are categorized as follows: (a) RMSE values of the initial superior subgroups; (b) RMSE values of the initial temporary subgroups; (c) RMSE values of the superior subgroups after undergoing dissimilation operations; (d) RMSE values of the temporary subgroups following dissimilation operations.
As shown in Figure 4, the hyperparameter tuning process using LDA for BA-ANN, ANN, and SVM models starts with an initial similar taxis operation that mimics early foraging behavior. At this stage, the RMSE values of both the initial superior and temporary subgroups significantly decrease and stabilize after six consecutive iterations, indicating subgroup maturation. Following this, a dissimilation operation takes place, during which superior subgroups exhibiting relatively higher RMSE values are replaced by provisional subgroups with lower RMSE values. Additionally, members of the remaining provisional subgroups are freed to form new temporary subgroups.
The second similar taxis operation then ensues, further refining the subgroups by substituting those with higher RMSE values with ones showing improved (lower) RMSE. Afterward, RMSE values between superior and temporary subgroups are compared. As Figures 4c,d illustrate, post this phase, all superior subgroups have RMSE values lower than their temporary counterparts, eliminating the need for additional dissimilation steps. Ultimately, the hyperparameters of the core individuals within the best-performing subgroup—those with the minimal RMSE—are selected as the optimal baseline settings for the machine learning models.
For comparison, Figure 5 presents the optimization processes of the BA-ANN model using traditional algorithms GA and PSO, facilitating an evaluation of LDA’s effectiveness against classical methods.
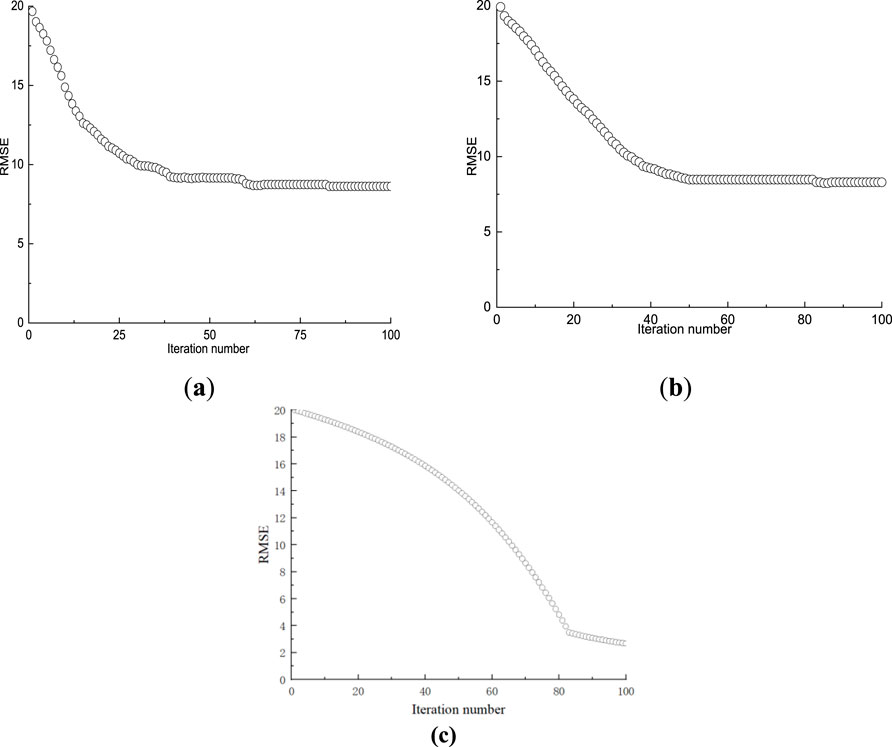
Figure 5. Optimization processes by GA and PSO: (a) GA; (b) PSO; (c) LDA.
Figure 5 illustrates that during the optimization processes of both GA and PSO, the RMSE value of the BA-ANN model exhibits a gradual decline as the repetition number increases. Relative to the RMSE value prior to optimization, a notably substantial reduction is observed in the optimized RMSE value.
Figure 5 illustrates the optimization process of the LDA method applied to the BA-ANN model. Initially, the RMSE value decreases slowly during the early iterations, reflecting a gradual improvement in model performance. As the optimization proceeds, the decline rate accelerates significantly, indicating that LDA efficiently explores the solution space and fine-tunes model parameters. The RMSE rapidly converges toward its minimum value, stabilizing near 3.97 around iteration 82. This demonstrates that LDA achieves faster and more effective optimization compared to GA and PSO, which reached their optimal RMSE values of 8.62 and 8.23 respectively at much later iterations (iteration 83). The learning curve clearly highlights the superior convergence speed and optimization quality of LDA in enhancing the BA-ANN model.
Upon evaluating the optimization effectiveness of LDA in comparison to traditional methods, it is evident that LDA outperforms GA and PSO in terms of both optimization efficacy and component ratio. During the process of optimizing the LDA, the BAANN model attained its optimal RMSE value at iteration 17. In contrast, the optimal RMSE value for the GA and PSO optimization procedures was achieved at iteration 83. In terms of optimization effects, the BAANN model, optimized using LDA, produces an optimal RMSE value of 3.97. On the other hand, the ideal RMSE values for GA and PSO are 8.62 and 8.23, respectively.
5.2 Predicting performance
Figure 6–9 illustrate the effectiveness of various machine learning methods in accurately predicting outcomes based on both training and validation data sets. These visualizations highlight how well the models generalize from learned patterns to unseen data, reflecting their overall reliability and robustness in the prediction task.
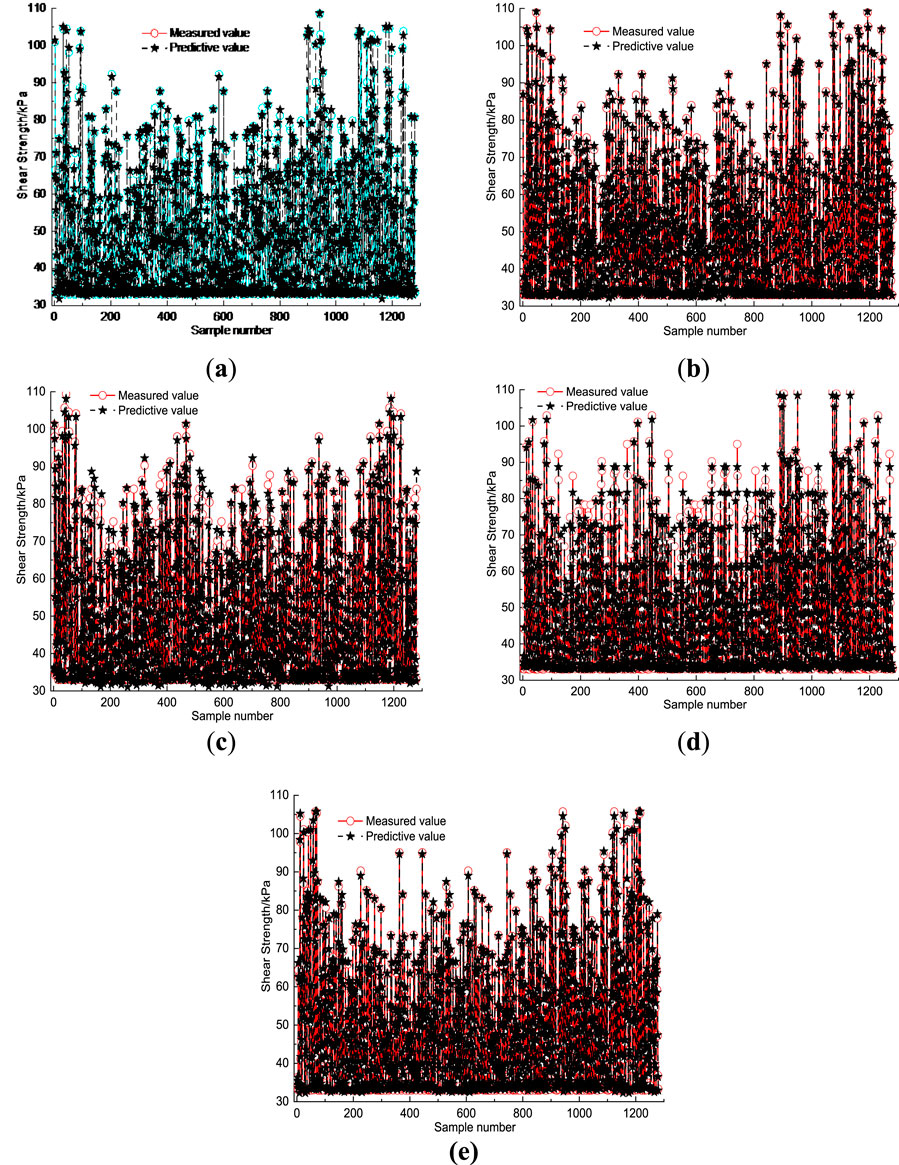
Figure 6. The predictive results on training dataset: (a) LDA-ANN; (b) LDA-SVM; (c) GA-BAANN; (d) PSO-BAANN; (e) LDA-BAANN.
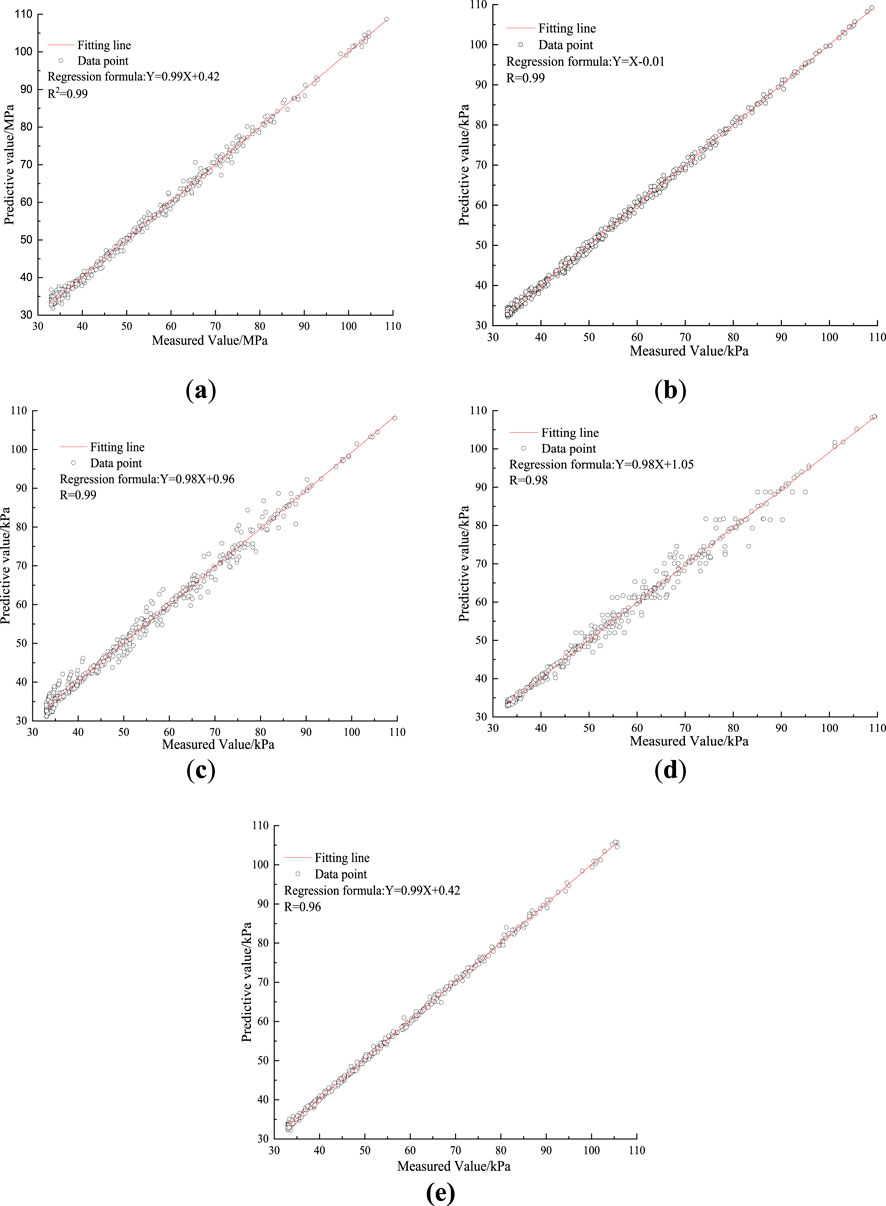
Figure 7. The R2 value for the algorithms on training datasets: (a) LDA-ANN; (b) LDA-SVM; (c) GA-BAANN; (d) PSO-BAANN; (e) LDA-BAANN.
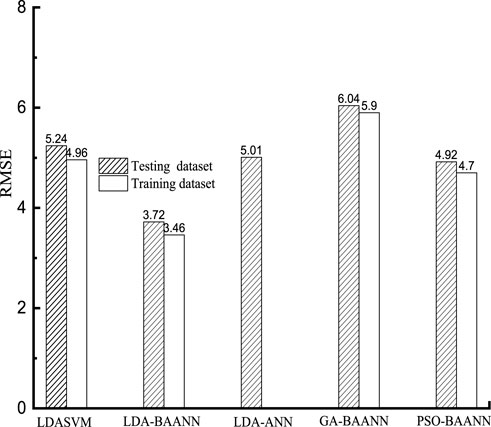
Figure 8. The models’ RMSE scores.
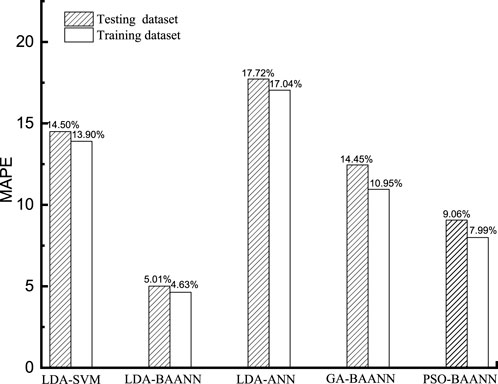
Figure 9. The models’ MAPE scores.
Figures 6–9 reveal that among the five evaluated algorithms, the BAANN model optimized by LDA exhibits the superior predictive capability on the training datasets. This method achieves the highest accuracy, reflected by an RMSE of 3.46, a MAPE of 4.63%, and a correlation coefficient (R) of 0.99, indicating a very close fit between predicted and observed values. The BAANN model fine-tuned with PSO ranks second in performance, demonstrating relatively strong prediction results. In contrast, the BAANN model optimized via GA, as well as the ANN and SVM models tuned using LDA, show noticeably lower prediction accuracies, confirming that the combination of LDA with BAANN provides a distinct advantage in this context.
Figures 10, 11 present a comparison of five machine learning models evaluated on the testing datasets. The BAANN model enhanced by LDA optimization consistently delivers the most accurate predictions, outperforming all other methods. Its results show an RMSE of only 3.72, a MAPE close to 5.01%, and a correlation coefficient reaching 0.99, reflecting excellent agreement with the true values. Among the other models, the BAANN optimized with PSO achieves relatively better outcomes, yet it still lags behind the LDA-based approach.
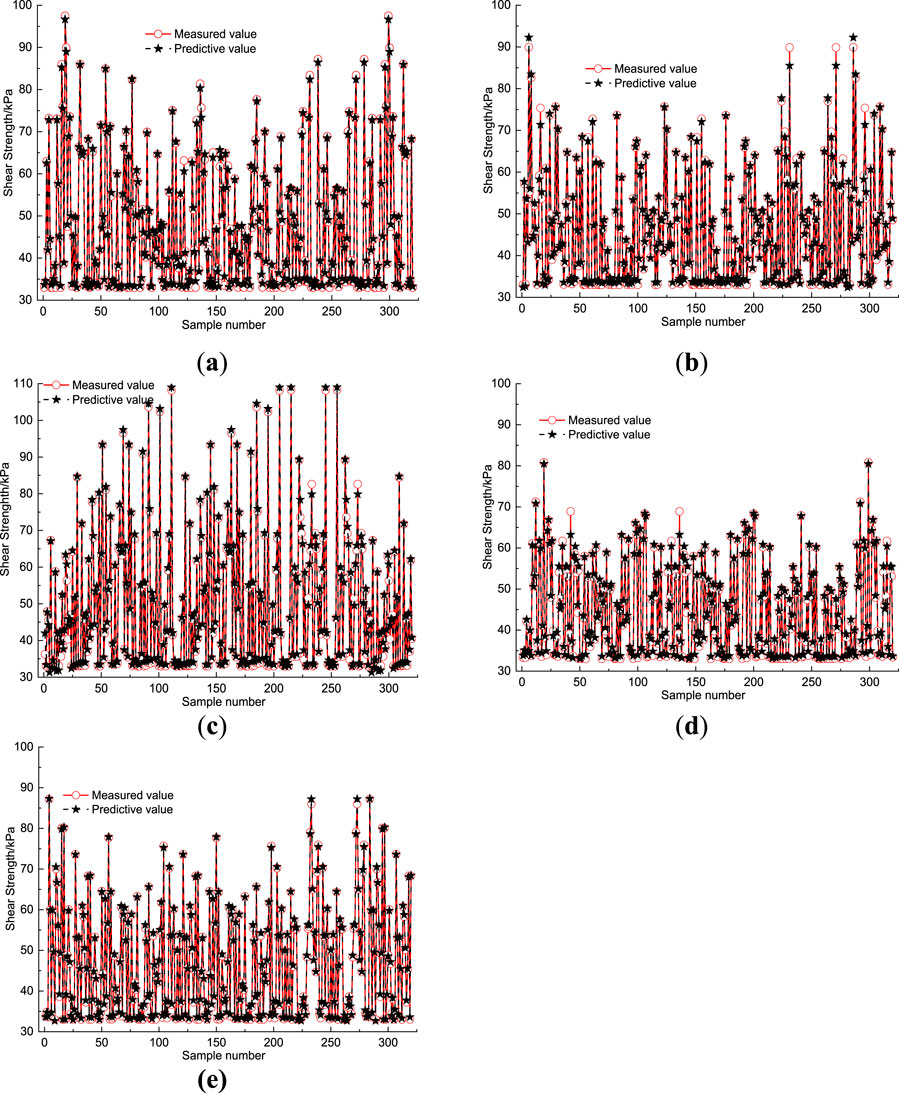
Figure 10. The predictive results on testing dataset: (a) LDA-ANN; (b) LDA-SVM; (c) GA-BAANN; (d) PSO-BAANN; (e) LDA-BAANN.
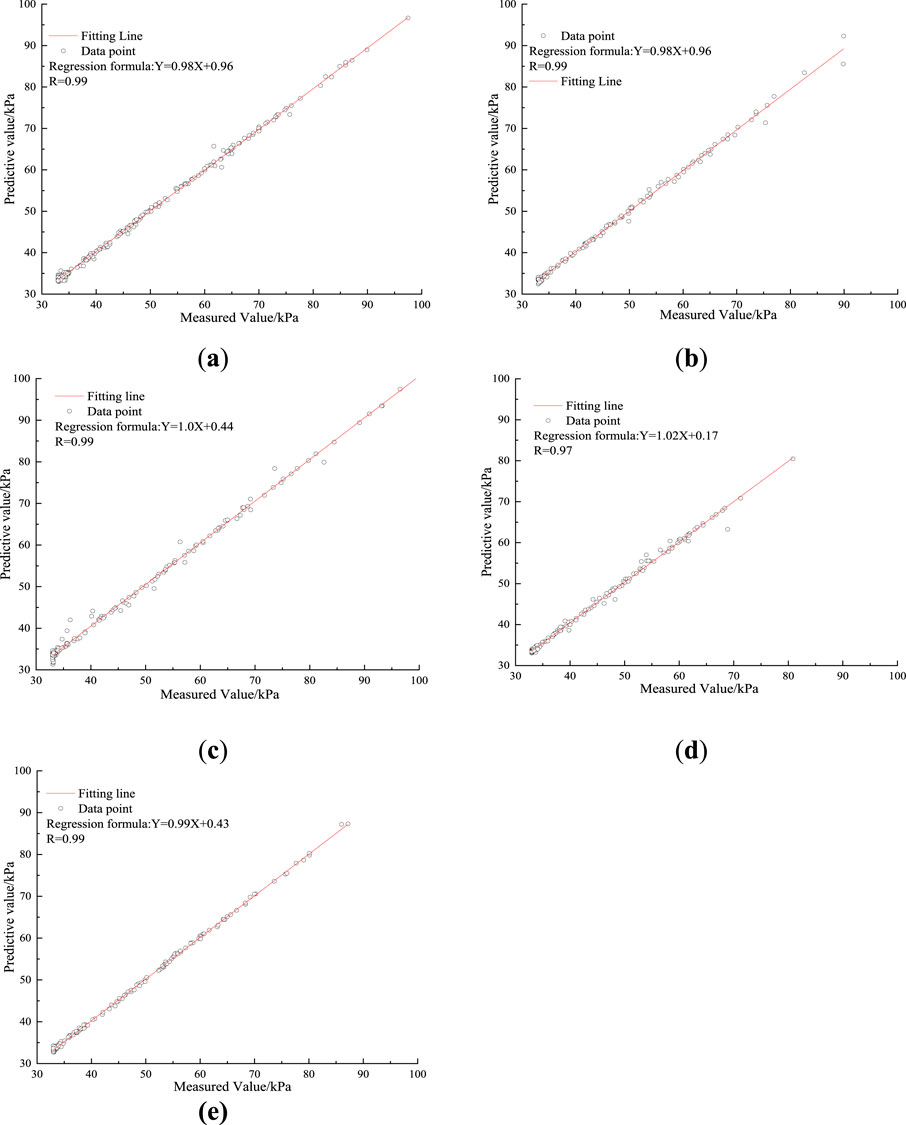
Figure 11. The R value for the algorithms on testing datasets: (a) LDA-ANN; (b) LDA-SVM; (c) GA-BAANN; (d) PSO-BAANN; (e) LDA-BAANN.
Overall, the integration of LDA with BAANN yields a clear improvement over other optimization strategies such as GA and PSO, as well as alternative model architectures including ANN and SVM. This confirms that the LDA-optimized BAANN provides superior predictive capability for estimating shear strength in dredged soils. Notably, when the same optimization algorithm is applied, BAANN demonstrates stronger forecasting ability than ANN and SVM, highlighting the model’s robustness and effectiveness.
5.3 Influence factor analysis
In this section, the LDA-optimized BAANN model is utilized to perform a sensitivity analysis aimed at identifying the influence of each input variable on the shear strength prediction of dredged soil. Since the BAANN framework integrates several ANN models, the relative contribution of each input feature is quantified using Garson’s method, which is mathematically described by Equation 5 (Kanungo et al., 2014; Zheng et al., 2024a; Zheng et al., 2024b). Thus, the mean relative importance of each input variable, derived via Garson’s Algorithm from individual ANN models, reflects the overall influence of these features in the integrated BAANN model. This aggregated measure reflects how influential each input factor is in determining the model’s predictions. The detailed distribution of these relative importance values for all input variables is illustrated in Figure 9, providing clear insight into which features most strongly affect the shear strength estimation (Goh et al., 2005).
where
Understanding machine learning models is essential for transparency and wider acceptance. Feature importance analysis helps reveal the internal logic of these models by explaining how input variables influence predictions. Among interpretability methods, SHAP (Shapley Additive Explanations) is widely used. Based on game theory, SHAP assesses the contribution of each feature by considering all possible combinations and assigns a value that indicates its positive or negative effect on the prediction (Lundberg and Lee, 2017; Yang et al., 2025).
Figure 12 presents the five most influential features affecting the output of the LDA model, along with a brief analysis of their respective impacts. The pie chart illustrates the mean SHAP values for each feature, where a larger SHAP value denotes a stronger contribution to the model’s prediction. On the left, the bee swarm plot offers a more detailed visualization of feature effects. In this plot, the horizontal axis corresponds to the SHAP value, while the vertical axis represents the feature value. A high SHAP value combined with a high feature value suggests a positive correlation—larger feature values lead to higher predicted outputs. With a relative importance of 29.2%, normal pressure is shown to have the greatest influence on the shear strength of dredged soil, as illustrated in Figure 12. Next is temperature and dredged soil initial density, with percentages of 26.43% and 20.02% respectively. In contrast, the drying-wetting cycle number and shear displacement rate, which occupy 14.33% and 10.02% of the shear strength, respectively, have a negligible effect. The detailed mechanism please refers to the Section of “Discussion”.
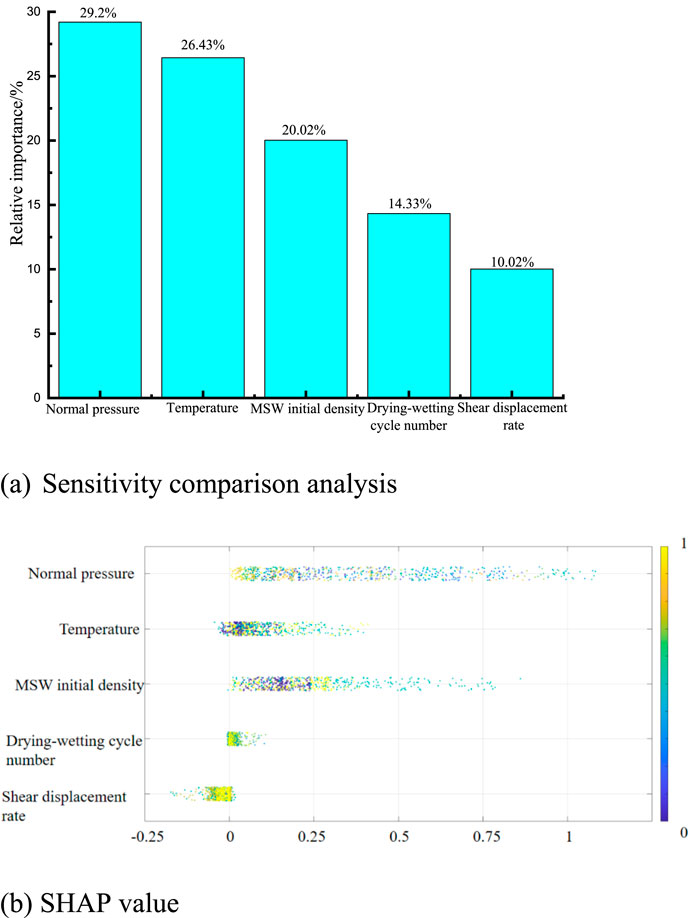
Figure 12. Relative significance for the input variables. (a) Sensitivity comparison analysis. (b) SHAP value.
6 Formulation of a mathematical model
From the previous analysis, it is evident that the LDA-optimized BAANN model can accurately predict the shear strength of dredged soil. However, the complexity inherent in machine learning models often poses challenges for practitioners who lack specialized expertise in this area. To bridge this gap, this section proposes an analytical expression derived from the LDA-tuned BAANN model to facilitate easier prediction of shear strength.
As noted earlier, the BAANN model is composed of multiple interconnected ANN models. The output of each ANN can be calculated using the associated node weights and biases, as formalized in Equation 6. By applying this equation alongside the average connection weights and biases listed in Table 6—which summarize the parameters of the ANN components within the BAANN framework—one can directly compute the predicted shear strength values generated by the LDA-BAANN mode (Yaashikaa et al., 2020).
where,
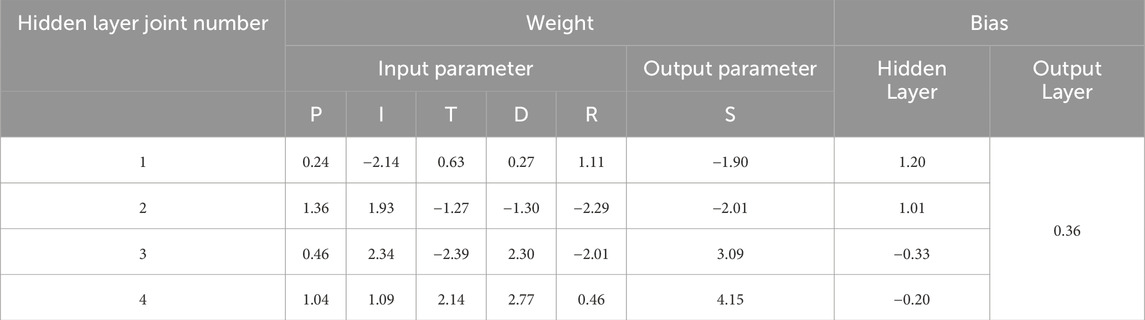
Table 6. Interlinking weights and biases in the developed LDA-BAANN model.
Equation 6 was used to derive the analytical formula for calculating the shear strength of concrete, which is presented in Equation 7.
where,
Among Equation 8:
Among Equation 9:
where,
In Equation 10:
where,
7 Experimental validation of the model’s predictive performance
The predicted shear strength of dredged soil from the proposed analytical formula and machine learning models was compared with experimental measurements to assess their accuracy. The verification process involved the following steps:.
(1) A comprehensive series of direct shear tests were carried out on dredged soil samples with controlled initial densities. These tests considered different numbers of drying-wetting cycles and were conducted under varying normal stresses, shear displacement rates, and temperatures. The key parameters of the soil samples and the experimental conditions are summarized in Table 7, which includes 32 distinct test cases.
(2) Shear strength values were calculated using Equation 7, which incorporates the physical properties of the soil samples and the test variables.
(3) The predicted shear strengths derived from the analytical formula were then compared with those obtained via the machine learning model. The comparison results are presented in Figure 13, demonstrating the accuracy and reliability of the proposed methods.

Table 7. Key parameters of the dredged soil samples and the testing conditions.
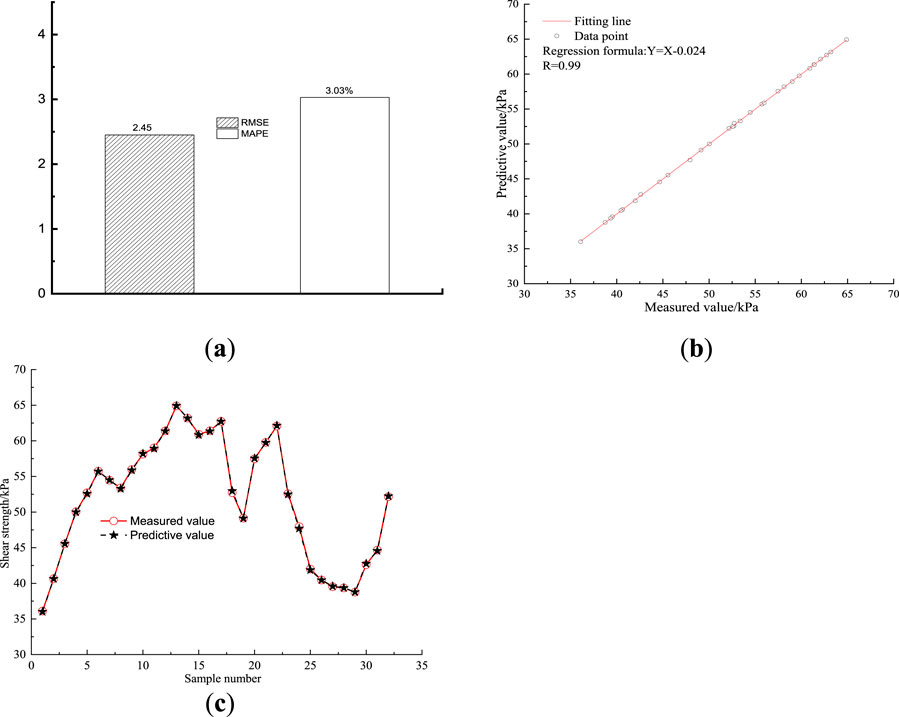
Figure 13. Validation results include: (a) MAPE and RMSE; (b) R values; (c) comparison of predicted and measured values.
As shown in Figure 13, the shear strength values predicted by the analytical formula closely match those measured through physical experiments on dredged soil samples. The comparison yields an RMSE of 2.45, a MAPE of 3.03%, and a correlation coefficient of 0.99, indicating a very strong consistency between predicted and observed results. These findings highlight the analytical formula’s effectiveness in capturing the key factors influencing shear strength, confirming its reliability and practical value for engineering assessments.
8 Discussion
The sensitivity analysis reveals a massive influence of normal pressure on the dredged soil shear strength, with a relative significance of 29.2%. This phenomenon can be attributed to the relatively loose structure of dredged soil (Fudala-Ksiazek et al., 2017). Normal pressure causes the loose dredged soil to be compressed, which is crucial for enhancing the shear strength of dredged soil. With the increase of normal pressure, the compaction degree of dredged soil rises, which significantly changes the shear strength of dredged soil. Thus, normal pressure ranks the most influence factor. Temperature also has remarkable impact on the shear strength of dredged soil, with the percentage of 26.43% (Tanguay-Rioux et al., 2022). This is because as aforementioned, dredged soil contains many thermal-softening materials, such as plastic, etc. In elevated temperature, the softening of dredged soil has adverse influence on its shear resistance, which results in the high relative significance of temperature (Velvizhi et al., 2020). In marine engineering reclamation projects, controlling the internal temperature of the fill body is of great importance, as it helps enhance the stability of engineering structures. The initial density of the dredged soil is also a critical factor affecting its shear strength, with a relative importance of 20.02%. This indicates that proper compaction of the dredged soil prior to reclamation can improve its shear strength to some extent, serving as an effective measure to increase the stability of the reclamation fill. In comparison, drying-wetting cycle number has relatively small effects on the shear strength of dredged soil, with the proportions of 14.33%. This can be explained by that the dredged soil is mainly produced in urban areas, which comprises less quantity of water-soluble materials and the component that occurs volumetric deformation when contacting with water, such as expansive clayey soil, etc. Thus, drying-wetting cycle number cannot significantly alter the structure of dredged soil to impact its shear strength. The marginal influence of shear displacement rate (10.02%) on the dredged soil shear strength can be attributed to the low Visco-plasticity of dredged soil, which indicates the time-dependent effect is insignificant when conducting pressure loading on dredged soil.
The research underscores the significantly greater optimization effectiveness and efficiency of LDA compared to GA and PSO. This is because LDA can implement the similar taxis and dissimilation operation. Firstly, the comparable taxis and assimilation operations can be implemented independently to enhance the optimization efficacy remarkably; Secondly, the similarity and alienation operations in LDA allow for the storage of multiple generations of subgroup evolutionary data, which contributes to a more robust and effective optimization process. Thirdly, the similar taxis and dissimilation procedures in LDA combine the advantages of powerful global and local search capabilities, leading to efficient and precise determination of alternative optimal solutions.
Looking ahead, this research needs to address two key areas for further development. First, since the composition of dredged soil in real-world projects is often complex and variable, future studies should aim to enrich the dataset by including more comprehensive soil properties. This expanded data will support the creation of machine learning models capable of delivering more accurate shear strength predictions tailored to practical engineering conditions. Second, the stress conditions experienced by dredged soil on-site are typically multifaceted. Therefore, conducting experiments that simulate diverse stress states is essential. The insights gained from these tests will help improve the dataset and enable the construction of machine learning algorithms better suited to predict shear strength under realistic loading scenarios.
The experimental data utilized in this study were generated under controlled laboratory conditions, which, while ensuring experimental precision and reproducibility, may limit the generalizability of the findings to complex field environments. This inherent limitation is explicitly acknowledged. To enhance the applicability of the proposed models in practical marine engineering contexts, future work should focus on validating these models with in-situ field data encompassing a broader spectrum of soil types and environmental conditions.
Our sensitivity analysis highlights the dominant influence of normal pressure on dredged soil shear strength, which accounts for approximately 29.2% of the total effect. This finding corroborates previous studies such as Fudala-Ksiazek et al. (2017), who emphasized that the inherently loose structure of dredged soils makes them highly sensitive to compression under normal loads. The increase in compaction degree with rising normal pressure enhances particle interlock and contact forces, thereby improving shear resistance. Our results extend this understanding by quantifying the relative importance of normal pressure under varied thermal and loading conditions.
Temperature also emerges as a key factor, contributing 26.43% to shear strength variation. This aligns well with the findings of Thomoglou and Karabinis (2021) and Velvizhi et al. (2020), which identified thermal softening of organic and plastic components within dredged soils as a mechanism that reduces shear resistance at elevated temperatures. Our study further emphasizes the critical need to control internal temperatures in reclamation fills to maintain structural stability, a consideration that has been relatively underexplored in prior work.
Conversely, the drying-wetting cycle and shear displacement rate showed comparatively minor influence (14.33% and 10.02%, respectively), differing somewhat from some previous reports on clayey soils where cyclic moisture changes or strain rates significantly affect strength (Tang et al., 2023). This discrepancy can be explained by the unique composition of urban dredged soils used in our study, which contain fewer water-sensitive expansive clays and have low Visco-plasticity, thereby diminishing the impact of these factors. Such nuanced understanding is essential for tailoring soil improvement strategies to specific dredged soil types.
From a practical standpoint, the pronounced effect of normal pressure and temperature informs design considerations in marine engineering. For instance, optimizing compaction protocols to achieve target densities can substantially enhance shear strength, improving fill stability. Additionally, monitoring and managing thermal regimes during and after reclamation can mitigate strength degradation due to thermal softening, contributing to safer and more durable marine infrastructure.
9 Conclusion
This research conducted 1,600 large direct shear tests on dredged soil in diverse test conditions. Based on the test findings, an extensive database was created, which served as a solid basis for the creation of an inventive LDA-tuned BAANN model that predicted the shear strength of dredged soil. The constructed LDA-tuned BAANN model considers crucial input parameters, including normal pressure, dredged soil initial density, temperature, drying-wetting cycle number, shear displacement rate. This is the primary occasion that the shear strength of dredged soil has been estimated using the LDA-tuned BAANN model. In order to assess and contrast the accuracy of the new approach, we built traditional machine learning algorithms like GA and PSO-optimized BAANN, LDA-optimized ANN, and SVM. Additionally, using the LDA-optimized BAANN algorithm, a sensitivity assessment was carried out to determine the relative significance of input factors on the shear strength of dredged soil (dredged soil). Additionally, a mathematical formula was created to allow machine learning specialists to estimate shear strength accurately. The main conclusions are as follows:
1. The proposed LDA-optimized BAANN model effectively and accurately predicts the shear strength of dredged soil.
2. Compared to GA and PSO, LDA shows superior optimization performance and efficiency.
3. Sensitivity analysis identifies normal stress, temperature, and initial density as key influencing factors, while shear displacement rate and drying–wetting cycles have relatively minor effects.
4. An explicit empirical formula for shear strength was established based on the optimized model, providing a reliable tool for engineering applications.
In conclusion, the accurate prediction of dredged soil shear strength remains a significant challenge due to the coupled influence of multiple factors and complex interaction mechanisms. However, the LDA-tuned BAANN model proposed in this study outperforms traditional machine learning methods in both modeling efficiency and predictive accuracy. Moreover, the LDA algorithm demonstrates superior optimization capabilities compared to GA and PSO. This model provides a robust theoretical foundation and technical support for the efficient evaluation of dredged soil properties and structural safety assessment in marine engineering, offering considerable research value and engineering application potential.
Data availability statement
The original contributions presented in the study are included in the article/supplementary material, further inquiries can be directed to the corresponding authors.
Author contributions
ZY: Writing – review and editing, Investigation, Data curation, Project administration, Validation, Methodology. KX: Project administration, Visualization, Methodology, Formal Analysis, Data curation, Conceptualization, Software, Writing – original draft. ZW: Project administration, Writing – review and editing, Investigation, Data curation, Formal Analysis, Methodology. HS: Conceptualization, Data curation, Validation, Supervision, Writing – review and editing, Funding acquisition, Resources, Methodology, Software. PC: Supervision, Validation, Conceptualization, Investigation, Writing – review and editing, Resources.
Funding
The author(s) declare that no financial support was received for the research and/or publication of this article.
Conflict of interest
Author HS was employed by Weifang Hydraulic Architectural Design and Research Institute Co., Ltd.
The remaining authors declare that the research was conducted in the absence of any commercial or financial relationships that could be construed as a potential conflict of interest.
Generative AI statement
The author(s) declare that no Generative AI was used in the creation of this manuscript.
Publisher’s note
All claims expressed in this article are solely those of the authors and do not necessarily represent those of their affiliated organizations, or those of the publisher, the editors and the reviewers. Any product that may be evaluated in this article, or claim that may be made by its manufacturer, is not guaranteed or endorsed by the publisher.
References
Anjana, R., Keerthana, S., and Arnepalli, D. N. (2023). Coupled effect of UV ageing and temperature on the diffusive transport of aqueous, vapour and gaseous phase organic contaminants through HDPE geomembrane. Geotext. Geomembranes 51 (2), 316–329. doi:10.1016/j.geotexmem.2022.11.005
Bai, J., Wang, C., Zhang, M., and Diao, Y. (2025). A review on drainage of dredged marine soils: advances and prospects. Mar. Georesources and Geotechnol. 43 (2), 260–270. doi:10.1080/1064119x.2024.2327079
Cavalcante, A. L. B., and Mascarenhas, P. V. S. (2021). Efficient approach in modeling the shear strength of unsaturated soil using soil water retention curve. Acta Geotech. 16 (10), 3177–3186. doi:10.1007/s11440-021-01144-6
Chang, C.-C., and Lin, C.-J. (2011). LIBSVM: a library for support vector machines. ACM Trans. intelligent Syst. Technol. (TIST) 2 (3), 1–27. doi:10.1145/1961189.1961199
Chao, Z., Wang, H., Hu, S., Wang, M., Xu, S., and Zhang, W. (2024d). Permeability and porosity of light-weight concrete with plastic waste aggregate: experimental study and machine learning modelling. Constr. Build. Mater. 411, 134465. doi:10.1016/j.conbuildmat.2023.134465
Chao, Z., Dang, Y., Pan, Y., Wang, F., Wang, M., Zhang, J., et al. (2023a). Prediction of the shale gas permeability: a data mining approach. Geomechanics Energy Environ. 33, 100435. doi:10.1016/j.gete.2023.100435
Chao, Z., and Fowmes, G. (2021). Modified stress and temperature-controlled direct shear apparatus on soil-geosynthetics interfaces. Geotext. Geomembranes 49 (3), 825–841. doi:10.1016/j.geotexmem.2020.12.011
Chao, Z., Li, Z., Dong, Y., Shi, D., and Zheng, J. (2024a). Estimating compressive strength of coral sand aggregate concrete in marine environment by combining physical experiments and machine learning-based techniques. Ocean. Eng. 308, 118320. doi:10.1016/j.oceaneng.2024.118320
Chao, Z., Liu, H., Wang, H., Dong, Y., Shi, D., and Zheng, J. (2024b). The interface mechanical properties between polymer layer and marine sand with different particle sizes under the effect of temperature: laboratory tests and artificial intelligence modelling. Ocean. Eng. 312, 119255. doi:10.1016/j.oceaneng.2024.119255
Chao, Z., Shi, D., Fowmes, G., Xu, X., Yue, W., Cui, P., et al. (2023b). Artificial intelligence algorithms for predicting peak shear strength of clayey soil-geomembrane interfaces and experimental validation. Geotext. Geomembranes 51 (1), 179–198. doi:10.1016/j.geotexmem.2022.10.007
Chao, Z., Shi, D., and Zheng, J. (2024c). Experimental research on temperature–dependent dynamic interface interaction between marine coral sand and polymer layer. Ocean. Eng. 297, 117100. doi:10.1016/j.oceaneng.2024.117100
Chao, Z., Zhou, J., Shi, D., and Zheng, J. (2025). Particle size effect on the mechanical behavior of coral sand–geogrid interfaces. Geosynth. Int., 1–17. doi:10.1680/jgein.24.00143
Chengyi, S., Yan, S., and Keming, X. (2000). “Mind-evolution-based machine learning and applications,” in Proceedings of the 3rd World Congress on Intelligent Control and Automation (Cat. No. 00EX393), Hefei, China, 26 June 2000 - 02 July 2000 (IEEE), 112–117.
Cui, J., Jin, Y., Jing, Y., and Lu, Y. (2024). Elastoplastic solution of cylindrical cavity expansion in unsaturated offshore island soil considering anisotropy. J. Mar. Sci. Eng. 12 (2), 308. doi:10.3390/jmse12020308
Das, S. K., and Basudhar, P. K. (2006). Undrained lateral load capacity of piles in clay using artificial neural network. Comput. Geotechnics 33 (8), 454–459. doi:10.1016/j.compgeo.2006.08.006
Dong, Y. (2020). Reseeding of particles in the material point method for soil–structure interactions. Comput. Geotechnics 127, 103716. doi:10.1016/j.compgeo.2020.103716
Dong, Y., Wang, D., and Randolph, M. F. (2017). Investigation of impact forces on pipeline by submarine landslide using material point method. Ocean. Eng. 146, 21–28. doi:10.1016/j.oceaneng.2017.09.008
Fan, N., Jiang, J., Nian, T., Dong, Y., Guo, L., Fu, C., et al. (2023). Impact action of submarine slides on pipelines: a review of the state-of-the-art since 2008. Ocean. Eng. 286, 115532. doi:10.1016/j.oceaneng.2023.115532
Francey, W., and Rowe, R. K. (2023). Importance of thickness reduction and squeeze-out Std-OIT loss for HDPE geomembrane fusion seams. Geotext. Geomembranes 51 (1), 30–42. doi:10.1016/j.geotexmem.2022.09.003
Fudala-Ksiazek, S., Pierpaoli, M., and Luczkiewicz, A. (2017). Fate and significance of phthalates and bisphenol A in liquid by-products generated during municipal solid waste mechanical-biological pre-treatment and disposal. Waste Manag. 64, 28–38. doi:10.1016/j.wasman.2017.03.040
Goh, A. T., Kulhawy, F. H., and Chua, C. (2005). Bayesian neural network analysis of undrained side resistance of drilled shafts. J. geotechnical geoenvironmental Eng. 131 (1), 84–93. doi:10.1061/(asce)1090-0241(2005)131:1(84)
Gong, S., Feng, S., Wang, S., Yu, L., Chen, Y., and Xu, Q. (2024). Strength and microstructural properties of silt soil cured by lime-activated fly ash-GGBS under different curing temperatures. Sci. Rep. 14 (1), 6966. doi:10.1038/s41598-024-57741-4
Hogg, R. V., McKean, J. W., and Craig, A. T. (2013). Introduction to mathematical statistics. Delhi: Pearson Education India.
Jiang, Y., Huang, J., Luo, W., Chen, K., Yu, W., Zhang, W., et al. (2023). Prediction for odor gas generation from domestic waste based on machine learning. Waste Manag. 156, 264–271. doi:10.1016/j.wasman.2022.12.006
Jung, Y.-B., Yang, K.-H., Lee, Y.-J., and Kim, H.-K. (2024). Carbonation testing of lightweight concrete using expanded bottom ash and dredged soil aggregates. Constr. Build. Mater. 444, 137758. doi:10.1016/j.conbuildmat.2024.137758
Kanungo, D., Sharma, S., and Pain, A. (2014). Artificial neural network (ANN) and regression tree (CART) applications for the indirect estimation of unsaturated soil shear strength parameters. Front. earth Sci. 8, 439–456. doi:10.1007/s11707-014-0416-0
Kennedy, J., and Eberhart, R. C. (1997). “A discrete binary version of the particle swarm algorithm,” in 1997 IEEE International conference on systems, man, and cybernetics. Computational cybernetics and simulation, Orlando, FL, USA, 12-15 October 1997 (IEEE), 4104–4108.
Kohestani, V., Hassanlourad, M., and Ardakani, A. (2015). Evaluation of liquefaction potential based on CPT data using random forest. Nat. Hazards 79 (2), 1079–1089. doi:10.1007/s11069-015-1893-5
Lazaridis, P. C., and Thomoglou, A. K. (2024). Rapid shear capacity prediction of TRM-strengthened unreinforced masonry walls through interpretable machine learning deployed in a web app. J. Build. Eng. 98, 110912. doi:10.1016/j.jobe.2024.110912
Liang, R., Chen, C., Sun, T., Tao, J., Hao, X., Gu, Y., et al. (2023). Interpretable machine learning assisted spectroscopy for fast characterization of biomass and waste. Waste Manag. 160, 90–100. doi:10.1016/j.wasman.2023.02.012
Lin, H., Gong, X., Zeng, Y., and Zhou, C. (2024). Experimental study on the effect of temperature on HDPE geomembrane/geotextile interface shear characteristics. Geotext. Geomembranes 52 (4), 396–407. doi:10.1016/j.geotexmem.2023.12.005
Liu, H., Han, J., and Parsons, R. L. (2023). Numerical analysis of geosynthetics to mitigate seasonal temperature change-induced problems for integral bridge abutment. Acta Geotech. 18 (2), 673–693. doi:10.1007/s11440-022-01614-5
Lundberg, S. M., and Lee, S.-I. (2017). A unified approach to interpreting model predictions. Adv. neural Inf. Process. Syst. 30.
Luo, P., Li, D., Ma, J., Zhao, J., and Jabbar, A. (2025). Experimental study on energy and damage evolution of dry and water-saturated dolomite from a deep mine. Int. J. Damage Mech. 34 (2), 303–325. doi:10.1177/10567895241277948
Luo, P., Li, D., Zhou, A., Ma, J., Zhu, Q., and Jiang, J. (2023). Influence of bedding plane on the tensile properties and crack propagation of soft and hard laminated rock-like under Brazilian test. Theor. Appl. Fract. Mech. 127, 104087. doi:10.1016/j.tafmec.2023.104087
Moayedi, H., and Jahed Armaghani, D. (2018). Optimizing an ANN model with ICA for estimating bearing capacity of driven pile in cohesionless soil. Eng. Comput. 34, 347–356. doi:10.1007/s00366-017-0545-7
Najjar, I., Sadoun, A., Abd Elaziz, M., Ahmadian, H., Fathy, A., and Kabeel, A. (2023). Prediction of the tensile properties of ultrafine grained Al–SiC nanocomposites using machine learning. J. Mater. Res. Technol. 24, 7666–7682. doi:10.1016/j.jmrt.2023.05.035
Onyekwena, C. C., Li, Q., Wang, Y., Alvi, I. H., Li, W., Hou, Y., et al. (2024). Dredged marine soil stabilization using magnesia cement augmented with biochar/slag. J. Rock Mech. Geotechnical Eng. 16 (3), 1000–1017. doi:10.1016/j.jrmge.2023.05.005
Pokharel, A., Keesler-Evans, J., Tempke, R., and Musho, T. (2023). A machine learning model for predicting progressive crack extension based on experimental data obtained using DCPD measurement technique. J. Mater. Res. Technol. 24, 5687–5701. doi:10.1016/j.jmrt.2023.04.155
Schjønning, P., Lamandé, M., Keller, T., and Labouriau, R. (2020). Subsoil shear strength–measurements and prediction models based on readily available soil properties. Soil Tillage Res. 200, 104638. doi:10.1016/j.still.2020.104638
Schölkopf, B., and Smola, A. J. (2002). Learning with kernels: support vector machines, regularization, optimization, and beyond. MIT press.
Shi, D., Chen, X., and Shao, W. (2023). Modeling of bidirectional chloride convection-diffusion for corrosion initiation life prediction of RC square piles under drying-wetting cycle. Appl. Ocean Res. 141, 103789. doi:10.1016/j.apor.2023.103789
Shiuly, A., Hazra, T., Sau, D., and Maji, D. (2022). Performance and optimisation study of waste plastic aggregate based sustainable concrete–A machine learning approach. Clean. Waste Syst. 2, 100014. doi:10.1016/j.clwas.2022.100014
Smola, A. J., and Schölkopf, B. (2004). A tutorial on support vector regression. Statistics Comput. 14, 199–222. doi:10.1023/b:stco.0000035301.49549.88
Tang, C.-S., Cheng, Q., Gong, X., Shi, B., and Inyang, H. I. (2023). Investigation on microstructure evolution of clayey soils: a review focusing on wetting/drying process. J. Rock Mech. Geotechnical Eng. 15 (1), 269–284. doi:10.1016/j.jrmge.2022.02.004
Tanguay-Rioux, F., Spreutels, L., Héroux, M., and Legros, R. (2022). Mixed modeling approach for mechanical sorting processes based on physical properties of municipal solid waste. Waste Manag. 144, 533–542. doi:10.1016/j.wasman.2022.04.025
Thomoglou, A. K., and Karabinis, A. I. (2021). “Experimental investigation of shear strength of solid brick URM walls retrofitted with TRM jacket,” in Proceedings of the 8th ECCOMAS thematic conference on computational methods in structural dynamics and earthquake engineering (COMPDYN 2021). Athens, Greece, 27–30.
Thomoglou, A. K., Rousakis, T. C., Achillopoulou, D. V., and Karabinis, A. I. (2020). Ultimate shear strength prediction model for unreinforced masonry retrofitted externally with textile reinforced mortar. Earthq. Struct. 19 (6), 411–425. doi:10.12989/eas.2020.19.6.411
Tincopa, M., and Bouazza, A. (2021). Water retention curves of a geosynthetic clay liner under non-uniform temperature-stress paths. Geotext. Geomembranes 49 (5), 1270–1279. doi:10.1016/j.geotexmem.2021.04.005
Velvizhi, G., Shanthakumar, S., Das, B., Pugazhendhi, A., Priya, T. S., Ashok, B., et al. (2020). Biodegradable and non-biodegradable fraction of municipal solid waste for multifaceted applications through a closed loop integrated refinery platform: paving a path towards circular economy. Sci. Total Environ. 731, 138049. doi:10.1016/j.scitotenv.2020.138049
Vyas, S., Prajapati, P., Shah, A. V., and Varjani, S. (2022). Municipal solid waste management: dynamics, risk assessment, ecological influence, advancements, constraints and perspectives. Sci. Total Environ. 814, 152802. doi:10.1016/j.scitotenv.2021.152802
Wan, X., Ding, J., Mou, C., Gao, M., and Jiao, N. (2024). Role of bayer red mud and phosphogypsum in cement-stabilized dredged soil with different water and cement contents. Constr. Build. Mater. 418, 135396. doi:10.1016/j.conbuildmat.2024.135396
Wang, P., Xu, C., Yin, Z.-Y., Song, S.-x., Xu, C., and Dai, S. (2024). A DEM-based generic modeling framework for hydrate-bearing sediments. Comput. Geotechnics 171, 106287. doi:10.1016/j.compgeo.2024.106287
Wang, P., Yin, Z.-Y., and Wang, Z.-Y. (2022). Micromechanical investigation of particle-size effect of granular materials in biaxial test with the role of particle breakage. J. Eng. Mech. 148 (1), 04021133. doi:10.1061/(asce)em.1943-7889.0002039
Xu, J., Gong, J., Li, Y., Fu, Z., and Wang, L. (2024). Surf-riding and broaching prediction of ship sailing in regular waves by LSTM based on the data of ship motion and encounter wave. Ocean. Eng. 297, 117010. doi:10.1016/j.oceaneng.2024.117010
Yaashikaa, P., Kumar, P. S., Saravanan, A., Varjani, S., and Ramamurthy, R. (2020). Bioconversion of municipal solid waste into bio-based products: a review on valorisation and sustainable approach for circular bioeconomy. Sci. Total Environ. 748, 141312. doi:10.1016/j.scitotenv.2020.141312
Yang, H., Li, H., and Zhao, Z. (2025). Modeling prediction of bond strength between rebar and recycled aggregate concrete by deep learning approach based on attention mechanism. Constr. Build. Mater. 471, 140753. doi:10.1016/j.conbuildmat.2025.140753
Yavari, N., Tang, A. M., Pereira, J.-M., and Hassen, G. (2016). Effect of temperature on the shear strength of soils and the soil–structure interface. Can. Geotechnical J. 53 (7), 1186–1194. doi:10.1139/cgj-2015-0355
Yusof, M. F., Azamathulla, H. M., and Abdullah, R. (2014). Prediction of soil erodibility factor for peninsular Malaysia soil series using ANN. Neural Comput. Appl. 24, 383–389. doi:10.1007/s00521-012-1236-3
Zhang, S., Liu, J., Ding, J., Gao, M., and Xue, C. (2024). Effect of recycled phosphogypsum and calcium aluminate cement on the strength behavior optimization of cement-treated dredged soil: a co-utilization of solid wastes. J. Environ. Manag. 353, 120020. doi:10.1016/j.jenvman.2024.120020
Zhang, W., Li, H., Shi, D., Shen, Z., Zhao, S., and Guo, C. (2023). Determination of safety monitoring indices for roller-compacted concrete dams considering seepage–stress coupling effects. Mathematics 11 (14), 3224. doi:10.3390/math11143224
Zhao, G., Zhu, Z., Ren, G., Wu, T., Ju, P., Ding, S., et al. (2023). Utilization of recycled concrete powder in modification of the dispersive soil: a potential way to improve the engineering properties. Constr. Build. Mater. 389, 131626. doi:10.1016/j.conbuildmat.2023.131626
Zheng, H., Zhang, H., Liang, F., and Li, L. (2024). Numerical investigation on lateral monotonic and cyclic responses of scoured rigid monopile based on an integrated bounding surface model. Comput. Geotechnics 166, 105997. doi:10.1016/j.compgeo.2023.105997
Zheng, Z., Deng, B., Li, S., and Zheng, H. (2024a). Disturbance mechanical behaviors and anisotropic fracturing mechanisms of rock under novel three-stage true triaxial static-dynamic coupling loading. Rock Mech. Rock Eng. 57 (4), 2445–2468. doi:10.1007/s00603-023-03696-3
Zheng, Z., Xu, H., Zhang, K., Feng, G., Zhang, Q., and Zhao, Y. (2024b). Intermittent disturbance mechanical behavior and fractional deterioration mechanical model of rock under complex true triaxial stress paths. Int. J. Min. Sci. Technol. 34 (1), 117–136. doi:10.1016/j.ijmst.2023.11.007
Keywords: dredged soil, shear strength, machine learning, LDA-BA-ANN model, empirical formula
Citation: Yao Z, Xu K, Wang Z, Sun H and Cui P (2025) Estimating shear strength of dredged soils for marine engineering: experimental investigation and machine learning modeling. Front. Earth Sci. 13:1645393. doi: 10.3389/feart.2025.1645393
Received: 11 June 2025; Accepted: 10 July 2025;
Published: 23 July 2025.
Edited by:
Chong Xu, Ministry of Emergency Management, ChinaReviewed by:
Aybike Özyüksel Çiftçioğlu, Manisa Celal Bayar University, TürkiyePingkuang Luo, Central South University, China
Petros C. Lazaridis, Democritus University of Thrace, Greece
Copyright © 2025 Yao, Xu, Wang, Sun and Cui. This is an open-access article distributed under the terms of the Creative Commons Attribution License (CC BY). The use, distribution or reproduction in other forums is permitted, provided the original author(s) and the copyright owner(s) are credited and that the original publication in this journal is cited, in accordance with accepted academic practice. No use, distribution or reproduction is permitted which does not comply with these terms.
*Correspondence: Haodong Sun, c2hkMTk5MTFAMTYzLmNvbQ==; Peng Cui, Y3VpLnBlbmdAdW11LnNl
†These authors have contributed equally to this work