 Bingyan Ma
 Jing Guo1
 Huiliang Wang
- 1PowerChina Huadong Engineering Corporation Limited, Hangzhou, Zhejiang, China
- 2School of Water Conservancy and Transportation, Zhengzhou University, Zhengzhou, Henan, China
Urban flooding has become a global problem, seriously threatening the healthy development of cities and the safety of people’s lives and property. Urban flood risk assessment can effectively identify potential hazardous areas and provide a basis for the development of targeted disaster prevention and mitigation strategies. However, the current urban flood risk assessment research is mainly based on the flood inundation or indicator evaluation system, the lack of inundation characteristic and hazard-bearing body socio-economic attributes of the comprehensive consideration, resulting in the assessment results and the actual flood risk there is a certain deviation. Therefore, this study integrated urban hydrological and hydrodynamic simulation technology and Fuzzy Matter-Element (FME) theory, proposed a comprehensive flood risk assessment method that takes flood inundation and socio-economic vulnerability into account, and quantitatively evaluates the flooding risk of Zhengzhou City under different rainfall return periods. The results indicate that low-risk zones are primarily located in the peripheral and fringe regions of Zhengzhou, whereas high and very-high risk zones are predominantly situated in the central urban area, particularly in the western Jinshui District, northeastern Erqi District, and northern Guancheng District. These areas are the old urban areas of Zhengzhou City which were constructed earlier, and are characterized by low drainage system construction standards, aging pipe networks, dense population and road networks, and high economic value. The results contribute methodological guidance and decision-making reference for urban flood management and control.
1 Introduction
Floods are among the most frequent natural hazards worldwide. They may lead to serious environmental damage, property losses, and casualties in a relatively short period (Chen et al., 2019; Jun et al., 2023), threatening human lives and causing significant economic losses (Chen et al., 2023; He et al., 2021). According to statistics, floods have led to the death of more than 500,000 people worldwide in the past 30 years (Liu et al., 2022). As climate change exacerbates rainfall intensity and sea-level rise, flooding is expected to become far more frequent in the next decades (Guan et al., 2023; Magnus and Ola, 2020). In this context, it is crucial to accurately assess the flood risk. By accurately identifying and assessing the flood risk, it can help urban managers take targeted risk response measures to decrease the impacts and losses caused by flood disasters (Tallar and Geldoffer, 2022; Guan et al., 2023).
To effectively identify and evaluate urban flood risk characteristics, researchers have proposed various assessment approaches, such as analysis of historical data, indicator-based evaluations, remote sensing techniques, and numerical simulations (Chan et al., 2024; Wu et al., 2021; Wu et al., 2020). Among them, indicator-based evaluation and numerical simulation method have emerged as the primary tools in flood risk analysis. Most of the indicator-based evaluations methods construct an index system covering multiple dimensions such as hazard factors, disaster-inducing environments, disaster-affected bodies, and disaster prevention capabilities, and use weighted comprehensive evaluation for risk classification. This method is simple, relatively easy to obtain data, widely applicable, and can capture the subtle changes in risk within the spatial scope, and has been extensive application in urban flood risk studies. Xu et al. (2025) selected 16 indicators from environ-mental sensitivity and vulnerability of disaster-affected bodies, and disaster prevention capabilities to establish a four-dimensional evaluation index system for urban flood risk. They used the TOPSIS method to evaluate the flood risk of 21 prefecture-level cities in Guangdong Province. The results indicated a concentration of high-risk areas in the Pearl River Delta, as well as in the western and northern regions. Deo et al. (2025) established a flood risk evaluation index system containing 21 thematic layers using morphological, hydrological, land, and socio-economic criteria. The analytic hierarchy process was employed to weight the indices, and the resulting risk distribution in Jaipur was validated through field surveys. The results showed that about 33% of the areas in the Jaipur area had urban flood risks, and the urban flood risks in the central and southern regions were relatively high. Although the indicator-based evaluations method has a wide application basis in flood risk assessment, it still has certain limitations. Firstly, the selection of indicators and the assignment of weights often rely on expert experience or subjective judgment, which may introduce human biases and affect the objectivity and stability of the assessment results. Secondly, the indicator-based evaluations method mostly focuses on the characteristics of socio-economic attributes, often ignoring the inundation characteristics such as water depth, and it is hard to precisely capture the spatial distribution characteristics of disasters (Chen et al., 2021).
The numerical simulation method can accurately reflect the inundation characteristics of each subtle space by establishing a hydrological and hydrodynamic model using fine underlying surface data (Liang and Guan, 2024; Liu et al., 2020; Ma C. et al., 2022), and more intuitively reflect the inundation risks of various regions within the spatial scope, effectively making up for the limitation that the index system method cannot intuitively reflect the inundation characteristics. In recent years, it has been extensive application in urban flood risk assessment. Zhu et al. (2024) proposed a refined urban flood simulation-based approach for evaluating flood risk. This study took Omihachiman City in Japan as the study area, accurately simulated the entire flood process by developing a numerical analysis model, and simulated and evaluated the flood risks under 10-, 50-, and 100-year return periods in Omihachiman City, Japan. Zhang et al. (2024) used Infoworks ICM to construct a flood risk identification model for the Macau Peninsula and delineated the flood risk areas in the high-density urban area of Macau according to the flood inundation results. The above studies indicate that numerical simulation methods illustrate flood severity by modeling inundation features within the region, effectively revealing the spatial pattern of flood risks. However, most of these studies ignore the socio-economic attributes (such as population density, economic losses, vulnerability of infrastructure, etc.) of the disaster-affected bodies in the inundated areas, resulting in the assessment results being unable to comprehensively reflect the actual impacts of floods on the lives and property safety of local residents. Therefore, how to effectively consider flood inundation and socio-economic vulnerability to more accurately reflect the urban flood risk still requires in-depth research.
To this end, this study introduces the Fuzzy Matter-Element (FME) theory and proposes a risk assessment approach that combines flood simulation and socio-economic vulnerability. Firstly, a hydro-hydraulic model is constructed to accurately simulate the urban flood inundation process. On this basis, considering the socio-economic, road traffic, and resident population vulnerabilities, an assessment method for the socio-economic vulnerability of urban floods is proposed. Finally, by combining the entropy weight method and the FME method, a comprehensive risk assessment model that considers both flood inundation and socio-economic vulnerability is constructed to quantitatively evaluate the flood risks in Zhengzhou City under different recurrence periods. The innovation of this study is to propose a more reasonable urban flood risk assessment method by integrating flood inundation and socio-economic vulnerability. The research results can provide new ideas for urban flood risk assessment and scientific basis for urban flood disaster reduction.
2 Study area and data
2.1 Study area
Zhengzhou City is the capital of Henan Province, which located in the central region of China. Its geographical coordinates range from 112°42′ to 114°13′ east longitude and from 34°16′ to 34°58′ north latitude (Figure 1). The average yearly rainfall of Zhengzhou City is 625 mm, and more than 60% of the rainfall is concentrated during the flood season, resulting in frequent extreme rainfall events in Zhengzhou City during the flood season.
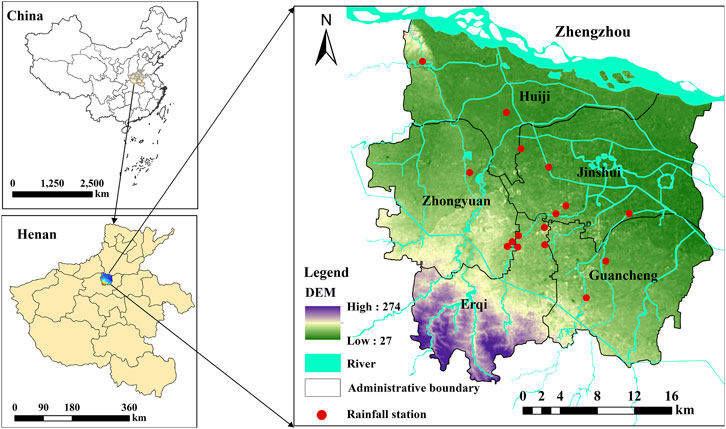
Figure 1. The location of study area.
Zhengzhou City is an important transportation hub in China. Since 1978, its social economy has developed rapidly. As of 2024, the gross domestic product of Zhengzhou City has reached 1.4 trillion yuan, with a permanent population of approximately 13 million people, and the urbanization rate is close to 80%. Intensified extreme rainfall and accelerated urbanization have made flood disasters in Zhengzhou City particularly prominent in recent years. The average losses caused by waterlogging disasters triggered by rainstorms in Zhengzhou City exceed 200 million yuan each year (Wu et al., 2021). In particular, on 20 July 2021, Zhengzhou City experienced rare heavy rainfall. The hourly rainfall from 16:00 to 17:00 in the afternoon reached 201.9 mm, causing more than 2,000 residential communities in the urban area to be flooded, and water supply, power supply, and network services were cut off in many areas, having a profound impact on the economy, society, and ecological environment of Zhengzhou City (Dong et al., 2022). Therefore, a precise assessment of Zhengzhou’s flood hazards holds significant value for strengthening local flood control and disaster reduction capabilities, optimizing emergency management strategies, and achieving sustainable urban development.
2.2 Data
In this study, the data sources mainly include the underlying surface data of Zhengzhou City (land use, drainage network, DEM, and building distribution), historical rainfall event data, population distribution, traffic road network, and urban functional zoning data. Among them, the underlying surface data of Zhengzhou City and historical rainfall event data are used for the construction and verification of the urban hydrological and hydrodynamic model; the population distribution, traffic road network, and urban functional zoning data are used for the urban socio-economic vulnerability risk analysis.
1. Underlying surface data: It includes land use, drainage network, DEM, and building distribution data. The land use information is obtained based on the processing of Pleiades satellite images, with 0.5 m spatial resolution. The drainage network data is provided by the Zhengzhou City Urban Management Bureau. The DEM is obtained from the Geospatial Data Cloud of Chinese Academy of Sciences, with a spatial resolution of 30 m. The building distribution is the vector data of building outlines in 2023, and the data set is provided by the Geographic Remote Sensing Ecological Network Platform (www.gisrs.cn).
2. Historical rainfall event data: The rainfall data is the three rainfall events on 26 July 2011, 1 August 2019, and from 19–21 July 2021, obtained from 16 automatic rain gauges in Zhengzhou City, with 10 min time resolution (update every 10 min). The data is provided by the Henan Provincial Hydrological Bureau. The ponding data under the three rainfall events is the ponding depth monitored by flood monitoring equipment, which is sourced from the Zhengzhou City Urban Management Bureau.
3. Population, road network, and urban functional zoning data: The population density data is sourced from the WorldPop project. The population raster data in 2020 with 100 m spatial resolution is selected. The traffic road network data is extracted from OpenStreetMap. The urban functional zoning data adopts the research results of Lv et al. (2023) on refined building data. The accuracy of the data of different functional areas identified by this result reaches 82.9%.
3 Methods
3.1 Urban flood model construction and inundation process simulation
3.1.1 Basic principles of PCSWMM
PCSWMM (Personal Computer Storm Water Management Model) is a comprehensive hydro-hydraulic modeling platform constructed by the Computational Hydraulics Institute of Canada based on the framework of SWMM (Storm Water Management Model) developed by the U.S. Environmental Protection Agency (EPA) (Ahiablame and Shakya, 2016). The core feature of PCSWMM lies in its integrated modeling capabilities, supporting fine-grained analysis of urban precipitation runoff, storage, and water balance under various rainstorm scenarios. In addition, by perfectly integrating GIS functions, this software enables users to build models more intuitively using spatial data and visualize the results, thereby enhancing the scientificity and effectiveness of decision-making. In recent years, PCSWMM has been widely used in flood risk assessment, pollutant source tracing, and drainage system optimization (Bibi et al., 2023; Ma C. et al., 2022; Xu et al., 2023). In this study, PCSWMM was selected to construct an urban hydrological and hydrodynamic model to simulate the urban flood inundation process.
PCSWMM adopts a modular design, mainly including surface runoff generation and concentration calculation module, surface runoff concentration calculation module, pipe network runoff concentration calculation module, two-dimensional surface overland flow calculation module, and one-two-dimensional coupling calculation module. Among them, the two-dimensional surface overland flow and one-two-dimensional coupling calculation modules are the core of the PCSWMM model construction. In order to more accurately depict the surface inundation process, a building obstruction layer is set in the two-dimensional overland flow process model to simulate the obstruction of the flow path by buildings and the interference with runoff concentration. The one-two-dimensional coupling calculation module realizes the coupling of one-and two-dimensional models through two methods: “direct connection to a one-dimensional inspection well” and “connection using a bottom orifice.” The detailed mathematical description and modeling process of PCSWMM have been introduced in previous studies (Ma C. et al., 2022; Xu et al., 2023). This study focuses on introducing how to comprehensively evaluate the urban flood disaster risk by integrating the results of flood simulation and socio-economic data.
3.1.2 Model validation
Model validation is the key to assessing whether a model can accurately simulate the flood inundation process. To fully verify the simulation effect of the constructed PCSWMM model on the flood inundation process, the measured water depth at waterlogging points were selected as the evaluation objects. The Nash-Sutcliffe efficiency coefficient (NSE) and the absolute value of the relative error (ARE) were used to evaluate the simulation effect of the constructed PCSWMM model on typical historical flood events, as shown in Equations 1, 2. According to the accuracy requirements for model calibration and validation (Ahiablame and Shakya, 2016; Ma B. et al., 2022), the NSE of the simulation results should not be less than 0.5, and the ARE should not be greater than 20%.
Where
3.1.3 Urban flood simulation under different design rainstorm scenarios
In this study, the Chicago rainstorm method was adopted, and combined with the rainstorm intensity formula of Zhengzhou City, the rainfall process curves and rainfall amounts for the recurrence periods of 1, 5, 10, 20, 50, and 100 years were determined (Figure 2). The average rainfall peak coefficient was taken as 0.433, the rainfall duration was 180 min, and the rainfall intensity calculation formula was shown in Equation 3.
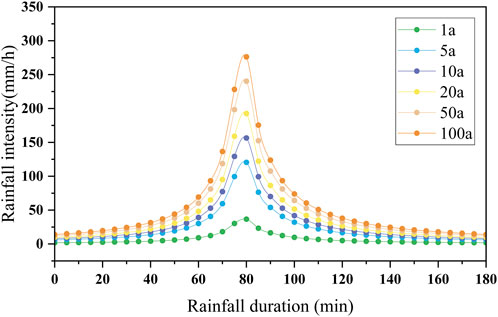
Figure 2. Design rainstorm hydrographs in Zhengzhou city (180 min).
Where i represents the rainfall intensity (mm/min), q denotes the designed rainstorm intensity (L/hm3.s), P is the designed rainfall recurrence period, t signifies the continuous rainfall duration (min).
Use the validated urban hydro-hydrodynamic model to simulate the flood inundation processes with the recurrence periods of 1, 5, 10, 20, 50, and 100 years in the study area. Then, use the fishnet tool in ArcGIS to grid Zhengzhou City, set the grid scale to 200 m, and calculate the average value of the maximum water depth in each grid respectively, which is used to represent the ponding situation within the grid.
3.2 Socio-economic vulnerability analysis
3.2.1 Selection of socio-economic vulnerability indicators
The impacts of flood disasters on the urban socio-economic system are mainly reflected in aspects such as economic losses, traffic disruptions, and casualties. Therefore, starting from the actual impacts of urban floods on the economy, transportation, and population, this study selects a total of 8 indicators, including the number of submerged people, the submerged length of roads of different grades, and the economic losses in different functional areas, to construct an index system for urban socio-economic vulnerability analysis. The specific indicators are shown in Table 1.
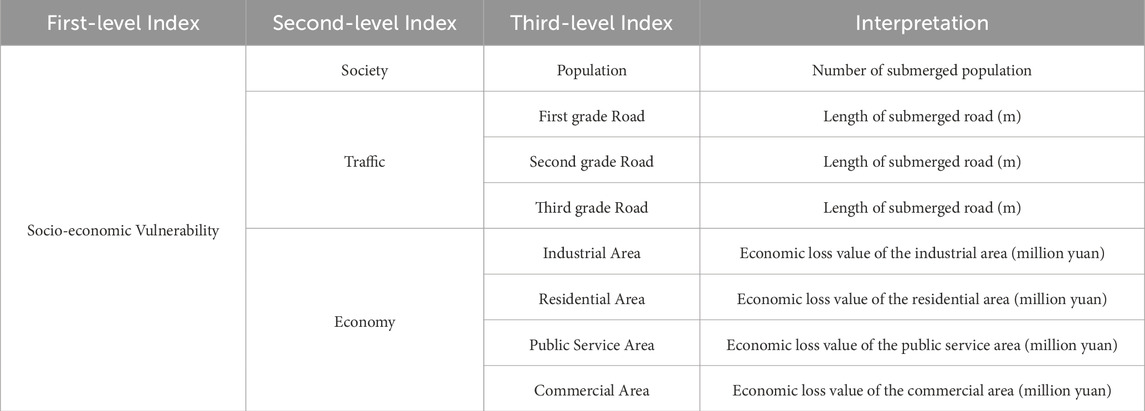
Table 1. Socio-economic vulnerability assessment index system for urban flooding.
3.2.1.1 Indicator of the number of submerged population
The indicator of the number of submerged population is one of the key factors in assessing socio-economic vulnerability. This indicator directly reflects the number of residents in the affected communities during flood disasters, thus revealing the degree of vulnerability of the population. The number of submerged people is closely related to the demand for rescue resources, social stability, and post-disaster recovery capabilities. Understanding the number of submerged population is very important for formulating timely response measures and also provides necessary data support for subsequent post-disaster recovery and reconstruction.
3.2.1.2 Indicator of the submerged length of roads of different grades
The indicator of the submerged length of roads is an important basic variable for assessing the impact degree of flood disasters. From the perspective of transportation infrastructure, road inundation will directly affect the timeliness and coverage of emergency rescue operations. Once roads are inundated or damaged, the efficiency of dispatching rescue materials and personnel will decline significantly, making it difficult for the affected areas to receive timely support and thus exacerbating the vulnerability of the city. To more comprehensively reflect the influence of flood disasters on the urban transportation system, this study further refines the road grades and selects the submerged lengths of first-, second-, and third-class roads as refined indicators. Roads of different grades play different roles in the urban transportation system. First-class roads are usually urban main roads and are key channels for emergency rescue and material allocation; second-class roads are mostly sub-arterial roads, undertaking secondary traffic connection functions; third-class roads mainly serve the internal traffic of communities. Analyzing the inundation situation of roads of different grades helps to more accurately identify the influence of flood disasters on different levels of urban traffic networks, thus providing scientific support for formulating differentiated disaster-reduction strategies.
3.2.1.3 Indicator of economic loss
The indicator of economic loss is an key quantitative indicator for assessing the impact of flood disasters. This indicator not only covers direct property losses but also includes aspects such as industrial operation interruptions, business activity stagnation, and employment damage. Through a comprehensive assessment of economic losses, it can accurately capture the overall influence of flood disasters on the local economic operation. To more accurately reveal the economic impact of flood disasters on different functional areas of the city, this study refines economic losses into economic loss indicators for functional areas such as industrial areas, commercial areas, public service areas, etc. By analyzing the economic losses in different functional areas, it is not only possible to identify the key impact areas of flood disasters on the urban economic system, but also helpful to achieve scientific and precise allocation of post-disaster resources, and improve the city’s response and recovery efficiency in the context of flood disasters.
3.2.2 Quantification of socio-economic vulnerability
3.2.2.1 Quantification of economic losses
In flood events, the economic losses sustained by hazard-bearing bodies are primarily determined by three factors: the inundation area, the unit economic value of the affected zones, and the damage rate associated with varying water depths. One of the widely accepted techniques for estimating such losses is the loss rate function method, which models how damage varies with water depth. Owing to structural and functional differences among various hazard-bearing bodies, their corresponding loss rate functions may differ considerably. To improve estimation accuracy, Lv et al. (2021) extracted flood impact data from 11 cities in China and established water-depth–based loss rate functions for different land-use types using the Beta distribution. This method effectively addressed the challenge of quantifying losses across diverse hazard-bearing categories. Based on their findings, this study applies the research results of Lv et al. (2021) to calculate the loss rates of four land-use types, namely residential, commercial, industrial, and public service, in flood disasters. On this basis, the losses of hazard-bearing bodies are calculated by combining the ponding characteristics of hazard-bearing bodies and the economic value of hazard-bearing bodies per unit area.
Where
3.2.2.2 Quantification of affected roads
In this study, the situation of roads affected by flood disasters is quantified by statistically analyzing the length of inundated roads under the influence of flood disasters. To accurately obtain the situation of roads affected within each inundated grid unit, ArcGIS spatial overlay analysis technology is adopted, and the spatial distribution data of roads is overlaid and analyzed with the flood inundation range. As shown in Figure 3, each grid unit is endowed with a dual attribute of “road length” and “whether it is inundated.” For the grids identified as inundated, the total length of roads inside them is extracted and statistically analyzed, which serves as the quantification result of road damage within the unit. Furthermore, by summarizing the road lengths in all inundated grids, the spatial distribution characteristics of the degree of road damage at the regional scale are obtained.
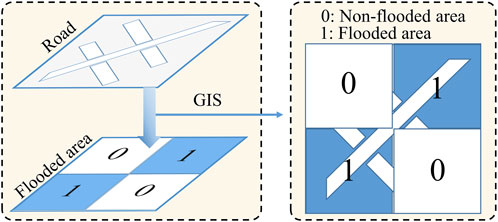
Figure 3. Evaluation framework diagram of affected roads based on GIS spatial overlay.
3.2.2.3 Quantification of affected population
In order to achieve the spatial quantification of the affected population in different grids, the ArcGIS layer overlay analysis method is adopted to conduct spatial overlay analysis of the population and the distribution data of flood inundation. As shown in Figure 4, each grid unit is endowed with the attribute information of “population quantity” and “whether it is inundated.” For the grids identified as inundated, the corresponding population quantity is extracted as the affected population data within the grid. Furthermore, by summarizing the population quantities in all inundated grids, the spatial distribution of the affected urban population at the planar scale is obtained, supporting the refined assessment of the affected population.
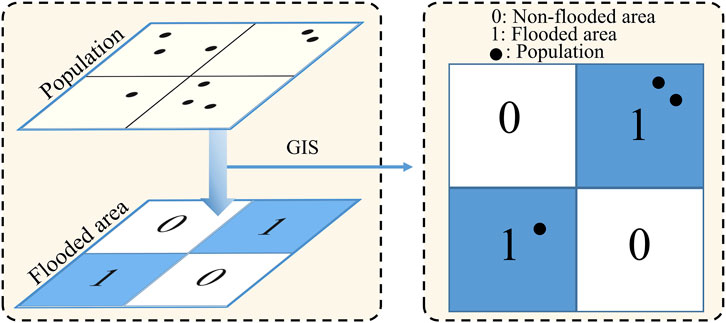
Figure 4. Evaluation framework diagram of affected population based on GIS spatial overlay.
3.3 Comprehensive assessment of urban flood risk based on the FME method
3.3.1 Basic principles of the FME method
FME method is a coupled analysis method based on the theory of matter-element analysis and the theory of fuzzy mathematics, aiming at solving the problem of comprehensive evaluation of complex systems with multiple indicators, multi-dimensions and fuzzy boundaries (Chen et al., 2025; Lv et al., 2020). Its core idea is to describe the basic attributes of the research object through the matter-element triad, combined with the fuzzy affiliation function to quantify the uncertainty, so as to construct the dynamic correlation model, and realize the comprehensive analysis and classification of the complex system. Compared with the traditional risk assessment methods, the matter-element model allows the existence of a nonlinear coupling relationship among the feature indicators, and it supports the integrated analysis of natural-socio-economic composite systems (Lu et al., 2022). Therefore, the FME method was selected to assess the urban flood risk in this study. The construction of urban flood risk assessment model based on the FME method mainly contains the construction of indicator system, composite FME calculation, the assignment of indicator weights and the calculation of Euclidean discount schedule.
3.3.2 Construction of the indicator system
Choosing appropriate evaluation indicators is the key to assess urban flood risk. In the assessment of urban flood risk, rainfall, as a natural factor, directly affects the formation of floods. However, the single factor is not sufficient to comprehensively evaluate the urban flood risk, which is also influenced by socio-economic characteristics. For example, under the same submergence depth, the flood risk of high-value density residential areas is significantly higher than that of green spaces. Therefore, this study comprehensively considered flood inundation and socio-economic vulnerability in the flood risk assessment, selecting 9 indicators including Submerged depth (x1), number of submerged population (x2), submerged length of first-grade roads (x3), submerged length of second-grade roads (x4), submerged length of third-grade roads (x5), economic losses in industrial areas (x6), economic losses in residential areas (x7), economic losses in public service areas (x8), and economic losses in commercial areas (x9) (Figure 5). According to the characteristics of the selected indicators, the above 9 indicators are all of the larger the better type. Partial data on flood risk indicators can be found in Supplementary Table 1.
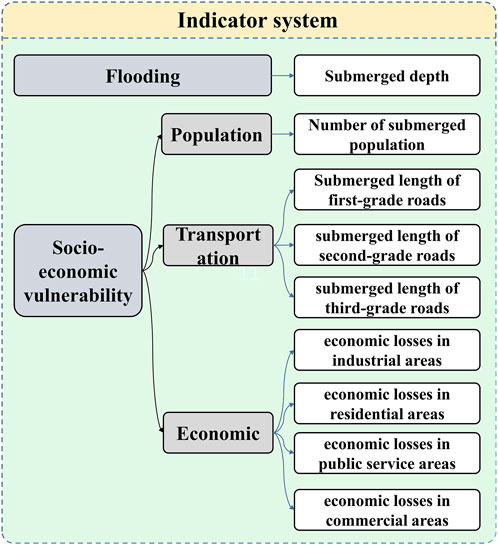
Figure 5. Comprehensive evaluation index system for urban flood risk.
3.3.3 Complex FME calculation
Assume that there are m evaluation objects (
Among them, the fuzzy quantum value
Where
Based on the composite FME and the principle of suboptimal subordination, the standard FME
Where
3.3.4 Determination of weights based on entropy weight method
For the n characteristic indicators of the m evaluation objects, the m × n judgment matrix
Based on the results of indicator normalization, the weight
Based on the entropy value for each indicator, Equation 13 is used to calculate the weights of each indicator
3.3.5 Calculation of the progress of the european posting
By integrating the calculation results of the composite FME model and index weights derived from the entropy method, the Euclidean nearness degree was adopted to characterize the comprehensive index of urban flood risk in this study. As shown in Equation 14. Euclidean nearness degree is a quantitative method to measure the degree of proximity between the evaluation object and the ideal standard, which can comprehensively reflect the performance of each evaluation index on different risk units. Specifically, the nearness degree
4 Results
4.1 Urban flood model validation results
The 26 July 2011 rainstorm, the 1 August 2019 rainstorm, and the 20 July 2021 rainstorm events were selected to validate the model. As shown in Supplementary Figure 1 and Table 2, the ARE of the model’s validation results under the three rainfall events did not exceed 20%, and the NSE was above 0.75 for all of them. From the accuracy under each validation event, the validation accuracy of the model for the 1 August 2019 rainstorm and the 20 July 2021 rainstorm event is significantly better than that for the 26 July 2011 rainstorm, which may be mainly due to the fact that the underlying surface data used in the model modeling are newer in recent years, and there are some differences in the characteristics of the underlying surface in Zhengzhou City during the 26 July 2011 rainstorm event, which led to the validation accuracy of the model for the 26 July 2011 rainstorm event is low. This also shows that the model accurately reflects the current underlying surface conditions in Zhengzhou and verifies the applicability of the model to simulate the current flooding in Zhengzhou.
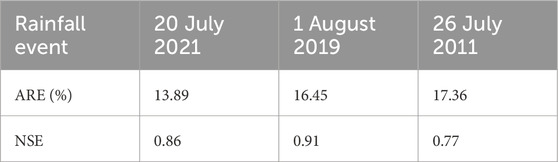
Table 2. The ARE and NSE of the simulation results under 3 verification events.
4.2 Flood inundation characteristics under different rainfall return periods
The flood inundation characteristics of Zhengzhou city for the rainfall return periods of 1, 5, 10, 20, 50, and 100 years were simulated using the validated PCSWMM model. As shown in Figure 6, with the increasing rainfall return period, the flooded area in Zhengzhou City continues to expand, especially from the once in 1-year to 5-year event, the largest increase in the flooded area. From once in 5-year to 10-year, the increase of flooded area has stabilized. For the once in 10-year rainfall event, the maximum depth of ponding in some areas of Jinshui and Erqi districts exceeds 0.6m, which affects the safety of vehicles and pedestrians (Guo et al., 2024). From once in 20-year to 50-year, the flooded area exceeding 0.6 m in-creases significantly. The flooded area where the depth of waterlogging exceeds 0.6 m further expands from the once in 50-year to the 100-year event. From the spatial distribution of the flooded areas, under the once in 100-year rainfall event, various regions of Zhengzhou City experienced different degrees of inundation, with more serious inundation in the northeastern part of Jinshui District, the northern and western parts of Guancheng District, and the northeastern part of Erqi District. Therefore, the management of Zhengzhou City should focus more on the potential flood risk of the bearers in these regions.
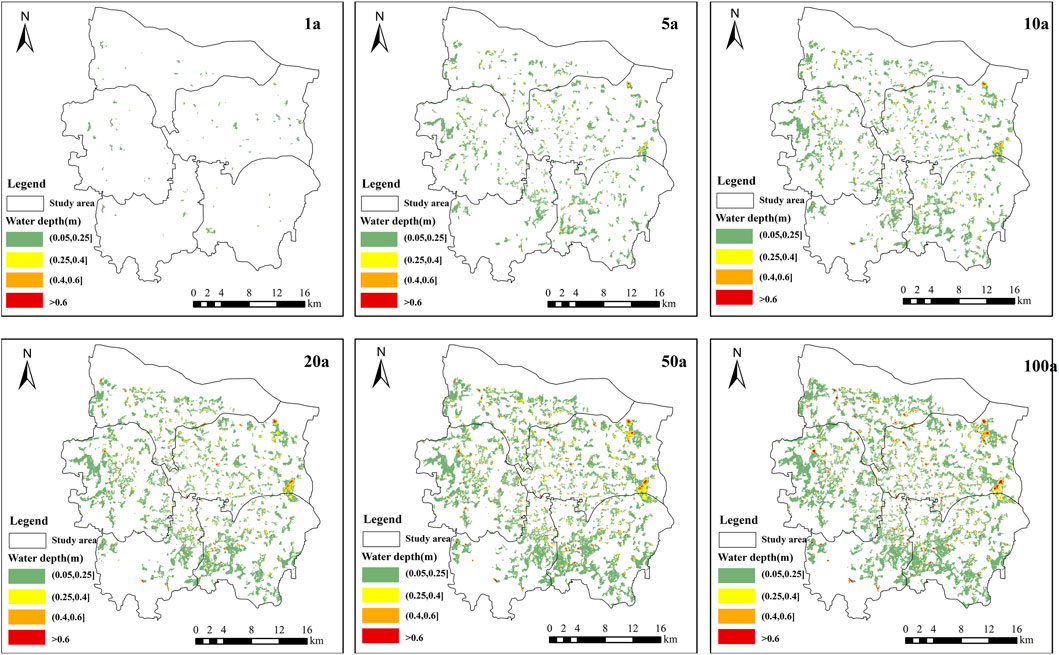
Figure 6. Flood inundation in Zhengzhou City under different rainfall return periods.
4.3 Results of socio-economic vulnerability assessments
4.3.1 Economic vulnerability
Based on the flood inundation results for different return periods, the economic losses within each affected grid for each of the four functional zones (residential, commercial, industrial, and public services) were calculated using the economic vulnerability quantification methodology of Section 3.2 and the spatial overlay tool of ARCGIS. On this basis, the economic loss results for the grids within each functional area were calculated using the zonal statistics tool of ARCGIS. As shown in Figure 7, with the increase of the rainfall return period, the economic losses in all four functional zones show a significant increasing trend, reflecting the significant impact effect of extreme rainfall events on the urban economic system. Among them, commercial and residential have the highest economic losses, mainly due to the higher asset density, complex building structure and high functional concentration within the commercial and residential unit area, where flood impacts will lead to higher direct property losses and potential disruption of economic activities. In addition, commercial and residential areas tend to be located in central urban areas, where high levels of hardening and relatively limited drainage capacity exacerbate flood risk vulnerability.
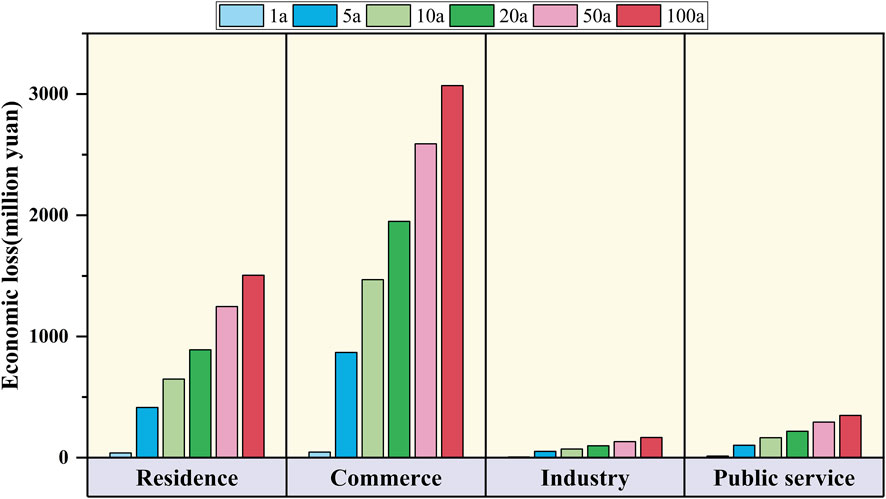
Figure 7. Economic losses in Zhengzhou City under different rainfall return periods.
In order to further reveal the spatial distribution characteristics of urban economic vulnerability, the spatial distribution characteristics of economic losses in Zhengzhou City under one-in-100-year rainfall event was analyzed. As shown in Figure 8, a large number of residential functional areas within Zhengzhou city suffered from different degrees of economic losses under the one-in-100-year rainfall event, which is the most prominent functional area of economic losses. The affected areas of commercial functional areas are mainly concentrated in the southern part of Huiji District, the northeastern part of Erqi District, the north of Guancheng District and the west of Jinshui District. These areas are characterized by intensive commercial activities and high building density, and the impact of flooding poses a significant threat to their economic operations and asset security. The affected areas in the Industrial Functional Area are sporadically distributed in the northern, western and southern parts of Zhengzhou City. The economic loss areas of the public service functional areas are mainly central Zhengzhou and the eastern part of Jinshui District, where public service facilities are more concentrated and bear a higher functional risk in flooding. Overall, under the scenario of one-in-100-year rainfall, different functional areas in Zhengzhou show significant spatial heterogeneity and risk distribution differences, indicating that flood prevention and control should be tailored to the characteristics of the functional areas to formulate targeted risk mitigation and resource scheduling strategies.
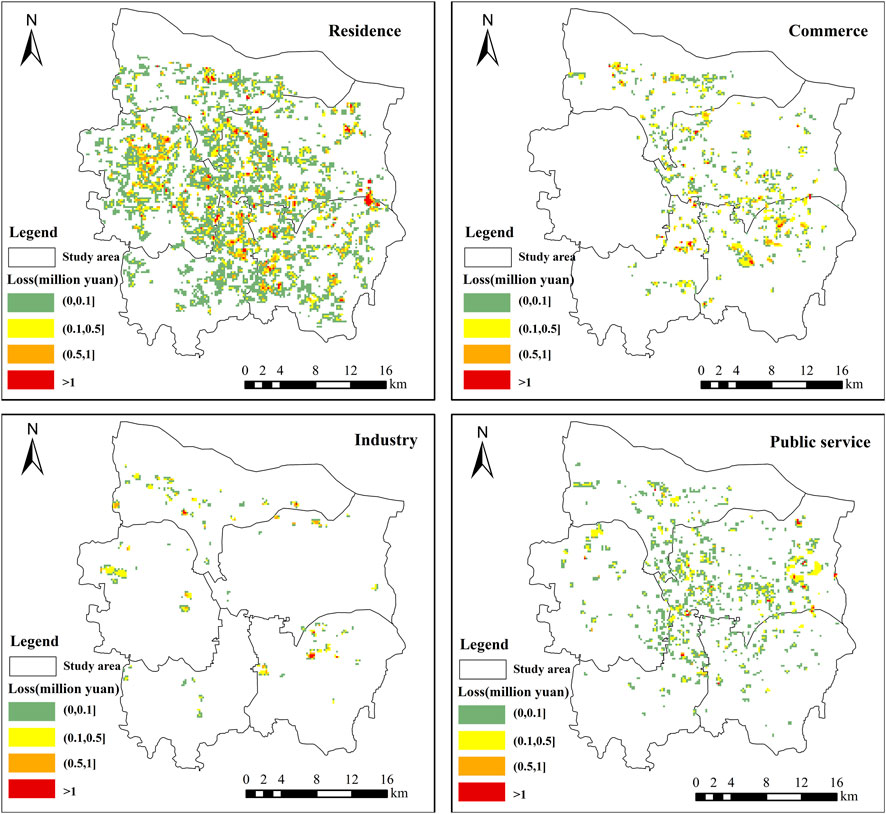
Figure 8. Spatial distribution of economic losses in Zhengzhou City under the rainfall return periods of 100a.
4.3.2 Transportation vulnerability
The road vulnerability quantification method in Section 3.2 was used to calculate the inundation of first, second and third grade roads under different return periods by combining the flood inundation results under different return periods. As shown in Figure 9, the total inundation length of roads at all levels showed a significant increase with the increase of rainfall return period. Among them, the most significant increase in the total inundated road length was observed from the once in 1-year to the 5-year rainfall event, especially for the second-grade roads, whose inundated length increased by nearly 10 times during this period, indicating that the vulnerability of the second-grade roads is more sensitive in moderate flooding events. The third-grade roads are the most severely affected road network level in flooding, because third-grade roads suffer greater inundation pressure in flooding due to not only their large number and wide distribution, but also due to the fact that drainage capacity of the third-grade roads is generally lower than that of second and first grade roads. It can be found that the road system in Zhengzhou City, in the face of different intensity of flooding events there are obvious differences in vulnerability, urban flood management needs to take into account the differences in road levels, optimize the drainage system and the layout of emergency access paths, focusing on strengthening the flood prevention capacity of the third-grade road area and emergency access security.
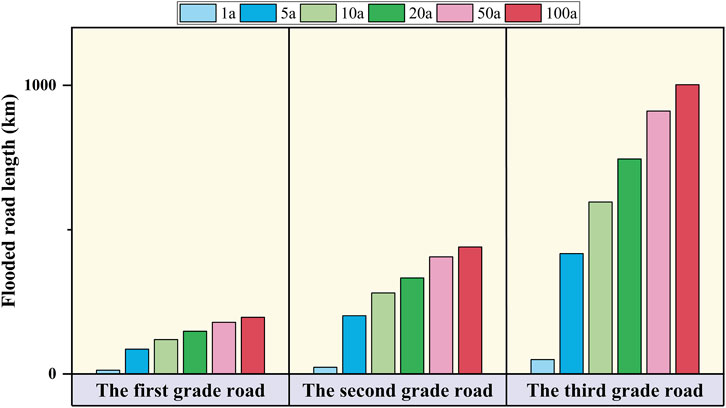
Figure 9. Flooded road in Zhengzhou City under different rainfall return periods.
In order to further reveal the spatial distribution characteristics of transportation vulnerability, the road inundation characteristics in Zhengzhou City under the rainfall return period of once in 100-year was analyzed. As shown in Figure 10, the first-grade roads in central and southern Zhengzhou generally showed different degrees of waterlogging, with localized road inundation in the southern region being more serious. The inundation of second-grade roads is mainly concentrated in the central region of Zhengzhou. In contrast, the degree of inundation of the third-grade roads was significantly higher than that of first and second grade roads, reflecting its weaker resistance to flooding under extreme rainfall. The results are consistent with the analysis findings in Figure 9. Overall, the severely flooded roads are mainly distributed in the central and western regions of Zhengzhou City, exposing the obvious vulnerability of the region’s transportation infrastructure under extreme weather conditions.
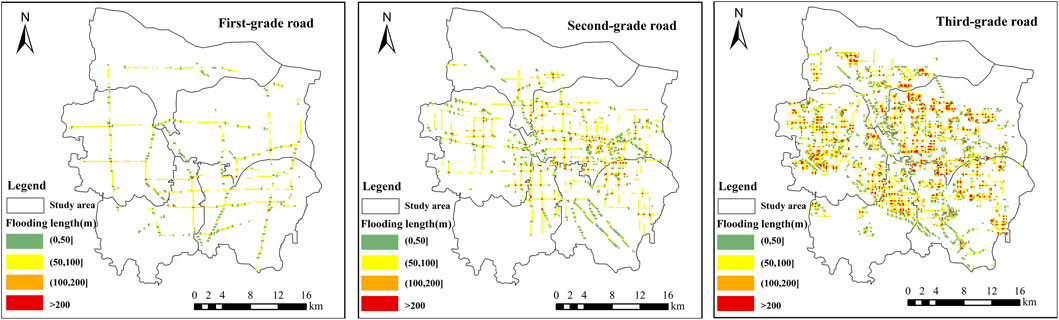
Figure 10. Spatial distribution of Flooded road in Zhengzhou City under the rainfall return periods.
4.3.3 Population vulnerability
The GIS spatial overlay technique is used to overlay the spatial distribution of flood inundation with the spatial distribution of population, and the number of affected people in the statistical inundation grid characterizes population vulnerability. As shown in Figures 11, 12, the number of affected populations expands as the return period increases, and the distribution of affected populations shows a clear expansion trend. In particular, the increase in the affected population is most significant between the once in 1-year and 5-year rainfall return periods. In terms of the spatial distribution of the affected population, the affected population is mainly concentrated in the central and southwestern part of Jinshui District, the southeastern part of Zhongyuan District, and the southern part of Huiji District. These areas are the central urban areas of Zhengzhou, with frequent economic activities, high population density, and a high concentration of residential, commercial and public service facilities, leading to a higher risk of population vulnerability. Therefore, Zhengzhou city authorities should strengthen emergency protection measures for these areas during floods in order to minimize potential population casualties and secondary risks from flooding.
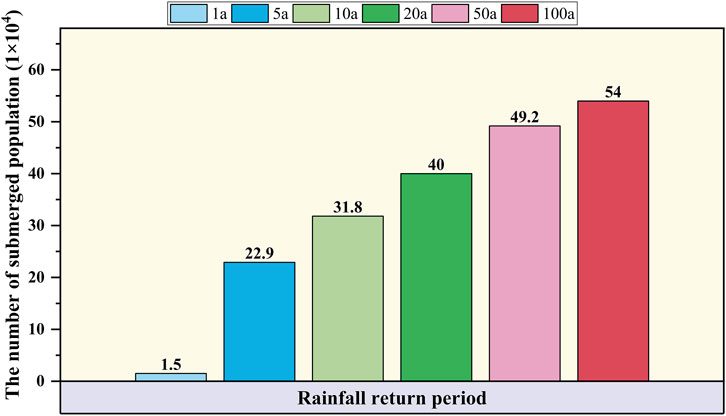
Figure 11. Submerged population in Zhengzhou City under different rainfall return periods.
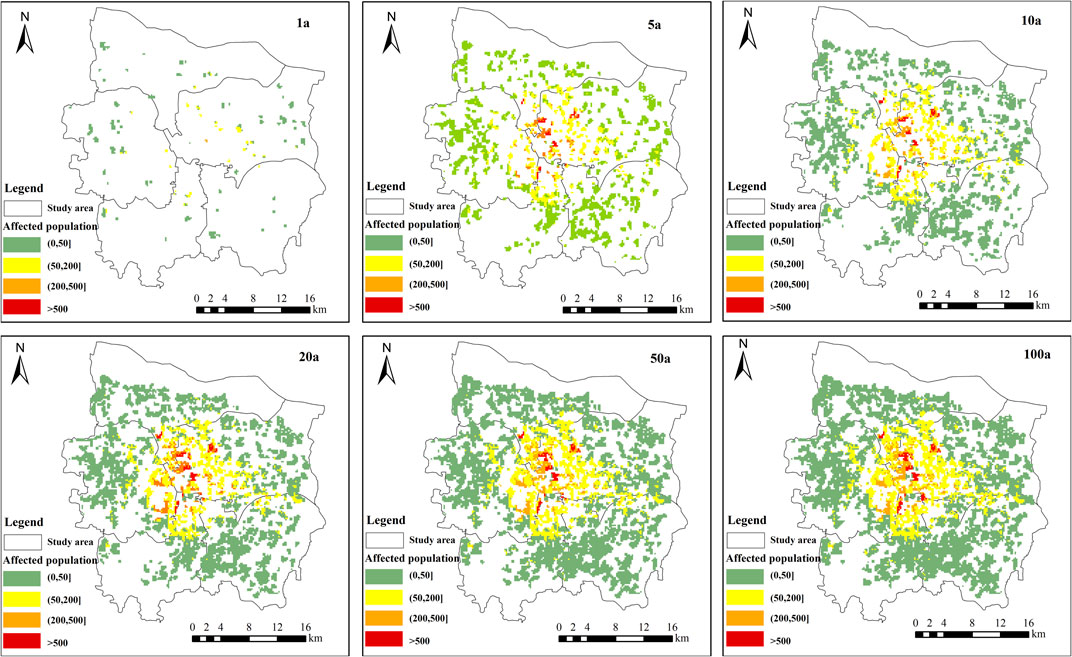
Figure 12. Spatial distribution of submerged population in Zhengzhou City under the rainfall return periods of 100a.
4.4 Comprehensive flood risk in Zhengzhou under different rainfall return periods
Figure 13 illustrates the results of the calculation of the weights of the assessment indicators under different rainfall return periods using the entropy weighting method. The results show that although there is a certain degree of fluctuation in the weights of the indicators under different reproduction periods, the overall situation presents a more stable and dominant characteristic. Among them, the submerged length of first-grade roads (x3), economic losses in industrial areas (x6), economic losses in public service areas (x8), and economic losses in commercial areas (x9) all show higher weights under each reproduction period, occupying a dominant position in the comprehensive risk assessment. Because the inundation of first-grade roads, as the main urban road network, in the event of flooding not only directly affects the evacuation of people and the deployment of emergency resources, but also causes extensive traffic disruptions and significantly reduces the operational efficiency of the city. Industrial, commercial and public service areas are the core of economic and social activities in cities, and severe inundation may lead to the disruption of industrial chains, the paralysis of basic services and the severe restriction of residents’ lives. Therefore, city authorities should pay attention to the flood risk of roads and key economic and functional areas, and promptly activate drainage pump stations, allocate emergency resources such as drainage vehicles, water barriers, sandbags, so as to improve the resilience of the transportation and economic systems against flooding.
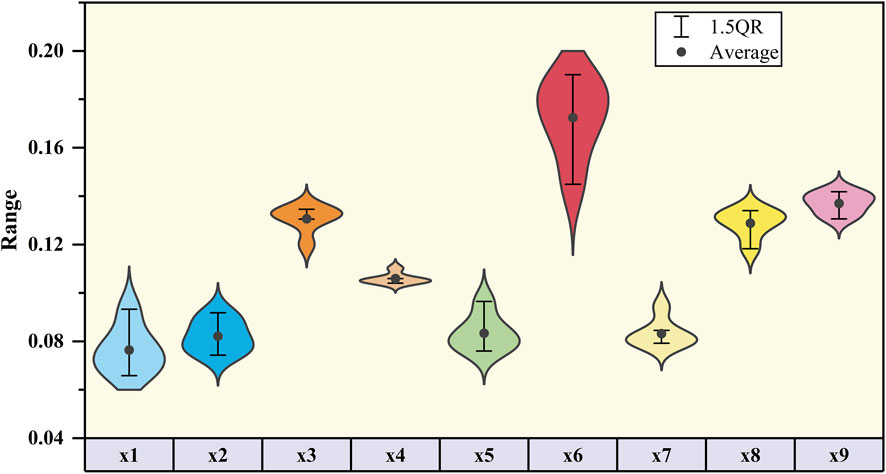
Figure 13. The indicator weights under different rainfall return periods.
With the entropy method assigning weights to indicators, the FME method was applied to evaluate Zhengzhou City’s flood risk under multiple rainfall return periods. As shown in Figure 14, as the return period lengthens, both the flood risk area and the risk intensity continuously expand and rise, especially between the increase of the rainfall return period from once in 1-year to 5-year, the risk changes are most significant. Comparison of the flood risk maps under the six different return periods reveals that the low-risk zones are primarily located in the periphery and fringe areas of the city, while the high-risk areas are concentrated in the central urban areas of the city, especially in the western part of Jinshui District, the northeastern part of Erqi District, and the northern part of Guancheng District. These areas are the older urban areas of Zhengzhou that were constructed earlier, and are generally characterized by low standards of drainage system construction, aging pipe networks, dense population and road networks, and high economic values, resulting in a significantly higher overall flood risk rating than other areas. Therefore, the authorities should focus more on the flood risk in these areas.
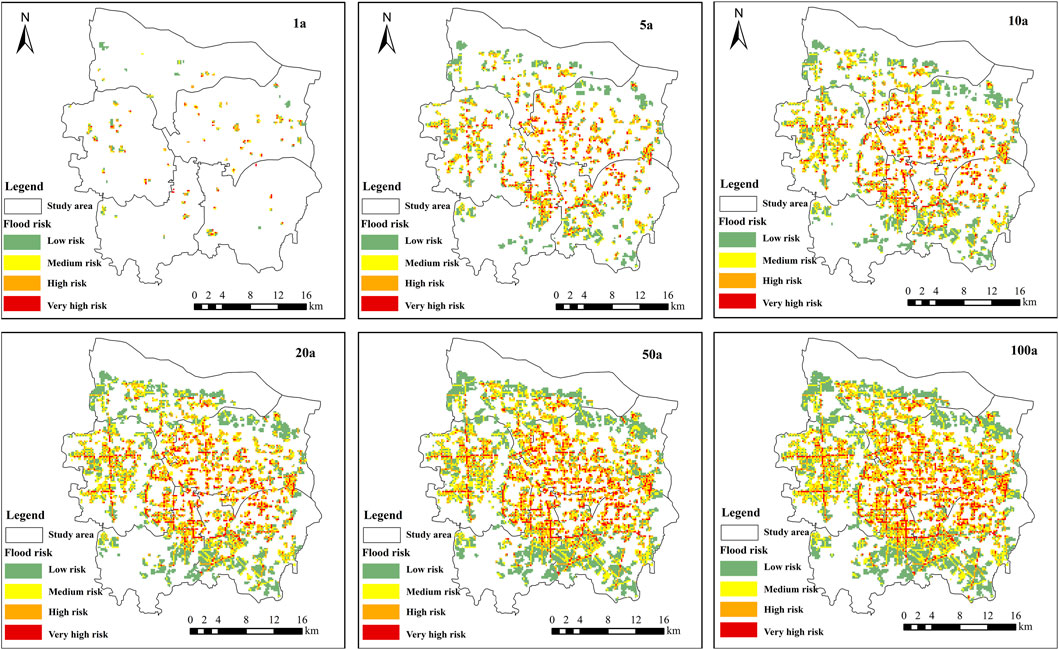
Figure 14. Comprehensive urban flood risk under six rainfall return periods.
To further explore the spatial evolution characteristics of the comprehensive urban flood risk under the rainfall return periods of 1, 5, 10, 20, 50, and 100 years, the changes in the number of grids of different risk classes corresponding to each return period were statistically analyzed. As shown in Figure 15, as the return period lengthens, the number of grids of different risk classes shows an overall increasing trend, among which the change of the number of grids in low-risk and medium-risk areas is particularly significant. In contrast, the high-and very high-risk zones show a “rapid increase followed by stabilization”, showing an obvious phased growth trend.
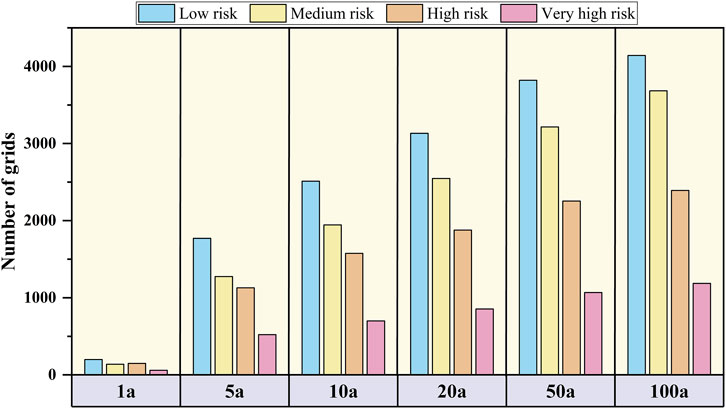
Figure 15. Number of grids for different recurrence periods and risk levels.
Specifically, from the stage of one in 1-year to 5-year, the scope of flooding impacts expanded rapidly, especially in the central Zhengzhou City where the capacity of the urban drainage system is weaker, resulting in the formation of large areas of waterlogging, which caused a substantial rise in the number of grids in low-risk and medium-risk areas. From the stage of one in 50-year to 100-year, the increase in the number of high-and very high-risk area grids tends to be slow, reflecting the limitations of the expansion of inundation space in the central city of Zhengzhou, although the overall risk level maintains an upward trend (Figure 6). This phenomenon is mainly due to the high rate of surface hardening, dense buildings, limited water retention capacity, and generally narrow river channels in central Zhengzhou, which makes it difficult for floodwaters to further break through the existing waterlogged boundaries under higher return period flooding scenarios, and makes the spatial extent of the high-and very high-risk zones tend to be stabilized.
However, this spatial “stabilization” does not mean that the level of risk is reduced. On the contrary, as the return period lengthens, the depth of waterlogging in the inundated area will increase significantly, which may induce secondary disasters and chain effects, such as waterlogging in underground spaces, interruption of power supply and paralysis of communications, and significantly exacerbate the disaster losses and social impacts in the severely waterlogged area. Therefore, the focus of risk control of more than once in 50-year rainfall event should be shifted from spatial prevention and control of regional expansion to in-depth management of the core inundation area and resilience enhancement of key functional facilities. Urban management departments need to collect real-time water monitoring, flood simulation, and disaster reporting information during flood disasters to quickly identify key infrastructure risks in flooded areas. And by timely dispatching emergency resources such as sandbags, water blocking plates, and pumping pumps, ensure the safe operation of important areas, key projects, and critical regions.
5 Conclusion
The current urban flood risk assessment lacks comprehensive consideration of disaster hazard and socio-economic attributes of the hazard-bearing body, which leads to a certain deviation between the assessment results and the actual flood risk. Therefore, this study uses FME theory and PCSWMM hydrological and hydrodynamic simulation technology, constructed a comprehensive flood risk assessment model with comprehensive consideration of flood inundation and socio-economic vulnerability, and quantitatively evaluated the flood risk of Zhengzhou city under different rainfall return periods. The main research conclusions are as follows:
1. An urban one-and two-dimensional coupled flood simulation model based on PCSWMM was established to simulate the flood inundation characteristics of Zhengzhou City under different recurrence periods. The ARE of the model validation results under three rainfall events did not exceed 20%, and the NSE was above 0.75, which verified that the model can accurately simulate the flooding process in Zhengzhou City. The inundation simulation results of Zhengzhou city show that the serious areas of simulation are mainly concentrated in the northeastern part of Jinshui District, the northern and western part of Guancheng District, and the northeastern part of Erqi District.
2. Combining flood simulation results and socio-economic vulnerability quantification methods, the socio-economic vulnerability characteristics of Zhengzhou City under different recurrence periods are revealed. In terms of economic vulnerability, potential losses are mainly located in commercial and residential functional areas, and the central city with higher exposure and asset value is particularly affected. As for the road system, the third-grade roads show high functional vulnerability due to their weak drainage capacity and high coverage density, making them vulnerable weak links. Population high vulnerability areas are particularly prominent in the central city, where high population density and relatively weak infrastructure lead to greater risk in flooding.
3. Based on the entropy weight method and the FME method, a comprehensive flood risk evaluation model was constructed with comprehensive consideration of flood inundation and socio-economic vulnerability. The results of the comprehensive risk evaluation show that the low-risk zones are primarily located in the periphery and fringe areas of the city, while the high-and very-high risk areas are concentrated in the central urban areas, especially in the western part of Jinshui District, the northeastern part of Erqi District, and the northern part of Guancheng District. These areas are the older urban areas of Zhengzhou that were constructed earlier and are characterized by low drainage system construction standards, aging pipe networks, dense population and road networks, and high economic value. Therefore, Zhengzhou city authorities should focus more on the flood risk in these areas.
However, the limitation of the acquired data may lead to some uncertainty in the results of the comprehensive risk evaluation. In this study, static data on population density from the WorldPop project were used to assess urban flood risk, and although this method can reflect the basic population flood risk characteristics of different inundated areas, it fails to fully consider the spatial-temporal dynamic distribution characteristics of urban population. Future research can further combine multiple sources of dynamic data, such as cell phone signaling and population thermal, to explore the impact mechanism of urban population flow on flood risk at different times (e.g., morning and evening peaks) and in different cycles (e.g., weekdays and holidays), so as to better capture the spatial and temporal dynamics of urban flood risk, offering a stronger foundation for urban flood prevention and control decisions.
Data availability statement
The original contributions presented in the study are included in the article/Supplementary Material, further inquiries can be directed to the corresponding author.
Author contributions
BM: Writing – original draft, Writing – review and editing. JG: Conceptualization, Formal Analysis, Resources, Writing – original draft. PC: Investigation, Methodology, Supervision, Writing – original draft. LZ: Funding acquisition, Writing – original draft. HW: Validation, Writing – original draft. YZ: Data curation, Formal Analysis, Writing – original draft. BS: Data curation, Validation, Writing – original draft.
Funding
The author(s) declare that financial support was received for the research and/or publication of this article. This research was funded by Modeling and Adaptive Mitigation Strategies for Urban Flooding Under Extreme Precipitation (KY2023-NGH-02-16), Excellent Youth Foundation of He’nan Scientific Committee (242300421038), Integrated Urban Water Network System for Water Security: Multi-dimensional Construction and Functional Enhancement Technologies (KY2024-ZD-04) and Multi-hazard Early Warning and Resilient Urban Management Framework for Coastal Flood-Storm Compound Events (KY2025-NGH-01-01).
Conflict of interest
Authors BM, JG, PC, and LZ were employed by PowerChina Huadong Engineering Corporation Limited.
The remaining authors declare that the research was conducted in the absence of any commercial or financial relationships that could be construed as a potential conflict of interest.
Generative AI statement
The author(s) declare that no Generative AI was used in the creation of this manuscript.
Any alternative text (alt text) provided alongside figures in this article has been generated by Frontiers with the support of artificial intelligence and reasonable efforts have been made to ensure accuracy, including review by the authors wherever possible. If you identify any issues, please contact us.
Publisher’s note
All claims expressed in this article are solely those of the authors and do not necessarily represent those of their affiliated organizations, or those of the publisher, the editors and the reviewers. Any product that may be evaluated in this article, or claim that may be made by its manufacturer, is not guaranteed or endorsed by the publisher.
Supplementary material
The Supplementary Material for this article can be found online at: https://www.frontiersin.org/articles/10.3389/feart.2025.1645693/full#supplementary-material
References
Ahiablame, L., and Shakya, R. (2016). Modeling flood reduction effects of low impact development at a watershed scale. J. Environ. Manag. 171, 81–91. doi:10.1016/j.jenvman.2016.01.036
Bibi, T. S., Kara, K. G., Bedada, H. J., and Bededa, R. D. (2023). Application of pcswmm for assessing the impacts of urbanization and climate changes on the efficiency of stormwater drainage systems in managing urban flooding in robe town, Ethiopia. J. Hydrol.-Reg. Stud. 45, 101291. doi:10.1016/j.ejrh.2022.101291
Chan, F. K. S., Lu, X., Li, J., Lai, Y., Luo, M., Chen, Y. D., et al. (2024). Compound flood effects, challenges and solutions: lessons toward climate-resilient Chinese coastal cities. Ocean and Coast. Manag. 249, 107015. doi:10.1016/j.ocecoaman.2023.107015
Chen, W., Wang, X., Deng, S., Liu, C., Xie, H., and Zhu, Y. (2019). Integrated urban flood vulnerability assessment using local spatial dependence-based probabilistic approach. J. Hydrol. 575, 454–469. doi:10.1016/j.jhydrol.2019.05.043
Chen, J., Huang, G., and Chen, W. (2021). Towards better flood risk management: assessing flood risk and investigating the potential mechanism based on machine learning models. J. Environ. Manag. 293, 112810. doi:10.1016/j.jenvman.2021.112810
Chen, J., Shi, X., Gu, L., Wu, G., Su, T., Wang, H.-M., et al. (2023). Impacts of climate warming on global floods and their implication to current flood defense standards. J. Hydrol. 618, 129236. doi:10.1016/j.jhydrol.2023.129236
Chen, Y., Rao, Z., Yuan, L., and Meng, T. (2025). Evaluation of energy saving and emission reduction in steel enterprises using an improved dempster–shafer evidence theory: a case study from China. Sustainability 17, 3954. doi:10.3390/su17093954
Deo, P., Siddiqui, M. A., Siddiqui, L., Naqvi, H. R., Faruque, U., and Dwivedi, D. (2025). An integrated approach for urban flood risk prediction using ahp-topsis model: a case study of jaipur region. Nat. Hazards. 121 (4), 4385–4445. doi:10.1007/s11069-024-06965-8
Dong, B., Xia, J., Li, Q., and Zhou, M. (2022). Risk assessment for people and vehicles in an extreme urban flood: case study of the “7.20” flood event in zhengzhou, China. Int. J. Disaster Risk Reduct. 80, 103205. doi:10.1016/j.ijdrr.2022.103205
Guan, X., Xia, C., Xu, H., Liang, Q., Ma, C., and Xu, S. (2023). Flood risk analysis integrating of bayesian-based time-varying model and expected annual damage considering non-stationarity and uncertainty in the coastal city. J. Hydrol. 617, 129038. doi:10.1016/j.jhydrol.2022.129038
Guo, X., Wang, W., Fang, X., Gong, Y., Li, J., Wang, M., et al. (2024). Analysis of self-rescue possibilities for pedestrians in the aftermath of destabilization during a flood event. Water 16 (9), 1218. doi:10.3390/w16091218
He, M., Chen, C., Zheng, F., Chen, Q., Zhang, J., Yan, H., et al. (2021). An efficient dynamic route optimization for urban flooding evacuation based on cellular automata. State Key Laboratory Hydrology-Water Resour. Hydraulic Eng. 87, 101622. doi:10.1016/j.compenvurbsys.2021.101622
Jun, R., Paolo, A., Mattia, M., Rui, S., Emanuele, S., Michalis, V., et al. (2023). Global evidence of rapid urban growth in flood zones since 1985. Nature 622 (7981), 87–92. doi:10.1038/s41586-023-06468-9
Liang, C., and Guan, M. (2024). Effects of urban drainage inlet layout on surface flood dynamics and discharge. J. Hydrol. 632, 130890. doi:10.1016/j.jhydrol.2024.130890
Liu, J., Shao, W., Xiang, C., Mei, C., and Li, Z. (2020). Uncertainties of urban flood modeling: influence of parameters for different underlying surfaces. Environ. Res. 182, 108929. doi:10.1016/j.envres.2019.108929
Liu, J., Feng, S., Gu, X., Zhang, Y., Beck, H. E., Zhang, J., et al. (2022). Global changes in floods and their drivers. J. Hydrol. 614, 128553. doi:10.1016/j.jhydrol.2022.128553
Lu, P., Zhou, Y., Wu, Y., and Li, D. (2022). Risk assessment of complex footbridge based on dempster-shafer evidence theory using fuzzy matter-element method. Appl. Soft Comput. 131, 109782. doi:10.1016/j.asoc.2022.109782
Lv, H., Guan, X., and Meng, Y. (2020). Comprehensive evaluation of urban flood-bearing risks based on combined compound fuzzy matter-element and entropy weight model. Nat. hazards 103 (No.2), 1823–1841. doi:10.1007/s11069-020-04056-y
Lv, H., Meng, Y., Wu, Z., Guan, X., and Liu, Y. (2021). Construction of flood loss function for cities lacking disaster data based on three-dimensional (object-function-array) data processing. Sci. Total Environ. 773, 145649. doi:10.1016/j.scitotenv.2021.145649
Lv, H., Wu, Z., Guan, X., Meng, Y., Wang, H., and Zhou, Y. (2023). Threshold effect of data amount and grid size on urban land use type identification using multi-source data fusion. Sust. Cities Soc. 8, 104855. doi:10.1016/j.scs.2023.104855
Ma, B., Wu, Z., Hu, C., Wang, H., Xu, H., Yan, D., et al. (2022a). Process-oriented swmm real-time correction and urban flood dynamic simulation. J. Hydrol. 605, 127269. doi:10.1016/j.jhydrol.2021.127269
Ma, C., Chen, Z., Zhao, K., Xu, H., and Qi, W. (2022b). Improved urban flood risk assessment based on spontaneous-triggered risk assessment conceptual model considering road environment. J. Hydrol. 608, 127693. doi:10.1016/j.jhydrol.2022.127693
Magnus, H., and Ola, K. (2020). Sea-level rise projections for Sweden based on the new ipcc special report: the ocean and cryosphere in a changing climate. Ambio 49 (10), 1587–1600. doi:10.1007/s13280-019-01313-8
Tallar, R., and Geldoffer, G. (2022). A micro-scale study of flood risk assessment in urban fluvial areas using the flood potential index. Front. Environ. Sci. 10, 846450. doi:10.3389/fenvs.2022.846450
Wu, Z., Zhou, Y., Wang, H., and Jiang, Z. (2020). Depth prediction of urban flood under different rainfall return periods based on deep learning and data warehouse. Sci. Total Environ. 716, 137077. doi:10.1016/j.scitotenv.2020.137077
Wu, M., Wu, Z., Ge, W., Wang, H., Shen, Y., and Jiang, M. (2021). Identification of sensitivity indicators of urban rainstorm flood disasters: a case study in China. J. Hydrol. 599, 126393. doi:10.1016/j.jhydrol.2021.126393
Xu, K., Han, Z., Xu, H., and Bin, L. (2023). Rapid prediction model for urban floods based on a light gradient boosting machine approach and hydrological–hydraulic model. Int. J. Disaster Risk Sci. 14 (1), 79–97. doi:10.1007/s13753-023-00465-2
Xu, W., Han, P., and Proverbs, D. (2025). A new approach to evaluating urban flood risk: the case of Guangdong province in China. water J. 22 (4), 419–435. doi:10.1080/1573062x.2025.2472344
Zhang, R., Li, Y., Chen, T., and Zhou, L. (2024). Flood risk identification in high-density urban areas of Macau based on disaster scenario simulation. Int. J. Disaster Risk Reduct. 107, 104485. doi:10.1016/j.ijdrr.2024.104485
Zhou, Y., Wu, Z., Liang, Q., Xu, H., Wang, H., and Xue, W. (2024). Threshold and real-time initiation mechanism of urban flood emergency response under combined disaster scenarios. Sust. Cities Soc. 108, 105512. doi:10.1016/j.scs.2024.105512
Keywords: urban flood, comprehensive risk, fuzzy matter-element, socio-economic vulnerability, entropy weight method
Citation: Ma B, Guo J, Chen P, Zhang L, Wang H, Zhou Y and Sun B (2025) Comprehensive risk assessment of urban floods based on flood simulation and socio-economic vulnerability. Front. Earth Sci. 13:1645693. doi: 10.3389/feart.2025.1645693
Received: 12 June 2025; Accepted: 11 August 2025;
Published: 25 August 2025.
Edited by:
William Higgisson, University of Canberra, AustraliaReviewed by:
Dengfeng Liu, Xi’an University of Technology, ChinaZhongfan Zhu, Beijing Normal University, China
Copyright © 2025 Ma, Guo, Chen, Zhang, Wang, Zhou and Sun. This is an open-access article distributed under the terms of the Creative Commons Attribution License (CC BY). The use, distribution or reproduction in other forums is permitted, provided the original author(s) and the copyright owner(s) are credited and that the original publication in this journal is cited, in accordance with accepted academic practice. No use, distribution or reproduction is permitted which does not comply with these terms.
*Correspondence: Huiliang Wang, d2FuZ2h1aWxpYW5nQHp6dS5lZHUuY24=