 Shaobo Wang
 Lei Xu1,2,3,4*
- 1Changjiang Geophysical Exploration and Testing Co., Ltd. (Wuhan), Wuhan, Hubei, China
- 2Changjiang Institute of Survey Planning Design and Research Co., Ltd., Wuhan, Hubei, China
- 3National Dam Safety Research Center, Wuhan, Hubei, China
- 4Technological Innovation Center for Health Diagnosis of Water Conservancy Project, Wuhan, Hubei, China
- 5Hunan Provincial Water Resources Development and Investment Co., Ltd., Changsha, Hunan, China
When conducting engineering construction in karst-developed regions, the presence of concealed underground karst systems can easily induce geological hazards such as ground collapse and foundation settlement, posing serious threats to engineering safety. Therefore, it is imperative to ascertain critical information including the degree of karst development and spatial distribution characteristics within the project area. Geophysical prospecting methods, characterized by high efficiency, cost-effectiveness, and strong detection accuracy, have proven to be an effective technical approach for karst exploration. This paper systematically examines several geophysical methods and their detection effectiveness for cavities with different filling states. The research outcomes can provide valuable references for karst investigation in similar engineering projects.
1 Introduction
Karst phenomenon refers to a natural geological process characterized by the long-term dissolution and erosion of soluble rock formations, predominantly carbonate rocks such as limestone and dolomite, by groundwater (Ford and Williams, 2007). This process gradually forms distinctive geological features including karst cavities, solution grooves, and subterranean river systems. The development of karst significantly compromises the structural integrity of rock strata, resulting in reduced mechanical strength and unstable geological conditions. Such weakened formations fail to provide adequate load-bearing capacity for overlying structures, thereby posing substantial risks during tunnel construction, including cavity collapse, sudden mud inrushes, and water outbursts (White, 1988). For engineering projects in karst terrains, priority must be given to comprehensive engineering geological surveys. These investigations should systematically assess the developmental stages of subsurface karst features, delineate spatial distribution patterns of karst structures, and elucidate their evolutionary mechanisms. A thorough understanding of karst distribution characteristics and developmental patterns forms the essential foundation for mitigating geological hazards and ensuring engineering safety in such complex geological settings (Parise and Gunn, 2007; Zhou et al., 2002; Kresic and Stevanovic, 2009). Current mainstream karst investigation methodologies primarily encompass geological mapping, engineering drilling, and geophysical prospecting (Li and Xiao, 2006; Goldscheider et al., 2011; Kaufmann, 2014). Geological mapping involves inferring karst distribution through field observations of surface exposures—such as solution grooves, sinkholes, and tiankeng—supplemented by existing geological data (Meng et al., 2019; Luo et al., 2009). While cost-effective for preliminary assessments, this approach remains heavily reliant on the expertise of field personnel and proves particularly limited in areas with complex geological settings or deeply buried karst systems, where surface manifestations poorly correlate with subsurface realities (Yin, 2009). Engineering drilling, through core sampling, enables relatively accurate characterization of lithological profiles along borehole trajectories, thereby facilitating subsurface karst interpretation. However, this method inherently provides localized insights constrained by drilling penetration points. In regions with densely clustered or interconnected karst cavities, isolated borehole data may fail to detect critical geological anomalies, potentially leading to misinterpretations of three-dimensional karst architectures. Nevertheless, implementing dense drilling grids for enhanced coverage often becomes prohibitively expensive and time-intensive (Geng and Sun, 2000; Li and Cao, 2017).
Geophysical prospecting methods operate on the principle of detecting contrasts in geophysical properties—such as body wave velocity and electrical resistivity—among distinct subsurface media objects (Telford et al., 1990). These techniques facilitate rapid, large-scale karst investigations through non-invasive means, demonstrating significant advantages in survey efficiency, cost-effectiveness, and interpretation accuracy (Mccann et al., 1987; Yang, 2017). The characteristic geophysical parameters of typical media (China Water and Power Press, 2021) in karst terrains are systematically compiled in Table 1 below. In 1990, Hohmann and Newman conducted a study on distortion attenuation curves during measurements using central-loop and coincident-loop configurations in transient electromagnetic (TEM) systems (Hohmann and Newman, 1990). In 2001, Franjo Šumanovac and Mario Weisser employed shallow seismic and electrical methods to detect karst development, achieving favorable results (Šumanovac and Weisser, 2001). In 2003, Zhang Jiagui et al. utilized audio-frequency magnetotellurics (AMT) and seismic computed tomography (CT) techniques to investigate concealed karst features in the Three Gorges Reservoir area, attaining satisfactory outcomes (Zhang et al., 2003). In 2009, Chen Binwen applied shallow seismic methods combined with high-density resistivity techniques to detect karst development along highways with notable efficacy (Chen, 2009). In 2010, Estrada-Medina Hector et al. successfully identified shallow karst structures in limestone terrains using 200 MHz ground-penetrating radar (GPR) (Estradamedina et al., 2010). In 2014, Marjana Zajc et al. investigated the influence of topographic conditions on GPR detection performance (Zajc et al., 2014). As global research on karst exploration advances, successful engineering applications continue to accumulate. Nevertheless, studies on geophysical responses to karst cavities under varying fill conditions remain limited, with most existing research confined to theoretical frameworks. Practical engineering scenarios often deviate from theoretical predictions.
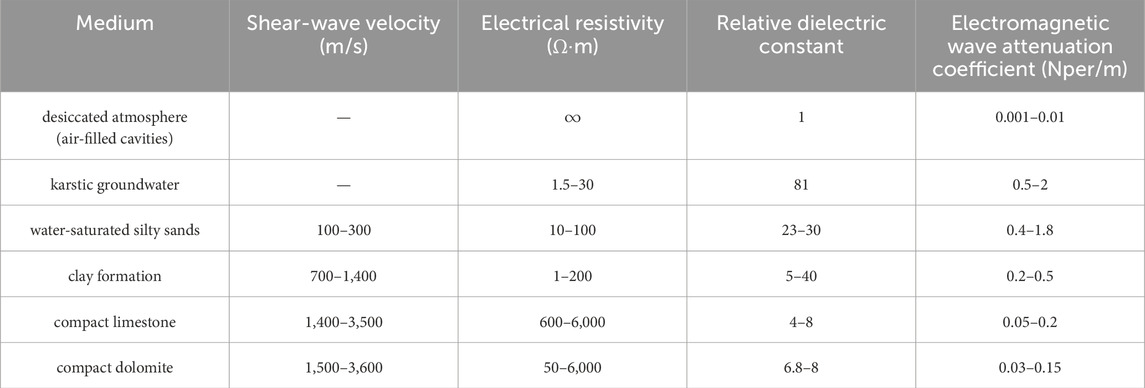
Table 1. Characteristic geophysical parameters of typical media in karst terrains.
Geophysical prospecting methods have been widely adopted by engineers and researchers worldwide for karst exploration with demonstrated effectiveness. However, studies on geophysical response characteristics of karst cavities with different filling conditions remain insufficient, with most research limited to theoretical analysis and numerical simulations, lacking validation through actual engineering cases. This study delineates the fundamental principles of four geophysical techniques (multi-electrode resistivity method, cross-hole electromagnetic wave computed tomography, microtremor survey, and ground penetrating radar) and establishes their standardized data processing workflows for karst detection. Through field cases verified by borehole drilling and tunnel excavation, the detection efficacy and distinctive geophysical signatures of these methods for identifying variably-filled karst cavities are comprehensively analyzed. The practical engineering applications provide crucial empirical evidence bridging the gap between theoretical models and field implementation.
2 Geophysical prospecting methods
As shown in the Table 1 above, significant differences exist in geophysical parameters between intact rock masses and karst cavities with different filling conditions: Air-filled cavities exhibit lower seismic wave velocity, higher electrical resistivity, and weaker electromagnetic wave attenuation compared to bedrock. Relative to bedrock, water-filled cavities exhibit lower seismic wave velocity, reduced electrical resistivity, and heightened electromagnetic signal attenuation rate.
The marked contrast in physical properties ensures the feasibility of applying the geophysical prospecting methods for karst detection. Consequently, the following section introduces several typical prospecting techniques applicable to karst surveys and their characteristics.
2.1 Multi-electrode resistivity method
2.1.1 Methodology
Multi-electrode resistivity method is an electrical exploration technique based on resistivity differences between subsurface media. It studies the distribution patterns of conductive currents under artificially applied steady-state electric fields.
The method’s defining feature is deploying tens to hundreds of electrodes along a survey line simultaneously. Automated acquisition systems measure potential values between measurement electrodes and current values in circuits using predefined array configurations (Dong and Wang, 2003).
Electrode spacing is adjustable based on detection requirements. Extensive data acquisition ensures sufficient geoelectric information for inversion imaging. In field operations, current is transmitted between surface electrodes (A, B), while potentials are measured between electrodes (M, N). The apparent resistivity formula (Equation 1) for subsurface media is:
In the formula,
In practical operations, various electrode configurations may be employed. Taking the Wenner array as an example: Electrodes A, M, N, and B are deployed sequentially along the survey line with equal spacing n. After each measurement cycle, all electrodes advance simultaneously to the next station until Electrode B reaches the terminus of the line. The electrode spacing n is then incrementally modified, and the procedure repeats. Systematic increases in n facilitate the mapping of apparent resistivity (
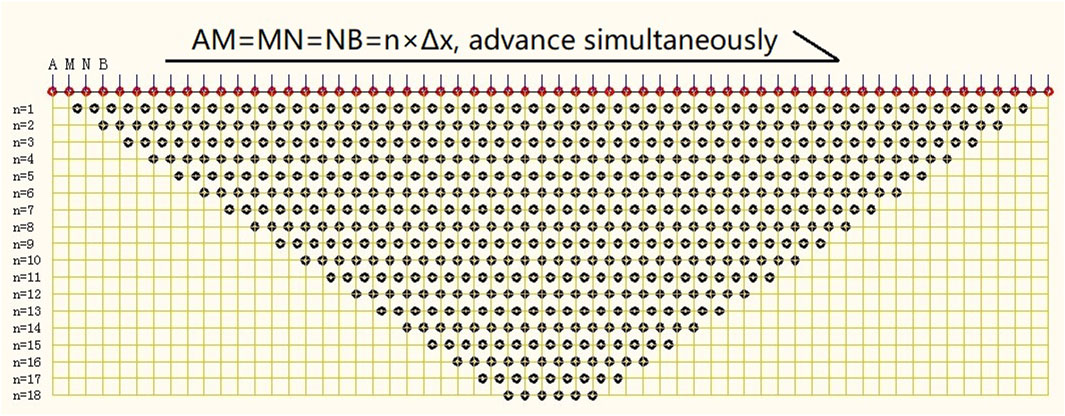
Figure 1. Sketch of data acquisition for Wenner array.
2.1.2 Data processing workflow
Field-acquired resistivity data typically represents apparent resistivity, which requires processing to reveal subsurface geology and enable geological interpretation.
(1) Data Transfer and Format Conversion: Field data stored in the instrument console are transferred to a computer and converted into. dat format compatible with processing software using dedicated utilities.
(2) Profile Stitching: For survey lines exceeding the maximum array length, multiple overlapping arrays are deployed. All array datasets along a single profile must be merged into a continuous transect prior to subsequent processing.
(3) Bad Point Editing: Field observations may contain degraded data points due to ambient noise interference during acquisition. Extreme high/low-value outliers are discarded to prevent artifact anomalies in inversion results.
(4) Topographic Correction: Given that inversion algorithms typically assume horizontally layered media, terrain elevation data are incorporated to compensate for topographic effects and enhance subsurface model fidelity.
(5) Data Inversion: Following preparatory steps, inversion parameters are configured in specialized software. Least-squares inversion (implemented in RES2DINV®) is iteratively executed until misfit errors converge below threshold criteria.
(6) Result Visualization: Inverted resistivity distributions from RES2DINV® are contoured in Surfer®. The draft plots undergo cartographic refinement in AutoCAD® for geological interpretation.
2.1.3 Representative case study and analysis
As tabulated in Table 1, compact limestone and dolomite demonstrate resistivities reaching 6,000 Ω m, contrasting markedly with water-saturated silty sands (<100 Ω m) and karstic groundwater (<30 Ω m), while air-filled cavities exhibit near-infinite resistivity values. This pronounced electrical contrast fundamentally enables karst cavity detection through multi-electrode resistivity method.
Illustrating with a multi-electrode resistivity method survey for karst exploration in Hunan, China (Figure 2), three prospective karst zones (A1–A3) were delineated: Zones A1 and A3 exhibiting low-resistivity anomalies indicative of water-filled cavities, while Zone A2 displayed high-resistivity signatures characteristic of air-filled cavities. Subsequent drilling operations comprising eight boreholes confirmed water-filled cavities in Borehole K3 (elev. 314–347 m), K4 (elev. 315–353 m), and K6 (elev. 325–348 m), with an air-filled cavity intercepted in K7 (elev. 298–300 m). No karst features were encountered in other boreholes.
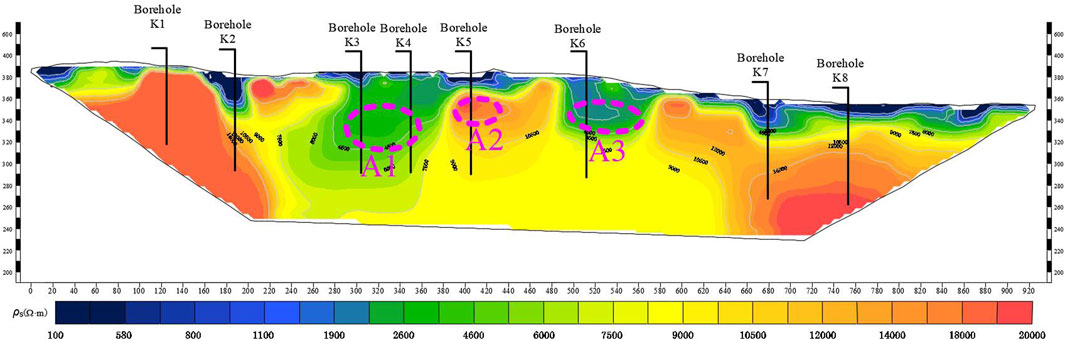
Figure 2. Multi-electrode resistivity method inversion section.
Borehole validation demonstrates that anomalies A1 and A3 accurately predict water-filled cavities, whereas anomaly A2 yields no karst cavity—confirming multi-electrode resistivity method exhibits higher reliability in detecting water-filled cavities. Low-resistivity anomalies serve as robust indicators for filled-karst features. Notably, despite the significant resistivity contrast between air (theoretically infinite) and competent bedrock (e.g., limestone/dolomite), multi-electrode resistivity method possesses inherent limitations: its greater sensitivity to conductive targets complicates definitive identification of small air-filled cavities, primarily due to resolution constraints and signal attenuation effects.
2.2 Cross-borehole electromagnetic wave computed tomography
2.2.1 Methodology
The fundamental principle of cross-borehole computed tomography technique lies in reconstructing an object through layer-by-layer tomographic imaging. For a cross-sectional image slice of the object, defined as a function of two spatial variables
In the formula,
2.2.2 Data processing workflow
(1) Field Data Acquisition: Electromagnetic wave field amplitude values are acquired, with excitation and receiver coordinates for each ray path calculated based on surveyed positional data.
(2) Model Construction: A mathematical-physical model is established considering geological/geophysical constraints, observation geometry, imaging resolution, and project objectives. Initial model parameters and constraints are derived from known geological conditions, empirical values, and field calibration tests.
(3) Data Inversion: Tomographic inversion is implemented using algorithms such as Simultaneous Iterative Reconstruction Technique (SIRT) or Algebraic Reconstruction Technique (ART), with iterative optimization to refine imaging results.
(4) Result Visualization: Absorption coefficient contour maps are generated in Surfer®, subsequently refined in AutoCAD® for geological interpretation. Final tomographic images employ pseudocolor display with either: Equal-interval classification for quantitative analysis, or Variable-interval coloring to enhance anomaly contrast.
2.2.3 Representative case study and analysis
As tabulated in Table 1, compact limestone and dolomite exhibit electromagnetic wave attenuation coefficients below 0.2Nper/m, contrasting markedly with air-filled cavities (0.01Nper/m), water-saturated silty sands (>0.4Nper/m) and karstic groundwater (>0.5Nper/m). This pronounced electromagnetic wave attenuation contrast fundamentally enables karst cavity detection through cross-borehole electromagnetic wave computed tomography.
Figure 3 illustrates the electromagnetic wave tomography results from a karst exploration in Hubei, China, where the profile exhibits strong electromagnetic wave attenuation in the upper section due to overburden effects, contrasting with low-attenuation bedrock zones in the lower section. Within this competent bedrock, three high-attenuation anomalies (B1–B3) were identified as potential karst features. Borehole validation confirmed cavities at all anomaly locations: B1 corresponds to an air-filled cavity, B2 to an argillaceous semi-filled cavity, and B3 to a water-filled cavity. Analysis reveals that anomalies B2 and B3 reflect highly attenuative fill materials, with B3’s elevated absorption coefficient relative to B2 being consistent with the greater electromagnetic wave absorption of karstic groundwater versus water-saturated silty sands. Paradoxically, despite air’s intrinsically low absorption coefficient, anomaly B1 exhibits strong attenuation attributable to multiple internal electromagnetic wave reflections within the air-filled cavity that dissipate wave energy. This case demonstrates that cross-borehole electromagnetic wave tomography effectively discriminates cavities with distinct infill conditions (air/water/sediment) through their characteristic attenuation signatures.
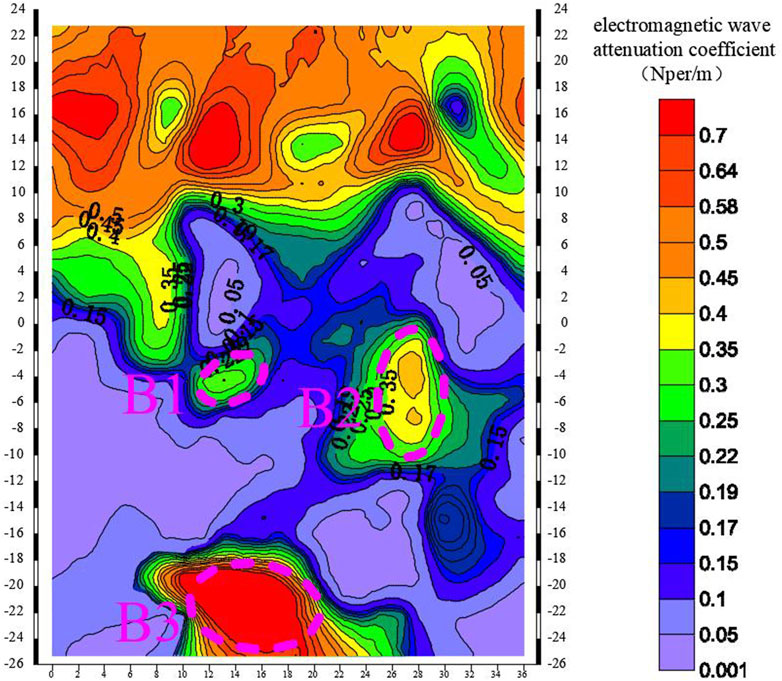
Figure 3. Cross-borehole electromagnetic wave computed tomography inversion section.
2.3 Microtremor survey method
2.3.1 Methodology
Microtremors represent persistent low-amplitude vibrations of the earth’s surface, generated by natural sources (e.g., wind, oceanic waves, volcanic activity, and tidal forces) and anthropogenic activities (e.g., vehicular traffic and machinery operation). The former, characterized by frequencies typically <1 Hz, are classified as long-period microtremors; the latter, exhibiting frequencies >1 Hz, are termed short-period microtremors. These vibrations constitute a composite wavefield comprising body waves (P- and S-waves) and surface waves (Rayleigh and Love waves), with surface wave energy dominating approximately 70% of the total signal energy.
Microtremor survey entails processing ambient microtremor signals to extract Rayleigh wave dispersion curves via spatial autocorrelation (SPAC) or frequency-wavenumber (F-K) analysis. Through inversion of these dispersion characteristics, subsurface shear-wave velocity (Vs.) structures are reconstructed. Geological features are subsequently delineated by analyzing Vs. contrasts between target formations and surrounding media, thereby addressing critical engineering geological objectives such as bedrock profiling, cavity detection, and stratigraphic interface mapping (Coccia et al., 2010).
2.3.2 Data processing workflow
(1) Data Extraction Phase: The continuous observation files are segmented based on the precise start/end acquisition timestamps recorded at each field array station, yielding discrete datasets for individual measurement points. This process ensures temporal alignment with actual field deployment configurations while preserving original sampling characteristics.
(2) Data Standardization: Systematic implementation of baseline correction, DC component removal, and filtering operations to suppress instrument noise and anomalous interference signals. Data segments exhibiting significant interference are excluded based on predefined signal quality thresholds.
(3) Inversion Implementation: Rayleigh wave dispersion curves are extracted from array data using either Frequency-Wavenumber (F-K) spectral analysis or Spatial Autocorrelation (SPAC) method. The derived dispersion characteristics undergo nonlinear inversion via globally optimized algorithms to reconstruct 1D shear-wave velocity (Vs.) profiles with depth resolution of λ/3 to λ/4 (where λ denotes wavelength).
(4) Result Visualization: Shear-wave velocity (Vs.) distributions are contoured in Surfer®. The preliminary plots undergo graphical refinement in AutoCAD® to produce finalized interpretative sections for geophysical analysis.
2.3.3 Representative case study and analysis
As tabulated in Table 1, compact limestone and dolomite exhibit shear-wave velocities exceeding 1400 m/s, while shear-wave propagation is physically prohibited in air-filled cavities and karstic groundwater (effectively yielding zero velocity). Water-saturated silty sands typically register velocities below 300 m/s. This pronounced shear-wave velocity contrast between competent bedrock and cavities serves as the physical basis for microtremor survey for karst cavity detection.
Illustrating a microtremor survey for karst exploration in Jiangxi, China (Figure 4), the Vs. section delineates distinct velocity domains: surficial low-velocity layers overlie high-velocity bedrock, with embedded low-velocity anomalies (C1–C4) indicating potential karst development. Subsequent drilling confirmed cavities at all four anomalies: C1 and C3 as fully sediment-filled cavities, and C2 and C4 as partially filled cavities. Critically, microtremor methods accurately detect cavities regardless of fill saturation—since all filled cavities manifest as velocity deficits relative to intact rock—but cannot discriminate fill conditions.
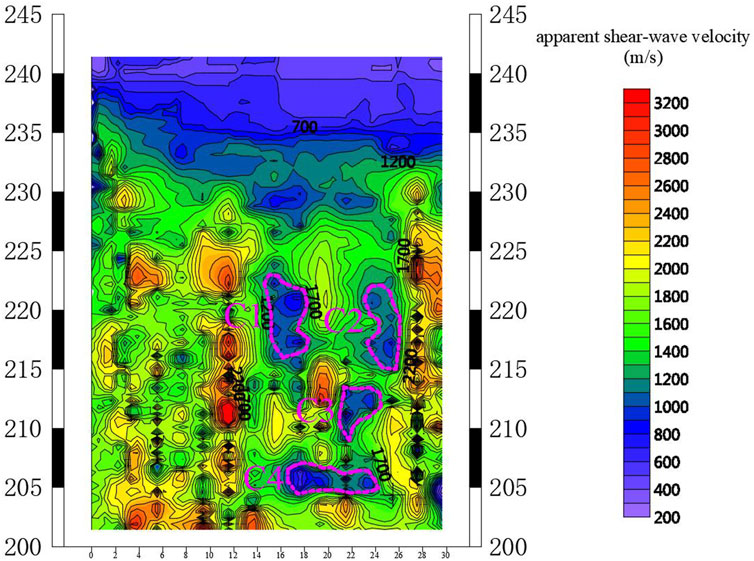
Figure 4. Microtremor survey inversion section.
2.4 Ground penetrating radar
2.4.1 Methodology
Ground penetrating radar (GPR) operates as an electromagnetic method wherein a transmitting antenna directs high-frequency, short-pulse electromagnetic waves into subsurface interfaces. When encountering boundaries with contrasting electrical properties, these waves undergo partial reflection governed by the Fresnel equations, with reflection coefficients determined by dielectric permittivity contrasts. Reflected waves are captured by a receiving antenna, with propagation paths obeying Snell`s law and reflection amplitudes correlating to dielectric contrasts and interface geometry. Through acquisition of time-domain signals, velocity-based time-depth conversion, and waveform analysis, this technique resolves the depth, lateral position, and geometric attributes of subsurface targets or stratigraphic interfaces (Al-fares et al., 2002; Xu, 2015).
2.4.2 Data processing workflow
(1) Data Preprocessing: Raw data imports undergo compatibility verification in dedicated software, followed by trace editing and dead-channel removal. Direct current offsets are eliminated to normalize waveform baselines, reflection events are time-aligned, and coherent background noise (e.g., surface metallic objects, fixed interference sources) is suppressed to enhance valid signals.
(2) Filtering Operations: Bandpass/highpass/lowpass filters attenuate high-frequency noise and low-frequency drifts. Frequency-Wavenumber (F-K) filtering isolates dipping interference from target reflections, while moving-average or stacking filters mitigate lateral random noise.
(3) Gain Compensation: Amplitude recovery counteracts electromagnetic wave attenuation with depth, improving deep-target signal visibility. Localized calibration of gain functions optimizes dynamic range for anomalous zones.
(4) Time-Depth Conversion and Imaging: Input of relative permittivity (empirical or calibrated) determines electromagnetic wave velocity. Scan interval calibration and distance normalization ensure precise depth scaling, culminating in time-to-depth transformed 2D B-scan or 3D volumetric outputs for interpretable subsurface imaging.
2.4.3 Representative case study and analysis
The dielectric properties of materials govern their polarization capability under electric fields. Table 1 demonstrates that compact limestone and dolomite exhibit relative permittivity values typically below 8, while air-filled cavities register as 1. In contrast, water-saturated silty sands show permittivity ≥23, and karstic groundwater reaches 81. This pronounced dielectric contrast between competent bedrock and cavities, coupled with electrical conductivity differences, serves as the theoretical basis for ground penetrating radar cavity detection by inducing measurable alterations in reflected wave amplitude and frequency.
Illustrating two representative ground penetrating radar surveys for advance geological prediction in a Hunan tunnel (Figures 5a,b), diagnostic subsurface anomalies exhibiting hyperbolic phase axes were identified.
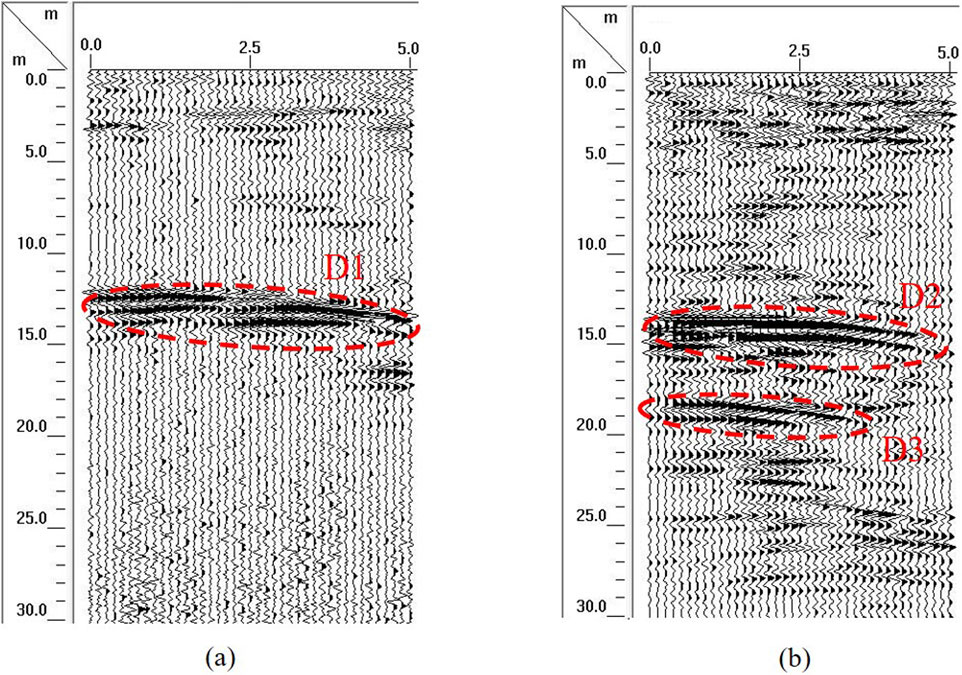
Figure 5. Interpreted GPR profiles for karst feature identification.
Figure 5a reveals a high-amplitude reflection zone (D1) at 12 m behind the tunnel face, exhibiting near-parabolic waveform phase axes, interpreted as a karst cavity development zone. Subsequent excavation confirmed a clay-filled karst cavity in this location.
Figure 5b delineates two anomalies: a pronounced reflective zone (D2) at 14 m behind the face with parabolic phase axes, indicating a cavity; and a secondary zone 5 m further back (D3) showing weaker-amplitude parabolic reflections, likely attributable to multiple reflections. Excavation validated an air-filled cavity at 13 m depth (D2).
Geophysical analysis establishes that the presence of karst cavities within a ground penetrating radar survey zone invariably modifies radar wave signatures through distinct interfaces: the cavity’s frontal boundary invariably generates high-amplitude reflections accompanied by waveform distortions and discontinuous phase axes, manifesting as intense reflective zones exemplified by areas D1 and D2. Critically, the infill material dictates subsequent signal behavior—cavities saturated with conductive media such as water-saturated silts or karstic groundwater induce severe electromagnetic attenuation, wholly suppressing secondary reflections. Conversely, air-filled cavities permit unimpeded wave transmission with minimal loss, enabling reflections at the rear interface that subsequently transmit through the frontal boundary; these secondary reflections exhibit waveform coherence with the primary wave but display attenuated amplitudes, as empirically documented in Area D3. Collectively, these diagnostic amplitude-phase responses and multi-reflection signatures empower ground penetrating radar to accurately detect and differentiate cavity infill conditions with high geophysical fidelity.
3 Conclusion
This study details the methodological principles and data processing workflows of four geophysical prospecting methods—multi-electrode resistivity method, cross-hole electromagnetic wave computed tomography, microtremor survey, and ground penetrating radar—with empirical case analyses evaluating their efficacy in detecting variably-filled karst cavities. Key findings are.
(1) Multi-electrode resistivity method accurately locates sediment-infilled cavities but exhibits limited sensitivity to open cavities; low-resistivity anomalies within high-resistivity bedrock backgrounds typically indicate infilled karst.
(2) Cross-hole electromagnetic wave computed tomography precisely identifies cavities regardless of fill conditions and discriminates fill states; strong absorption anomalies against weakly absorptive bedrock backgrounds signify cavity presence, with infilled cavities demonstrating consistently higher electromagnetic absorption than open cavities.
(3) Microtremor survey achieves reliable cavity localization but cannot differentiate fill states, as both infilled and open cavities manifest as low-velocity anomalies relative to intact bedrock.
(4) Ground penetrating radar enables precise cavity mapping and fill-state discrimination; cavities generate high-amplitude reflection zones exhibiting near-parabolic phase axes within bedrock backgrounds. Crucially, infilled cavities lack secondary reflections whereas open cavities produce distinct multiple reflections.
Data availability statement
The original contributions presented in the study are included in the article/supplementary material, further inquiries can be directed to the corresponding author/s.
Author contributions
SW: Data curation, Investigation, Validation, Writing – original draft, Writing – review and editing. LX: Validation, Methodology, Writing – original draft, Writing – review and editing. PL: Methodology, Validation, Writing – review and editing. SW: Data curation, Writing – original draft, Investigation. LL: Funding acquisition, Project administration, Supervision, Writing – original draft. ZL: Writing – original draft, Funding acquisition, Project administration.
Funding
The author(s) declare that financial support was received for the research and/or publication of this article. The research was supported by Quanmutang Reservoir Project Technology Innovation Program (W-2022-72), Major Science and Technology Projects of Ministry of Water Resources (SKS-2022099), Wuhan Science and Technology Plan Project (2023030103010570) and Changjiang Survey Planning Design and Research Limited Co. Independent Innovation Research Project (CX 2022Z32). The authors declare that this study received funding from Changjiang Survey Planning Design and Research Limited Co. The funder was not involved in the study design, collection, analysis, interpretation of data, the writing of this article, or the decision to submit it for publication.
Conflict of interest
Authors SW, LX, PL, and SW were employed by Changjiang Geophysical Exploration and Testing Co., Ltd. (Wuhan). Authors SW, LX, PL, and SW were employed by Changjiang Institute of Survey Planning Design and Research Co., Ltd. Authors LL and ZL were employed by Hunan Provincial Water Resources Development and Investment Co., Ltd.
Generative AI statement
The author(s) declare that no Generative AI was used in the creation of this manuscript.
Publisher’s note
All claims expressed in this article are solely those of the authors and do not necessarily represent those of their affiliated organizations, or those of the publisher, the editors and the reviewers. Any product that may be evaluated in this article, or claim that may be made by its manufacturer, is not guaranteed or endorsed by the publisher.
References
Al-fares, W., Bakalowicz, M., Guérin, R., and Dukhan, M. (2002). Analysis of the karst aquifer structure of the Lamalou area (Hérault, France) with ground penetrating radar. J. Appl. Geophys. 51:97–106. doi:10.1016/S0926-9851(02)00215-X
Chen, B. W. (2009). Study on comprehensive geophysical exploration methods of Karst cave exploration for the highway. Changsha, China: Central South University.
China Water and Power Press (2021). Code for exploration of water resources and hydropower projects Part 1: geophysical exploration: SL/T 291.1-2021. Beijing: China Water and Power Press
Coccia, S., Gaudio, V. D., Venisti, N., and Wasowski, J. (2010). Application of Refraction Microtremor (ReMi) technique for determination of 1-D shear wave velocity in a landslide area. J. Appl. Geophys. 71, 71–89. doi:10.1016/j.jappgeo.2010.05.001
Dong, H. B., and Wang, C. L. (2003). Development and application of 2D resistivity imaging surveys. Earth Sci. Front. (1), 171–176. doi:10.3321/j.issn:1005-2321.2003.01.020
Estradamedina, H., Tuttle, W., Graham, R. C., Allen, M. F., and Jiménez-Osornio, J. J. (2010). Identification of underground karst features using ground-penetrating radar in northern yucatán, méxico. Vadose Zone J. 9 (3), 653–661. doi:10.2136/vzj2009.0116
Ford, D., and Williams, P. (2007). Karst hydrogeology and geomorphology. Chichester: John Wiley and Sons, Vol. 1-30, 198–210.
Geng, R. L., and Sun, J. H. (2000). Karst and the features of drilling in the karst area. Explor. Eng. (Rock Soil Drill. Tunneling)(6), 3–6. doi:10.3969/j.issn.1672-7428.2000.06.002
Goldscheider, N., Plagnes, V., Guerin, R., Valois, R., and Bosch, F. P. (2011). Contribution of geophysical methods to karst-system exploration: an overview. Hydrogeology J. 19 (6), 1169–1180. doi:10.1007/s10040-011-0746-x
Hohmann, G. W., and Newman, G. A. (1990). Transient electromagnetic responses of surficial polarizablepatches. Geophysics 5, 1098–1100. doi:10.1190/1.1442921
Kaufmann, O. (2014). Geophysical mapping of solution and collapse sinkholes. J. Appl. Geophys. 111, 271–288. doi:10.1016/j.jappgeo.2014.10.011
N. Kresic, and Z. Stevanovic (2009). Groundwater hydrology of springs: engineering, theory, management, and sustainability. Oxford: Butterworth-Heinemann. p. 325–343.
Li, D., and Xiao, K. H. (2006). High density electrical resistance exploration in the NO.2 TieFengShan tunnel. J. Eng. Geol. 14(3), 197–200. doi:10.3969/j.issn.1672-7940.2006.03.008
Li, J. M. (2005). Geoelectric field and electrical prospecting. Beijing: Geological Publishing House, 144–157.
Li, Q., and Cao, L. M. (2017). Exploration and practice of air drilling in karst areas: a case study of Well Anyie-1. Petroleum Geol. Eng. 31(1), 115–117+120+134. doi:10.3969/j.issn.1673-8217.2017.01.027
Liu, R. Z., Tian, Q. W., Yu, S. J., Chen, H., and Min, X. L. (2014). Triangular grid sonic computerized tomography for structural concrete. Prog. Geophys. 29(4), 1907–1913. doi:10.6038/pg20140458
Luo, Y. D., Liang, H., Gao, H. F., and Qin, X. X. (2009). A tentative discussion on methods for urban karst geological survey and evaluation: a case study of Hangzhou City in Zhejiang Province. Geol. China 36 (5), 1187–1193. doi:10.3969/j.issn.1000-3657.2009.05.023
Mccann, D. M., Jackson, P. D., and Culshaw, M. G. (1987). The use of geophysical surveying methods in the detection of natural cavities and mineshafts. Q. J. Eng. Geol. Hydrogeology 20, 59–73. doi:10.1144/gsl.qjeg.1987.020.01.06
Meng, F. S., Zhang, G., Chen, M. J., and Li, H. L. (2019). 3-D inversion of high density resistivity method based on 2-D high-density electrical prospecting data and its engineering application. Geophys. Geochem. Explor. 43(3), 672–678. doi:10.11720/wtyht.2019.1247
M. Parise, and J. Gunn (2007). Natural and anthropogenic hazards in karst areas: recognition, analysis and mitigation. London: Geological Society Special Publications, Vol. 279, 101–114.
Šumanovac, F., and Weisser, M. (2001). Evaluation of resistivity and seismic methods for hydrogeological mapping in karst terrains. J. Appl. Geophys. 47, 13–28. doi:10.1016/s0926-9851(01)00044-1
Telford, W. M., Geldart, L. P., and Sheriff, R. E. (1990). Applied geophysics. Cambridge: Cambridge University Press. 2nd ed. p. 305–320.
White, W. B. (1988). Geomorphology and hydrology of karst terrains. New York, NY: Oxford University Press, 22–48.
Xu, L. (2015). Forward simulation for ground penetrating radar and its application for the engineering field. Jinan: Shandong University.
Yang, J. M. (2017). Study and application of geophysical method in karst detection of datengxia water conservancy project. Changchun: Jilin University.
Yin, G. R. (2009). Survey methods and pile construction technology of bridge in karst region. Changsha: Central South University.
Yue, C. W. (2007). Research and application of cross-well electromagnetic tomography. Changchun: Jilin University.
Zajc, M., Pogačnik, Ž., and Gosar, A. (2014). Ground penetrating radar and structural geological mappinginvestigation of karst and tectonic features in flyschoid rocks as geological hazard for exploitation. Int. J. Rock Mech. Min. Sci. 67 (2), 78–87. doi:10.1016/j.ijrmms.2014.01.011
Zhang, J. G., Chen, B. S., Yin, Y. P., Li, H. T., Sun, D. S., and Cao, F. X. (2003). Geophysical detection of concealed karst features in the Three Gorges reservoir area. Geotechnical Investigation Surv.(01), 64–66.
Keywords: geophysical prospecting, karst exploration, engineering geological exploration, cavities with different filling states, multi-electrode resistivity method
Citation: Wang S, Xu L, Li P, Wang S, Lu L and Li Z (2025) Application of geophysical prospecting methods in karst exploration. Front. Earth Sci. 13:1646057. doi: 10.3389/feart.2025.1646057
Received: 12 June 2025; Accepted: 29 July 2025;
Published: 14 August 2025.
Edited by:
Zhang Cong, Central South University Forestry and Technology, ChinaReviewed by:
Ao Zheng, China University of Mining and Technology, ChinaYukai Liu, Eindhoven University of Technology, Netherlands
Hanbo Chen, Guilin University of Electronic Technology, China
Copyright © 2025 Wang, Xu, Li, Wang, Lu and Li. This is an open-access article distributed under the terms of the Creative Commons Attribution License (CC BY). The use, distribution or reproduction in other forums is permitted, provided the original author(s) and the copyright owner(s) are credited and that the original publication in this journal is cited, in accordance with accepted academic practice. No use, distribution or reproduction is permitted which does not comply with these terms.
*Correspondence: Siyuan Wang, MTAyNjMxOTg1MkBxcS5jb20=; Lei Xu, eHVsZWk4OTQ1QDE2My5jb20=