 Dongxu Yang
 Xin Zong
 Bin Wu1
- 1School of Environmental and Civil Engineering, Chengdu University of Technology, Chengdu, China
- 2State Key Laboratory of Geological Hazard Prevention and Geoenvironment Protection, Chengdu, China
- 3School of Emergency Management, Xihua University, Chengdu, China
- 4College of Management Science, Chengdu University of Technology, Chengdu, China
Debris flows pose severe threats to ecologically sensitive mountain areas, especially UNESCO World Heritage sites, where traditional mitigation measures often fail to balance risk reduction with environmental conservation. This study develops an integrated framework that combines high-resolution dynamic simulation with adaptive eco-engineering strategies. Using the Massflow model calibrated with empirical hydrodynamic parameters and 1m-resolution DEM data, we simulated debris flow scenarios under 20- and 50-year rainfall return periods. Under the 50-year event, debris flows reached peak velocities of 6.49 m/s and discharges of 38.33 m³/s. Hazard zoning revealed that high-, medium-, and low-risk zones accounted for 1.16%, 8.07%, and 90.77% of the study area, respectively, threatening 11,745.33 m² of infrastructure in Shuzheng Village. To mitigate these risks while preserving the natural landscape, we designed a novel pine pile–gabion composite dam (PPGD) system integrated with terrain-adaptive ecological restoration. The PPGD raises the erosion base level to dissipate impact energy and features a stepped gabion structure that promotes progressive solid-liquid separation, thereby reducing sediment concentration and enhancing ecological resilience. Simulation results show that three cascaded PPGDs reduced the total inundation extent by 45.78%. At the same time, peak flow velocities downstream of Dams No. 1, No. 2, and No. 3 were decreased by 45.34%, 40.34%, and 37.14%, respectively, compared to upstream values. These findings highlight the effectiveness of coupling dynamic process modeling with eco-engineering interventions for quantitative debris flow risk governance and sustainable landscape protection in ecologically sensitive mountain areas.
1 Introduction
The Jiuzhaigou Scenic Area, a UNESCO World Heritage Site, is celebrated for its distinctive natural beauty and rich biodiversity. Following the “8.8”Jiuzhaigou earthquake, over 170 secondary geological hazards emerged, including numerous avalanches and landslides that supplied abundant loose material for debris flow (Zhan et al., 2024; Yang et al., 2024). Research indicates that earthquake-induced landslides have disrupted watershed stability and altered the conventional spatial and temporal patterns of debris flow, significantly increasing their likelihood (Huang et al., 2020). These events led to a marked rise in debris flow activity across the region (Wang et al., 2022), resulting in direct environmental damage (Wang et al., 2022). Sustained debris flow activity contributes to forest degradation and soil erosion, ultimately causing downstream sediment accumulation that impairs aquatic ecosystems and reduces reservoir capacity (Wei et al., 2001). Post-earthquake assessments identified 33 active debris flow gullies within the Jiuzhaigou World Heritage Site, characterized by high frequency, broad spatial distribution, and substantial hazard potential, with over half posing threats to the core scenic zones (Zhan et al., 2020). Considering the significant changes in debris flow initiation zones, triggers, magnitudes, and evolutionary dynamics before and after the earthquake (Xu, 2010), it is essential to conduct targeted risk assessments. These assessments should incorporate altered geological conditions and sediment availability to optimize mitigation strategies—such as check dams and drainage systems—to protect human life, infrastructure, and key landscape features (Cui et al., 2003).
Debris flows pose widespread threats; thus, accurately delineating hazard zones and forecasting their dynamic evolution is critical. Numerical simulation serves as a robust tool for modeling debris flow behavior, evaluating the effectiveness of mitigation measures, and providing a scientific basis for hazard assessment (Xu et al., 2017). Zhao et al. (2023) employed a hybrid SPH-DEM (Smoothed Particle Hydrodynamics–Discrete Element Method) numerical model to simulate debris flows with embedded boulders, offering detailed insights into their impact forces on reinforced protective structures. Utilizing the advanced RAMMS-DF simulation tool based on the Voellmy–Salm rheological model, Ahmad et al. (2025) conducted an in-depth hazard and risk analysis of the Hassa debris flow event. Gan and Luo (2020) calibrated the friction parameters of the RAMMS3D model using flume experiments, successfully replicating debris flow deposition behavior in lower mountainous terrains and demonstrating the model’s applicability in complex topographies. Tian et al. (2024) developed a “unit height disaster mitigation efficiency” index using Massflow to quantify the effectiveness of check dams based on spatial risk distribution and overall hazard intensity, offering a quantitative framework for post-earthquake debris flow management.
Massflow is a specialized software developed domestically to simulate the initiation and evolution of geological disasters based on principles of continuum mechanics and depth-averaged formulations. Leveraging advanced physical models and high computational efficiency, it rapidly performs thousands of scenario simulations to evaluate the likelihood of hazardous events and has been widely applied in debris flow material transport and quantitative risk assessments (Ouyang et al., 2019a). Ouyang et al. (2019b) utilized the Voellmy model to identify high-risk zones of debris flows occurring at various recurrence intervals, thereby informing future disaster prevention planning in the Bailong River Basin. Zhou et al. (2023) conducted a comprehensive dynamic simulation using the Coulomb model to elucidate the sequential processes of debris flow evolution—instability, impact, channel diversion and acceleration, lateral expansion and deceleration, and eventual deposition—along with the spatial characteristics of thin-channel deposits, thick valley-floor deposits, and dispersed debris along the flow path.
Strategies for debris flow prevention and control in natural scenic areas have traditionally focused on engineering interventions within the flow and deposition zones of debris flow gullies (Gong et al., 2021). Recently, ecological approaches to debris flow mitigation have garnered increasing attention, with research emphasizing the integration of structural and ecological measures. Lin et al. (2017) conducted flume experiments to investigate the interaction mechanisms and effectiveness of slit dams in controlling post-earthquake debris flows, finding that they serve as a practical and efficient countermeasure. Sun et al. (2021) classified various permeable dam designs and revealed that 58.25% of the projects in southwestern China featured openings that were too small, hindering sediment transport. Their study also identified key risks such as dam surface abrasion and foundation erosion. Another study highlighted the role of open-type dams in balancing sediment interception and flow regulation, proposing them as a novel and adaptable mitigation strategy (Sun et al., 2023). Xie et al. (2004) implemented an integrated “engineering–ecological” method in Longdonggou near the Minjiang River, demonstrating that ecological zoning measures are effective in arid valley regions. Li (2024) enhanced the ecological resilience of debris flow–affected areas through strategic vegetation restoration, ecological barrier construction, and hydrological regulation, thereby improving the long-term stability of post-disaster recovery. Zhang et al. (2023) developed a comprehensive evaluation framework for ecological governance performance, validating that measures such as vegetation planting, soil stabilization, and water flow regulation can significantly reduce debris flow hazards while preserving ecological integrity and landscape aesthetics. Collectively, these studies suggest that appropriately tailored mitigation strategies not only effectively control debris flow disasters but also optimize the restoration and protection of ecological functions and scenic values in natural heritage areas.
Despite significant advances in debris-flow mitigation techniques—such as lateral diversion of debris-flow discharges (Zhao et al., 2020), Monte Carlo–based risk assessment models (Li et al., 2023), and projection pursuit classification for hazard zoning (Gu et al., 2022)—existing methods still lack an integrated, quantitative framework that systematically combines dynamic hazard modeling with ecological conservation and adaptive engineering interventions. This need is particularly pressing in ecologically sensitive and heritage-rich mountainous regions, where rigid infrastructure may adversely affect environmental and cultural values. To address this gap, this study aims to (1) simulate debris flow dynamics using empirically derived flow behavior models, and (2) propose a flexible framework that integrates ecological and engineering solutions tailored to sensitive environments.
This study contributes to both the conceptual and applied aspects of managing debris flow risk. Conceptually, it integrates nature-based solutions into a dynamic hazard assessment framework. Practically, it proposes a field-tested mitigation strategy that balances risk reduction with ecological and aesthetic conservation. Together, these contributions offer a replicable model for promoting disaster resilience in ecologically and culturally sensitive landscapes.
2 Study area
2.1 Geographic location and regional overview
The Shuzheng Gully, located behind Shuzheng Zhai in the Jiuzhaigou Scenic Area, is a major left-bank tributary of Jiuzhaigou, flowing from northwest to southeast. The mouth of the gully is located at latitude 33°12′00″N and longitude 103°53′38″E. The debris flow watershed mainly consists of medium-thick stratified sandy and muddy limestone, dolomite, massive limestone, and friable limestone (Figure 1).
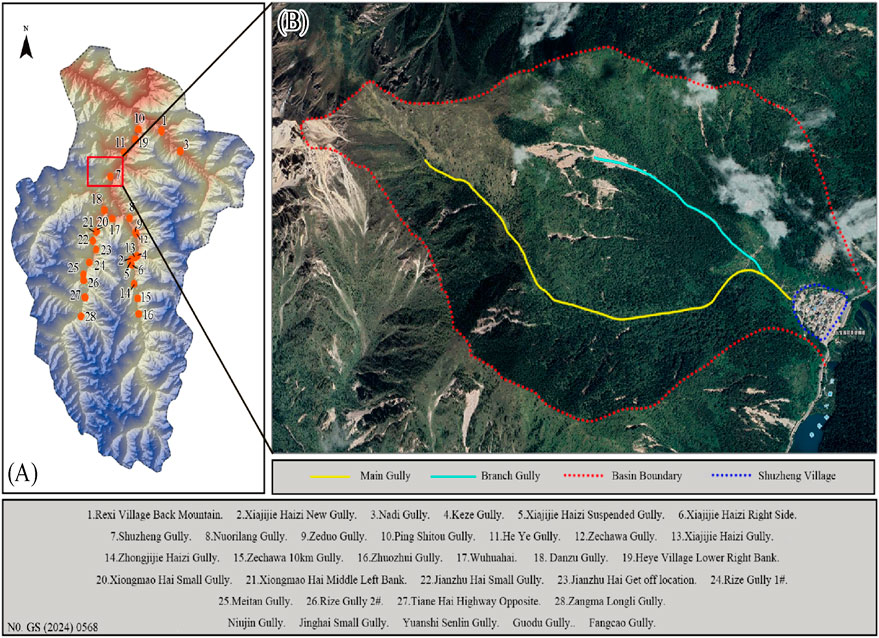
Figure 1. (A) Spatial distribution of debris flow gullies in Jiuzhaigou Scenic Area; (B) Topographic details of Shuzheng Gully (MNR, 2024).
2.2 Topography conditions
The Shuzheng Gully has a willow leaf-like shape and represents an actively developing debris-flow system. Its longitudinal length is 2.28 km, average width is 0.3 km, basin integrity coefficient is 0.13, and total area is 0.7 km2. Steep slopes ranging from 25° to ≥35° cover 0.4 km2, accounting for 57.14% of the total basin area. The main gully originates at 3,300 m—the highest point in the area—and descends to 2050 m at the mouth near the Jiuzhaigou junction, with a relative elevation difference of 1,250 m. No tributary gullies have developed within the basin. The steep terrain contributes to conditions favorable for debris-flow initiation. The longitudinal slope gradient strongly influences the estimation of sediment source volumes in the basin. Elevation data for the gully head and mouth can be automatically extracted from a digital elevation model (DEM) using the main gully’s flowline and hydrological analysis algorithms. The longitudinal gradient is then calculated by dividing the elevation difference by the flowline length, providing a scientific basis for estimating sediment volumes and potential hazard levels. The basin features steep terrain with notable longitudinal gradients, and calculations indicate an average slope of 402.5‰. In particular, longitudinal slopes in the upper and middle reaches of the main gully exceed 500‰ (Zhang, 2018).
The morphology of the Shuzheng Gully indicates that its drainage area and slope are well-suited for the formation of narrow and steep debris flows, primarily due to the steep longitudinal profile of the main channel and the abundance of loose sediment. “Narrow and steep debris flows”—also referred to as “narrow-steep” or “steep and rapid” debris flows—are characterized by small catchment areas, steep gradients, confined channels, high velocities, and a propensity for sudden initiation (Zhao et al., 2021). A notable category of post-earthquake debris flow typically transpires in watersheds with an area F ≤ 5 km2, an average gully longitudinal slope I > 300‰, and a watershed completeness coefficient δ ≤ 0.4. Characteristic attributes of this debris flow type encompass a mostly “V”-shaped gully cross-section, a substantial density of material sources per unit area, and an elevated frequency of occurrences and intense activity resulting from concentrated regional heavy precipitation (Yang et al., 2015).
2.3 Material source conditions
Su et al. (2023) discovered during the on-site assessment that substantial sediment sources in the gullies significantly increase the risk of debris flows. In the Shuzheng gully, the types of loose solid materials are relatively limited and are primarily concentrated along both sides of the upper main gully, within the elevation range of 3,300 m–2,200 m. Field investigations identified seven distinct source areas, comprising three landslide deposit sources and four gully deposit sources. The total volume of landslide-derived materials was estimated at 12.8 × 10⁴ m3, while the gully-derived materials were estimated at 23.47 × 10⁴ m3. The corresponding mobilizable volumes were calculated to be 6.4 × 10⁴ m3 and 4.2 × 10⁴ m3, respectively.
According to the watershed characteristics and the debris flow formation environment, the solid-phase materials in the Shuzheng gully are primarily sourced from the transformation of landslide and collapse deposits, as well as gully sediment. These materials are mainly mobilized by undercutting erosion and sidewall collapses within the gully system (Qiao et al., 2012). During rainfall events, the potential energy stored in these loose materials is rapidly converted into kinetic energy, which accelerates channel erosion and significantly increases the risk of debris flow (An and Zhang, 2024).
2.4 Hydrodynamic conditions
Based on the Manual for Calculating Heavy Rainfall and Flooding in Small and Medium-Sized Watersheds in Sichuan Province and meteorological data from Jiuzhaigou, historical records over recent decades were reviewed to extract the 24-h maximum rainfall, maximum hourly rainfall, maximum 10-min rainfall, and the coefficient of variation. These parameters were used to characterize the rainfall regime of the watershed and to calculate the design rainfall intensity required for debris flow initiation. The resulting rainfall intensity data are presented in Figure 2. The mean annual precipitation in the study area is 704.4 mm, with the majority occurring during the rainy season from May to September. This precipitation pattern reinforces the temporal concentration of hydrological hazards, particularly debris flows, during the rainy season.
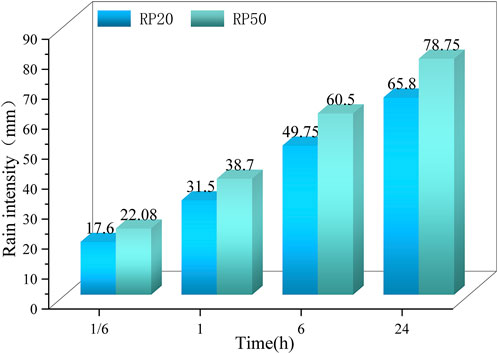
Figure 2. Rainfall intensity under different return period rainfall events.
3 Data and methodologies
3.1 Data
This study integrated multiple data sources to ensure scientific rigor and accuracy in assessing debris flow risk and researching ecological mitigation. High-resolution satellite images from 2013 to 2022 were analyzed to monitor land cover changes and the development of geological hazards within the study area. Additionally, a high-precision digital elevation model (DEM) was generated using unmanned aerial vehicle (UAV) photogrammetry, providing essential terrain data for hydrological and geomorphological analyses.
Comprehensive field investigations were carried out to determine the spatial distribution, depositional characteristics, and physical-mechanical properties of materials that source debris flows. These surveys focused on identifying the locations of loose solid deposits and characterizing their engineering geological properties through a series of laboratory and in situ tests. The collected data enabled a quantitative understanding of the mechanisms driving debris flow initiation and movement.
Using this information, we tested how much the sediment was compacted in the ground, finding that the debris flow density in Shuzheng gully was 2,150 kg/m3, which is important for understanding how the flow moves. Rainfall and flood analyses were performed to estimate peak flow rates corresponding to simulated return periods of 20 and 50 years (RP = 20 and RP = 50). Subsequently, numerical simulations of debris flow accumulation were conducted using Massflow software. To calibrate the Voellmy model parameters for MassFlow simulations, field investigations in Shuzheng Gully—including measurements of debris flow deposit thickness, runout distance, flow path, and slope conditions—were conducted based on detailed historical disaster records. Using this disaster history data, multiple simulation iterations and parameter inversion were performed. Through iterative adjustment, the turbulence coefficient (ξ) was set to 300 and the friction coefficient (μ) to 0.2. This parameter set closely reproduced observed debris flow characteristics, including deposition extent, flow direction, and travel distance, and was thus adopted for the final simulations. These calibrated models form a robust basis for developing effective prevention and control strategies. Furthermore, long-term precipitation records from the Jiuzhaigou Shuzhengzhai rainfall station (2000–2014) indicate an average annual rainfall of 704.3 mm, sufficient to trigger debris flow events in the region.
3.2 Methodologies
This study employed Massflow dynamic simulations, GIS spatial analysis, and experimental methods to comprehensively investigate debris flow behavior, associated risks, and mitigation measures in the Shuzheng gully of Jiuzhaigou (Figure 3).
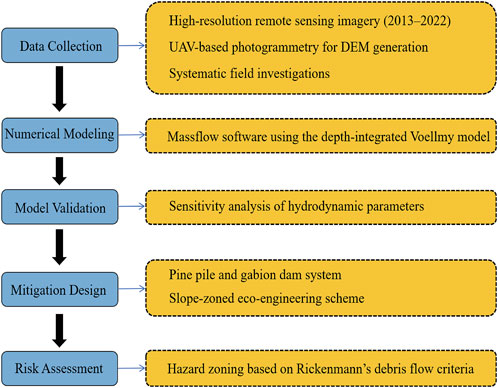
Figure 3. Research framework for debris flow simulation and risk assessment.
The Voellmy model is a widely used rheological model for simulating natural gravity-driven flows such as avalanches and debris flows. It is particularly suitable for modeling rapid mass movements in channelized terrain and scouring zones, where basal resistance is assumed to be proportional to flow velocity. The model breaks down the frictional resistance into two parts: one part is dry friction, controlled by the friction coefficient μ (which is linked to the normal stress), and the other part is turbulent friction, controlled by the coefficient ξ (which depends on the square of the flow velocity). This two-part method makes it easier to adjust the model using visible flow speeds and how far materials are deposited, allowing for a realistic simulation of debris flow behavior. The dominance of either friction term depends on the flow regime: the turbulent term becomes dominant in fast-moving flows, whereas the dry friction term prevails during slow movements. These characteristics make the Voellmy model particularly effective for capturing the complexity and variability of debris flow behavior in natural terrains.
In this study, Massflow was utilized to simulate the dynamic behavior of debris flows in the Shuzheng Gully. Massflow solves the depth-integrated form of the Navier–Stokes equations, under the assumption that debris flows are shallow flows in which vertical scales are negligible compared to horizontal dimensions. This depth-integrated approach simplifies computation by transforming the original three-dimensional equations into two-dimensional forms, improving computational efficiency without compromising accuracy. To ensure the accurate representation of debris flow processes, Massflow solves the governing equations based on the principles of mass and momentum conservation. The equation for conservation of mass is given in Equation 1:
The momentum conservation equations are presented in Equations 2–4:
In the formula: ρ represents the density of the fluid (kg/m3); t represents time; τij represents the stress components in different directions (for example, τxx represents the shear stress in the x-direction, τxy represents the shear stress in the xy-direction); gx, gy, gz are the gravitational components on each coordinate axis.
Debris flows are generally assumed to be incompressible fluids with constant density, and their motion adheres to the laws of fluid dynamics. In the model, the computational domain is rotated by angles θx and θᵧ around the x- and y-axes, respectively, to align the coordinate system with the average slope direction. The upper and lower boundaries of the flowing layer are denoted as Zs and Zβ, respectively, with flow thickness h = Zs - Zβ. The velocity components in the x, y, and z directions are represented by u, v, and w, respectively. The model ensures that both the continuity (mass conservation) and momentum conservation equations in all directions are satisfied.
The Voellmy friction model is included in Massflow’s solver to show how the ground slows down debris flows, which helps create realistic simulations of how debris flows move and settle. The Voellmy model was chosen because it is simple, strong, and has been shown to effectively mimic how debris flows move and settle in similar mountain areas, based on past debris flow events and the materials currently available in the Shuzheng catchment.
The Voellmy model’s expression in Massflow software is shown in Equation 5:
In the formula, τ represents the shear stress at the base, measured in Pascals (Pa); σ denotes the positive stress, also in Pascals (Pa); μ signifies the coefficient of friction; ρ indicates the density of the debris flow, expressed in kilograms per cubic meter (kg/m3).
Based on the rainfall-runoff method, debris flow peak discharges under different rainfall return periods were estimated, as presented in Equation 6:
In the formula, Qb represents the maximum flow rate of pure water; φ denotes the sediment correction factor; and Dc signifies the clogging coefficient. The clearwater peak discharge of debris flow is calculated using the following equation:
In the formula, 0.278 is the unit conversion factor; F represents the watershed area; hτP denotes the net rainfall; and τ signifies the watershed confluence time.
The dangers of debris flow mostly manifest through siltation and damage to objects in their trajectory. The risk posed by siltation correlates with the thickness of debris flow, but the damage resulting from impact is directly associated with its flow rate. Concurrently, the object affected by the debris flow during the siltation process often incurs some degree of impact damage. Wang (2020) summarized various hazard assessment criteria based on the relationship between debris flow depth and velocity. This study adopts one of these criteria, which divides hazard zones into three levels, as shown in Table 1.
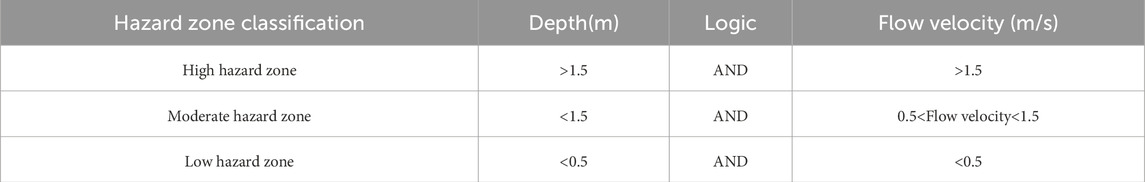
Table 1. Risk assessment indicators for debris flow.
4 Results
4.1 Model initialization, boundary conditions, and parameterization
Table 2 presents the model initialization and parameterization for debris flow simulations under varying rainfall conditions. Debris flow was initiated in the upper to middle reaches of the gully and then allowed to flow freely downstream during the simulations. The flow behavior was governed by frictional resistance and turbulence coefficients, which were incorporated as critical parameters in the model.

Table 2. Dynamic characteristic parameters and scale calculation results of debris flows under different rainfall conditions.
4.2 Debris flow dynamics and associated risks before the mitigation measures
The simulation duration of once in 20 years is 1,200 s, during which the debris flow depth distributions at 200 s, 600 s, 1,000 s, and 1,200 s were computed and analyzed accordingly (Figure 4). The simulation duration of once in 50 years is 1,500 s, during which the debris flow depth distributions at 200 s, 600 s, 1,200 s, and 1,500 s were calculated and analyzed accordingly (Figure 5).
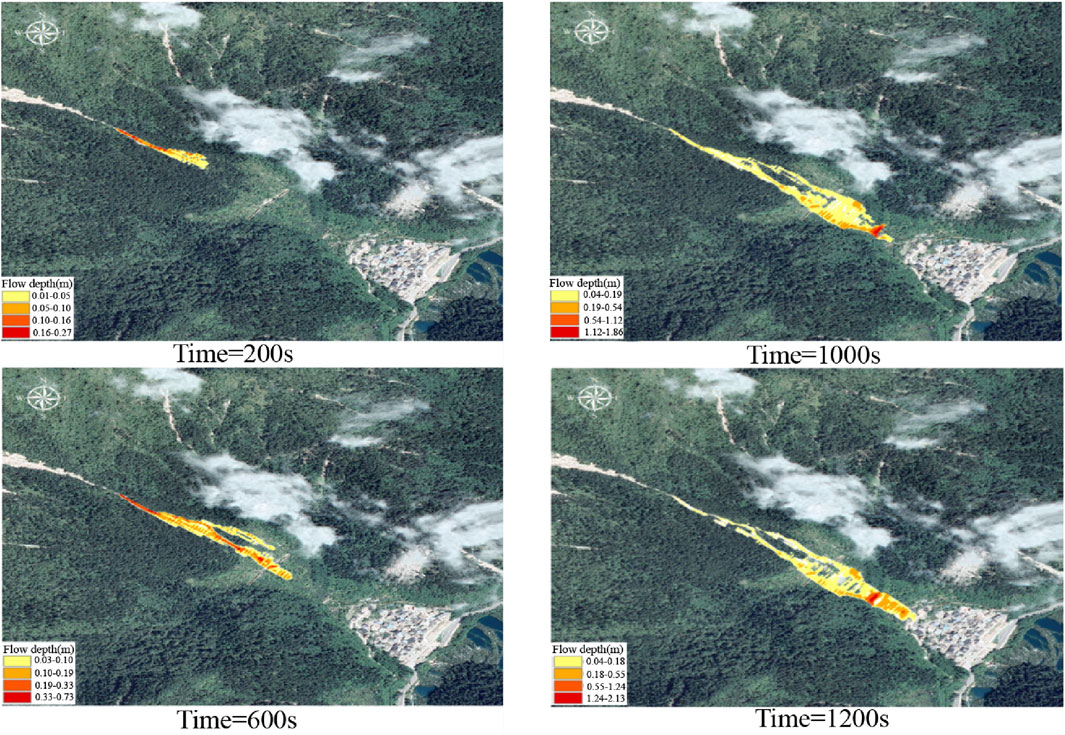
Figure 4. The distribution of flow depth under a 20-year return period rainfall frequency. (Before the implementation of mitigation measures.)
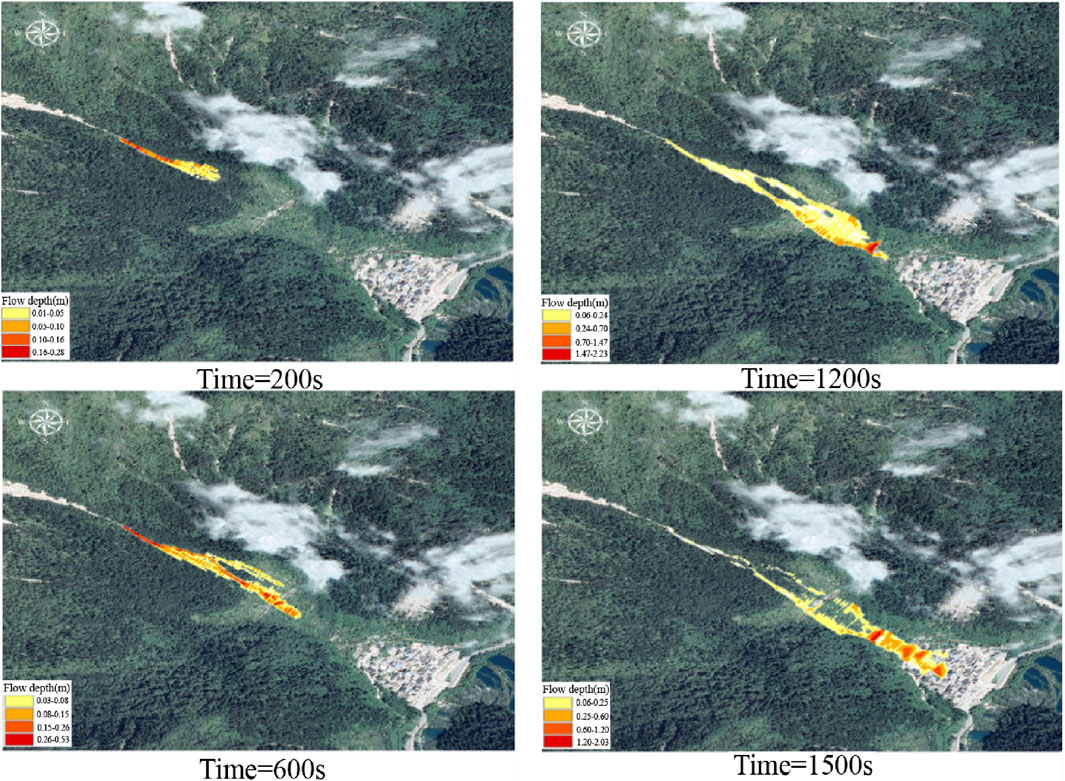
Figure 5. The distribution of flow depth under a 50-year return period rainfall frequency. (Before the implementation of mitigation measures.)
Figure 5 showing the distribution of debris flow depth under the rainfall condition of one in 20 years shows that the debris flow only began to form at a time of 200 s, the debris flow depth is relatively small, primarily distributed in the upstream gully, and the maximum debris flow depth is 0.27 m. The debris flow is concentrated mainly in the gully. According to the image, the area with debris flow depth greater than 0.16 m is relatively small, encompassing only the local area of the gully. As time passes, debris flow discharge and debris flow depth increase dramatically. The debris flow depth reaches 0.73 m at a time of 600 s, particularly in the middle of the gully, where the debris flow depth increases significantly. The orange and red areas (debris flow depth >0.33 m) have spread to the middle and lower reaches of the gully, and the impact force of debris flows has significantly increased. At a time of 1,000 s, the debris flow depth increased dramatically, reaching a maximum of 1.86 m and overflowing up at the slit dam (with vertical slits and fine horizontal beams). At a time of 1,200 s, the debris flow reached its peak discharge, and its inundation extent expanded to include the village area, with the orange and red areas occupying a small portion of the village, indicating an increased threat to the village from the debris flow as well as a threat to the village infrastructure.
Figure 6 showing the distribution of debris flow depth under the rainfall condition of one in 50 years shows that when time is 200 s, the debris flow forms initially, the debris flow depth is relatively shallow, and the maximum debris flow depth is 0.28m, which is primarily concentrated upstream of the gully. At this time, the debris flow rate is slow and the flow range is limited. It has started to extend downstream. At a time of 600 s, the debris flow’s depth increased, reaching a maximum of 0.53 m. The debris flow spread downstream of the gully and eventually approached the village area. The area with debris flow depths greater than 0.26 m has increased significantly. As the flow velocity increased at a time of 1,200 s, the debris flow depth deepened further and reached a maximum of 2.34 m. The silt was deposited at the slit dam, primarily in its upper part. The orange and red areas extended to the middle and lower reaches of the branch gully, increasing the threat of a debris flow to downstream villages. The orange area, with debris flow depths ranging from 0.24 m to 0.7m, has covered a larger area, indicating that the debris flow had a greater impact downstream. At a time of 1,500 s, the debris flow attains its peak discharge, and overflow at the slit dam inundates approximately 11,745.33 m2 of the village, with flow depths exceeding 0.6 m.
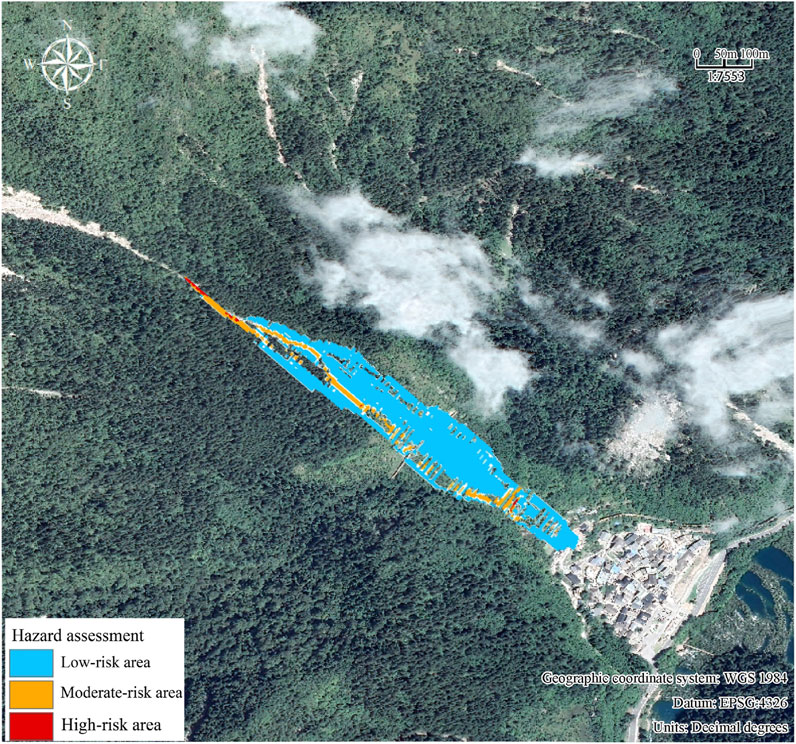
Figure 6. Hazard zoning of debris flows under a 50-year return period rainfall frequency (p = 2%) before the implementation of mitigation measures. High hazard (>1.5 m depth and >1.5 m/s velocity), moderate hazard (<1.5 m depth and 0.5–1.5 m/s velocity), and low hazard (<0.5 m depth and <0.5 m/s velocity).
This study evaluates debris flow hazard levels based on the simulation results, using the intensity impact and hazard zoning criteria proposed by Rickenmann. We finalized the debris flow hazard zoning map using the criteria from Table 1 and the ArcGIS software raster processing tool. The zoning results indicate that a minimal fraction constitutes a high-risk zone, comprising 1.16% of the total area. The medium-risk zone is predominantly located in the debris flow circulation area above the slit dam, comprising 8.07% of the total area. The low-risk zone predominantly resides within the debris flow circulation area, comprising 90.77% of the total area (Figure 6).
4.3 Ecological restoration strategy of Shuzheng gully in Jiuzhaigou
4.3.1 Ecologized gabion dam with pine pile retention system
The source of loose material in the Shuzheng gully mainly comes from avalanches and slides in the middle and upper reaches of the gully, as well as from the erosion of deep piles in the gully. Although the gabion dams above the village help mitigate sediment and reduce the risk to Shuzheng Zhai, they may introduce new safety concerns due to silt buildup in the reservoirs and increased pressure in specific areas. To lower this risk, three small dams made of pine piles and gabions were built in the eroded area of the middle part of the gully to reduce erosion and sediment flow by spreading out the force of the water and stabilizing the gully’s bottom.
This study proposes a scheme for controlling ecological debris flow utilizing “pine piles + gabions,” which ensures protective efficacy while substantially minimizing environmental damage, thereby achieving a harmonious balance between landscape preservation and disaster management (Figure 7). The pine pile–gabion composite dam design effectively intercepts and filters sediment in debris flow while harmoniously coexisting with the natural environment, thereby minimizing ecosystem disruption. The gabion mesh serves as a protective measure, enhancing its capability to intercept and filter debris flow. Constructed from high-strength galvanized steel wire with an adjustable mesh size, it effectively captures finer sediment particles. Positioning pine piles behind or beside the gabion serves as a natural vertical reinforcement, significantly enhancing the impact resistance of the entire protection system. Despite the occurrence of significant debris flow, the gabion can preserve structural stability, averting the buildup of captured material that could result in secondary effects.
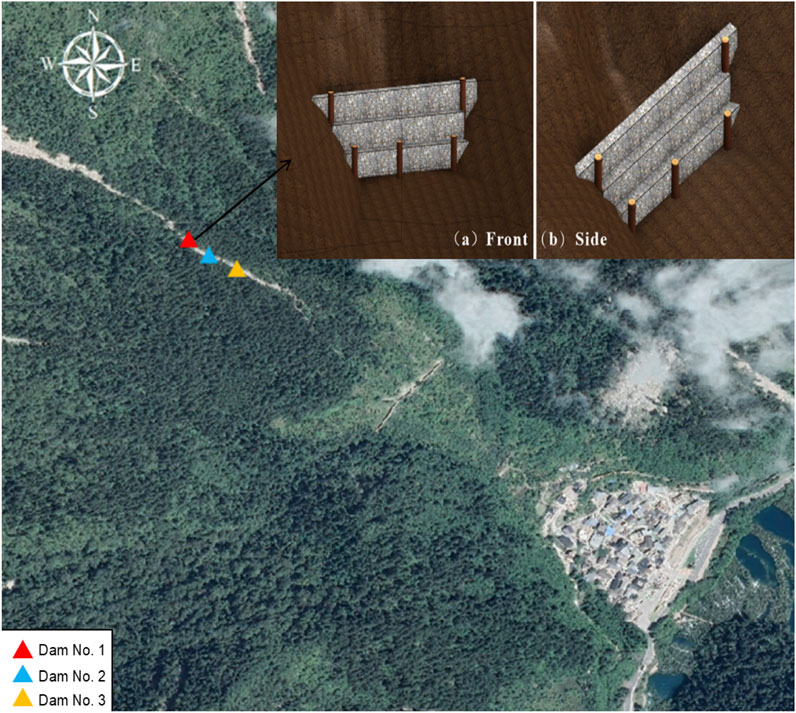
Figure 7. Schematic structural model of the PPGD.
To ensure long-term performance in this sensitive mountainous environment, the PPGDs were designed with an expected service life of approximately 20 years. Routine maintenance includes structural stability assessments and drainage hole cleaning. In addition, a long-term joint monitoring program is being established in collaboration with the Jiuzhaigou Administrative Bureau. This program integrates total station surveys to monitor dam settlement, horizontal displacement, and deformation; UAV-based observations to track upstream and downstream sediment changes and evaluate retention performance; vegetation surveys to assess coverage dynamics and species diversity; and periodic volumetric measurements of sediment deposits to quantify sediment interception and transport. Collectively, these measures support the sustained functionality and ecological compatibility of the mitigation system.
4.3.2 Ecological restoration strategies based on slope zoning
The solid material sources of debris flow in Shuzheng gully mainly originate from the transformation of landslide and gully deposit sources. Figure 8 (a1, a2) clearly illustrate the evolution patterns and spatial distribution of landslide deposit sources, while the remaining Figure 8 (b1, b2, b3) detail the evolution and spatial characteristics of gully deposit sources. To enhance source stability and promote ecosystem restoration, a zoned ecological recovery strategy based on slope gradients is proposed, considering the topography and environmental degradation status of the Shuzheng gully in Jiuzhaigou. This strategy aims to achieve effective vegetation restoration and comprehensive recovery of ecological functions.
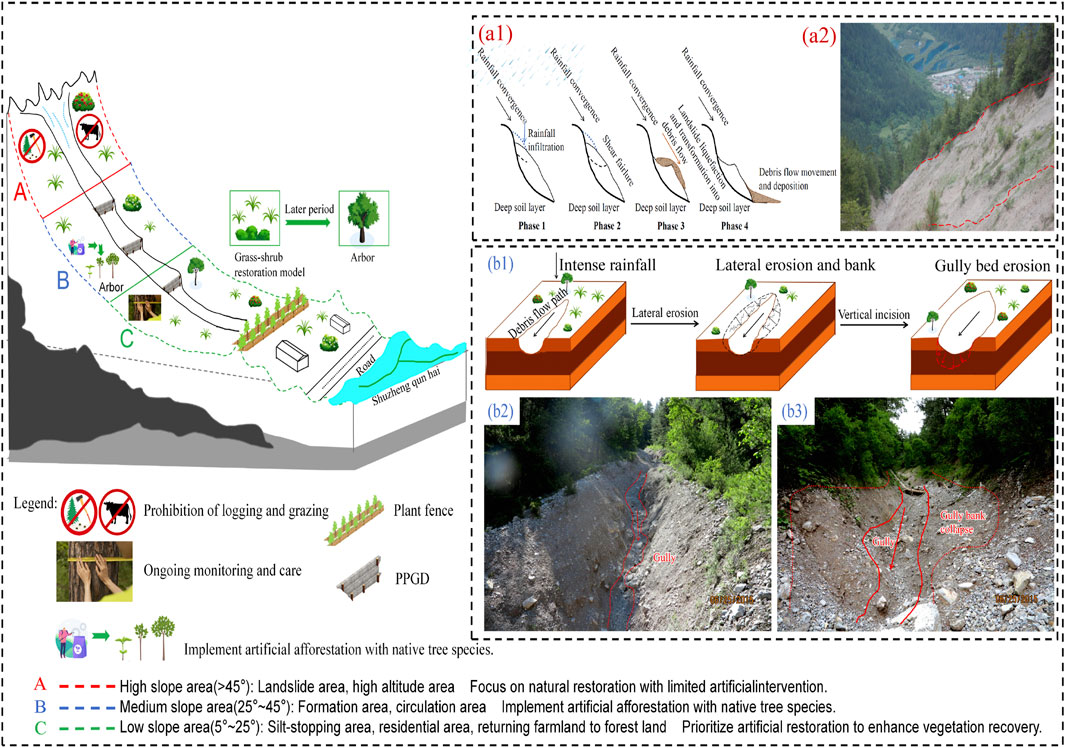
Figure 8. Ecological restoration strategy of Shuzheng gully.
Mountain ecosystem restoration is characterized by significant complexity and diversity, generally requiring a combination of natural regeneration and artificial intervention, guided by overarching ecological restoration objectives. In steep slope areas, natural recovery potential is typically high; however, inappropriate human disturbances can pose substantial risks. Therefore, natural regeneration should be prioritized, with artificial measures applied only when necessary (Hayashi and Wu, 2019). In gentle slope areas, initial vegetation restoration can be achieved by planting locally adapted herbaceous plants and shrubs, followed by introducing tree species such as pines (Gao et al., 2024). Adhering to ecological succession principles and implementing scientifically sound restoration measures can effectively accelerate post-disaster ecosystem recovery (Wang, 2021).
4.3.3 Debris flow dynamics and associated risks after the implementation of mitigation measures
To evaluate the effectiveness of mitigation measures, three additional PPGDs (12 m long and 5 m high) were designed and added upstream of the existing slit dam. Using CAD, the terrain contours in the affected area were elevated to reflect the structural dimensions, and all protective structures were subsequently parameterized in raster format via ArcGIS. These parameterized mitigation measures were then embedded into the Massflow simulation model to assess their impact on debris flow dynamics and deposition extent. The simulated debris flow depth distributions are shown in Figures 9, 10.
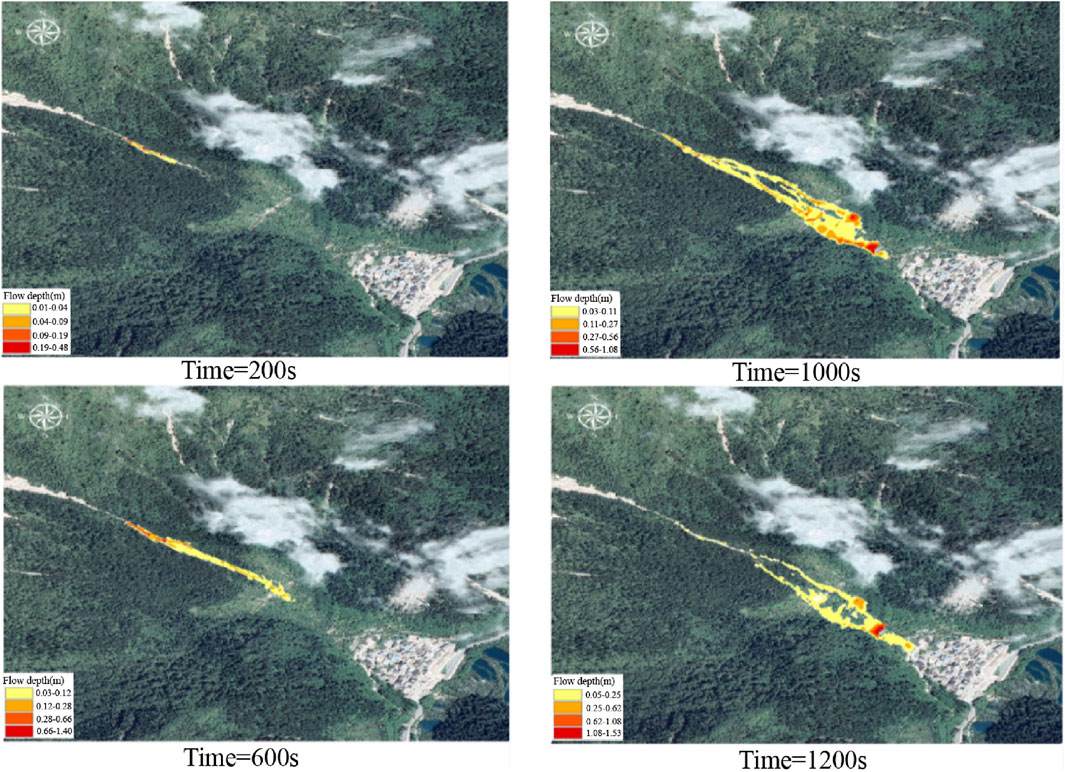
Figure 9. The distribution of flow depth under mitigation measures at a 20-year return period rainfall frequency (after the implementation of mitigation measures).
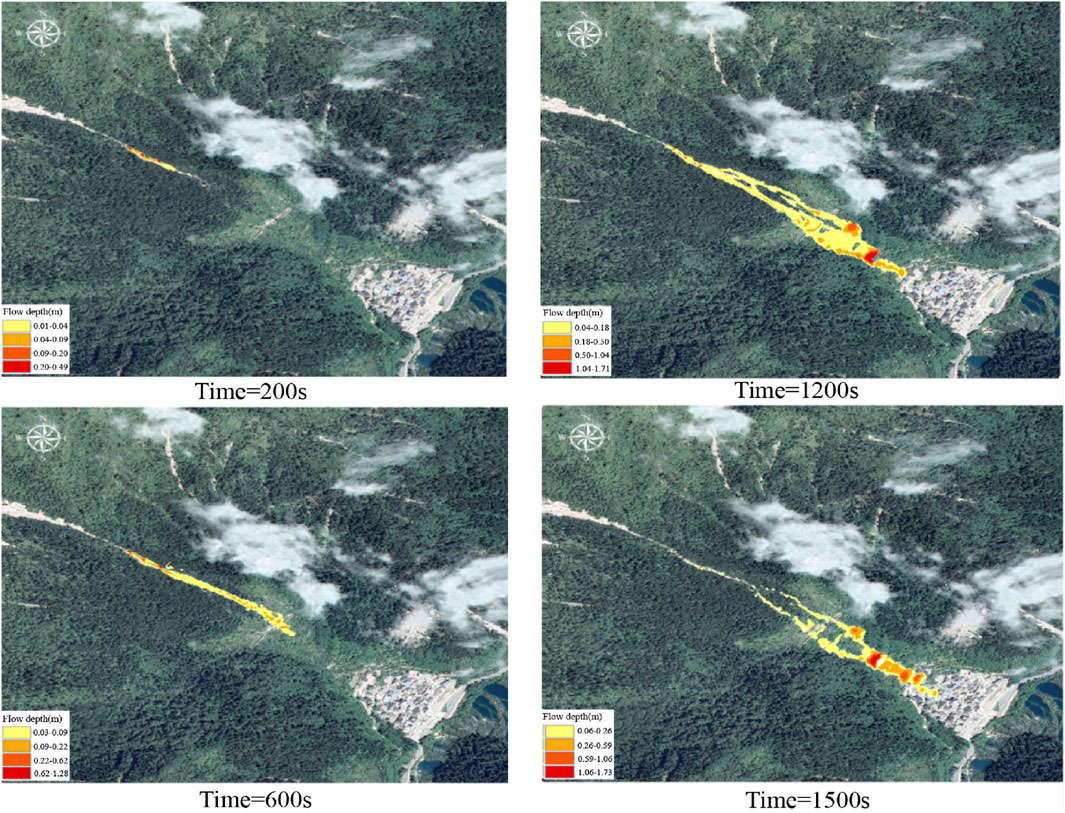
Figure 10. The distribution of flow depth under mitigation measures at a 50-year return period rainfall frequency (after the implementation of mitigation measures).
In Figure 9, the simulation results indicate that the maximum flow depth is 0.48 m at a time of 200 s with a rainfall frequency of once every 20 years, and the debris flow accumulates at the first gabion barrier dam, which has a control effect. The area with the greatest flow depth is primarily concentrated upstream of the gully, while the orange and red areas are narrowed, and the initial flow area of the debris flow is restricted. At a time of 600 s, the mitigation measures significantly reduced the growth rate of the debris flow. The mitigation measures effectively controlled the debris flow, reducing the orange area (flow depth of 0.12 m–0.28 m) and crimson area (flow depth of 0.28 m–0.66 m). The mitigation measures confined the debris flow to a smaller area of the gully. At a time of 1,000 s, the protection measures remained effective; the extent of the debris flow and the depth of siltation were significantly lower than in the unprotected case, and the debris flow threat was further mitigated. At a time of 1,200 s, the debris flow began to enter the village area, with a shallow depth and relatively small extent, while the extent of the deep red area near the village (flow depth >0.59 m) was significantly reduced, indicating that the mitigation measures were still effective in cutting the flow depth during the strongest stage of the debris flow and effectively curtailing the de-bris flow’s intrusion into the village.
In Figure 10, the debris flow had just begun to form at a time of 200 s, with a rainfall frequency of one in 50 years, and its deepest point was 0.49 m at the first gabion dam. At a time of 600 s, the protection measures were further activated, and the debris flow piled up to 1.28 m at the second gabion dam, with a portion of the debris flow blocked, reducing the impact force and flow velocity. At a time of 1,200 s, the mitigation measures substantially mitigate the risk of the debris flow, lowering the deepest flow depth to 0.63 m. At a time of 1,500 s, the debris flow was close to the village, but the inundation extent was reduced by 45.78% compared to the unprotected time, which was approximately 6,368.79 m2. The deep orange-colored area with a flow depth of more than 0.59 m only covered the village locally, and the destructive nature of the debris flow was significantly reduced, thanks to effective protection measures.
According to the hazard zoning in Figure 11, the grill dam effectively intercepts most of the silt while also intercepting sediment through layers of pine pile gabion composite dams, reducing the area of the medium-risk zone by 2.33% and successfully mitigating the hazards of Shuzheng Zhai and Shuzheng Qunhai.
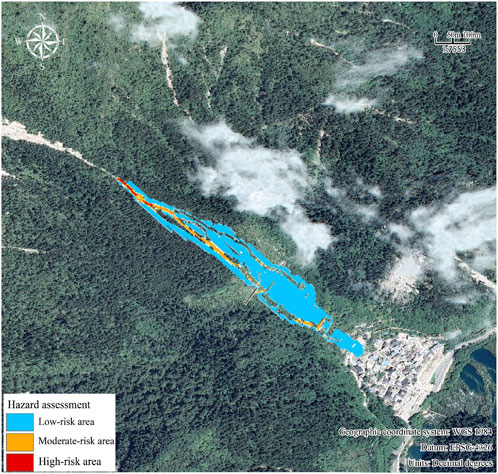
Figure 11. Hazard zoning of debris flows under a 50-year return period rainfall frequency (p = 2%) after the implementation of mitigation measures.
5 Discussion
5.1 Nature-based debris flow mitigation in scenic and historic interest areas
This study adopts the framework of Nature-based Solutions (NBS) to address debris flow hazards in ecologically sensitive and World Heritage sites. NBS are defined as actions that protect, sustainably manage, and restore natural or modified ecosystems, delivering both societal resilience and environmental benefits (Seddon et al., 2020). These approaches encompass a continuum from the preservation and rehabilitation of natural systems to the implementation of hybrid grey–green infrastructure designed to enhance ecological function while reducing risk.
The proposed PPGD system represents a practical and landscape-compatible example of NBS. Designed with sensitivity to the local environment, it utilizes readily available materials and can be flexibly deployed within the complex gully terrain. Its modular, permeable design reduces visual and ecological disturbance—an essential consideration for protected heritage sites such as the Jiuzhaigou Scenic Area, where disaster mitigation must align with stringent ecological conservation and aesthetic preservation standards.
However, the performance of this ecological approach under high-magnitude debris flow events may be constrained. Its long-term structural durability and functional reliability under extreme weather or climate-induced events require further empirical validation. Despite these limitations, this nature-based engineering strategy offers a replicable model for integrating disaster risk reduction with landscape and heritage conservation. It contributes to the broader discourse on sustainable development, nature-integrated engineering, and adaptive risk governance in fragile and high-value environments.
5.2 Uncertainty and model limitations
In this study, debris flow numerical simulations were based on hydrodynamic parameters, primarily employing the Voellmy rheological model and empirical transport equations. While these models effectively capture flow behavior under certain conditions, they inherently simplify complex natural processes by assuming uniform sediment properties and idealized initial and boundary conditions. As a result, the simulations do not fully account for the diverse characteristics of sediment, which are critical in controlling erosion and flow dynamics.
In reality, sediment characteristics such as grain size distribution, cohesion, and heterogeneity play a crucial role in influencing erosion rates and debris flow behavior. Previous studies have demonstrated the importance of sediment characteristics on erosion rates (Binghan et al., 2024), while others have highlighted that debris flows with nonuniform sediment compositions exhibit dynamics characteristics distinctly different from those with uniform sediments (Adebiyi and Hu, 2022). These sediment-related factors were not fully incorporated into our hydrodynamics-based modeling framework, which limits the model’s ability to fully represent the complexity of debris flow evolution.
Moreover, the hazard assessment method applied here, based on Rickenmann’s criteria, provides a static classification framework that does not sufficiently capture the dynamic and evolving nature of debris flow hazards. This limitation can lead to incomplete or inaccurate hazard representations for specific sites.
Although parameter values were carefully selected using field investigation data and relevant literature, simulation results should be interpreted as scenario-based approximations rather than precise predictions. A sensitivity analysis (Section 5.3) was conducted to evaluate model robustness and parameter influence, thereby increasing confidence in the qualitative insights gained.
It is important to emphasize that the simulation outcomes presented in Figures 13–15 represent typical responses under the chosen parameter settings and should not be regarded as exact reproductions of real debris flow events. To enhance the accuracy and applicability of hazard assessments, these results must be integrated with geological context and field observations.
Overall, these limitations suggest that current models relying on hydrodynamic parameters without fully incorporating sediment complexity may underestimate or misrepresent the spatiotemporal evolution of debris flow hazards. This underscores the necessity for ongoing model refinement and comprehensive data integration to improve hazard prediction and risk management.
5.3 Validation of simulation accuracy
To validate the accuracy of the simulation results, a field survey was conducted to measure mud depths within the Shuzheng gully. The measured depths were then compared to simulated values at corresponding locations (Figure 12). Specifically, a 10-m segment within the ditch accumulation area was selected as the sampling site. From the simulation data, 10 measurements of flow depth were extracted across this segment, yielding an average depth of 0.834 m. This value closely corresponds to the field-measured average mud depth of 0.80 m, resulting in a simulation accuracy of approximately 95.75%. These results demonstrate that the numerical model reliably reproduces the spatial pattern of sediment accumulation and effectively captures variations in debris flow thickness, confirming the model’s validity and practical applicability.
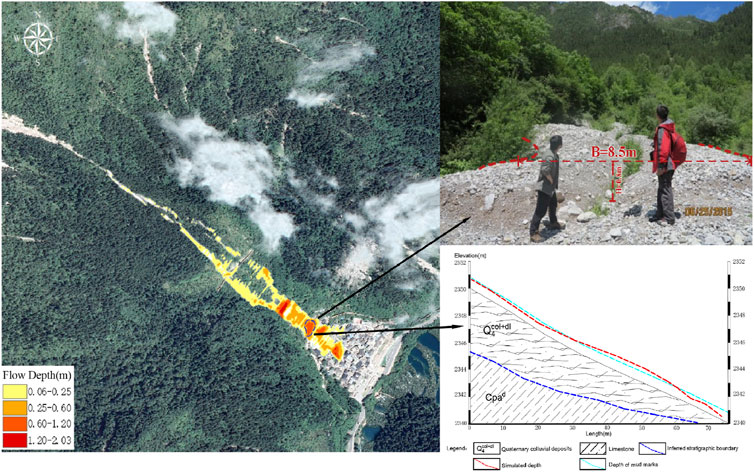
Figure 12. Comparison between measured mud mark depth and simulated debris flow depth.
5.4 Variations in maximum velocity and inundation extent
Analysis of flow velocity before and after the dams (Figure 13) reveals a consistent downstream deceleration trend in debris flow movement. The flow velocity decreased by approximately 21.9% from Dam No. 1 to Dam No. 2 and by a further 13.7% after Dam No. 2. Specifically, the flow velocities upstream and downstream of Dams No. 1, No. 2, and No. 3 were reduced by 45.34%, 40.34%, and 37.14%, respectively, indicating that velocity reduction was more pronounced upstream of each dam than any subsequent increase downstream.
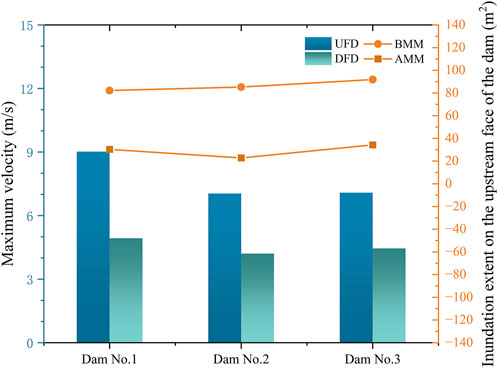
Figure 13. Variations in maximum velocity and inundation extent. UFD: Upstream face of the dam DFD: Downstream face of the dam AMM: After the mitigation measures BMM: Before the mitigation measures.
In addition to velocity changes, the reduced inundation extent upstream of the dams further reflects the effectiveness of the mitigation measures. Before implementation, the inundation extents upstream of Dams No. 1, No. 2, and No. 3 were 82.20 m2, 85.31 m2, and 91.84 m2, respectively. These values were significantly reduced to 30.35 m2, 22.83 m2, and 34.26 m2 following dam construction. The dams effectively limited debris accumulation upstream, contributing to overall flow attenuation and hazard reduction.
5.5 Variations in upstream deposition thickness and retention capacity
Figure 14a presents the deposition thickness measured 2.5 m upstream of dams No. 1, No. 2, and No. 3 before and after the mitigation measures. Following implementation, deposition thickness increased significantly at all three sites, with the most pronounced increase observed at Dam No. 3. Correspondingly, Figures 14b–d present the upstream cross-sectional profiles illustrating the changes in the effective reservoir volume of each dam before and after mitigation measures. Before mitigation, the reservoir volumes of Dams No. 1, No. 2, and No. 3 were 55.49 m3, 44.02 m3, and 46.75 m3, respectively. After mitigation, these volumes adjusted to 44.19 m3, 27.32 m3, and 60.47 m3, indicating a redistribution of sediment retention capacity within the gully system. These results confirm that the PPGDs effectively increase sediment deposition upstream and enhance debris retention performance.
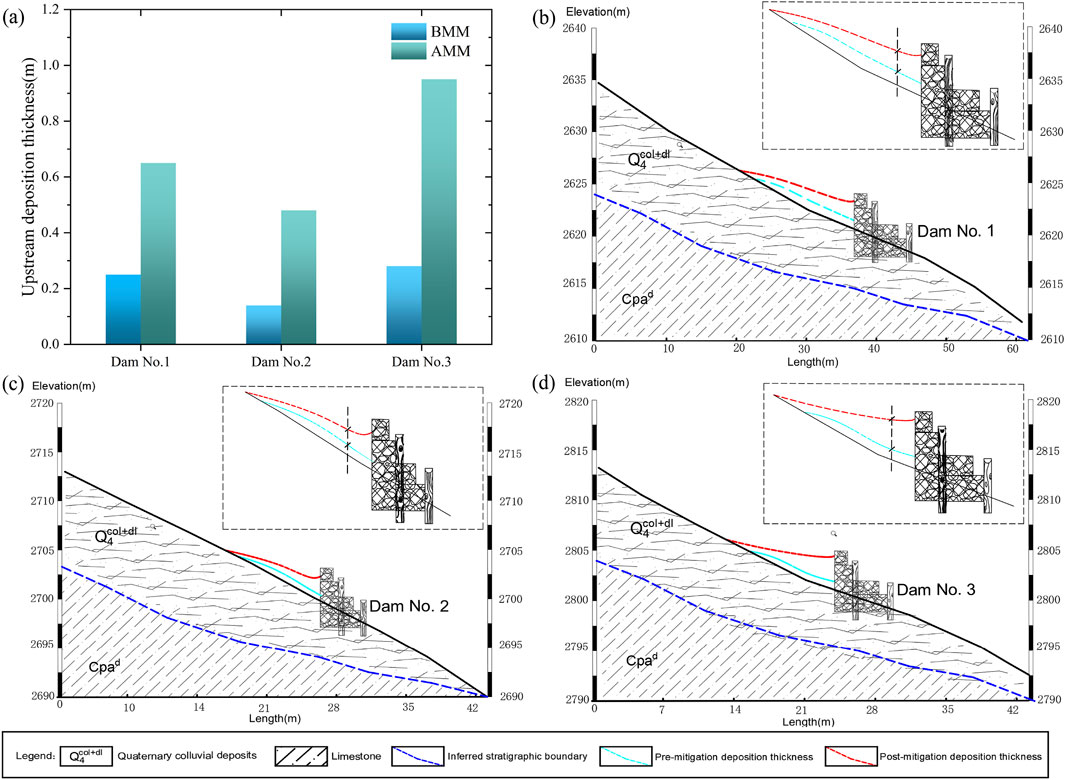
Figure 14. Variations in upstream deposition thickness and retention capacity. (a) Variations in upstream deposition thickness for the three dams. (b–d) Retention capacity variations for Dams 1–3.
5.6 Variations in inundation extent and maximum deposition thickness at the gully outflow before and after mitigation measures
The dimensions of the gully outflow range and the maximum thickness accurately indicate the threat of debris flow to the village. The analysis of Figure 15 indicates that the area of the gully outlet range before and after the implementation of mitigation measures was 17,900.54 m2 and 12,062.46 m2, respectively, reflecting a reduction of 32.61%. The outlet maximum thickness diminished from 1.268 m to 0.749 m, representing a reduction of 40.93%. The results demonstrate that the dams, which integrate gabion and pine piles, can efficiently capture debris flow materials, thereby enhancing the safety of downstream residential areas.
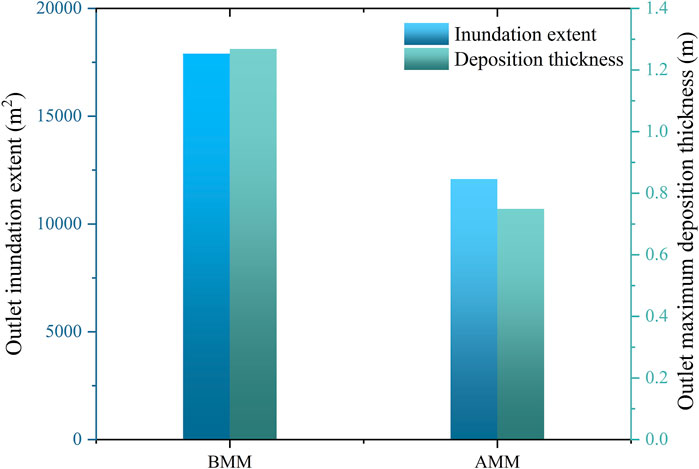
Figure 15. Variations in outlet inundation extent and maximum deposition thickness at the gully outflow before and after the mitigation measures.
6 Conclusion
This study focuses on the debris flow in the Shuzheng gully of Jiuzhaigou, examining the conditions conducive to its development and the characteristics that precipitate the disaster. It simulates the dynamic evolution of the debris flow under varying return period rainfall frequencies utilizing Massflow software, assesses the impact of preventive and control measures on the severity of the debris flow hazard, and develops a debris flow hazard model for a thorough evaluation. The research yielded the following primary conclusions:
(1) The Shuzheng gully basin is characterized by steep slopes and abundant loose materials, rendering it highly susceptible to rapid debris flows triggered by intense rainfall events. Based on rainfall return periods of 20 and 50 years, the total estimated debris flow volumes are 0.56 × 10⁴ m3 and 0.74 × 10⁴ m3, respectively. These volumes present significant hazards to Shuzheng Village, the adjacent tourist highway, and the Shuzheng Qunhai landscape. The results provide a vital basis for the quantitative assessment and risk mitigation of debris flow disasters within the Jiuzhaigou Scenic Area.
(2) Using the Rickenmann criteria for hazard zoning combined with ArcGIS raster analysis, the Shuzheng gully hazard zones under 20-year and 50-year rainfall scenarios were delineated. The low-risk zone accounts for 90.77% of the area, mainly within the circulation region. Moderate-risk and high-risk zones comprise 8.07% and 1.16%, respectively, concentrated in the accumulation areas, posing significant threats to residential communities and tourist routes. Simulations with Massflow software demonstrate its high efficiency and accuracy for rapid debris flow assessment in nature reserves, fulfilling the critical requirements for timely emergency response.
(3) The proposed PPGD control scheme effectively mitigated debris flow impact momentum by installing three retention dams in erosion-prone sections of the gully, reducing the hazardous area by 45.78% and significantly improving downstream safety. Simulation results confirmed that the mitigation measures reduced maximum outflow thickness, increased upstream retention capacity, and decreased both the sediment accumulation area along the upstream face of the dam and the outflow extent at the gully mouth. The structures demonstrated ecological compatibility by allowing water drainage while intercepting solid debris, and their flexible design adapts to evolving gully morphology.
(4) Targeted ecological restoration strategies were proposed for regions with varying slope gradients. In low-slope areas, artificial restoration techniques are prioritized to restore vegetation cover and enhance environmental protection rapidly. In contrast, in steep or landslide-prone areas, natural recovery is the primary approach, supplemented by appropriate engineering interventions to reestablish ecological stability and sustainability gradually. The overall design adheres to the principle of engineering–ecology synergy, aiming to minimize disturbance to native ecosystems. Native plant species such as birch and fir were selected to improve ecological adaptability and promote biodiversity. Sediment retention structures like the PPGD adopt a permeable design that allows fine particles to pass through, preventing downstream sediment starvation and maintaining geomorphic continuity. Although no significant ecological side effects (e.g., invasive species or water stagnation) have been observed so far, potential issues such as reduced ecological heterogeneity in localized areas are acknowledged. To address this, biodiversity indicators will be integrated into the long-term monitoring plan to support adaptive ecological management.
(5) The findings demonstrate that eco-engineered measures for debris flow control can be effectively integrated into natural and scenic environments, achieving both disaster mitigation and ecological preservation. The strong agreement between simulation and field validation supports the broader application of this approach in other similar mountainous and protected regions to enhance regional resilience. The integrated risk assessment and mitigation framework developed for Shuzheng Gully, a site with frequent debris flows and strict ecological protection requirements, also shows strong potential for transferability. It is particularly suitable for similar regions such as nature reserves, heritage sites, and other ecologically sensitive mountainous areas. Localized adjustments to parameters, vegetation selection, and design specifications are essential for successful implementation.This study provides a practical foundation for future work in debris flow risk management, ecological restoration, and early warning system improvement under evolving environmental conditions.
Data availability statement
The raw data supporting the conclusions of this article will be made available by the authors, without undue reservation.
Author contributions
DY: Funding acquisition, Investigation, Writing – review and editing. XZ: Data curation, Formal Analysis, Writing – original draft. BW: Visualization, Writing – original draft. YW: Resources, Writing – original draft. BL: Software, Writing – original draft. FW: Software, Writing – original draft. JL: Investigation, Writing – original draft. JP: Resources, Writing – original draft.
Funding
The author(s) declare that financial support was received for the research and/or publication of this article. This article is partially supported by the project of Sub-theme of the National Key Research and Development Program “Intelligent Informatization Platform for Evaluating Ecological Effects of Geological Hazard Prevention and Control Projects. (2023YFC3007101); Search on the Second Comprehensive Scientific Expedition to the Qinghai-Tibetan Plateau. (2019QZKK0902).
Conflict of interest
The authors declare that the research was conducted in the absence of any commercial or financial relationships that could be construed as a potential conflict of interest.
Generative AI statement
The author(s) declare that no Generative AI was used in the creation of this manuscript.
Publisher’s note
All claims expressed in this article are solely those of the authors and do not necessarily represent those of their affiliated organizations, or those of the publisher, the editors and the reviewers. Any product that may be evaluated in this article, or claim that may be made by its manufacturer, is not guaranteed or endorsed by the publisher.
Abbreviations
RF, Return period; QP, Peak discharge of debris flow; Td, Flow duration; ρb, Bulk density of debris flow; v, Flow Velocity; Vt, Total Debris Flow Volume per Event; Vs, Volume of Solid Material Transported per Event; BMM, Before mitigation measures; AMM, After mitigation measures; UFD, Upstream face of the dam; DFD, Downstream face of the dam.
References
Adebiyi, A. A., and Hu, P. (2022). A numerical study of the impacts of sediment composition on debris flows. J. Hydrodyn. 34, 620–633. doi:10.1007/S42241-022-0055-Y
An, Y. D., and Zhang, C. (2024). Analysis of erosion characteristics of small watershed and channel of debris flow based on multi-source remote sensing technology. Sci. Technol. Innov. 28 (10), 32–35. doi:10.3969/j.issn.1673-1328.2024.10.009
Binghan, L., Yue, L., and Peng, H. (2024). Effects of bed sediment conditions on debris flow propagation from the two-phase flow modelling perspective. Adv. Water Resour. 183, 104592. doi:10.1016/J.ADVWATRES.2023.104592
Cui, P., Liu, S. Q., and Wang, B. X. (2003). Debris flow control mode in scenic spots: take jiuzhaigou valley scenic and historic interest area valley, a world natural heritage, as an example. China ser. E Technol. Sci. 33 (S1), 1–9. doi:10.3969/j.issn.1674-7259.2003.z1.001
Gan, J. J., and Luo, C. T. (2020). Runout and process simulation of gully debris flow in middle and low Mountains. J. Nat. Disasters 29 (02), 97–110. doi:10.13577/j.jnd.2020.0210
Gao, R. X., Dai, Q. H., and Wu, X. T. (2024). Assessment on vegetation restoration on the slope surface of accumulation body of earth-rock mixing engineering in karst area. Res. Soil Water Conserv. 31 (05), 45–52+63. doi:10.13869/j.cnki.rswc.2024.05.023
Gong, X. L., Chen, X. Q., Chen, K. T., Zhao, W. Y., and Chen, J. G. (2021). Engineering planning method and control modes for debris flow disasters in scenic areas. Front. Earth Sci. 9, 712403. doi:10.3389/feart.2021.712403
Gu, X. B., Shao, J. L., Wu, S. T., Yang, T., and Ma, J. (2022). The risk assessment of debris flow hazards in zhouqu based on the projection pursuit classification model. Geotech. Geol. Eng. 40, 1267–1279. doi:10.1007/S10706-021-01961-2
Hayashi, W. L., Wu, W., and Dun, W. (2019). Tourism sector preparedness in zones with a high seismic risk: a case study of the capital region of Japan. Int. J. Saf. Secur. Eng. 9 (2), 166–181. doi:10.2495/SAFE-V9-N2-166-181
hmad, N., Shafique, M., Hussain, M. L., and Ullah, I. (2025). Integrated debris flow hazard and risk assessment using UAV data and RAMMS, a case study in northern Pakistan. J. Nat. Hazards. 121 (2), 1463–1487. doi:10.1007/S11069-024-06862-0
Huang, H., Shi, S. W., Yang, S., Tian, Y., Yang, D. X., and Liu, J. K. (2020). Study on the damage of the August 8, 2017 jiuzhaigou earthquake to debris flow mitigation engineering in the national park. Chin. J. Rock Mech. Eng. 39 (09), 1773–1786. doi:10.13722/j.cnki.jrme.2020.0099
Li, J. W. (2024). Research on optimization of ecosystem service function in mudslide disaster area by landscape ecological engineering technology. Appl. Math. Nonlinear Sci. 9 (1), 1–17. doi:10.2478/AMNS-2024-2508
Li, L., Ni, B., Qiang, Y., Wu, Y., Wu, H., and Zhou, L. (2023). Risk assessment of debris flow disaster based on the cloud model—probability fusion method. PLoS ONE 18, e0281039. doi:10.1371/JOURNAL.PONE.0281039
Lin, X., Huo, M., Zhou, J., Chen, H., Hu, J., and Zhou, H. w. (2017). An experimental study on controlling post-earthquake debris flows using slit dams. Environ. Earth Sci. 76, 780. doi:10.1007/s12665-017-7140-5
MNR (2024). Ministry of natural resources official website. Available online at: https://www.mnr.gov.cn/ (Accessed November 1, 2024).
Ouyang, C. J., An, H. C., Zhou, S., Wang, Z., Su, P., Wang, D., et al. (2019a). Insights from the failure and dynamic characteristics of two sequential landslides at baige village along the jinsha river, China. Landslides 16 (7), 1397–1414. doi:10.1007/s10346-019-01177-9
Ouyang, C. J., Wang, Z. W., An, H., Liu, X., and Wang, D. (2019b). An example of a hazard and risk assessment for debris flows—A case study of niwan gully, wudu, China. Eng. Geol. 263, 105351. doi:10.1016/j.enggeo.2019.105351
Qiao, J. P., Huang, D., and Yang, Z. J. (2012). Statistical method on dynamic reserve of debris flow's source materials in meizoseismal area of wenchuan earthquake region. J. China Geol. Hazards Prev. 23 (02), 1–6. doi:10.16031/j.cnki.issn.1003-8035.2012.02.011
Seddon, N., Chausson, A., Berry, P., Girardin, C. A. J., Smith, A., and Turner, B. (2020). Understanding the value and limits of nature-based solutions to climate change and other global challenges. Philos. Trans. R. Soc. B Biol. Sci. 375, 20190120. doi:10.1098/rstb.2019.0120
Su, N., Xu, L., Yang, B., Li, Y., and Gu, F. (2023). Risk assessment of single-gully debris flow based on dynamic changes in provenance in the wenchuan earthquake zone: a case study of the qipan gully. Sustainability 15, 12098. doi:10.3390/SU151512098
Sun, H., You, Y., and Li, D. l. (2023). Investigation of effectiveness of open check dams in debris-flow hazards mitigation. J. Nat. Disasters. 32 (06), 37–46. doi:10.13577/j.jnd.2023.0604
Sun, H., You, Y., Liu, J., Zhang, Y., Zhao, G., and Zhou, X. (2021). Experimental study on discharge process regulation to debris flow with open-type check dams. Landslides 18, 967–978. doi:10.1007/s10346-020-01535-y
Tian, S. J., Cheng, X. S., and Deng, Z. Y. (2024). Evaluation method of disaster reduction benefit of retaining dam based on debris flow hazard. J. Nat. Disasters 33 (02), 46–53. doi:10.13577/j.jnd.2024.0205
Wang, Z. W. (2020). Research on Risk Assessment of Mountainous Small-Valley Debris Flow Disasters Based on Dynamic Processes. Chengdu, China: Chengdu University of Technology. doi:10.26986/d.cnki.gcdlc.2020.000937
Wang, J. (2021). “Research on the classification of damaged slope types and vegetation ecological restoration after the earthquake in jiuzhaigou,”. Chengdu, China: Chengdu University of Technology. doi:10.26986/d.cnki.gcdlc.2021.000003
Wang, Y. D., Liang, J., and Pei, X. J. (2022). Scour initiation mechanism of deposit in jiuzhaigou scenic area after earthquake. Rock Soil Mech. 43 (04), 1048–1060. doi:10.16285/j.rsm.2021.1154
Wei, F. Q., Cui, P., and Hu, K. H. (2001). Debris flow and land desertification in Mountain area of China. J. Soil Water Conserv. 10 (5), 108–111. doi:10.13870/j.cnki.stbcxb.2001.s1.029
Xie, H., Wang, S. G., and Zhou, L. (2004). Prevention and control of debris flow in dry valley of the upper minjiang river:a case study of longdong gully. J. Nat. Disasters (05), 20–25. doi:10.3969/j.issn.1004-4574.2004.05.004
Xu, H., Hu, K. H., Tang, J. B., You, Y., and Wu, C. (2017). Assessment of debris-flow potential dangers in the jiuzhaigou valley following the August 8, 2017, jiuzhaigou earthquake, Western China. Eng. Geol. 256, 57–66. doi:10.1016/j.enggeo.2019.05.004
Xu, Q. (2010). The 13 August 2010 catastrophic debris flows in Sichuan Province: characteristics, genetic mechanism and suggestions. J. Eng. Geol. 18 (05), 596–608. doi:10.3969/j.issn.1004-9665.2010.05.002
Yang, D. X., You, Y., and Chen, X. Q. (2015). Typical characteristics and mitigation of debris flow in narrow-steep gullies in the wenchuan earthquake areas. Hydrogeol. Eng. Geol. 42 (01), 146–153. doi:10.16030/j.cnki.issn.1000-3665.2015.01.25
Yang, Y., Chen, M., Cai, Y., Tang, C., Huang, W., and Xia, C. (2024). Material activity in debris flow watersheds Pre- and post-strong earthquake: a case study from the wenchuan earthquake epicenter. Water 16, 2284. doi:10.3390/W16162284
Zhan, W. Y., You, Y., and Chen, X. Q. (2020). Case study on debris-flow hazard mitigation at a world natural heritage site, jiuzhaigou valley, Western China. J. Geomat. Nat. Hazards Risk. 11 (1), 1782–1804. doi:10.1080/19475705.200.1810784
Zhan, X., Hu, X., Jing, Z., Xu, W., Xia, D., and Ding, G. (2024). Variation in debris-flow-prone areas with ecosystem stability: a case study of the qipan catchment in the wenchuan earthquake region. Sustainability 16, 3855. doi:10.3390/SU16093855
Zhang, S. (2018). A fast calculation method for longitudinal gradient of debris flow basin based on DEM. Chin. Metal. Bull. 26 (09), 238–239. doi:10.3969/j.issn.1672-1667.2018.09.147
Zhang, W. T., Liu, J. F., and You, Y. (2023). Preliminary study on evaluation system of control effect of ecological measures for debris flow. J. Catastrophol. 38 (01), 186–193. doi:10.3969/j.issn.1000-811X.2023.01.028
Zhao, B. J., Xu, B., and Chang, M. (2021). Characteristics of debris flow in narrow-steep channel. J. Sediment. Res. 46 (05), 61–67. doi:10.16239/j.cnki.0468-155x.2021.05.010
Zhao, D. B., Hao, M. J., and Xiong, H. (2023). Research on the dynamic process of debris flow impacting rigid barrier based on SPH-DEM. J. Nat. Disasters 32 (06), 47–57. doi:10.13577/j.jnd.2023.0605
Zhao, W. Y., You, Y., Chen, X., Liu, J., Sun, H., and Zhou, X. (2020). Case study on debris-flow hazard mitigation at a world natural heritage site, jiuzhaigou valley, Western China. Geomatics Nat. Hazards Risk 11, 1782–1804. doi:10.1080/19475705.2020.1810784
Keywords: debris flow, Jiuzhaigou, Massflow, dynamic process simulation, risk assessment, ecological control measures
Citation: Yang D, Zong X, Wu B, Wang Y, Liang B, Wan F, Liu J and Peng J (2025) Quantitative risk assessment and eco-engineering mitigation strategies for debris flows utilizing dynamic process simulation in Shuzheng gully, Jiuzhaigou valley scenic and historic interest area. Front. Earth Sci. 13:1649068. doi: 10.3389/feart.2025.1649068
Received: 18 June 2025; Accepted: 21 July 2025;
Published: 01 August 2025.
Edited by:
Wenling Tian, China University of Mining and Technology, ChinaReviewed by:
Xingyu Kang, Changsha University of Science and Technology, ChinaYong Zhang, Anyang Institute of Technology, China
Copyright © 2025 Yang, Zong, Wu, Wang, Liang, Wan, Liu and Peng. This is an open-access article distributed under the terms of the Creative Commons Attribution License (CC BY). The use, distribution or reproduction in other forums is permitted, provided the original author(s) and the copyright owner(s) are credited and that the original publication in this journal is cited, in accordance with accepted academic practice. No use, distribution or reproduction is permitted which does not comply with these terms.
*Correspondence: Dongxu Yang, ZHh5YW5nQGNkdXQuZWR1LmNu