 Chun Luo1*
 Zhiwen Shen1Jin Zhang1Maohong Yao1Ying Yang1Kai Zhang1Meng Wang1Shuang Yang1Yonggang Zhang2
- 1PowerChina Chengdu Engineering Corporation Limited Co., Ltd, Chengdu, China
- 2Engineering Research Institute, China Construction Eighth Engineering Division, Shanghai, China
As the main source of pressure around tunnel rock masses, in-situ stress must be thoroughly understood to accurately predict the potential for rockburst events, especially in high-stress construction environments. Yet, theoretical advancements in this field remain behind practical engineering demands. In this study, we used a multiple linear regression approach to determine the initial in-situ stress field across the entire Ping’an tunnel and employed strength theory to predict rockburst occurrence. The regression results closely match field measurements, and the consistently low p-values confirm the reliability of the model. In addition, the rockburst intensity predicted based on the strength criterion shows strong agreement with real-world engineering observations, demonstrating the rationality of the proposed methodology. The findings from this research contributes to a deeper understanding of the initial in-situ stress field in rockburst-prone tunnels under high in-situ stress conditions and provide a scientific basis for tunnel alignment optimization and rockburst risk assessment. These insights hold significant practical implications for the construction of similar projects.
1 Introduction
In-situ stress is the fundamental source of surrounding rock pressure in tunnels. The initial in-situ stress refers to the internal stress within the crustal rock mass in its natural state (Ghorbani and Sharifzadeh, 2009; Js et al., 2003; Martin et al., 1999). Although this stress arises from long and complex geological processes and varies under different geological conditions, the dominant components are the weight of rock mass and tectonic stress (Pei et al., 2017; Figueiredo et al., 2014). During underground engineering construction, the initial in-situ stress is often disturbed, leading to a redistribution of in-situ stress (Hu et al., 2014). Consequently, local in-situ stress may exceed the strength of the surrounding rock (Xie et al., 2015). This can cause excessive surrounding rock deformation, which finally leads to the instability of underground engineering. Therefore, understanding the distribution of in-situ stress field is crucial for ensuring the safety and stability of underground engineering projects.
In recent years, considerable in-depth research has been conducted on the initial in-situ stress field, while various ideas for inverting the initial in-situ stress field based on limited measured in-situ stress data have been proposed (Feng et al., 2019; Feng et al., 2012). McKinnon. (2001) suggested that a least square approach can be used to invert the initial geo-stress field of rock masses. Wang et al. (2015) assessed the maximum horizontal tectonic stresses at different depths at fault intersections based on the analysis of tectonic stress subregions and geo-mechanical tracing method. Zhang et al. (2012) inversely estimated the initial geo-stress field at the Jinping II Hydropower Station using a least square approach. Jiang et al. (2008) combined the principle of stratum denudation and neural network method to invert the initial in-situ stress field at the Jinping II Hydropower Station site based on the measured data from the tunnel wall after excavation. Meng et al. (2018) employed the multiple linear regression method to obtain the initial in-situ stress field, corrected the in-situ stress field in the rockburst area after tunnel excavation, and ultimately determined the in-situ stress of the tunnel after excavation.
As a major geological hazard in deep rock masses, rockburst has been widely investigated by researchers both domestically and internationally through theoretical studies, experiments, and numerical analyses. Different researchers have analyzed the origin and failure mechanisms of rockbursts based on energy theory, strength theory, rigidity theory, instability theory, impact tendency theory, catastrophe theory, chaos theory, fractal theory, and dissipative structure theory. Numerous empirical criteria have been developed to classify and predict rockburst types. According to current research, these criteria can be summarized as empirical criteria based on strength theory, brittleness theory, stiffness theory, and energy theory. Among them, empirical criteria based on strength theory are the most closely integrated with engineering practice, feature easily obtainable parameters, offer strong practical applicability, and can dynamically update stress parameters in real time. This enables iterative risk prediction of rockbursts during construction and guides support optimization, making it suitable for rapid rockburst identification in deep underground engineering.
Existing research indicates that the multiple linear regression method is the most widely used approach for in-situ stress inversion analysis due to its reasonable and reliable results (Yazdani et al., 2012; Sharifzadeh et al., 2012; Wang et al., 2012). However, studies focusing on the initial in-situ stress field of the rockburst-prone tunnels in high in-situ stress environments remain limited (Vardakos et al., 2016). Zhang et al. (2015) considered the influence of self-weight and tectonic movement on the for-mation of the initial ground stress field, and adopted the multivariate regression method to perform a multivariate regression inversion analysis of the three-dimensional initial ground stress at the powerhouse area of the Shuangjiangkou Hydropower Station. In contrast, Pei et al. (2016) proposed a secondary inversion method for rock mass stress fields that accounts for the distribution characteristics of the stress tensor. This method achieves a stress field that is globally continuous over large scales while exhibiting localized dis-continuities influenced by local geological structures over smaller scales. Zhang et al. (2017) ob-tained the ground stress field in the powerhouse area of the Huangdeng Hydropower Station by integrating an intelligent nonlinear method based on the stepwise regression principle with artificial neural networks. Pei et al. (2024) proposed a joint inversion method combining stepwise multivariate linear regression and neural networks. This approach first uses stepwise multivariate regression to determine reasonable tectonic movement factors and their reference values, and then employs neural network inversion to obtain optimized inversion results.
Currently, during the multivariate linear regression inver-sion process, significance testing of the regression model and regression coefficients is an essential step. In the studies mentioned above, when performing significance testing, the F-test is generally used to assess the significance of the initial ground stress field regres-sion model, while the t-test is typically employed to evaluate the significance of the re-gression coefficients. However, both the F-test and t-test share a limitation: they can only provide a basis for determining significance but cannot quantify the strength of that ev-idence. This drawback leads to insufficient verification of the regression model’s reliabil-ity. To address this, this study proposes using the p-value method for significance testing during the inversion of the initial rock mass stress field. This approach not only provides a basis for determining significance but also quantifies the strength of the evidence. Therefore, it enables a more thorough verification of the reliability of the adopted regression model.
This study analyzed the stress magnitude and distribution of the in-situ stress based on measurements from the Ping’an tunnel of Cheng-Lan Railway. Furthermore, the initial in-situ stress field, obtained through the multiple linear regression method, was quantitatively analyzed regarding its distribution pattern and characteristics. Additionally, the rockburst intensity of the Ping’an tunnel along its full length was predicted based on the reversed initial in-situ stress field using the strength theory criterion. This research advances the understanding of initial in-situ stress fields in rockburst-prone tunnels and supports the optimization of tunnel alignment. It also establishes a scientific basis for assessing rockburst risks, with significant implications for the safe and efficient construction of relevant engineering works.
2 Project overview
The Ping’an Tunnel is a critical project on the Cheng-Lan Railway, with a length of 28,428 m. It is located between the Taohuazhai Groove and the Taiping Groove in Mao County, Aba Tibetan and Qiang Autonomous Prefecture, Sichuan Province, and is the longest railway tunnel in the southwest mountainous region of China. As illustrated in Figure 1, the tunnel adopted a sub-repair construction plan. The left-line tunnel has 7,550 m of Grade II and III surrounding rocks, 16,230 m of Grade IV surrounding rock, and 4,648 m of Grade V surrounding rock, while the right-line tunnel has 7,166 m of Grade II and III surrounding rocks, 16,465 m of Grade IV surrounding rock, and 4,797 m of Grade V surrounding rock. The highest and lowest elevations of the Ping’an Tunnel are 4,200 m and 1,690 m, respectively, resulting in the relative elevation difference of 2,510 m. Additionally, the maximum depth of the tunnel is 1,720 m.
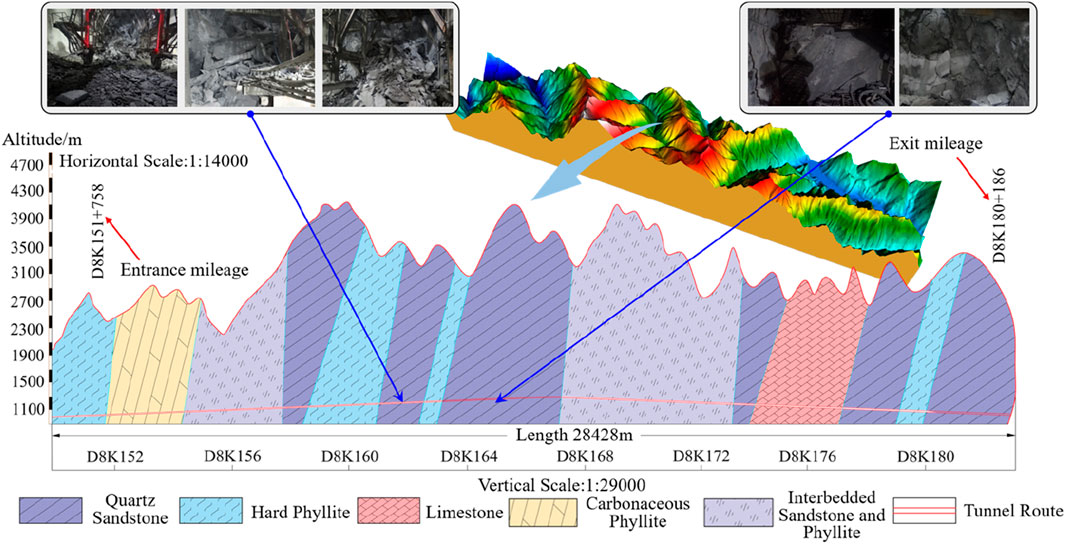
Figure 1. Geological profile of the Ping’an tunnel.
The tunnel site lies within a denuded, deeply cut middle mountain canyon characterized by vertical and horizontal valleys, with steep walls in some areas. The tunnel traverses’ numerous streams, such as Longtang Groove and Shidaguan. It is situated approximately 3–4 km from an active fault along the Min River. This proximity to the fault has led to significant rock structure development at the tunnel site. Construction observations indicate that the surrounding rock primarily consists of intact hard sandstone and limestone, with a maximum natural compression resistance of 127.7 MPa. The measured maximum horizontal principal stress is 31.5 MPa. The strata traversed by the tunnel are predominantly thin to medium-thick layers, partially sandwiched with thick layers, while the dip angle of the rock strata range from horizontal to steep. The excavation in deep-buried, hard, and intact surrounding rock was affected by factors such as high stress, strong disturbance, high osmotic pressure, and unfavourable structural surfaces, resulting in high-intensity rock bursts. Statistical analyses revealed that rock bursts in the Ping’an tunnel frequently occurred in Grade II and Grade III surrounding rock sections, which exhibit relatively complete geological structures and fracture zones where tectonic stress is concentrated. The occurrence of rock bursts poses serious threats and challenges to the safety of personnel during tunnel construction.
3 Inversion analysis of initial in-situ stress field in the Ping’an tunnel
3.1 In-situ stress test using hydraulic fracturing method
To obtain the initial in-situ stress field of the Ping’an Tunnel, an in-situ stress test was conducted at the borehole DZ-TP-10 using the hydraulic fracturing method, which is located 8 m away from the marker DK171 + 550, as illustrated in Figure 2. The borehole depth was about 781.0 m, the test aperture was 91.0 mm, and the buried depth of the underground static water level was 331.0 m. A total of 6 hydraulic fracturing stress measurements were performed at depths ranging from 545.0 to 760.0 m within the borehole, the specific steps are as follows.
(1) Determine the test position and clean the borehole, and conduct a packer pre-pressure test and a high-pressure seal test on the pressurized tubing that should not exceed 20 MPa.
(2) Connect the rubber packer in series and place it in the determined test position, apply pressure to the predetermined seat seal pressure, expand the packer seat seal onto the hole wall, then inject water and pressurize the fracturing section, and record and plot the pressure-time relationship, curve and flow-time relationship.
(3) Observe the trend of the pressure-time relationship curve. When the pump pressure rises to a certain peak pressure, the pressure suddenly drops or the curve shows an inflection point, the rock wall breaks; Keep the flow rate of the pressure pump constant. If the pressure continues to drop or remains at a certain stable pressure and the pressure fracture expands, the pump will stop pressurizing. Repeat the pressurization and depressurization cycles step by step for the pressure fracture retension test, and the number of cycles should not be less than three.
(4) Based on the measured fracturing process curve, determine the characteristic pressure parameters such as the fracture pressure, instantaneous closing pressure p:and retension pressurep, of the test section during the fracturing process, Sh and SH using Equations 1–3 to calculate the maximum and minimum horizontal principal stress. According to the impression or borehole video data, draw the fracture morphology and determine the fracture location.
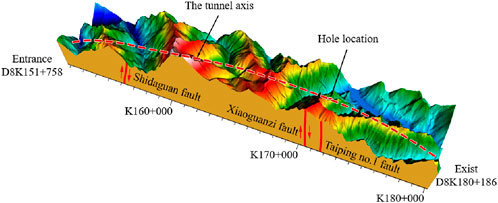
Figure 2. Three-dimensional topographic map of in-situ stress measurement for the Ping’an Tunnel.
In the formula: SH and Sh-large and small plane principal stress on the cross-section of the borehole, MPa; pb-Rock fracture pressure, MPa; p0-Rock mass pore pressure, MPa; σt-Rock mass tensile strength, MPa; ps-Instantaneous closing pressure, MPa; pr-Rock mass retension pressure, MPa.
Due to the favorable conditions in the borehole rock formation, the testing was proceeded smoothly, and the expected results were obtained. The location and results of the in-situ stress measurements obtained through the hydraulic fracturing method are presented in Table 1.
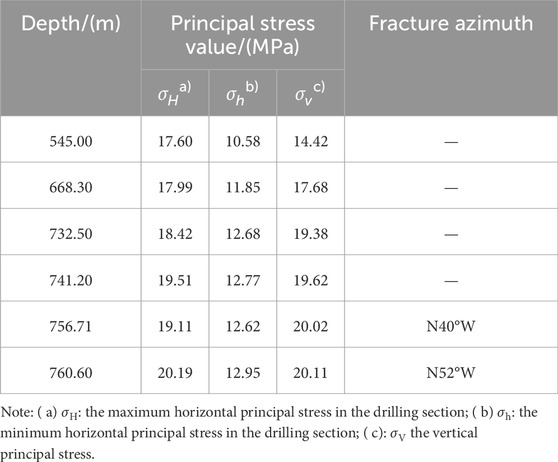
Table 1. Measurement results of hydraulic fracturing stress from borehole DZ-TP-10 in the Ping’an Tunnel.
Table 1 revealed that the measured maximum horizontal principal stress is 17.60–20.19 MPa, the minimum horizontal principal stress is 10.58–12.95 MPa, and the vertical stress is 14.42–20.11 MPa. The maximum horizontal principal stress at a depth of approximately 760 m near the tunnel body is about 20 MPa, while the minimum horizontal principal stress is about 13 MPa. The vertical principal stress estimated based on the bulk density of the overlying rock (about 2.7 g/cm3) is also about 20 MPa. The relationship between the three-dimensional principal stress values near the tunnel axis is σH > σV > σh. This finding indicates that the horizontal tectonic stress predominates. The direction of the maximum principal stress is N40∼52ºW, and the dominant direction is N46ºW. The intersection angle between this direction and the axial direction of the designed tunnel (N7ºE) is approximately 53°, which indicates that the direction of the maximum principal stress intersects the tunnel axis obliquely. This intersection angle is twice the largest optimal angle of 30°, which may adversely affect the stability of the tunnel construction. In-situ stress measurements reveal a relatively high level of tectonic stress in the region. The deep burial of the Ping’an Tunnel further amplifies the regional stress field. Consequently, the likelihood of rockbursts is significantly increased in hard rock zones with large burial depths.
3.2 Inversion analysis of initial in-situ stress field
Many uncertainties in engineering practice can impact the distribution of the initial in-situ stress field. Typically, multiple variables are interconnected and affect each other. To address this complexity, the macroscopic in-situ stress field in the engineering area can be derived through regression and inversion analysis. Although several inversion methods are available for determining the initial in-situ stress field, the finite element linear regression method is regarded as the most reliable approach. Assuming that there are P variables that influence the distribution of the initial in-situ stress field, denoted as x1, x2…, the analysis of the quantitative relationship between the initial in-situ stress field and these variables falls under multiple regression analysis. In this framework, the regression calculation values of the initial stress field serve as the dependent variable, while the stress values calculated by the finite element method for each influencing factor are treated as the independent variable. Thus, the regression equation can be formulated by Equation 4:
where k is the serial number of the observation point;
Assuming that there are m in-situ stress observation points, and each measuring point has 6 stress components, the residual sum of squares between all measured values and the finite element regression calculation value can be used to characterize the degree of deviation of the regression equation from the measured value, which can be expressed by Equation 5:
where
3.3 Inversion analysis of three-dimensional initial in-situ stress field in the Ping’an tunnel
The stress data collected from the tunnel site using the hydraulic fracturing method were analyzed through multiple regression analysis and numerical calculation methods to establish a comprehensive three-dimensional initial in-situ stress field for the Ping’an tunnel.
3.3.1 Model establishment and parameter selection
The Ping’an tunnel extends from D8K151 + 760 to D9K180 + 186, with a total length of 28.428 km. The model established for the tunnel has an axial length of 28.428 km and a lateral width of 5,000 m. It comprises 909,270 nodes and 606,873 elements, as shown in Figure 3. The elastic constitutive model was employed for the calculations, and the mechanical parameters of the rock masses were determined comprehensively based on geological survey data and laboratory test results, as presented in Table 2. Subsequent studies have shown that rockbursts generally occur in Class II and Class III hard surrounding rocks, which are capable of storing large amounts of elastic strain energy. The bottom boundary of the model was constrained to prevent displacement in the Z-direction, while the upper boundary was designed as a free surface. Additionally, gradient stresses were applied to the side faces to simulate tectonic extrusion in both the east-west and north-south directions. In the numerical model, the interaction between different rock types was defined using tie constraints, while the interaction between the fault and the surrounding soil was modeled using surface-to-surface contact that allows relative sliding.

Figure 3. Finite element model for the three-dimensional initial stress field in the Ping’an Tunnel.
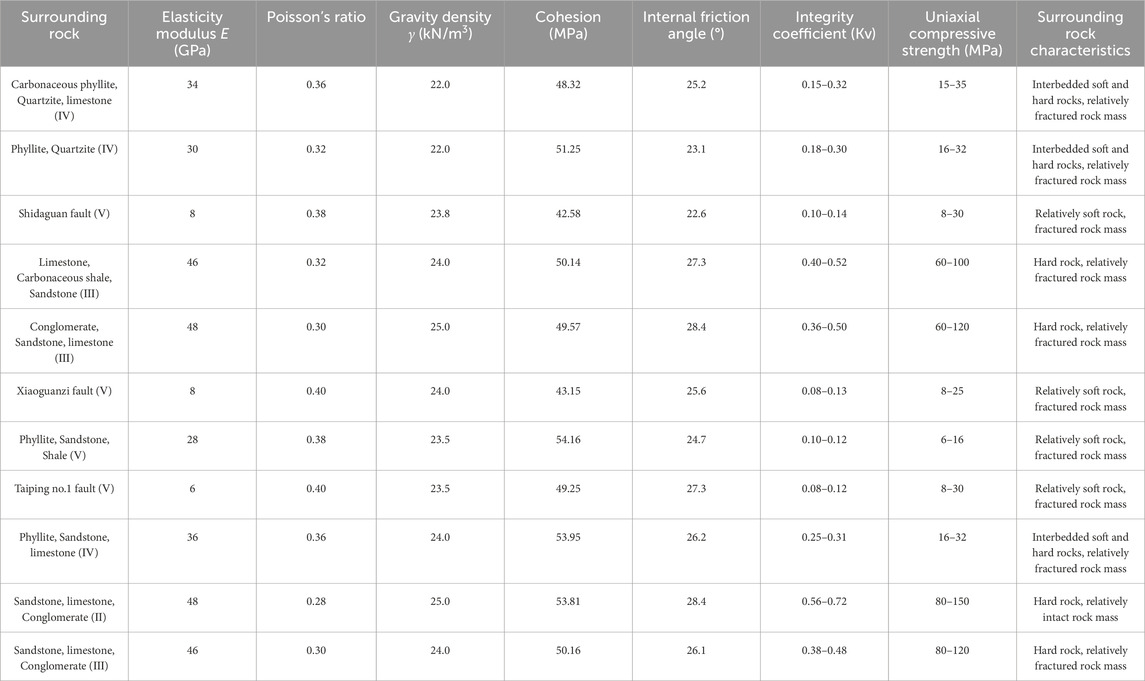
Table 2. Mechanical parameters of rock mass in the Ping’an Tunnel.
3.3.2 Boundary conditions
Due to the limitations associated with the hydraulic fracturing method, in-situ stress measurements in the Ping’an tunnel did not account for shear stress in the vertical plane. Consequently, only shear stress in the horizontal XOZ plane was considered. The numerical simulation process involves the following steps.
1. Self-Gravity Stress Field: Based on the parameters of rock masses outlined in Table 2, gravitational acceleration was applied in the Y direction within the numerical model to calculate the self-gravity stress field. Normal displacement constraints were imposed on the side and bottom boundaries of the model.
2. Tectonic Stress Field: Horizontal uniform loads were applied to both sides of the model to simulate tectonic stress in the horizontal direction. During the application of tectonic stress, the lateral and bottom surfaces retained the same boundary conditions as those under the gravity-induced stress field, while the constraints on the loaded surface were removed. It is worth noting that the simulation of in-plane shear stress was achieved by applying a 3.0 mm displacement on the long boundary and a 16.9 mm displacement on the short boundary.
The constraints on the unloaded side and bottom boundaries were consistent with those used for the self-gravity stress field. Displacement boundaries were introduced to simulate shear stress in the horizontal plane.
3.3.3 Regression inversion of initial in-situ stress field
We use the regressed initial in-situ stress values as the dependent variable, while the stress values calculated by the finite element method—considering both the self-weight stress field and the tectonic stress field—are employed as independent variables. The in-situ stress measured by the hydraulic fracturing method, along with the residual sum of squares between the measured and regressed values, characterizes the deviation between the regression equation and the measured data. Subsequently, based on the least squares method, the expression minimizing the residual sum of squares Sc is derived as shown in Equation 6:
The undetermined regression coefficient
where σ is the regression value of the initial in-situ stress field in the Ping’an tunnel, σX、σY, and σZ are the stress fields in the X, Y, and Z directions, respectively, σXOZ is the shear stress in the horizontal XOZ plane.
Since the in-situ stresses were expressed in the principal stress coordinate system (Table 1), but the regression analysis was performed in the XYZ computational coordinate system (Figure 3), a coordinate transformation was necessary to align the data with the analysis framework. Given the angular deviation between true north and the negative Z-axis, the stress components were converted using elastic theory, following the standard transformation Equation 8:
In the transformation formula,
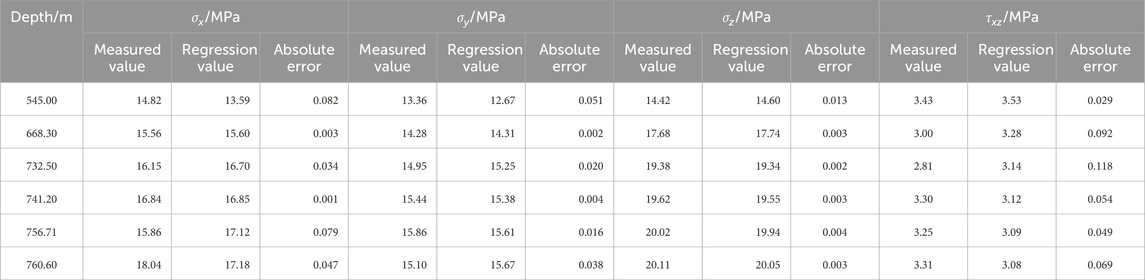
Table 3. Comparison of measured and regressed values of in-situ stress.
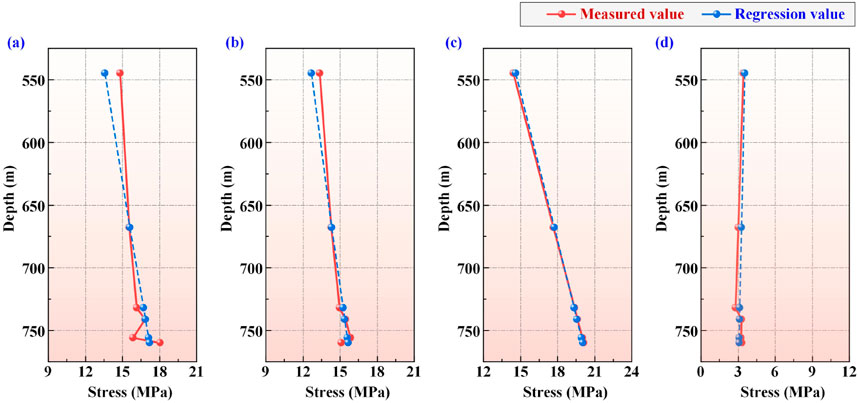
Figure 4. Variations in measured and regressed values of in-situ stress with depth: (a) Comparison of measured σx and regressed σx; (b) Comparison of measured σy and regressed σy; (c) Comparison of measured σz and regressed σz; (d) Comparison of measured τxz and regressed τxz.
As indicated in Table 3 and Figure 5, the regressed and measured stresses were in good agreement, with a maximum absolute error of 1.26 MPa. The regressed value of the in-situ stress in the vicinity of the borehole was comparable in magnitude to the measured value, and the distribution was basically consistent. This indicated that the initial in-situ stress field obtained through inversion analysis is reasonable and reliable.
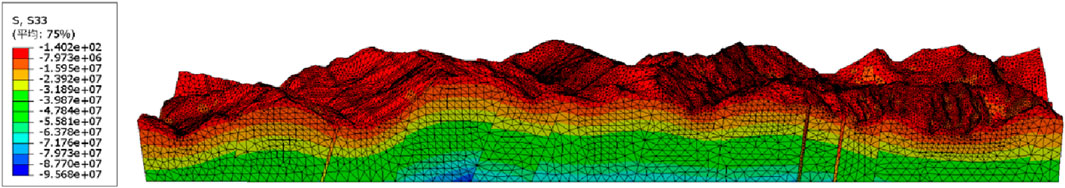
Figure 5. Calculated Y-direction gravitational stress field of the Ping’an Tunnel.
3.3.4 Reliability test of regression models
In the process of multivariate linear regression inversion of the initial geo-stress field of rock masses, the t-test for regression coefficients first assumes that all regression coefficients of the independent variables are equal to zero. The rejection region can be expressed by Equations 9, 10:
In this expression, Ti is the observed value of the test statistic, SE is the square root of the residual sum of squares, and cii is the ith diagonal element of the inverse of the normal equation coefficient matrix. If Ti exceeds the critical value c, the null hypothesis H0 is rejected at the significance level α, confirming the significance of the corresponding regression coefficient.
Furthermore, in the multivariate linear regression inversion of the initial geo-stress field of rock masses, the p-value approach corresponding to the t-test was adopted to assess the significance of the regression coefficients. The calculation method for the p-value of a regression coefficient is shown as Equation 11:
When the p-value is less than or equal to the significance level α, the null hypothesis H0 is rejected, indicating that the regression coefficient passes the significance test. According to statistical conventions, different ranges of p-values correspond to varying strengths of evidence for rejecting H0. When p < 0.01,the basis for using the regression model to invert the initial geo-stress field is considered strong. The relationship between the regression coefficients and their corresponding p-values obtained by this method is presented in Table 4.
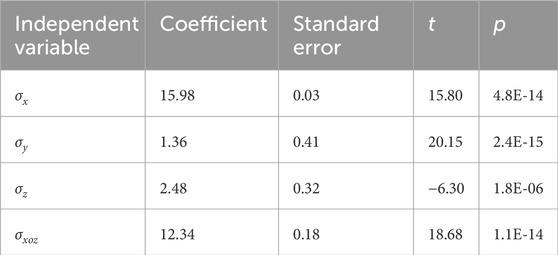
Table 4. Comparison of measured and regressed values of in-situ stress.
According to the computational results, the p-values of the regression model are generally very low, which fully demonstrates the reliability of the model.
4 Distribution characteristics of in-situ stress field in the Ping’an tunnel
4.1 Macroscopic distribution characteristics of in-situ stress field in the Ping’an tunnel
The numerical results regarding the self-gravity stress field in the Y-direction, the uniform load boundary in the X- and Z-directions, and the displacement boundary in the XOZ plane of the Ping’an Tunnel are presented in Figures 6–9.
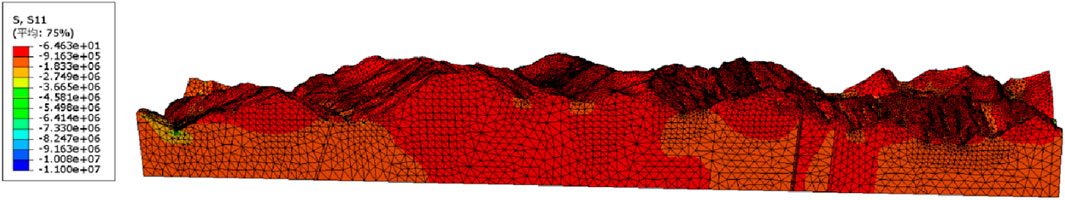
Figure 6. Calculation results of the X-direction uniform load boundary model for the Ping’an Tunnel.
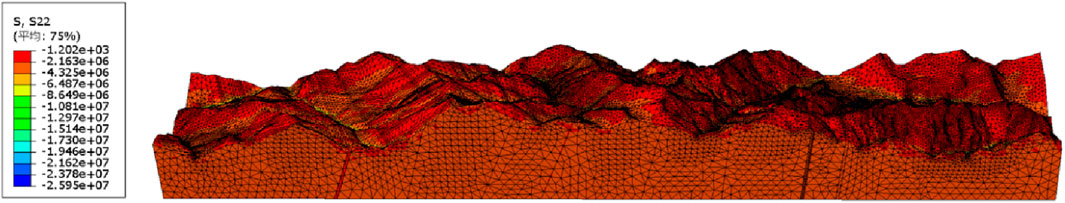
Figure 7. Calculation results of the Z-direction uniform load boundary model for the Ping’an Tunnel.
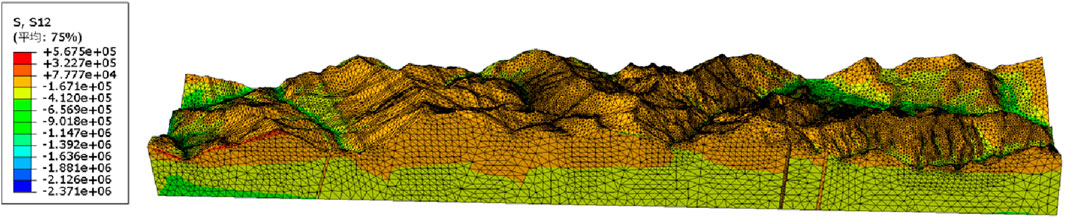
Figure 8. Calculation results of XOZ plane displacement boundary model for the Ping’an Tunnel.
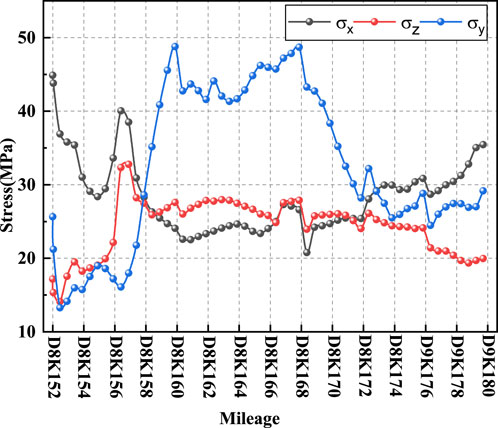
Figure 9. Variations of stresses in three directions along the tunnel axis.
These figures illustrate the macroscopic distribution characteristics of the in-situ stress field within the Ping’an Tunnel. It is evident that, under the action of the self-gravity stress field, the in-situ stress within the tunnel increases with the increase of the buried depth. At the same depth, in-situ stress in the Grade II surrounding rock was greater than that in the Grade III surrounding rock, while Grade III surrounding rock had noticeably higher in-situ stress than grade IV surrounding rock. The more intact the rock mass is, the higher its strength tends to be, and the higher the in-situ stress is likely to be. High-intensity rockbursts often occur in such rock masses, which is consistent with the theory of stress storage capacity in rock mechanics. Intact Class II surrounding rocks typically contain fewer fractures and exhibit greater strength, allowing them to accumulate more energy from tectonic and gravitational forces. In contrast, fractured Class IV rock masses tend to release stress through discontinuities, thereby reducing the amount of stored strain energy.
In addition, under the influence of the tectonic stress field, regions with greater topographic relief tend to exhibit higher in-situ stress. For example, the in-situ stress near the Shidaguan Fault, Xiaoguanzi Fault, and Taiping No.1 Fault is significantly higher than that in the surrounding rock masses. This indicates that topography and fault structures greatly influence the macroscopic distribution of the stress field. Specifically, terrain variations alter the direction and magnitude of local tectonic stress, leading to stress concentration. Regional fault activity can further impose additional tectonic stress fields on the rock mass, resulting in increased overall stress levels.
4.2 Quantitative analysis of initial in-situ stress field in the Ping’an tunnel
To quantitatively analyse the regression results of the Ping’an tunnel, stress components along the tunnel axis were extracted at intervals of 500 m. The variations of in-situ stress in three directions, the longitudinal and lateral pressure coefficients, and the variation of horizontal principal stress along the tunnel axis are illustrated in Figures 9–11.
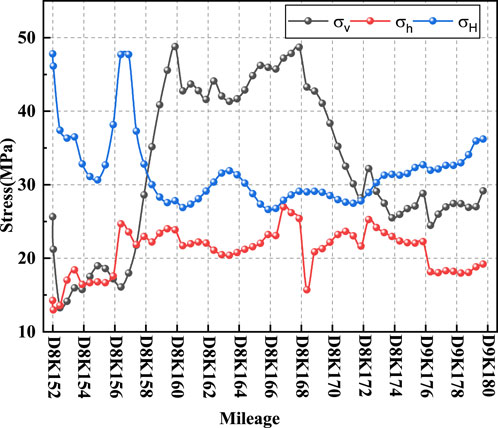
Figure 10. Change curve of horizontal principal stress at the axis position of Ping’an Tunnel.
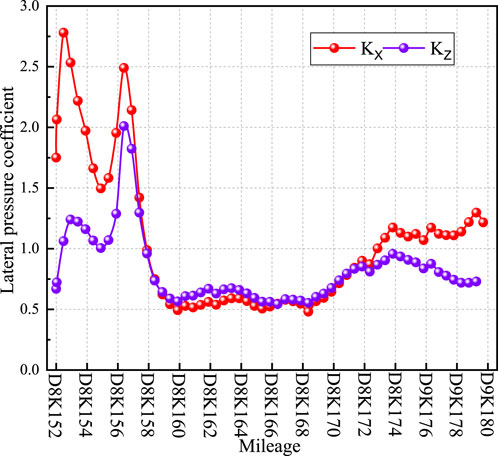
Figure 11. Change curve of lateral pressure coefficient of Ping’an Tunnel.
Figure 9 clearly demonstrated that the inverted stress values of the Ping’an Tunnel were all greater than 10 MPa, which are consistent with the measured results. The longitudinal stress in the X-direction was the largest at the tunnel entrance (D8K152). Geological tectonism contributes to increased longitudinal stress in the X-direction and transverse stress in the Z-direction near the geological formations such synclines, anticlines, folds and faults. The highest in-situ stress was observed near the Shidaguan Fault (D8K157), where the longitudinal and transverse stresses reached 40.04 MPa and 32.77 MPa. The Y-direction self-gravity stress increased with depth, peaking at 48.77 MPa at the deepest section (D8K160). The valley terrain itself may alter the direction and magnitude of local tectonic stress, leading to localized stress concentration. Meanwhile, regional tectonic activity, primarily fault movement, generates additional tectonic stress fields within the rock mass, further increasing the overall stress level. The abnormal stress reversal observed on the slopes suggests that stress redistribution occurred due to unloading effects from valley incision. The vertical stress in the Y-direction increases with burial depth, reaching a maximum value of 48.77 MPa at the deepest point (D8K160), indicating that changes in vertical stress are consistent with the variation in burial depth along the entire tunnel alignment.
Figure 10 shows the vertical stress σv, the minimum horizontal principal stress σh, and the maximum horizontal principal stress σH along the axis of the Ping’an tunnel. It was observed that the maximum horizontal principal stress σH of 47.41 MPa occurred near the valley (D8K157) close to the Shidaguan fault. The maximum horizontal principal stress σh of 26.98 MPa was located near the mileage D8K167. The maximum vertical stress σv was observed at the maximum buried depth (D8K160). This indicates that the buried depth directly affects the distribution of the vertical stress field of the tunnel. In terms of stress distribution, the minimum horizontal principal stress across the entire tunnel remained relatively constant, while the maximum horizontal principal stress increased with increasing buried depth and decreased with decreasing buried depth. However, a different trend was observed in the valley zone near the Shidaguan fault (D8K157). The maximum horizontal principal stress continued to decrease as the buried depth increased. Similar patterns were noted in the vicinity of Xiaoguanzi fault (D8K167) and Taiping no.1 fault (D8K169). In the vicinity of folds and slope topography, the maximum principal stress increased locally as the buried depth decreased. This indicates that the maximum horizontal principal stress is greatly affected by the topography and the fault. In fault zones and their affected areas, the maximum horizontal principal stress was significantly reduced, and a stress relaxation zone was identified. Additionally, in regions with pronounced terrain undulations, the horizontal principal stress was significantly increased.
Figure 11 shows the variations in the longitudinal (KX) and transverse (KZ) lateral pressure coefficients of the Ping’an tunnel with respect to mileage. It was observed that the lateral pressure coefficients at shallower buried depths (D8K152 to D8K157, D8K174 to D9K180) were generally greater than 1 due to the influence of synclines, anticlines, folds and faults. This indicates that the geological tectonism has a significant impact, with tectonic stress dominating. The self-gravity stress increased as buried depth increased. However, when the buried depth exceeded 1,000 m (D8K158 to D8K172), the lateral pressure coefficient stabilized, with most sections exhibiting values less than 1. This suggests that at greater buried depths, the tectonic stress stabilized, and the in-situ stress became predominantly influenced by the self-gravity stress.
4.3 Rockburst prediction based on strength theory
The Russense criterion is widely used for rockburst prediction; consequently, this criterion was employed to predict the rockbursts in the Ping’an tunnel. The discriminant relationship of the stress-strength ratio of Russense criterion is expressed as Equation 12 (Zhang H. X. et al., 2025; Zhang S. S., 2025; Yang et al., 2020):
where
where
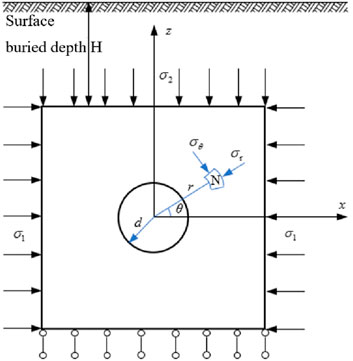
Figure 12. Schematic diagram of calculation model for the circular tunnel.
The inversion results of the in-situ stress derived from data simulation provide a preliminary evaluation of the likelihood of rockbursts in the Ping’an Tunnel. Furthermore, the actual number of rockburst events observed during tunnel construction was recorded on site. Figure 13 presents both the assessment results and the recorded rockburst events.
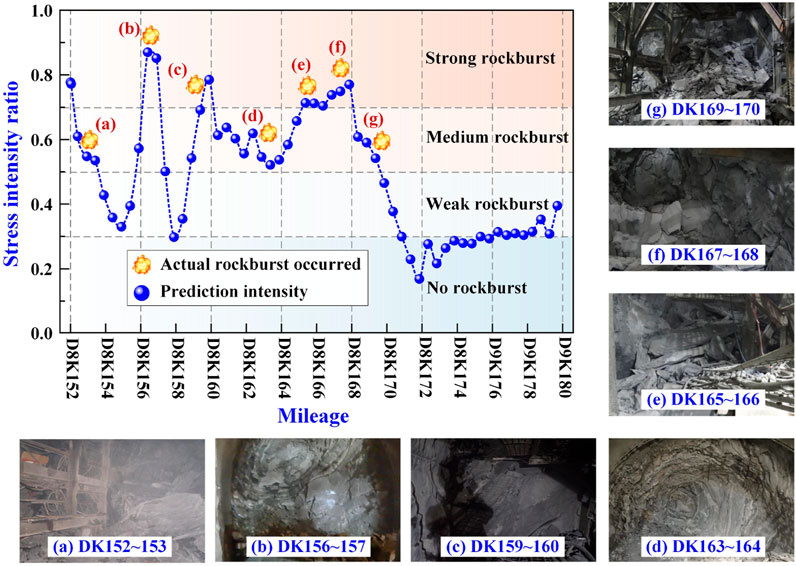
Figure 13. Predicted results of rockbursts along the axis of the Ping’an Tunnel.
As shown in Figure 13, there is a strong agreement between the predicted rockburst intensity and the observed field data. The results reveal that areas with higher predicted rockburst intensity not only exhibit a greater likelihood of rockburst occurrence but also tend to experience more severe events. The combined effects of intense tectonic and self-gravity stress fields result in high to extremely high in-situ stress levels in some sections of the tunnel site. In this high in-situ stress environment, the tunnel experienced severe uneven vertical and lateral loads. This put the overall structure of the tunnel in an extremely unfavourable stress state, which could lead to varying degrees and types of rockbursts. The main rockburst activity zones in the Ping’an tunnel are concentrated in the middle section and near the exit. The location of these zones is closely related to the terrain and tectonics. The rockburst intensities primarily ranged from weak to moderate. However, due to extremely high in-situ stress resulting from significant relative elevation differences and vigorous tectonic activity, there is a considerable accumulation of strain energy. This can lead to severe damage in hard rock during the tunnel excavation process and cause high-intensity rockbursts. Therefore, special attention should be given to the design and construction of the tunnel.
5 Conclusion
This study analyzed the initial stress levels and distribution patterns of the in-situ stress based on the measured values from the Ping’an Tunnel on the Cheng-Lan Railway. Additionally, a finite element multiple linear regression method was used to derive the initial in-situ stress field along the entire length of the Ping’an tunnel for further quantitative analysis. The distribution patterns and characteristics of the initial in-situ stress field in the rockburst-prone tunnel were discussed. The main conclusions are as follows.
(1) A multiple linear regression method was used to predict the in-situ stress field of the Ping’an Tunnel. The results show that the predicted stress values agree well with the field measurements, with a maximum absolute error of less than 10%. In addition, to further verify the reliability of the regression model and its coefficients, the p-value method was applied.
(2) The Ping’an Tunnel exhibited relatively high stress values, exceeding 10 MPa. Due to geological structures, both longitudinal stress in the X-direction and transverse stress in the Z-direction were notably elevated near synclines, anticlines, folds, and faults. The Shidaguan fault, located near the bottom of the adjacent river valley, demonstrated the highest in-situ stress, with a maximum longitudinal stress of 40.04 MPa and a maximum transverse stress of 32.77 MPa. The self-weight stress in the Y-direction increased with increasing depth and peaked at 48.77 MPa at the maximum depth, indicating a strong correlation with the buried depth of the tunnel.
(3) The lateral pressure coefficient of the Ping’an Tunnel at shallow depths generally exceeded 1 due to geological structures such as synclines, anticlines, folds, and faults, which indicated the dominance of tectonic stress. However, the lateral pressure coefficient at depths greater than 1,000 m dropped below 1.0. This observation indicated that tectonic stress stabilized, while vertical stress distribution was primarily influenced by self-gravity.
(4) The combined influence of significant tectonic and self-gravity stress fields resulted in pronounced vertical and horizontal load imbalances, placing the tunnel structure in an extreme stress state. Consequently, rockbursts of varying intensities and types occurred, primarily concentrated in the middle section and near the exit of the tunnel. The locations of these rockbursts correlated with terrain and tectonics. While most rockburst intensities ranged from weak to medium, areas with extremely high in-situ stress experienced severe damage during excavation due to large relative elevation differences and strong tectonic activity, potentially resulting in high-strength rockbursts. These areas require special attention during the design and construction of the tunnel.
Data availability statement
The original contributions presented in the study are included in the article/supplementary material, further inquiries can be directed to the corresponding author.
Author contributions
CL: Conceptualization, Funding acquisition, Project administration, Writing – review and editing, Writing – original draft, Software. ZS: Data curation, Writing – review and editing, Methodology. JZ: Project administration, Writing – review and editing, Conceptualization, Methodology. MY: Formal Analysis, Investigation, Writing – review and editing. YY: Writing – review and editing, Resources, Methodology. KZ: Visualization, Data curation, Writing – review and editing, Investigation. MW: Methodology, Writing – review and editing, Conceptualization. SY: Project administration, Writing – review and editing, Investigation. YZ: Writing – review and editing, Resources.
Funding
The author(s) declare that financial support was received for the research and/or publication of this article. This research was supported by the National Natural Science Foundation of China (Grant No. 52308394). This study received support from Power China Chengdu Engineering Corporation Limited of the Science and Technology project (Grant No. P60424 and Grant No. PZ2505). This study is supported by the science and technology project of POWER CHINA(DJ-HXGG-2023-04). The authors declare that this study received funding from Power China Chengdu Engineering Corporation Limited and POWER CHINA. The funders were not involved in the study design, collection, analysis, interpretation of data, the writing of this article, or the decision to submit it for publication.
Conflict of interest
Authors CL, ZS, JZ, MY, YY, KZ, MW, and SY were employed by PowerChina Chengdu Engineering Corporation Limited Co., Ltd. Author YZ was employed by China Construction Eighth Engineering Division.
Generative AI statement
The author(s) declare that no Generative AI was used in the creation of this manuscript.
Publisher’s note
All claims expressed in this article are solely those of the authors and do not necessarily represent those of their affiliated organizations, or those of the publisher, the editors and the reviewers. Any product that may be evaluated in this article, or claim that may be made by its manufacturer, is not guaranteed or endorsed by the publisher.
References
Feng, X. T., Xiao, Y. X., Feng, G. L., Yao, Z. B., Chen, B., Yang, C. X., et al. (2019). Study on rockburst development process. Chin. J. Rock Mech. Eng. (4), 25–30.
Feng, X. T., Zhang, C. Q., Chen, B. R., Feng, G. L., Zhao, Z., Ming, H., et al. (2012). Dynamic control of rockburst development process. Chin. J. Rock Mech. Eng. 31 (010), 1983–1997.
Figueiredo, B., Cornet, F. H., Lamas, L., and Muralha, J. (2014). Determination of the stress field in a mountainous granite rock mass. Int. J. Rock Mech. Min. Sci. 72, 37–48. doi:10.1016/j.ijrmms.2014.07.017
Ghorbani, M., and Sharifzadeh, M. (2009). Long term stability assessment of siah bisheh powerhouse cavern based on displacement back analysis method. Tunn. and Undergr. Space Technol. 24 (5), 574–583. doi:10.1016/j.tust.2009.02.007
Hu, W. C., Rui, X. B., and Qian, C. Y. (2014). Prediction of stress field of super-long deep-buried tunnel area and case analysis. Chin. J. Geotechnical Eng. 36, 955–960. doi:10.11779/CJGE201405021
Jiang, Q., Feng, X. T., Chen, J. L., Zhang, C. S., and Huang, S. L. (2008). Nonlinear inversion of 3D initial geostress field in jinping II hydropower station region. Rock Soil Mech. 29 (11), 3003–3010.
Js, A., Rc, B., and Jah, C. (2003). ISRM suggested methods for rock stress estimation—Part 2: overcoring methods. Int. J. Rock Mech. Min. Sci. 40 (7–8), 999–1010. doi:10.1016/j.ijrmms.2003.07.012
Martin, C. D., Kaiser, P. K., and Mccreath, D. R. (1999). Hoek-brown parameters for predicting the depth of brittle failure around tunnels. Rev. Can. De. Géotechnique 36 (1), 136–151. doi:10.1139/t98-072
Mckinnon, S. D. (2001). Analysis of stress measurements using a numerical model methodology. Int. J. Rock Mech. and Min. Sci. 38 (5), 699–709. doi:10.1016/s1365-1609(01)00037-5
Meng, W., Chuan, H. E., Wang, B., Zhang, J. B., Fang-Yin, W. U., and Xia, W. Y. (2018). Two-stage back analysis of initial geostress field in rockburst area based on lateral pressure coefficient. Yantu Lixue/Rock Soil Mech. 39 (11), 4191–4200 and 4209.
Pei, Q., Ding, X., Liu, Y., Lu, B., Huang, S., and Fu, J. (2017). Optimized back analysis method for stress determination based on identification of local stress measurements and its application. Bull. Eng. Geol. and Environ. 78, 375–396. doi:10.1007/s10064-017-1118-0
Pei, Q., Ding, X., and Lu, Bo. (2016). Secondary inversion method for initial stress field in dam site area considering in-situ stress distribution form. Rock Soil Mech. 37 (10), 2961–2970.
Pei, S., Zang, D., and Sun, C. (2024). Inversion method and application of in-situ stress field in large underground cavern groups with complex geology. Adv. Eng. Sci. 56 (05), 176–189.
Sharifzadeh, M., Daraei, R., and Broojerdi, M. S. (2012). Design of sequential excavation tunneling in weak rocks through findings obtained from displacements based back analysis. Tunn. Undergr. Space Technol. incorporating Trenchless Technol. Res. 28, 10–17. doi:10.1016/j.tust.2011.08.003
Vardakos, S., Gutierrez, M., and Xia, C. (2016). Back-analysis of tunnel response from field monitoring using simulated annealing. Rock Mech. Rock Eng. 49 (12), 4833–4852. doi:10.1007/s00603-016-1074-1
Wang, B., He, C., Wu, D. X., and Geng, P. (2012). Inverse analysis of in-situ stress field of cangling super-long highway tunnel. Rock Soil Mech. 33 (2), 628–634
Wang, M., Tianbin, L. I., Meng, L., and Tang, H. (2015). Back analysis of stress field in the intersection region of Y shaped fault, Sichuan. J. Railw. Sci. Eng. 12 (5), 1088–1095.
Xie, H. P., Gao, F., and Ju, Y. (2015). Mechanics and exploration of deep rock masses. Chin. J. Rock Mech. Eng. (11), 18–22.
Yazdani, M., Sharifzadeh, M., Kamrani, K., and Ghorbani, M. (2012). Displacement-based numerical back analysis for estimation of rock mass parameters in siah bisheh powerhouse cavern using continuum and discontinuum approach. Tunn. Undergr. Space Technol. 28 (1), 41–48. doi:10.1016/j.tust.2011.09.002
Yang, J. C., Liu, K. W., Li, X. D., and Liu, Z. x. (2020). Stress initialization methods for dynamic numerical simulation of rock mass with high in-situ stress. J. Central South Univ. 27 (10), 3149–3162. doi:10.1007/s11771-020-4535-3
Zhang, C., Feng, X. T., and Hui, Z. (2012). Estimation of in situ stress along deep tunnels buried in complex geological conditions. Int. J. Rock Mech. Min. Sci. 52 (3), 139–162. doi:10.1016/j.ijrmms.2012.03.016
Zhang, H. X., Huang, X., and Guo, J. Q. (2025). Influence of circumferential stress on energy evolution law of rockburst under true triaxial unilateral unloading conditions. Chin. J. High Press. Phys. 1–13.
Zhang, S. S. (2025). Research status and development trend of deep geological exploration techniques for hydraulic and hydropower engineering. Chin. J. Rock Mech. Eng. 44 (6), 1377–1404. doi:10.3724/1000-6915.jrme.2024.0921
Zhang, Q., Xiang, W., and Yu, X. (2015). Inversion analysis of initial in-situ stress field in underground powerhouse area of shuangjiangkou hydropower station. China Civ. Eng. J. 48 (08), 86–95.
Keywords: tunnel, high in-situ stress, initial in-situ stress field, rockburst, rockburst prediction
Citation: Luo C, Shen Z, Zhang J, Yao M, Yang Y, Zhang K, Wang M, Yang S and Zhang Y (2025) In-situ stress characteristics and rockburst prediction for a tunnel in a high in-situ stress environment. Front. Earth Sci. 13:1649835. doi: 10.3389/feart.2025.1649835
Received: 19 June 2025; Accepted: 21 July 2025;
Published: 25 August 2025.
Edited by:
Binbin Yang, Xuchang University, ChinaReviewed by:
Lei Shi, China University of Mining and Technology, Beijing, ChinaZaiyong Wang, Taiyuan University of Technology, China
Junbiao Yan, Chinese Academy of Sciences (CAS), China
Feng Jiang, Shandong University of Science and Technology, China
Copyright © 2025 Luo, Shen, Zhang, Yao, Yang, Zhang, Wang, Yang and Zhang. This is an open-access article distributed under the terms of the Creative Commons Attribution License (CC BY). The use, distribution or reproduction in other forums is permitted, provided the original author(s) and the copyright owner(s) are credited and that the original publication in this journal is cited, in accordance with accepted academic practice. No use, distribution or reproduction is permitted which does not comply with these terms.
*Correspondence: Chun Luo, bHVvY2h1bmJzQDE2My5jb20=