 Xiong Yang
 Yunfeng Zhao1,2,3*
 Shuai Kang
- 1The Second Monitoring and Application Center, China Earthquake Administration, Xi’an, China
- 2Innovation Academy for Precision Measurement Science and Technology, Chinese Academy of Sciences, Wuhan, China
- 3University of Chinese Academy of Sciences, Beijing, China
- 4Bureau of China Metallurgical Geology Bureau, Langfang, China
The gravity changes images of different spatiotemporal scales in the region were obtained using gravity data in the Northeastern Tibetan Plateau from 2018 to 2024. By combining regional tectonic distribution and dynamic environmental, we conducted an in-depth analysis of the dynamic relationship between gravitational spatiotemporal dynamic changes and the incubation processes of the 2022 Menyuan MS 6.9 earthquake and the 2023 Jishishan MS 6.2 earthquake. The following conclusions were reached: (1) The spatial distribution of the gravitational field in the study area is closely related to the fault zones of the two earthquakes, reflecting that the fault zones underwent tectonic activity or deformation that caused changes in surface gravity during the earthquake incubation period. (2) The reverse change of gravity may be a precursor phenomenon to earthquakes, and gravity evolution images shows that both the Menyuan earthquake and the Jishishan earthquake occurred during the periods of reverse change of gravity. (3) The gravity changes gradient zone and the center of the four-quadrant are the transition region of material conversion, where the difference movement of material increase and decrease is strong, which is prone to produce shear stress and rupture, thus inducing earthquakes, and the 2022 Menyuan earthquake and the 2023 Jishishan earthquake both occurred on the high-gradient zone. (4) The significant gravity changes before and after the Menyuan earthquake and the gravity changes before the Jishishan earthquake reflect a strong correlation with deep material structural movements, which may indicate that the occurrence of the Menyuan earthquake may have influenced the occurrence of the Jishishan earthquake. Before the earthquakes, the China Earthquake Administration made mid-term predictions for Menyuan and Jishishan based on changes in the gravity field. The occurrence of these two earthquakes strongly supporting the unique role of mobile gravity field data in determining the location of strong earthquakes.
1 Introduction
The continuous NNE-trending compression of the Indian plate against the Eurasian plate has resulted in the shortening and thickening of the crust of the Tibetan Plateau, along with its expansion into the interior of the continent (Gaudemer et al., 1995; Tapponnier et al., 2001). The Northeastern Tibetan Plateau (NETP), acting as the leading edge extending into the continent, has developed numerous large-scale active faults and folds, characterized by significant structural deformation and frequent earthquakes (Zhang et al., 2003; Xu et al., 2006; Yuan et al., 2013; He et al., 2020). According to records from the China Earthquake Networks, two strong earthquakes have occurred successively in recent years in the NETP, namely, the Menyuan MS 6.9 earthquake on January 8, 2022, and the Jishishan MS 6.2 earthquake on December 18, 2023 (Figure 1).
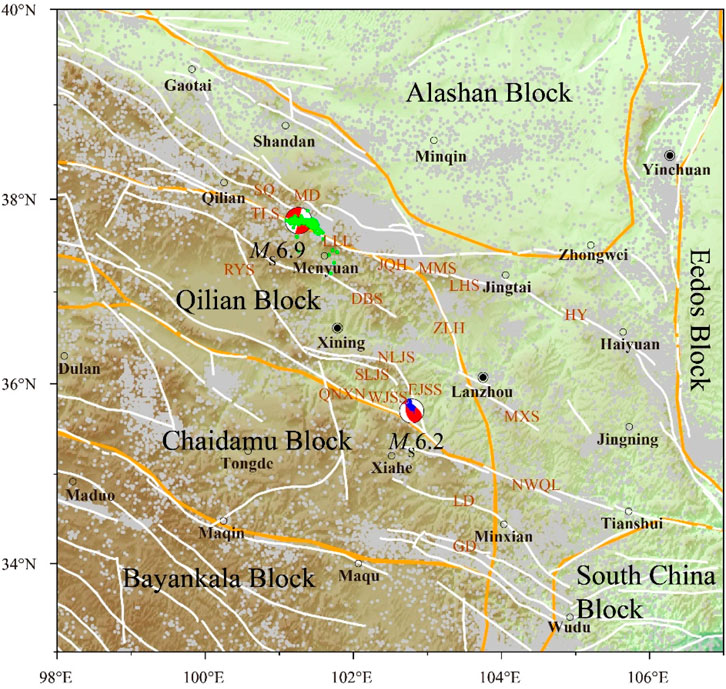
Figure 1. Regional topography, active faults and Historical earthquake distribution mapin the NETP.
The 2022 Menyuan earthquake occurred on the Lenglongling Fault, which strike NE110°, with a total length of approximately 120 km and a sliding rate of 2–19 mm/a (Lasserre et al., 2002; He et al., 2010; Zheng et al., 2013a; Guo et al., 2017). As an important component of the Qilian-Haiyuan Fault zone, its western end connects with the TuolaiShan Mountain Fault, and to the east, it connects with the Jinqianghe Fault, Maomaoshan Fault, and Haiyuan Fault, collectively forming the key boundary regulating tectonic deformation along the NETP (Gaudemer et al., 1995; Yuan et al., 2004; Zheng et al., 2013). Historical earthquake records indicate that the fault zone has experienced multiple strong earthquakes since the 20th century, including the 1920 Haiyuan MS 8.5 and 2016 Menyuan MS 6.4 events (Xu et al., 1986; Zheng et al., 2004; Guo et al., 2017; He et al., 2020; Yuan et al., 2023), indicating this region is a seismically active area.
The seismogenic structure of the 2023 Jishishan earthquake was the East Jishishan fault with NNE orientation (Zhang, 2012; Wang et al., 2024). The total length of this fault is approximately 40 km and it is an important component of the Lajishan arc-shaped structural belt (Figure 1). Regional tectonic analysis indicates that the Lajishan arc Fault zone is a compression tectonic area and tectonic transformation zone between the NWW West Qinling Fault and the NNW Riyueshan fault, controlling the boundary evolution of the three major basins of Xining-Minhe, Xunhua-Hualong and Linxia. It plays a key role in regulating the compressive deformation on the NETP (Yuan et al., 2004; 2005; Li et al., 2009; Su et al., 2024). The historical earthquake catalog shows that there is a dense development of moderate-intensity seismic activity (M ≈ 5) on both sides of this fault zone, reflecting its continuous seismic hazard.
The occurrence of seismic events is a specific manifestation of the rapid release of elastic strain energy when rocks within the Earth’s crust undergo instability and failure under tectonic stress. This process is accompanied by crustal deformation, material migration, and density changes, ultimately leading to changes in surface gravity in the epicenter area (Chen et al., 1980; Gu et al., 1997; Sun, 2004). These changes can be detected by mobile gravity monitoring. In recent years, the mainland China gravity observation network has provided valuable data for earthquake prediction research. Through innovative gravity data processing methods, researchers have successfully identified mid-term precursor signals for earthquakes of magnitude 6 or higher in the central and western regions (Zhu et al., 2008; 2013; 2016; 2017; Hu et al., 2019; Shen et al., 2020; Yang et al., 2023). These findings not only systematically reveal the dynamic characteristics of gravity field changes during the development of strong earthquakes but, more importantly, establish a quantitative relationship between gravity anomalies and earthquake prediction, laying a crucial foundation for the development of physics-based earthquake prediction methods.” Based on the gravity changes in the NETP, the China Earthquake Administration’s Second Monitoring Center (CEASMC) and the Gravity Science Group have delineated the possible locations of earthquakes in 2022 and 2023. Both the 2022 Menyuan MS 6.9 and the 2023 Jishishan MS 6.2 earthquakes occurred within the predicted areas. Notably, the prediction of the Menyuan earthquake by the CEASMC was particularly accurate, with the predicted epicenter differing from the actual epicenter by less than 50 km (Zhao et al., 2023; Zhu et al., 2024). This indicates that gravity data has a unique advantage in the medium-term prediction of earthquakes. The successive occurrence of these two earthquakes has intensified the seismic situation in the NETP. Whether there is a certain connection between them, and what the future seismic trend in this region will be and whether there will be a major earthquake, are issues of great concern to geoscientists. Therefore, this paper utilizes mobile gravity data from the NETP collected between 2018 and 2024, and through refined processing, obtains gravity changes at multiple spatiotemporal scales. We comprehensively analyze the spatiotemporal distribution characteristics of the gravity field and its relationship with the gestation and occurrence of the Menyuan MS 6.9 and Jishishan MS 6.2 earthquakes and tectonic activity, which can provide a reference basis for understanding the deep seismogenesis mechanism in this region and assessing the future seismic activity trend.
The white line represents the fault, and the orange line represents the block boundaries; Gray dots indicate the distribution of earthquakes of magnitude 2 or higher since 1970; Green dots indicate the distribution of aftershocks from the Menyuan earthquake (aftershock data from Yang et al., 2022); blue dots indicate the distribution of aftershocks from the Jishishan earthquake (aftershock data from Wang et al., 2024). TLS: Tuolaishan Fault; LLL: Lenglongling Fault; JQH: Jinqianghe Fault; MMS: Maomaoshan Fault; LHS: Laohushan Fault; HY: Haiyuan Fault; SQ: Sunan-Qilian Fault; MD: Minle-Damaying Fault; RYS: Riyueshan Fault; DBS: Dabanshan Fault; NLJS: North Lajishan Fault; EJSS: East Jishishan Fault; SLJS: South Lajishan fault; WJSS: West Jishishan Fault; NWQL: North margin of West Qinling Fault; QNXN: Qinghai Nanshan-Xunhua Nanshan Fault; ZLH: Zhuanglanghe Fault; MXS: Maxianshan Fault; LD: Lintan-Dangchang Fault; GD: Guanggaishan-Dieshan Fault;
2 Survey area information
The NETP is one of the most active regions for tectonic deformation and strong seismic activity in the Chinese mainland (Yuan et al., 2004; Li et al., 2022; Kang et al., 2023). To monitor the crustal movement in the NETP and capture medium- and short-term precursory information related to earthquakes, the CEASMC, Gansu Earthquake Agency, and Ningxia Earthquake Agency have respectively established three independent earthquake gravity observation networks in the region since 1980. However, due to each monitoring network is an independent system and lacks joint measurement and absolute benchmark control, the effectiveness of data and the ability to obtain earthquake precursors are reduced (Zhu et al., 2022; 2023). Subsequently, with the support of projects such as the “Comprehensive Observation of Geophysical Fields in Mainland China” and “the Monitoring Network of the Tectonic Environment in Mainland China”, these networks were optimized, transformed, and integrated to form the current overall gravity monitoring network in the NEPT (Figure 2). This development has facilitated enhanced accuracy of observation data and systematic analysis of the relationship between gravity dynamic changes and seismic activity. Before 2008, the monitoring network in the NETP was observed once a year. After the Wenchuan earthquake, the China Earthquake Administration (CEA) initiated enhanced monitoring task in key surveillance areas. Since 2009, the Hexi Corridor area has been subject to biannual observation. The absolute gravity observations of this network are conducted by the Hubei Earthquake Agency and the CEASMC using A10 or FG5 absolute gravimeters from June to September each year, with an observation accuracy better than 5 × 10⁻⁸ ms−2. Before each year’s field observations, the Hubei Earthquake Agency organizes companies to conduct comparative observations of the absolute gravity instruments used in the observation network at the same measurement points to eliminate systematic errors. Relative gravity observations are conducted by the CEASMC using Burris, CG-5, and CG-6 type relative gravity meters, with an observation accuracy better than 10 × 10−8 ms−2. Observations are conducted from March to May and July to September each year, aiming to minimize the impact of hydrological seasonal variations. Before field observations each year, the relative gravimeter is first subjected to a 72-h static test in a stable indoor environment with minimal temperature fluctuations. It is then tested dynamically at a nationally designated high-gradient mobile gravity measurement site, with calculations and inspections conducted to verify that all instrument parameters comply with measurement standards. Relative gravity joint measurements employ a double-trip round-trip measurement method to control errors caused by instrument drift and grid values, and two instruments are used for synchronous observation to facilitate mutual calibration. During joint measurements, the process begins at Point A and returns to Point A within the specified time, following the sequence: A→ B→ C→ D→ C→ B→ A. Both the 2022 Menyuan MS 6.9 earthquake and the 2023 MS 6.2 earthquake occurred within this monitoring network. The measuring points were evenly distributed near the epicenter, enabling clear detection of gravitational changes related to the two earthquakes.
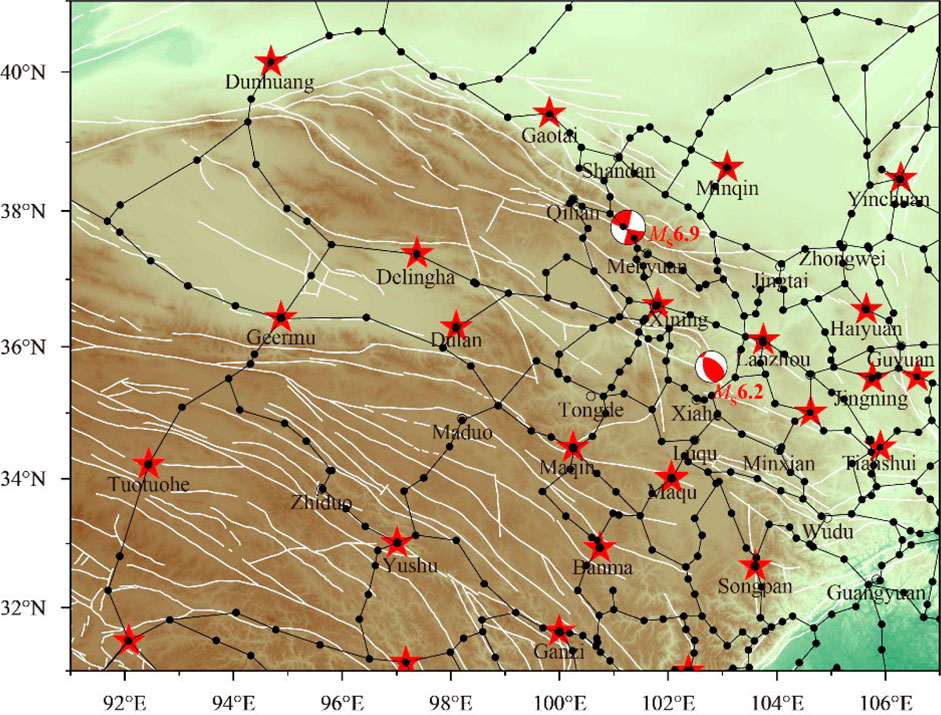
Figure 2. The distribution map of the gravity measurement network in the NETP. The red pentagram represents absolute gravity measurement points, the black dots represent relative gravity measurement points, and the black line segments represent relative gravity measurement segments.
This paper selects mobile gravity observation data from 2018 to 2024 and applies the gravity data processing software (LGADJ) from the CEA for classical adjustment. We use the absolute gravity network as the benchmark, and the relative gravity observations are treated as joint measurements with the network, thereby obtaining gravity changes at each observation point within a unified reference framework. The adjustment process requires preliminary processing of the absolute and relative gravity data (Zhu et al., 2012; 2015; 2022; Yang et al., 2023), followed by analysis of the multi-data sets to initially understand the observation accuracy of each instrument. Appropriate prior variances are allocated for each instrument before incorporating the absolute gravity data for overall classical adjustment. Measurement points affected by environmental changes are removed from the adjustment results, leading to optimal solutions for the gravity values at each measurement point. The average accuracy of gravity points values after each adjustment is between 8.4 and 10.8 × 10⁻⁸ ms−2, which reflects the reliability of the data in this study. Using the obtained gravity values at different times on the measuring point for differentiation, obtain the gravity changes at different time scales on the measuring point. Subsequently, we employed the minimum curvature method (Zhao et al., 2023) to interpolate and grid the gravity changes at the measurement points within the study area. In the gridding process, the spacing was set to three-quarters (i.e., 0.25°) of the average point spacing of the relative gravity measurement network in the northeastern margin, which is 36 km. Finally, GMT was used to plot gravity change maps at different scales. Based on the relationship between the duration of gravity changes and earthquake magnitude summarized by previous researchers, the duration of gravity change precursors for earthquakes of approximately magnitude 6 is about 1–3 years or longer, and the duration of gravity change precursors for earthquakes of approximately magnitude 7 is about 3–5 years or longer. Therefore, selecting gravity change time scales of 1, 2, and 3 years prior to the earthquake is more reasonable for analyzing the relationship between gravity change characteristics and earthquake incubation from a multi-scale perspective.
3 Gravity change characteristics in the NETP
The formation of earthquakes are closely associated with subterranean tectonic movements, which in turn causes changes in the surface gravitational field (Chen et al., 1980; Li and Fu, 1987; Kuo and Sun, 1993; Gu et al., 1997). The surface gravitational field is dynamically changing, and the gravity change at different spatiotemporal scales is extremely complex. Analyzing the evolutionary characteristics and patterns of gravitational fields at different scales can help identify gravitational anomalies associated with earthquake development. To this end, we have mapped the gravity change at different scales from 2018 to 2024.
3.1 1-year scale gravity changes
From 2018 to 2019 (Figure 3a), the gravity changes exhibited a trend of positive and negative alternating from west to east. Taking Gaotai, Qilian, Menyuan and Lanzhou as the boundary, the Zhangye, Wuwei, and Jingtai areas on the northeast side showed local changes of approximately −30 × 10−8 ms−2, while the area around Qilian on the southwest side showed local changes of approximately +60 × 10-8 ms−2. The trend of gravity change contour is mainly NW, and a gravity high-gradient zone (GHGZ) is formed along the Tuolaishan fault and the Lenglongling fault, with difference changes exceeding 90 × 10-8 ms−2 on both sides. The Menyuan earthquake occurred on the GHGZ and the zero-contour of gravity changes. Significant local negative gravity changes were observed in the junction area of the Gansu, Qinghai, and Sichuan provinces (i.e., Maqu, Ruoergai areas), which might be a reflection of the reverse recovery after the MS 7.0 Jiuzhaigou earthquake in 2017.
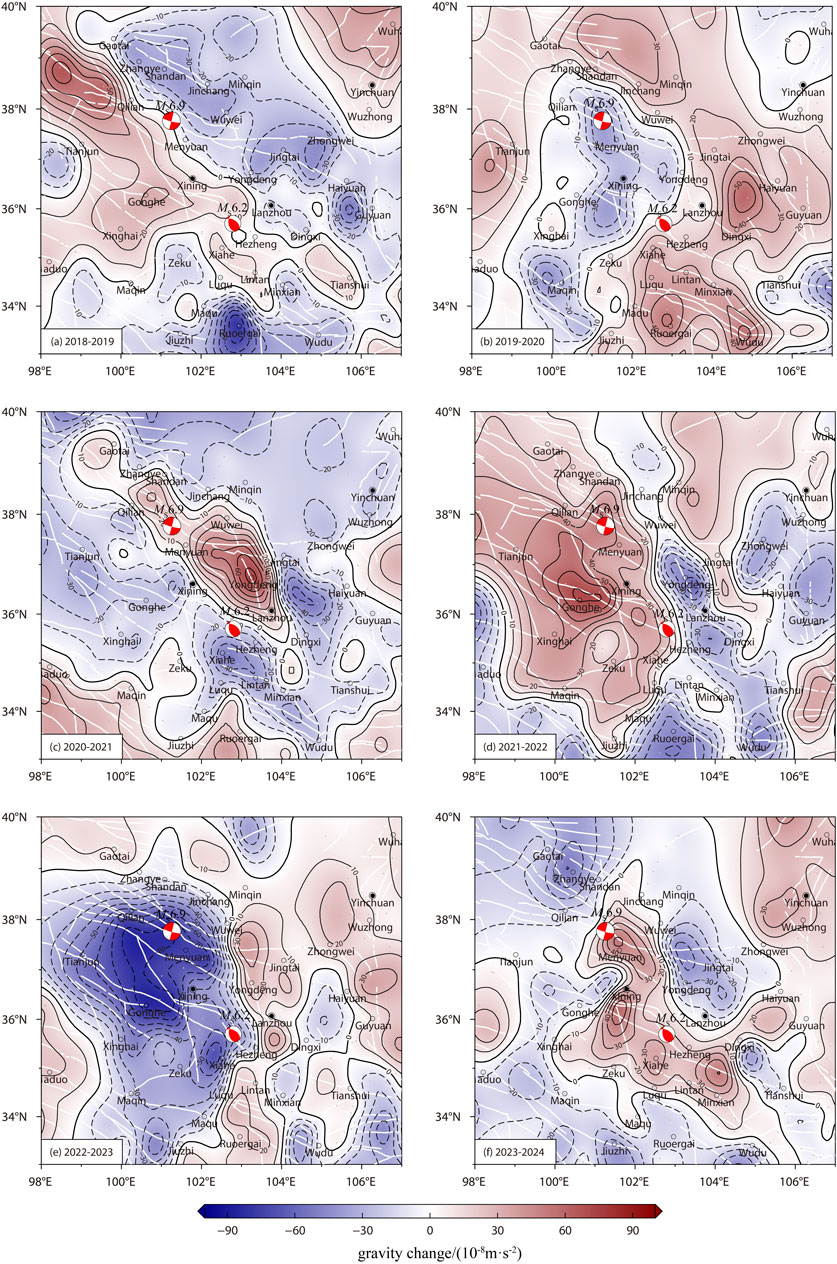
Figure 3. Annual scale gravity field changes in the NETP.
From 2019 to 2020 (Figure 3b), the overall gravity changes exhibited a trend opposite to that from 2018 to 2019. The Qinghai region was dominated by negative anomalies, and the Menyuan and Xining areas showed local changes around −30 × 10−8 ms−2. In contrast, the Gansu region was dominated by positive changes, and there is a local change of approximately +30 × 10-8 ms−2 near Shandan, Jinchang and Minqin in the Hexi Corridor. The GHGZ formed along the Tuolaishan fault still exists, but the difference changes have weakened. Additionally, the junction area of Gansu, Qinghai and Sichuan provinces has transitioned to positive gravity changes.
From 2020 to 2021 (Figure 3c), significant gravity changes were observed near the epicenter of the Menyuan earthquake in the study area. The Qilian, Shandan, and Gaotai areas to the northwest of the epicenter exhibited weak local positive changes, while the Wuwei, Tianzhu, and Lanzhou areas to the southeast showed significant changes of approximately +70 × 10−8 ms−2. The remaining negative gravity changes were mainly distributed around these two local positive changes. A four-quadrant distribution pattern of gravity changes formed in the Menyuan region, with the Menyuan earthquake occurred near the center of the four-quadrant distribution. The area near Xiahe exhibited a local change of approximately −50 × 10−8 m/s2, and between this area and the significant positive change to the southeast of Menyuan, forming a GHGZ aligned with the orientation of the Lajishan Fault, with difference changes of about 110 × 10−8 ms−2. The Jishishan earthquake occurred near the GHGZ. In eastern Gansu, near Jingtai, the negative gravity change was significant, forming a GHGZ perpendicular to the Haiyuan fault and Laohushan fault.
From 2021 to 2022 (Figure 3d), the study area demonstrated an overall trend of transitioning from positive to negative from north to south, with variations ranging from +70 × 10−8 ms−2 ∼ −50 × 10−8 ms−2. There was a reverse gravity variation near the Menyuan earthquake area. In the western Qinghai region, positive changes predominated, with gravity changes of approximately +70 × 10−8 m/s2 observed near Menyuan and Gonghe area. In contrast, the negative gravity changes along Jinchang, Wuwei, Lanzhou, and Wudu in the central part run throughout the entire region. A GHGZ is formed along Jinchang, Wuwei, Xiahe, and Maqu, with a bend occurring near Xiahe in the mid-section of the GHGZ. The Zhongwei and Guyuan areas in Ningxia exhibited a gravity variation of around −30 × 10−8 ms−2. The 2022 Menyuan earthquake occurred during the process of reverse gravity change and on the GHGZ, while the 2023 Jishishan earthquake occurred at the turning point of the GHGZ.
From 2022 to 2023 (Figure 3e), the study area exhibited an overall trend of transitioning from negative to positive from west to east, which was opposite to the change from September 2021 to September 2022. Affected by the Menyuan earthquake, the Menyuan, Qilian, and Gonghe in Qinghai Province exhibited intense negative gravity changes. In contrast, the Minqin, Jingtai, and Lanzhou in Gansu Province exhibited weak local positive gravity changes. A GHGZ was formed along Jinchang, Wuwei, Lanzhou, Xiahe, and Maqu, with the greatest difference on either side reaching approximately 110 × 10−8 m/s2. The Jishishan earthquake occurred at the bend of the GHGZ.
From 2023 to 2024 (Figure 3f), the gravity change in the study area was weaker than those observed from 2022 to 2023. The northern Gaotai and Shandan regions exhibited gravity change of approximately −40 × 10−8 m/s2. The Mengyuans, Xining, Xiahe and Minxians in the middle exhibited positive change, and the Wuwei and Jingtai areas at the junction of Gansu and Ningxia showed exhibited local negative gravity change. The GHGZ was formed along the Wuwei-Tianzhu and Zhuanglanghe faults, with difference changes reaching approximately 90 × 10−8 ms−2. The gravity changes near the Jishishan earthquake area recovered smoothly, indicating that the energy release there had been completed.
3.2 Cumulative gravity changes
3.2.1 2-year scale gravity changes
From 2018 to 2020 (Figure 4a), the gravity variation exhibited generally gentle, with variations ranging from −40 × 10−8 ms−2 ∼ +50 × 10−8 ms−2. The Qilian and Gonghe areas in Qinghai exhibited gravity change of approximately +20 × 10−8 ms−2, while the area of Shandan, Menyuan and Wuwei showed gravity change of around −30 × 10−8 ms−2. A GHGZ was formed along Qilian, Menyuan and Xining near the Tuolaishan fault. The Menyuan earthquake occurred near the bend of the GHGZ. In the southeastern Gansu region, near Xiahe and Dingxi, a gravity changes of approximately +40 × 10−8 ms−2 was observed, while the junction area of Gansu, Qinghai and Sichuan provinces (i.e., Maqu, Ruoergai area) shows gravity change of approximately −30 × 10−8 ms−2. Additionally, the GHGZ is formed along the Guanggaishan-Dieshan fault.

Figure 4. Cumulative gravity field changes at 2-year scale.
From 2019 to 2021 (Figure 4b), the gravity variation were more significant. The Menyuan, Xining and Gonghe areas showed negative local gravity changes, while the positive gravity changes were primarily concentrated in Gansu and southern Ningxia. The southeastern part of the Menyuan epicenter showed significant local positive gravity changes, forming a northwest-trending GHGZ with the negative changes in the Gonghe area, with a difference changes of approximately 120 × 10−8 ms−2. The GHGZ turns near the Menyuan epicenter, intersecting perpendicularly with the Tuolaishan Fault and the northern margin fault of the Qilianshan, and aligns with the Lajishan Fault near the Jishishan, indicating a close relationship between gravity changes and tectonic movements.
From 2020 to 2022 (Figure 4c), the study area maintained significant gravity changes. The western Qinghai region primarily exhibited positive changes, with the Menyuan earthquake zone showing gravity changes of approximately +60 × 10−8 ms−2. In contrast, the eastern Gansu and Ningxia regions primarily exhibited negative changes, with the Zhongwei, Dingxi, and Xiahe areas showing gravity changes of approximately −40 × 10−8 ms−2. A GHGZ was formed along Shandan, Wuwei, Lanzhou, Xiahe, and Maqu, running through the entire study area. The northern part of the GHGZ largely coincides with the strike of the Tuolaishan fault and the northern margin of the Qilianshan fault, suggesting that regional gravity field changes may be closely connected to fault activity. Conversely, the southern part of the GHGZ is perpendicular to both the West Qinling fault and the Lajishan fault. The Menyuan earthquake occurred near the GHGZ and within the local positive anomaly area, while the Jishishan earthquake occurred on the GHGZ and the zero-contour.
3.2.2 3-year scale gravity changes
From 2018 to 2021 (Figure 5a), the gravity changes near the Menyuan epicenter within the entire study area were relatively pronounced. The Shandan and Jinchang regions exhibited gravity changes of approximately −40 × 10−8 m/s2, while the Wuwei and Lanzhou regions in Gansu Province exhibited gravity changes of approximately +50 × 10−8 m/s2. Overall, a four-quadrant distribution pattern was observed around the Menyuan epicenter, with the earthquake occurring near the center of the four-quadrant. Weaker gravity changes were recorded in the Qilian and Gonghe areas of Qinghai Province and the southeastern part of Gansu Province, while the northern part of Guyuan in Ningxia exhibited gravity change of approximately +30 × 10−8 m/s2.
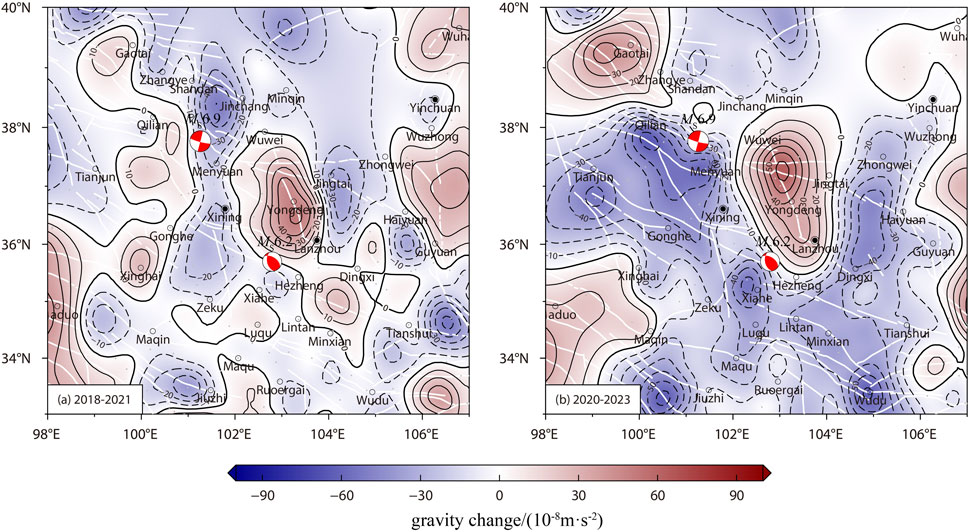
Figure 5. Cumulative gravity field changes at a 3-year scale.
From 2020 to 2023 (Figure 5b), the gravity changes in the study area were relatively intense, with a variation range between −60 × 10-8 ms−2 and +60 × 10-8 ms−2. The gravity changes in the vicinity of Menyuan exhibit a four-quadrant distribution. The Menyuan and Gonghe areas in Qinghai showed significant negative gravity changes, with the gravity contour aligning with the Tuolaishan fault and the northern margin of the Qilianshan fault. The gravity changes of approximately +40 × 10−8 ms−2 was observed near the Gaotai area, while gravity changes of approximately +60 × 10−8 ms−2 were recorded in the Wuwei and Lanzhou areas of Gansu. The areas from Zhongwei in Ningxia to Maqu in Gansu all showed negative gravity changes. A U-shaped GHGZ forms along the border of Gansu and Qinghai provinces, spanning Menyuan, Xiahe, Lanzhou, and Jingtai. The Menyuan earthquake occurred at the center of the four-quadrant and on the GHGZ, while the Jishishan earthquake occurred in the bend of the GHGZ and on the zero-contour of gravity.
4 Gravity changes analysis
4.1 Influencing factors of gravity changes
The changes of the earth’s gravity field is a comprehensive reflection of all the material migration occurring underground. To analyze the gravity changes related to the structure factors, it is necessary to exclude the influence of other factors. Hydrological change is an influencing factor that needs attention in high-precision gravity observation. First, the mobile gravity observation are typically conducted in the same month of different years, which can effectively suppress the interference of seasonal hydrological changes on gravity variations. Additionally, studies indicates that the annual variation in precipitation has an effect of less than 5 × 10⁻⁸ ms−2 on gravity (Yue et al., 2010; Zhu et al., 2010). Based on surface soil water data calculations, Zhao Yunfeng showed that the hydrological gravity effect before the Menyuan earthquake was approximately 4 × 10⁻⁸ m/s2 (Zhao et al., 2023). This value is significantly lower than the tectonic gravity anomaly of 40–100 × 10−8 m/s2 observed during the same period, indicating that gravity changes caused by soil water changes have little effect on the distribution of earthquake gravity changes. The calculation and analysis of hydrological data in southern Tibet before the 2015 Nepal MW 7.8 earthquake (Yi et al., 2016) show that, compared with the absolute gravity changes of 40 × 10−8 ms−2 observed before the earthquake (Chen et al., 2016), the annual gravity changes caused by these factors are small (the combined effect is 5 × 10⁻⁸ ms−2) and negligible. In the NETP, where the precipitation is less than that in southern Tibet, the gravity changes caused by surface water are much smaller than the gravity change observed before the earthquake.
In addition, the surface deformation also has a certain influence on the gravity changes. Theoretically, considering both elevation and density changes, a 1 cm vertical deformation of the surface can cause a change in surface gravity of approximately 2 × 10⁻⁸ m/s2. Hao Ming used precise leveling data to study vertical deformation along the eastern Tibetan Plateau, indicating that the NETP exhibits uplift deformation. The uplift rate of the Western Qinling Mountains is 5–6 mm/year, while the eastern segment of the Qilian Mountains has an uplift rate of 3–4 mm/year, and the western segment has a rate of 1–2 mm/year (Hao et al., 2014). Overall, the vertical deformation rate along the NETP is less than 6 mm/year, contributing approximately 4 × 10⁻⁸ m/s2 to gravity changes over a three-year period, which is within the accuracy of gravity observation. This indicates that the gravity changes observed before the earthquake on the Tibetan Plateau reflect the results of deep material migration.
4.2 Gravity changes characteristics and seismic activity
The spatial characteristics of gravity changes along the NETP profoundly reflect tectonic activity and provide good gravitational precursor evidence for the occurrence of the Menyuan and Jishishan earthquakes. The annual-scale gravity change show that before the Menyuan earthquake, the gravity changes first exhibited a GHGZ aligned with the strike of the seismogenic fault (Tuolaishan fault and Lenglongling fault) (Figures 3a,b), and then the area near the epicenter evolved into a four-quadrant distribution (Figure 3c). The Menyuan earthquake ultimately occurred in this GHGZ, the center of the four quadrants and during the stage of gravity reverse variation. Before the Jishishan earthquake, gravity changes also formed a GHGZ consistent with the direction of the Lajishan Fault (Figure 3c). Notably, following the Menyuan earthquake, gravitational activity in the study area remained intense, suggesting that energy in the region may not have been fully released. The direction of the GHGZ gradually shifted to be perpendicular to the Lajishan Fault (Figures 3d,e). The Jishishan earthquake occurred on the GHGZ and at the bend of gravity contour. After the Jishishan earthquake, the gravity changes near the epicenter tended to be stable (Figure 3f), indicating that the energy release was completed. Overall, the gravity changes associated with the Menyuan earthquake has experienced an evolution process characterized by “ GHGZ—four-quadrant distribution characteristic—earthquake occurrence during reverse change”, while the gravity changes related to the Jishishan earthquake has followed an evolution process described as “ GHGZ—trending gravity anomaly changes—earthquake occurrence during reverse change—stabilization after the earthquake”. The gravity evolution map of annual-scale better reflects that earthquakes are prone to occur in the periods of reverse change of gravity.
Analyzing the cumulative gravity change map reveals that the gravity change characteristics are more significant. The cumulative results over a two-year period show that, before the Menyuan and Jishishan earthquakes, a significant GHGZ appeared near the epicenters of both earthquakes. The gravity differences at the epicenters of the Menyuan and Jishishan earthquakes reached 120 × 10−8 m/s2 (Figure 4b) and 90 × 10−8 m/s2 (Figure 4c), respectively. The GHGZ is a transitional area for material transformation, where the differences in material increase and decrease are intense, which can easily generate shear stress and trigger rupture, thereby inducing earthquakes. Over a three-year timescale, gravitational anomalies at the Menyuan epicenter were not prominent, but overall exhibit a four-quadrant distribution characteristic (Figures 5a,b). Near the Jishishan earthquake epicenter, there is a GHGZ aligned with the tectonic trend, and a turn occurs (Figure 5b). The cumulative gravity changes indicate that both earthquakes occurred on GHGZ and near the bends of the gravity contour. This suggests that strong earthquakes are likely to occur in the four-quadrant centers related to tectonic activity or in the GHGZ where positive and negative anomalies transition, near the bends of the gravity change zero-contour line (Zhu et al., 2013; 2016; 2022).
4.3 Gravity changes and tectonic activity
Previous research demonstrates that during the development of strong earthquakes, deep structural movements directly affect changes in the regional gravitational field, generating dense gravity contours along active tectonic blocks boundaries, resulting in GHGZ (Zhu et al., 2015; Zhu et al., 2017; Zhu et al., 2022). The 2022 Menyuan earthquake and the 2023 Jishishan earthquake occurred near the southern and northern boundaries of the Qilian block, respectively (Figure 1). As an important site for the expansion of material on the Tibetan Plateau, the southern part of the Qilian block is affected by the collision of the Indian and Eurasian plates, while the northern part is blocked by the Alashan and Ordos blocks. Under dual compression, the Qilian block has undergone shortens and uplifts. Meanwhile, its northern and southern boundaries, the Qilian-Haiyuan fault and the northern margin of the West Qinling fault, play a significant regulatory role in the northeastward escape of materials from the Tibetan Plateau. The intense differential movement of materials can easily lead to stress accumulation at the block boundaries, causing regional rock rupture and earthquakes (Zheng et al., 2013b; 2021; Meng et al., 2022; Yuan et al., 2023). Other data (Wang et al., 2013; Hao et al., 2014; Wang et al., 2016; Wang et al., 2017; Wang et al., 2022)) also indicate that the Menyuan and Jishishan earthquake areas are located in the transition zone of rapid changes in crustal thickness, rapid changes in velocity ratios, and high-low density anomaly. This suggests that the deep structural composition of the seismic source region undergoes significant physical property changes, which can easily lead to stress concentration and provide a tectonic backdrop conducive to major earthquakes. The regional gravity field change maps at different time scales also show the presence of GHGZ aligned with the seismic structural trend along the boundary of the Qilian block (Figures 3–5). Upon careful analysis, it is evident that the distribution of gravity changes is closely related to the block division pattern. The GHGZ is primarily distributed along the boundary of the NETP. The significant gravity changes before and after the Menyuan earthquake mainly occurred in the internal areas of the Tibetan Plateau (Figures 3d,e, 4c). The gravity changes inside the Alashan and Ordos blocks were relatively minor, reflecting that these blocks are stable and not prone to material migration. However, the occurrence of the Menyuan earthquake caused deep crustal material migration and redistribution within the Tibetan Plateau. Previous studies showed that strong earthquakes can cause stress redistribution in associated structural areas, accelerate the accumulation of adjacent fracture strain, and thereby may trigger subsequent strong earthquakes (Gu et al., 1997; Ma et al., 2007). The 2022 Menyuan earthquake occurred near the Tuolaishan fault and the Lenglongling fault in the middle-eastern segment of the Qilian-Haiyuan fault. The gravity variation map shows that the significant gravity anomaly area and GHGZ before and after this earthquake have a clear response to the subsequent Jishishan earthquake, indicating that both may be anomalies caused by regional tectonic movements. This phenomenon reflects that the deep crustal material migration and energy exchange triggered by the Menyuan earthquake were blocked by the northwest stable block and transported toward the southeast, disrupting the stress state of the Lajishan Fault and the northern margin of the West Qinling Fault in the Jishishan earthquake zone, thereby accelerating their material exchange processes. Therefore, it is inferred that the 2022 Menyuan earthquake played a promotional role in the occurrence of the 2023 Jishishan earthquake.
5 Conclusion
This paper utilized mobile gravity data from the NETP from 2018 to 2024. Through comprehensive adjustment processing, gravity evolution images of different time scales in this region were obtained. We systematically analyze the relationship between the gravity change in the NETP and the preparation of the 2022 Menyuan MS 6.9 earthquake and the 2023 Jishishan MS 6.2 earthquake. The main understandings are as follows:
1. The spatial distribution of gravity field in the NETP is highly correlated with tectonics. Significant gravity changes are primarily distributed around the boundaries of major active tectonic blocks or active fault zones near the earthquake zone. The strong differential movement of these tectonic zones leads to highly discontinuous deformation, which is conducive to stress concentration and earthquake nucleation. The GHGZ formed along the fault zones reveal the underground material migration process driven by the enhancement of the tectonic stress field in the source zone before the earthquake.
2. There is a good correlation between the gravitational evolution process and the occurrence of earthquakes. The gravity field at the annual-scale indicates that before the 2022 Menyuan earthquake, the gravity changes experienced an evolutionary process characterized by “ GHGZ–four-quadrant distribution characteristics - earthquake occurrence during reverse change “. In contrast, the gravity changes before the 2023 Jishishan earthquake followed an evolutionary process described as “ GHGZ—trending gravity anomaly changes—earthquake occurrence during reverse change—stabilization after the earthquake”. This is consistent with previous research findings that indicate earthquakes tend to occur during periods of reverse gravity change.
3. Gravity changes at the scales of 1 year, 2 years, and 3 years indicate that the 2022 Menyuan earthquake occurred near the GHGZ, the gravity zero-contour line, and the center of the four-quadrant area. Similarly, the 2023 Jishishan earthquake occurred on the GHGZ and the gravity zero-contour line. The GHGZ and the four-quadrant centers serve as transitional areas for material transformation, where there is intense differential movement of material increase and decrease, which can easily generate shear stress leading to rupture and triggering earthquakes. These findings are consistent with previous research results, which indicates that strong earthquakes are more likely to occur in GHGZ related to tectonic activity, in the transitions between positive and negative gravity anomaly areas, at the bends of the gravity change zero-contour line, or near the four-quadrant centers.
4. The GHGZ and gravity anomaly area before and after the Menyuan earthquake are highly consistent with those before the Jishishan earthquake, indicating a strong correlation between the deep structural movements of the two earthquakes. This suggests that the co-seismic or post-seismic recovery and adjustment process of the Menyuan earthquake may have triggered adjustments in the stress field around the epicenter of the Jishishan earthquake, thereby influenced its occurrence.
Data availability statement
The datasets presented in this study can be found in online repositories. The names of the repository/repositories and accession number(s) can be found below: The datasets used during this study are openly available in the repository ZENODO at https://doi.org/10.5281/zenodo.14636688.
Author contributions
XY: Data curation, Visualization, Writing – original draft, Formal Analysis, Conceptualization. YuZ: Writing – review and editing, Conceptualization, Methodology. SW: Writing – review and editing, Formal Analysis, Visualization, Data curation. YiZ: Supervision, Conceptualization, Writing – review and editing. CL: Writing – review and editing, Visualization, Data curation. SK: Writing – review and editing, Investigation, Data curation. HL: Writing – review and editing, Investigation, Data curation.
Funding
The author(s) declare that financial support was received for the research and/or publication of this article. This research was funded by the National Natural Science Foundation of China (No. 42374104, No. 41874092), the Natural Science Foundation of Shaanxi Province, China (2025JC-YBQN-390) and the Spark Programs of Earthquake Sciences granted by the China Earthquake Administration (XH25053YA, XH25054YA).
Conflict of interest
The authors declare that the research was conducted in the absence of any commercial or financial relationships that could be construed as a potential conflict of interest.
The reviewer LL declared a shared affiliation with the authors to the handling editor at the time of review.
Generative AI statement
The author(s) declare that no Generative AI was used in the creation of this manuscript.
Any alternative text (alt text) provided alongside figures in this article has been generated by Frontiers with the support of artificial intelligence and reasonable efforts have been made to ensure accuracy, including review by the authors wherever possible. If you identify any issues, please contact us.
Publisher’s note
All claims expressed in this article are solely those of the authors and do not necessarily represent those of their affiliated organizations, or those of the publisher, the editors and the reviewers. Any product that may be evaluated in this article, or claim that may be made by its manufacturer, is not guaranteed or endorsed by the publisher.
References
Chen, Y. T., Gu, H. D., and Lu, Z. X. (1980). Gravity changes before and after the Haicheng earthquake in 1975 and the Tangshan earthquake in 1976. Acta Seismol. Sin. 2, 21–31.
Chen, S., Liu, M., Xing, L., Xu, W., Wang, W., Zhu, Y., et al. (2016). Gravity increase before the 2015 Mw 7.8 Nepal earthquake. Geophys Res. Lett. 43, 111–117. doi:10.1002/2015GL066595
Gaudemer, Y., Tapponnier, P., Meyer, B., Peltzer, G., Guo, S. M., Chen, Z. T., et al. (1995). partitioning of crustal slip between linked, active faults in the eastern Qilian Shan, and evidence for a major seismic gap, the 'Tianzhu gap', on the western Haiyuan Fault, Gansu (China). Geophys J. Int. 120, 599–645. doi:10.1111/j.1365-246X.1995.tb01842.x
Gu, G. X., Kuo, J. T., Liu, K. R., Zheng, J. H., Lu, H. Y., and Liu, R. F. (1997). Time-continuous gravity changes and the pregnancy and occurrence of earthquakes in beijing-tianjin-tangzhang-zhang regions. Sci. Bull. 42, 1919–1930. doi:10.1360/csb1997-42-18-1919
Guo, P., Han, Z. J., Jiang, W. L., and Mao, Z. B. (2017). Holocene left-lateral slip rate of the Lenglongling fault, northeastern margin of the Tibetan Plateau. Seismol. Geol. 39, 323–341. doi:10.3969/i.issn.0253-4967.2017.02.005
Hao, M., Wang, Q., Shen, Z., Cui, D., Ji, L., Li, Y., et al. (2014). Present day crustal vertical movement inferred from precise leveling data in eastern margin of Tibetan Plateau. Tectonophysics 632, 281–292. doi:10.1016/j.tecto.2014.06.016
He, W. G., Yuan, D. Y., Ge, W. P., and Luo, H. (2010). Determination of the slip rate of the Lenglongling fault in the middle and eastern segments of the Qilian mountain active fault zone. Earthquake 30, 131–137. doi:10.3969/j.issn.1000-3274.2010.01.015
He, X., Zhang, Y., Shen, X., Zheng, W., Zhang, P., and Zhang, D. (2020). Examination of the repeatability of two Ms6.4 Menyuan earthquakes in Qilian-Haiyuan fault zone (NE Tibetan Plateau) based on source parameters. Phys Earth Planet 299, 106408. doi:10.1016/j.pepi.2019.106408
Hu, M. Z., Hao, H. T., Li, H., and Zhu, Y. Q. (2019). Quantitative analysis of gravity changes for earthquake prediction. Earthq. Res. China 35, 417–430.
Kang, S., Ji, L., Zhu, L., Liu, C., Zhang, W., Li, N., et al. (2023). Study of the interseismic deformation and locking depth along the xidatan–Dongdatan segment of the East kunlun Fault Zone, northeast qinghai–tibet plateau, based on sentinel-1 interferometry. Remote Sens-Basel 15, 4666. doi:10.3390/rs15194666
Kuo, J. T., and Sun, Y. (1993). Modeling gravity variations caused by dilatancies. Tectonophysics 227, 127–143. doi:10.1016/0040-1951(93)90091-W
Lasserre, C., Gaudemer, Y., Tapponnier, P., Mériaux, A. S., Van der Woerd, J., Daoyang, Y., et al. (2002). Fast late pleistocene slip rate on the leng long ling segment of the Haiyuan fault, Qinghai, China. J. Geophys. Res. Solid Earth 107. doi:10.1029/2000JB000060
Li, R. H., and Fu, Z. Z. (1987). Local gravity variations before and after the Tangshan earthquake(M=7.8) and the dilatation process. Inland Earthq. 1, 426–434.
Li, Z. M., Tian, Q. J., and Tu, H. W. (2009). Remote sensing characteristics of Lajishan fault. Plateau Earthq. Res. 21, 26–31. doi:10.3969/j.issn.1005-586X.2009.01.004
Li, S., Guo, Z., Yu, Y., Wu, X., and Chen, Y. J. (2022). Imaging the northeastern crustal boundary of the Tibetan plateau with radial anisotropy. Geophys. Res. Lett. 49, e2022GL100672. doi:10.1029/2022gl100672
Ma, J., Liu, L. Q., Liu, P. X., and Ma, S. L. (2007). Thermal precursory pattern of fault unstable sliding: An experimental study of en echelon faults. Chin. J. Geophys. 50, 1141–1149. doi:10.3321/j.issn:0001-5733.2007.04.021
Meng, W., Guo, X. Y., Li, Y. H., Han, L. B., and Zhang, C. Y. (2022). Tectonic stress field and dynamic characteristics in the northeastern margin of the Tibetan Plateau. Chin. J. Geophys. 65, 3229–3251. doi:10.6038/cjg2022P0236
Shen, C. Y., Zhu, Y. Q., Hu, M. Z., Tan, H. B., Hao, H. T., Wei, J., et al. (2020). Time-varying gravity field monitoring and strong earthquake prediction on the Chinese mainland. Earthq. Res. China 36, 729–743. doi:10.3969/j.issn.1001-4683.2020.04.008
Su, R. H., Yuan, D. Y., Zheng, W. J., Guo, W. A., Li, Z. M., Wen, Y. M., et al. (2024). Surface rupture and damage characteristics of the 2023 Ms6.2 Jishishan earthquake, Gansu. Chin. J. Geophys. 67, 3454–3471. doi:10.6038/cjg2024S0090
Sun, H. P. (2004). Time variation of gravity field and geodynamics. Proc. Chin. Acad. Sci. 19, 189–193. doi:10.3969/j.issn.1000-3045.2004.03.008
Tapponnier, P., Zhiqin, X., Roger, F., Meyer, B., Arnaud, N., Wittlinger, G., et al. (2001). Oblique stepwise rise and growth of the Tibet plateau. Science 294, 1671–1677. doi:10.1126/science.105978
Wang, X. S., Fang, J., and Xu, H. Z. (2013). 3D density structure of lithosphere beneath northeastern margin of the Tibetan Plateau. Chin. J. Geophys. 56, 3770–3778. doi:10.6038/cjg20131118
Wang, Q., Niu, F., Gao, Y., and Chen, Y. (2016). Crustal structure and deformation beneath the NE margin of the Tibetan plateau constrained by teleseismic receiver function data. Geophys. J. Int. 204, 167–179. doi:10.1093/gji/ggv420
Wang, X., Li, Y., Ding, Z., Zhu, L., Wang, C., Bao, X., et al. (2017). Three-dimensional lithosphericS wave velocity model of the NE Tibetan Plateau and western North China Craton. J. Geophys. Res. Solid Earth 122, 6703–6720. doi:10.1002/2017JB014203
Wang, Q., Xiao, Z., Wu, Y., Li, S. Y., and Gao, Y. (2022). The deep tectonic background of the M6.9 Menyuan earthquake on January 8, 2022 in Qinghai Province. Acta Seismol. Sin. 44, 211–222. doi:10.11939/jass.20220010
Wang, S. G., Xu, G. Y., Li, S., Yang, T., Shi, L., Zhang, L., et al. (2024). Analysis of earthquake sequence and seismogenic structure of the 2023 Ms6.2 Jishishan earthquake, Gansu Province, China. Acta Seismol. Sin. 46, 953–968. doi:10.11939/jass.20230007
Xu, J. R., Yao, L. X., and Wang, J. (1986). Focal mechanism solution of the Menyuan MS6.4 earthquake and its strong aftershocks on August 26,1986. Northwest. Seismol. J. 8, 82–84.
Xu, X., Yu, G., Klinger, Y., Tapponnier, P., and Van Der Woerd, J. (2006). Reevaluation of surface rupture parameters and faulting segmentation of the 2001 Kunlunshan earthquake (Mw7.8), northern Tibetan Plateau, China. J. Geophys. Res. Solid Earth 111. doi:10.1029/2004JB003488
Yang, H., Wang, D., Guo, R., Xie, M., Zang, Y., Wang, Y., et al. (2022). Rapid report of the 8 january 2022 MS 6.9 menyuan earthquake, Qinghai, China. Earthq. Res. Adv. 2 (1), 100113–104670. doi:10.1016/j.eqrea.2022.100113
Yang, X., Zhu, Y., Zhao, Y., and Wei, S. (2023). Relationship between gravity change and Yangbi MS6.4 earthquake. Geod. Geodyn. 14, 321–330. doi:10.1016/j.geog.2022.11.009
Yi, S., Wang, Q., and Sun, W. (2016). Is it possible that a gravity increase of 20 μGal yr−1in southern Tibet comes from a wide-range density increase? Geophys. Res. Lett. 43, 1481–1486. doi:10.1002/2015GL067509
Yuan, D. Y., Zhang, P. Z., Liu, B. C., Gan, W. J., Mao, F. Y., Wang, Z. C., et al. (2004). Geometrical imagery and tectonic transformation of late Quaternary active tectonics in northeastern margin of Qinghai-Xizang plateau. Acta Geol. Sin. 78, 270–278. doi:10.3321/j.issn:0001-5717.2004.02.017
Yuan, D. Y., Zhang, P. Z., Lei, Z. S., Liu, B. C., and Liu, X. L. (2005). A Preliminary study on the new activity features of the Lajishan mountain fault zone in Qinghai Province. Earthq. Res. China 21, 93–102.
Yuan, D. Y., Ge, W. P., Chen, Z. W., Li, C. Y., Wang, Z. C., Zhang, H. P., et al. (2013). The growth of northeastern Tibet and its relevance to large-scale continental geodynamics: a review of recent studies. Tectonics 32, 1358–1370. doi:10.1002/tect.20081
Yuan, D. Y., Xie, H., Su, R. H., Li, Z. M., Wen, Y. M., Si, G. J., et al. (2023). Characteristics of co-seismic surface rupture zone of Menyuan Ms6. 9 earthquake in Qinghai Province on January 8, 2022 and seismogenic mechanism. Chin. J. Geophys. 66, 229–244. doi:10.6038/cjg2022Q0093
Yue, J. L., He, Z. T., Zhu, Y. Q., Chen, Y. H., Gao, F. C., and Fan, Q. H. (2010). Study of groundwater settlement by absolute gravity measurement. Sci. Surv. Mapp. 35, 18–20.
Zhang, B. (2012). The study of new activities on western segment of northern margin of Western Qinling fault and Lajishan fault, Lanzhou Institute of Seismology, China Earthquake Administration.
Zhang, P. Z., Deng, Q. D., Zhang, G. M., Ma, J., Gan, W. J., Min, W., et al. (2003). Active tectonic blocks and strong earthquakes in the continent of China. Sci. China SeriesD Earth Sci. 33, 13–24. doi:10.1360/03dz0002
Zhao, Y. F., Zhu, Y. Q., Wei, S. C., Liu, F., Liang, W. F., and Sun, H. P. (2023). Dynamic gravity changes before the menyuan, Qinghai Ms6.9 earthquake on january 8, 2022. Chin. J. Geophys. 66, 2337–2351. doi:10.6038/cjg2022Q0220
Zheng, W. J., Yuan, D. Y., and He, W. G. (2004). Characteristics of palaeo-earthquake activity along the active Tianqiaogou-Huangyangchuan Fault on the eastern section of the Qilianshan Mountains. Seismol. Geol. 26, 645–657. doi:10.3969/j.issn.0253-4967.2004.04.011
Zheng, W. J., Min, W., He, W. G., Ren, Z. K., Liu, X. W., Wang, A. G., et al. (2013). Distribution of the related disaster and the causative tectonic of the Minxian-Zhangxian Ms6.6 earthquake on July 22,2013, Gansu, China. Seismol. Geol. 35, 604–615. doi:10.3969/j.issn.0253-4967.2013.03.014
Zheng, W., Zhang, P., He, W., Yuan, D., Shao, Y., Zheng, D., et al. (2013). Transformation of displacement between strike-slip and crustal shortening in the northern margin of the Tibetan Plateau: evidence from decadal GPS measurements and late Quaternary slip rates on faults. Tectonophysics 584, 267–280. doi:10.1016/j.tecto.2012.01.006
Zheng, W. J., Zhang, B. X., Yuan, D. Y., Chen, G., Zhang, Y. P., Yu, J. X., et al. (2021). Tectonic activity in the southern alashan block and the latest boundary of outward expansion on the northeastern Tibetan plateau, China. J. Earth Sci. Environ. 43, 224–236. doi:10.19814/j.jese.2021.01039
Zhu, Y. Q., Liang, W. F., and Xu, Y. M. (2008). Mid-term prediction of the 2008 Wenchuan Ms8.0 earthquake by gravity data. Int. Seism. Dyn. 38, 36–39.
Zhu, Y., Zhan, F. B., Zhou, J., Liang, W., and Xu, Y. (2010). Gravity measurements and their variations before the 2008 wenchuan earthquake. Bull. Seismol. Soc. Am. 100, 2815–2824. doi:10.1785/0120100081
Zhu, Y. Q., Liang, W. F., Zhan, F. B., Liu, F., Xu, Y. M., Guo, S. S., et al. (2012). Study on the dynamic change of gravity field in China continent. Chin. J. Geophys. 55, 804–813. doi:10.6038/j.issn.0001-5733
Zhu, Y. Q., Wen, X. Z., Sun, H. P., Guo, S. S., and Zhao, Y. F. (2013). Gravity changes before the Lushan,Sichuan, Ms=7.0 earthquake of 2013. Chin. J. Geophys. 56, 1887–1894. doi:10.6038/cjg20130611
Zhu, Y. Q., Liu, F., Li, T. M., Zheng, B., and Wang, Q. H. (2015). Dynamic change of the gravity field in Sichuan-Yunnan region and its implications for seismic risk. Chin. J. Geophys. 58, 4187–4196. doi:10.6038/cjg20151125
Zhu, Y. Q., Li, T. M., Hao, M., Liang, W. F., Zhao, Y. F., Xu, Y. M., et al. (2016). Gravity change before the menyuan, Qinghai Ms6.4 earthquake of 2016. Chin. J. Geophys. 59, 3744–3752. doi:10.6038/cjg20161019
Zhu, Y. Q., Liang, W. F., Zhao, Y. F., Liu, F., Wei, S. C., and Xu, Y. M. (2017). Gravity changes before the jinzhaigou, Sichuan,Ms7.0 earthquake of 2017. Chin. J. Geophys. 60, 4124–4131. doi:10.6038/cjg20171037
Zhu, Y. Q., Liu, F., Zhang, G. Q., Zhao, Y. F., and Wei, S. C. (2022). Mobile gravity monitoring and earthquake prediction in China. Geomatics Inf. Sci. Wuhan Univ. 47, 820–829. doi:10.13203/j.whugis20220127
Zhu, Y., Yang, X., Liu, F., Zhao, Y., Wei, S., and Zhang, G. (2023). Progress and prospect of the time-varying gravity in earthquake prediction in the Chinese Mainland. Front. Earth Sc-Switz. 11, 1124573. doi:10.3389/feart.2023.1124573
Keywords: Menyuan earthquake, Jishishan earthquake, gravity change, northeast Tibetan plateau, tectonic activity
Citation: Yang X, Zhao Y, Wei S, Zhu Y, Liang C, Kang S and Lv H (2025) Regional gravity field changes before and after the Menyuan MS 6.9 earthquake in 2022 and the Jishishan MS 6.2 earthquake in 2023. Front. Earth Sci. 13:1652667. doi: 10.3389/feart.2025.1652667
Received: 24 June 2025; Accepted: 23 September 2025;
Published: 10 October 2025.
Edited by:
Giovanni Martinelli, National Institute of Geophysics and Volcanology, ItalyReviewed by:
Ameha Atnafu Muluneh, University of Bremen, GermanyCarlos Frajuca, Federal University of Rio Grande, Brazil
Liu Lei, China Earthquake Administration, China
Copyright © 2025 Yang, Zhao, Wei, Zhu, Liang, Kang and Lv. This is an open-access article distributed under the terms of the Creative Commons Attribution License (CC BY). The use, distribution or reproduction in other forums is permitted, provided the original author(s) and the copyright owner(s) are credited and that the original publication in this journal is cited, in accordance with accepted academic practice. No use, distribution or reproduction is permitted which does not comply with these terms.
*Correspondence: Yunfeng Zhao, eGlueGlhbmdpQDE2My5jb20=