 Jianbo Xu1
 Juntao Fang2Ping Jiang1Aiguo Han1Cheng Jiang1Qinghui Sun1Jianjun Song1Hang Lin1Ruowei Ren1
 Changqun Zuo2*
- 1China First Metallurgical Group Co., Ltd., Wuhan, China
- 2Faculty of Engineering, China University of Geosciences, Wuhan, China
Taking the Xianfeng Tunnel in Luzhai county, Guangxi province as the engineering background, this study aims to investigate the influence of different construction parameters on the stress and deformation of lining structures under creep effects, and also reveal the load-sharing ratios of composite lining structures under varying initial support stiffness conditions and the temporal evolution patterns and transfer mechanisms of surrounding rock pressure by using field monitoring and numerical simulation methods. The findings of this research are as follows: (1) Both monitoring data and simulation analyses demonstrate that the Cvisc constitutive model effectively describes the creep behavior of the surrounding rock in the engineering area; (2) Construction parameters have a significant impact on the stress of the primary lining, the earlier application of the secondary lining leading to greater structural stress; (3) With the increase of the elastic modulus of the primary lining, the load-sharing ratio of the secondary lining decreases, while the ultimate pressure borne by the secondary lining remains relatively stable; (4) Considering the time-dependent effects of creep behavior, when the secondary support is installed before the yield phase of initial structure, the pressure on each part of the lining structure is distributed according to the stiffness of each structure; subsequently, as the initial support enters the yield phase, the load it bears transferred to the secondary lining structure. These research findings can provide theoretical guidance for the design of support structures and construction parameters in soft rock tunnels.
1 Introduction
Over the past two decades, China has witnessed remarkable advancements in tunnel construction, evolving into a global leader characterized by the world’s largest tunnel network, the most complex geological conditions, diverse structural configurations, and unprecedented technological development rates (Editorial Office of China Journal of Highway and Transport, 2022). This rapid expansion, particularly in western regions, where soft rock strata are extensively distributed, the construction of tunnels often necessitates addressing a series of issues such as large deformations and support instability caused by the soft rock. Specifically, in tunnel engineering, the creep behavior of soft rock (Shi, 2020; Yang et al., 2023a; Guo et al., 2023) is a critical factor contributing to instability during tunnel construction. Consequently, the design of tunnel structures must not only ensure the stability of the surrounding rock during excavation but also resist the additional forces induced by long-term creep of the surrounding rock during tunnel construction (Li and Zhang, 2011; Sung et al., 2004). The Composite lining structure is currently the most common support form in tunnel engineering. However, for soft rock-soil layers with significant creep behavior, unreasonable lining structure parameters may lead to excessive deformation-induced pressure and subsequent damage, adversely affecting the long-term stability of the tunnel (Gu et al., 2018; Huang, 2018a; Li, and Zhang, 2011; Liu et al., 2022). Therefore, revealing the mechanical mechanism and load transfer mechanism of composite linings under soft rock creep is of great significance for optimizing structural design parameters and ensuring the safety and stability of tunnels.
Currently, research on the support mechanisms of tunnel lining structures considering creep is primarily conducted through model development, numerical simulation, and field measurements (Shen et al., 2016; Lan et al., 2024; Yang et al., 2023b; Song, 2016). Huang et al. (Gu et al., 2018; Huang, 2018b) (2018) established a mechanical model by introducing the concept of reinforced surrounding rock mass, and analyzed the variation patterns of the secondary lining stress under different initial support strengths during the creep process of tunnel surrounding rock, and obtained the load-sharing ratio of the secondary lining during the creep of surrounding rock. Tang et al. (2014) simulated the creep deformation in the viscoelastic region using the Burgers creep mechanical model and demonstrated that even when the red sandstone section of the surrounding rock exhibits weakened fragmentation and plastic flow deformation, it still retains the ability to share loads. Wang et al. (2010) establishes a computational model utilizing the finite element program ANSYS to analyze the stress distribution patterns of the composite lining with varying stiffness of the secondary lining. It was concluded that as the stiffness of the secondary lining increases, the surrounding rock pressure it bears also increases, while the surrounding rock pressure borne by the initial support decreases to a certain extent. Lu (2021) conducted a numerical simulation on the excavation and support process of the tunnel using FLAC3D. By further considering the creep effect of the surrounding rock, the variation pattern of the load-sharing ratio between the tunnel initial support and the secondary lining with small net spacing over time was explored. The results were mutually verified with the field monitoring results. Zhou et al. (2023) analyzed the load-sharing characteristics of the support structure through field measurements and concluded that the load increases with the damage development of the surrounding rock, which is the intrinsic factor leading to the loading increase. Furthermore, recent studies have expanded to special loading conditions: Joel (2024) systematically reviewed seismic behavior effects on soft rock tunnels under high ground stress, highlighting the compounded challenges of creep-seismic interactions.
These studies have significantly advanced our understanding of the impact of creep effects on tunnel linings, particularly concerning the load sharing ratio under specific conditions. It is noteworthy that existing research predominantly concentrates on the load sharing ratio of surrounding rock pressure under creep conditions. Although previous studies have provided important references for understanding the load-sharing mechanism of the surrounding rock pressure, they often treat key factors in isolation. Specifically, existing studies, including the present research, have recognized the critical role of creep in soft rock tunnel stability and the importance of quantifying load sharing between primary support and secondary lining. However, previous studies have typically focused either on the influence of primary support strength or stiffness, or on the temporal evolution of loads, or employed constitutive models that may fail to adequately capture the critical accelerated creep stage of soft rock. Critically, the interactive effects of key construction timing decisions (particularly the installation timing of secondary lining) and primary support stiffness on dynamic load transfer and stress evolution within composite lining structure systems under complete creep behavior remain inadequately explored and quantified. Additionally, a clear mechanistic understanding of how and when loads transfer between lining components when the primary support yields under sustained creep pressure remains lacking.
Therefore, our study aims to bridge this gap by: (1) adopting the Cvisc constitutive model in FLAC3D, which explicitly couples viscoelastic (Burgers) and plastic (Mohr-Coulomb) responses to more realistically simulate the complete creep process observed in soft mudstone; (2) systematically investigating the combined effects of two critical, practically controllable parameters - secondary lining installation timing and primary support elastic modulus (stiffness) - on stress distribution and load sharing ratio evolution within composite lining structure; and (3) elucidating the underlying load transfer mechanism between primary support and secondary lining, with particular focus on the critical transition triggered by primary support yielding.
However, addressing these issues presents significant challenges: (1) Accurately characterizing the complex time-dependent, viscoelastoplastic creep behavior of silty mudstone requires sophisticated constitutive models and precise parameter calibration, which inherently poses difficulties due to material heterogeneity and scale effects. (2) Capturing the complex interaction and load transfer between the surrounding rock, primary support, and secondary lining over extended periods demands robust, fully-coupled numerical models capable of simulating sequential construction, material yielding, and long-term creep. (3) Quantifying in-situ stresses and contact pressures within the lining system through field monitoring is technically demanding, with uncertainties related to sensor installation, long-term reliability, and spatial variability of rock mass properties. (4) Determining the optimal timing for secondary lining installation involves balancing risks of premature loading (leading to high stresses) versus delayed installation (risking excessive deformation or primary support failure before the secondary lining becomes effective). (5) Optimizing primary support stiffness requires trade-offs: higher stiffness may initially reduce load sharing by the secondary lining but increase total surrounding rock pressure and costs; lower stiffness could lead to earlier yielding and accelerated load transfer.
In view of this, relying on the Xianfeng Tunnel in Luzhai, Guangxi, and based on engineering field monitoring data, this paper adopts the Cvisc creep constitutive model in the FLAC3D finite difference software as the constitutive model for simulating tunnel surrounding rock mass. It comparatively analyzes the impact of creep effects on tunnel lining stress patterns. Furthermore, this study investigates the influence of varying secondary lining installation timing and varying primary support stiffness on lining stress distribution. It analyzes the variation patterns of secondary lining load sharing ratio under different primary support stiffness conditions. Finally, based on the comprehensive analysis of monitoring and simulation results, this paper elucidates the load sharing mechanism of support structures and the pressure transfer mechanism within the surrounding rock mass.
2 Materials and methods
2.1 Engineering overview
The Xianfeng Tunnel is a separated twin-tube tunnel with a two-way four-lane configuration, exhibiting a total length of 889 m and a maximum overburden depth of 117 m. The tunnel cross-section features a horizontal span of 13.88 m and a vertical height of 10.83 m, with a clear spacing of 22 m between the left and right boreholes. Geologically, the surrounding rock predominantly consists of moderately weathered silty mudstone characterized by well-developed jointing and low strength, with an average uniaxial compressive strength of 18 MPa which was determined by uniaxial compression test. The surrounding rock is classified as Grade V according to Chinese standards. The tunnel alignment presents longitudinal gradients ranging from 1.7% to −1.7%. A schematic geological longitudinal profile is illustrated in Figure 1.
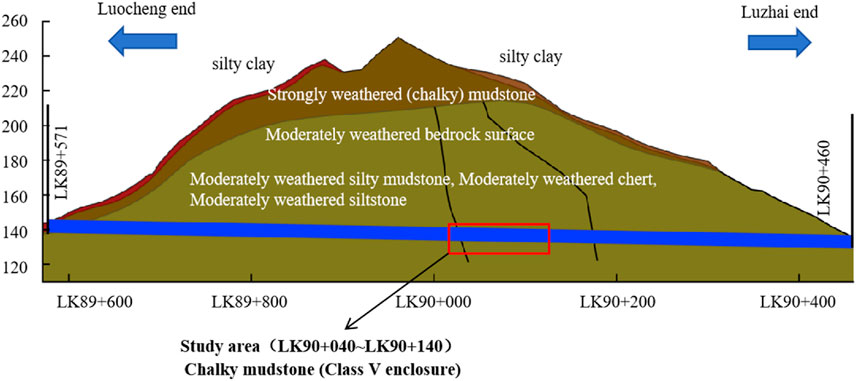
Figure 1. Geological profile.
2.2 Tunnel excavation and support program
The tunnel cross-section was excavated using the short bench method with core soil retention, maintaining a total bench length of 8–15 m and ensuring the core soil area constituted less than 50% of the upper bench cross-sectional area. The excavation sequence is illustrated in Figure 2.
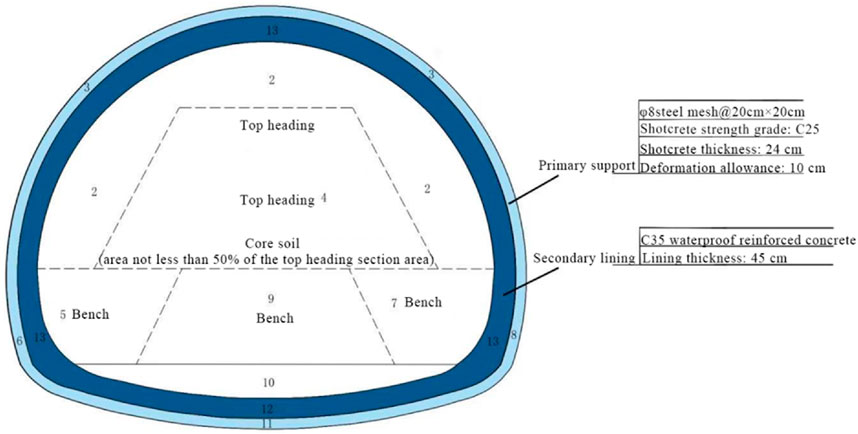
Figure 2. Tunnel excavation process diagram.
The tunnel employs a composite lining structure. The primary support utilizes shotcrete-bolt support as the main load-bearing component, bearing most of the rock mass loading during the construction period. The secondary lining bears a small amount of load, serving as a safety reserve to ensure the long-term safety of the tunnel.
2.3 Research methodology
This study focuses on the Xianfeng tunnel project and analyzes the variation patterns of the surrounding rock pressure and secondary lining stress by field monitoring was initially employed to. The influence of construction parameters, including the timing of secondary lining installation and support stiffness, on the lining stress response under creep effects was investigated through numerical simulation analysis employing the Cvisc creep constitutive model within the finite difference software FLAC3D. The integrated analysis of field data and numerical simulations reveals the load-sharing mechanism of the support structure and the transfer mechanism of the surrounding rock pressure. The technical route is shown in Figure 3.
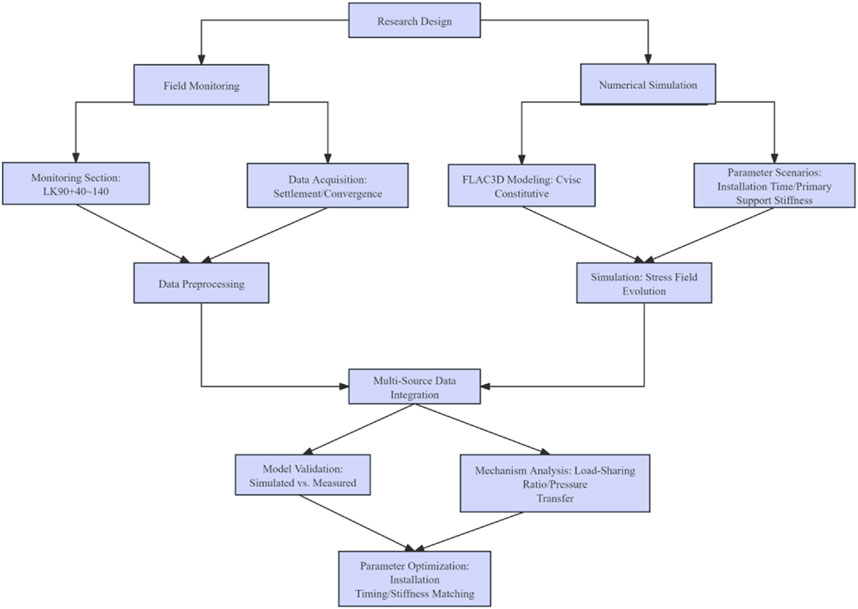
Figure 3. The technical route roadmap.
3 Field monitoring and results
3.1 Monitoring program layout
To prevent the occurrence of tunnel deformation and failure, and reveal the response patterns of the tunnel support structure, the tunnel entrance section from LK90 + 040 to LK90 + 140 was selected for monitoring. The specific monitoring parameters included the vault settlement, horizontal convergence of the primary support, contact pressure between the surrounding rock and the primary support, and contact pressure between the primary support and the secondary lining. The detailed monitoring scheme is shown in Figure 4. The longitudinal spacing between monitoring sections was 10 m, and 5 monitoring sections were arranged. Each section had 5 monitoring points for the vault and surrounding convergence, totaling 25 points. Each section also had 10 monitoring points for the pressure of the primary support and secondary lining, totaling 50 points. The monitoring equipment of vault settlement was an automatic leveling total station with a reflector (type: JT-22, 0.1 mm with measurement accuracy, and the horizontal convergence monitoring instrument used was a digital display convergence meter (type: JSS30A, 0.1 mm with measurement accuracy). Earth pressure cells were installed between the surrounding rock and the first layer of primary support to monitor the contact pressure between them, and between the secondary layer of primary support and the secondary lining to monitor the contact pressure.
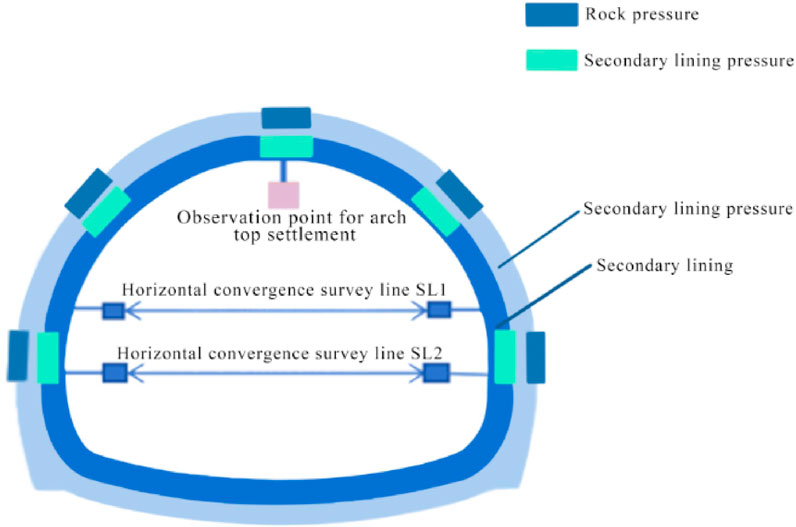
Figure 4. Layout of primary and secondary lining monitoring points in Xianfeng Tunnel.
Real-time monitoring of the contact pressure between the primary support and secondary lining was conducted using SN-ZX-TY type earth pressure cells (as shown in Figure 5). These pressure cells, combined with vibrating wire sensor collectors, can effectively measure the contact pressure in geotechnical engineering. The pressure cells between the surrounding rock and the primary support were installed before shotcrete construction, while those between the primary support and secondary lining were installed before the waterproof board. The pressure cells were directly tied to the secondary lining reinforcement, and since they were in direct contact with the waterproof board at this time, it can be assumed that the measured values of the pressure cells could approximately reflect the contact pressure between the primary support and secondary lining, as shown in Figure 6.
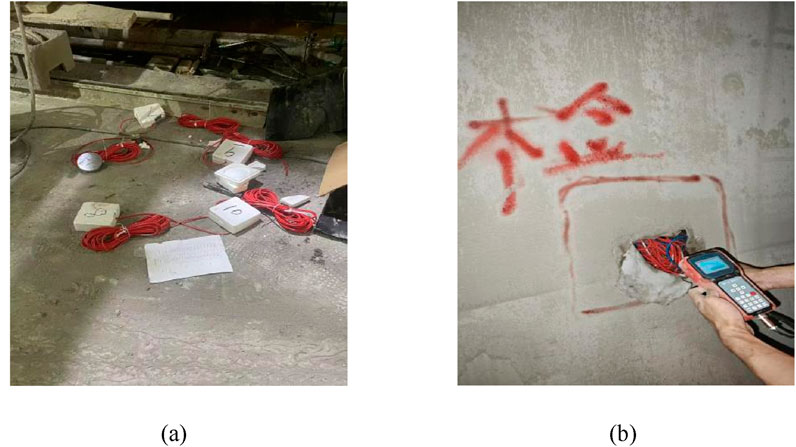
Figure 5. Field monitoring. (a) Pre-embedding of earth pressure cells. (b) Earth pressure cell.
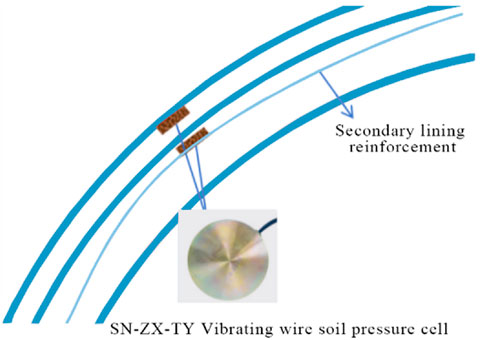
Figure 6. Schematic diagram of the earth pressure cell.
3.2 Analysis of monitoring results
3.2.1 Vault settlement and horizontal convergence
Taking the LK89 + 073 section as an example, the fitted curves of tunnel deformation time-history and deformation rates are shown in Figure 7. As shown in Figure 7, the vertical displacement of the tunnel increased sharply during the initial monitoring phase, followed by a gradual rise over time. The maximum convergence rate reached about 0.7 mm/d. After approximately 17 days of construction, the tunnel deformation rate stabilized, with a steady deformation rate of 0.1 mm/d. The vertical settlement of the tunnel was generally greater than the horizontal convergence, primarily due to the surrounding rock consisting of weak and compressible mudstone with a thin-layered structure, where vertical mechanical properties are significantly inferior to those in the horizontal direction. The vertical in-situ stress dominates, and combined with the shallow burial depth, minor tectonic activity, the gravity-induced stress exceeds the horizontal stress. The horizontal convergence of the upper bench increased steeply. After 18 days of construction, the tunnel’s horizontal convergence rate stabilized, and the fitted curve flattened, indicating a relatively stable convergence rate. The lower bench exhibited the minimum convergence. After approximately 8 days of construction at the monitoring section, the tunnel deformation rate stabilized, with a stable deformation rate of 0.1 mm/d.
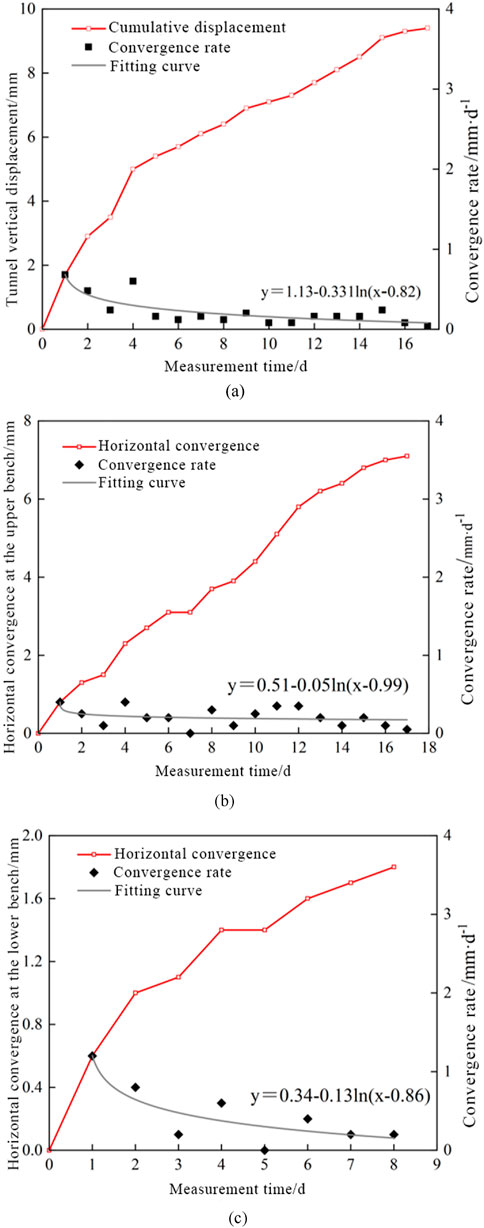
Figure 7. Deformation curves of the typical monitoring section. (a) LK89 + 073 crown displacement. (b) LK89 + 073 upper horizontal convergence. (c) LK89 + 073 lower horizontal convergence.
3.2.2 Surrounding rock-secondary lining contact pressure
Figure 8a illustrates the monitoring results of surrounding rock pressure, demonstrating a characteristic pressure distribution pattern: sidewall pressure > haunch pressure > vault pressure. The surrounding rock pressure undergoes an initial rapid increase, followed by a decrease, then a slow rebound, before eventually stabilizing (Fang et al., 2011). Specifically, the majority of monitoring points recorded a significant increase in surrounding rock pressure during the first 16 days, with the average growth rate reaching 52.8 kPa/d during the primary support phase. After reaching 16 days, the average surrounding rock pressure increased to approximately 841 kPa. Consequently, the pressure developed within this initial period accounts for 60%–70% of the total ultimate pressure. Therefore, the early-stage pressure response critically determines the overall loading characteristics of the surrounding rock mass.
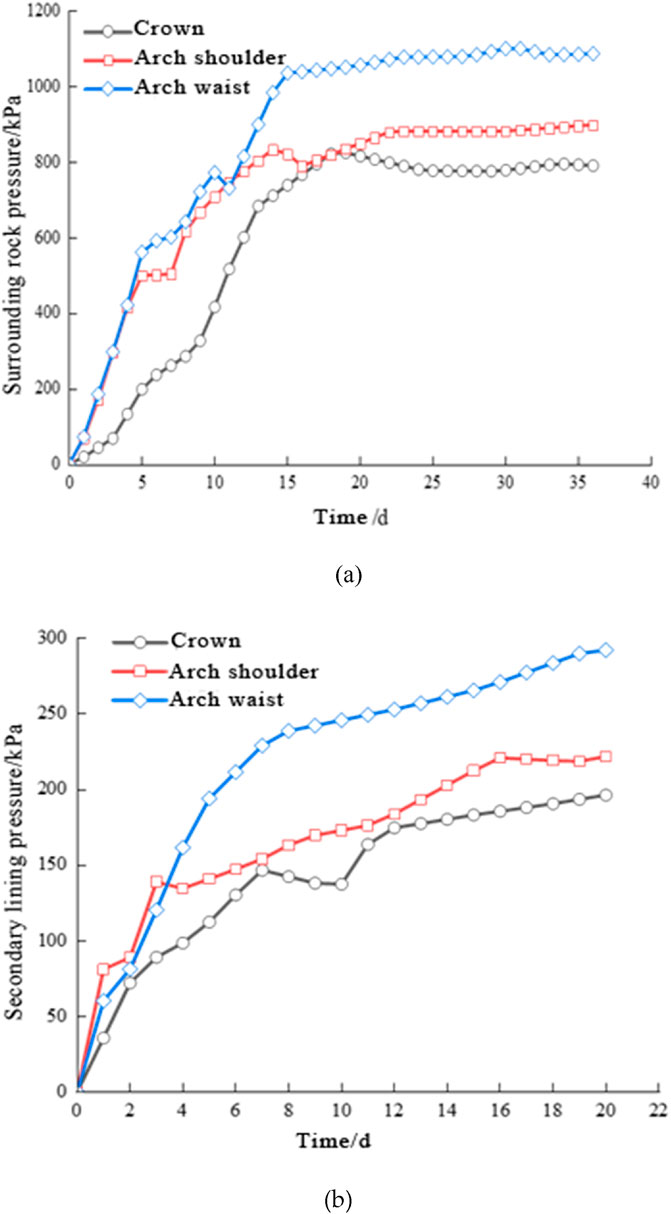
Figure 8. Time-dependent curve of lining pressure. (a) Surrounding rock pressure. (b) Secondary lining pressure.
As shown in Figure 8b, the secondary lining pressure exhibits a temporal evolution characterized by an initial rapid increase, followed by a decrease, then a subsequent re-increase, and finally stabilization. Moreover, the contact pressure distribution follows the pattern: crown pressure > arch shoulder pressure > arch waist pressure, and there are localized differences, while the tunnel geometry provides the fundamental structural framework, the significant variations observed in monitoring data primarily stem from rock mass quality. Specifically, its low strength and heterogeneous characteristics induced by well-developed joints. This constitutes the root cause of localized pressure anomalies (e.g., at the arch shoulder). Specifically, following the completion of secondary lining construction, the progressive increase in concrete strength and stiffness, showing an approximate growth rate of 4 kPa/day, reached an average value of 176.7 kPa. However, the gradual release of surrounding rock stress and redistribution of structural loading triggered a decrease in contact pressure between the support systems. The measured final stabilized contact pressure was approximately 236.9 kPa, with localized values of 196.5 kPa (Crown), 221.9 kPa (Arch shoulder), and 292.3 kPa (Arch waist), respectively. Therefore, the dynamic interaction between support stiffening and stress redistribution fundamentally governed the evolution of contact pressure profiles.
4 Numerical simulation of lining stress distribution considering creep effect
4.1 Selection of creep constitutive model
To better characterize the creep behavior of different rock masses, researchers worldwide have established classical creep models (e.g., Maxwell model, Kelvin model, and Burgers model) through series-parallel combinations of three fundamental mechanical elements: Hookean elastic body, St. Venant plastic body, and Newtonian viscous body. Some existing research has demonstrated that Silty mudstone specimens exhibit significant viscoelastic-plastic behavior under uniaxial and triaxial compression creep tests (Fu et al., 2024). The Burgers creep constitutive model is composed of Maxwell and Kelvin models, while the Cvisc creep constitutive model integrates Burgers and Mohr-Coulomb plastic elements. In Figure 9, the Maxwell element can simulate the instantaneous and steady-state creep phases, the Kelvin element can capture the decelerating creep phase, and the Mohr-Coulomb element accounts for the accelerating creep phase. The Cvisc creep constitutive model combines three creep mechanisms enabling relatively accurate description of creep behavior of tunnel surrounding rocks under varying stress conditions. Accelerated creep behavior of silty mudstone (Figure 9) requires simultaneous modeling of viscoelastic (Burgers) and plastic (Mohr-Coulomb) responses. Which is one of few that fully couples all three creep stages. Unlike classical Burgers, the Cvisc creep constitutive accounts for rock yield, critical for soft rock tunnels. Therefore, this study adopts the Cvisc creep constitutive model as the constitutive model for tunnel surrounding rock.
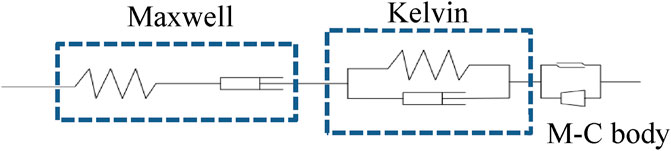
Figure 9. Cvisc model combination.
When σ < σs, the creep equation of the Cvisc model under a one-dimensional stress state is:
Where σs is the yield stress of the rock, EM and EK are the elastic modulus of the elastic elements in the Maxwell and Kelvin models, respectively. ηM and ηK are the viscosity coefficients of the viscous elements in the Maxwell and Kelvin models, respectively.
When σ > σs, the creep constitutive equation is:
Where ƐM-C is the plastic strain of Mohr-Coulomb, and its plastic behavior conforms to the Mohr-Coulomb criterion.
4.2 Numerical model establishment
A three-dimensional numerical model was established using the finite difference software FLAC3D to simulate the excavation process. The average buried depth of this tunnel is 81 m, with the surrounding rock classified as Grade V. The tunnel has a horizontal span of 13.88 m and a vertical height of 10.83 m, and the numerical model is illustrated in Figure 10. To minimize the “boundary effect,” the numerical model was established with 100 m × 90 m×90 m dimensions. The model’s base and lateral boundaries were subjected to displacement constraints, and equivalent stresses were applied to the model boundaries based on the in situ measured geostress. The advanced and surrounding rock bolts were simulated using Cable elements. The mechanical parameters of the surrounding rock and support structures were obtained through laboratory tests and geological survey reports (parameters are listed in Table 1).
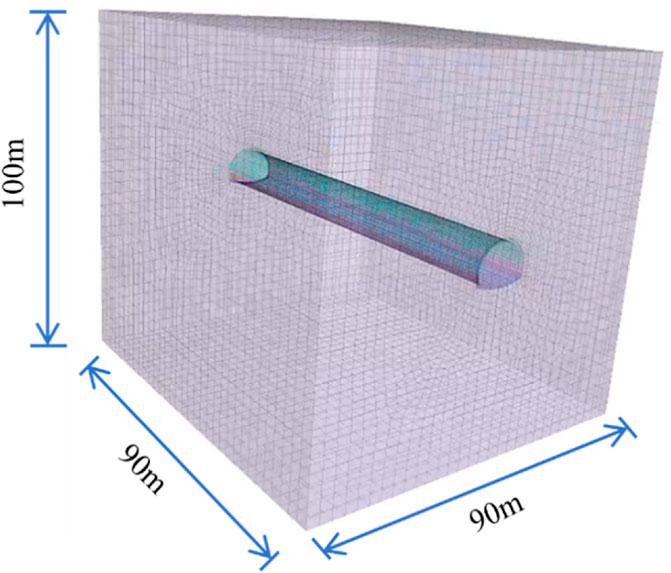
Figure 10. Numerical calculation model.
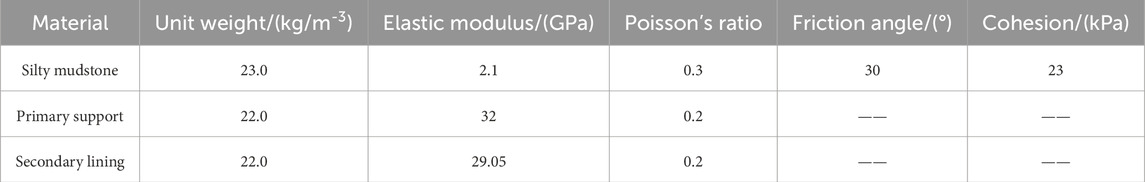
Table 1. Mechanical parameters of the surrounding rock and supporting structure.
In this simulation, two surrounding rock conditions, namely, “elastoplastic” and “visco-elastoplastic”, were considered. The elastoplastic condition adopted the Mohr-Coulomb constitutive model (parameters listed in Table 2), while the visco-elastoplastic condition employed the Cvisc constitutive model (parameters as listed in Table 3), the constitutive model parameters for both working conditions were calibrated through a trial-and-error approach.

Table 2. Parameters of the Mohr-Coulomb model.
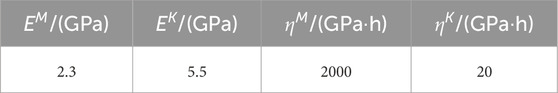
Table 3. Parameters of the Cvisc model.
4.3 Computation scenario design
To investigate the influence of creep characteristics of silty mudstone on tunnel mechanical behavior, the tunnel surrounding rock was assigned the Cvisc creep constitutive model and the Mohr-Coulomb constitutive model, respectively. Three-dimensional numerical analysis was conducted on the study section of Xianfeng Tunnel based on actual engineering conditions. Given that the tunnel traverses mudstone-dominated strata characterized by low strength and susceptibility to water softening, excessively long advance lengths risk prolonged face exposure. This increases the potential for face collapse or roof failure due to stress redistribution and groundwater effects. Consequently, the cyclic excavation advance was set at 1.5 m and the excavation speed during creep calculation was 3 m/d. The reserved core soil excavation method was adopted for the section. When excavating to the monitoring cross-section LK90 + 073, the surrounding rock pressures at the crown and arch waist of this section were recorded. The inverted arch excavation was completed 6 days later, followed by the closure of the initial support. Furthermore, the synchronized advancement of the secondary lining was initiated 16 days after excavation, and simultaneously, the pressures at the vault and spandrel of the secondary lining were recorded. It is worth mentioning that the parameter settings in the elastoplastic calculation process were the same as those in the creep calculation, and the specific construction procedures are shown in Figure 11.
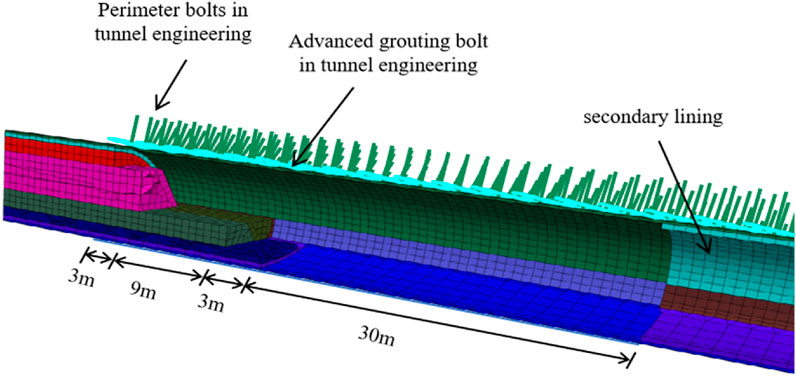
Figure 11. Schematic diagram of tunnel excavation construction sequence.
This study also conducted a computational analysis of the stress characteristics of tunnel linings under varying stiffness of initial support and at different time points of secondary lining construction.
4.4 Comparison and analysis of calculation results
4.4.1 Lining stress
The numerical results of the surrounding rock pressure at the lining crown under the two models were compared with the field measurement data, as shown in Figure 12. It can be observed from the figure that the growth pattern obtained by the Cvisc constitutive model is consistent with that of the field-measured data. The pressure rapidly increases after tunnel excavation, followed by a sharp decrease in the growth rate until it enters a constant growth phase. In the early stage of pressure growth, the numerical solution is larger than the measured value, which is mainly because numerical calculations cannot measure the stress release during the period from excavation to the installation of the support structure. On the 16th day and the 36th day, the differences between the measured values and the numerical solutions at the vault surrounding rock pressure are 44.63 kPa and 11.48 kPa under the Cvisc model, respectively. In contrast, under the Mohr-Coulomb model, these differences are significantly larger, being 365.77 kPa and 381.2 kPa, respectively. These findings indicate that the Cvisc creep constitutive model can better reflect the creep characteristics of the silty mudstone of this tunnel project, and thus can serve as a reliable basis for subsequent lining loading analysis.
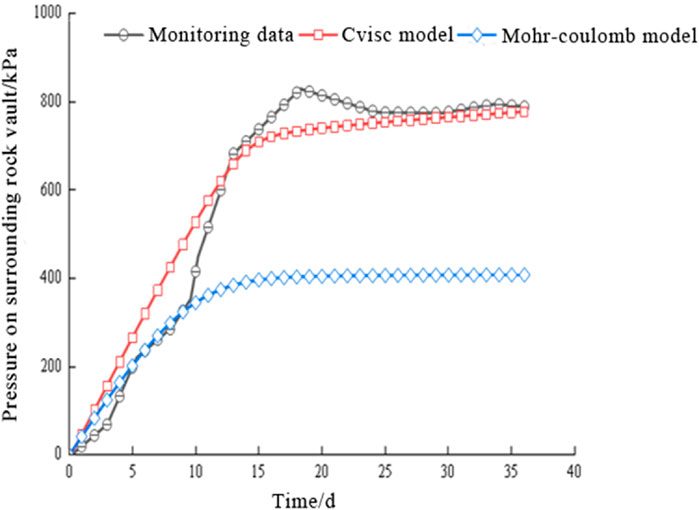
Figure 12. Comparison between numerical simulation and field monitoring.
4.4.2 Influence of different construction parameters on lining stress
4.4.2.1 Influence of timing on secondary lining construction
The vault pressure of the secondary lining under different construction timings is shown in Figure 13. The pressure variation trend of secondary lining under different construction timings remains generally consistent, all undergoing three characteristic stages: accelerated growth, decelerated growth, and constant-rate growth phases. The earlier the secondary lining is installed, the greater the growth rate of the vault pressure during the acceleration phase. This is attributed to the rapid initial growth of surrounding rock pressure, where premature secondary lining installation causes partial load transfer from the primary support system to the secondary lining. Furthermore, the earlier the secondary lining is installed, the greater its ultimate force, with measured final pressures of 291.8 kPa and 165.4 kPa for the secondary lining installed at 8 days and 24 days, respectively.
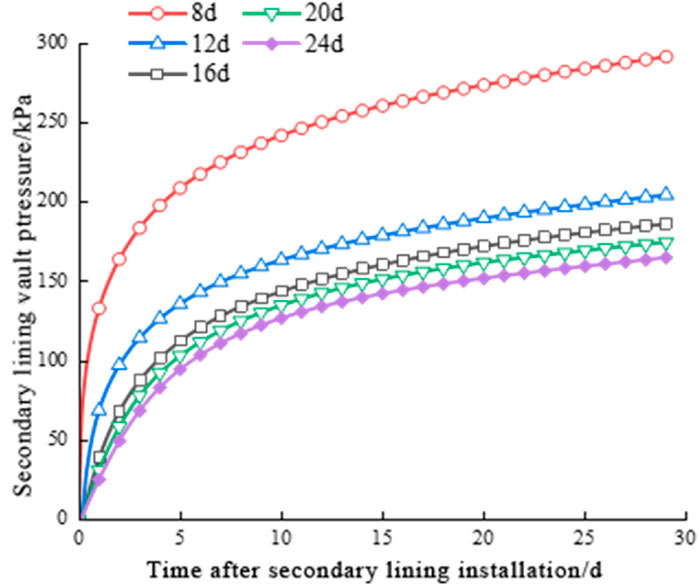
Figure 13. Variation curve of vault pressure under different secondary lining applications.
4.4.2.2 Influence of primary support stiffness
When the construction timing of the secondary lining is constant and the elastic modulus of the primary support is varied, the variation curve of the vault pressure of the secondary lining when it is installed on the 12th day is obtained, as shown in Figure 14. The variation trends of the secondary lining pressure under different primary support stiffness are generally consistent. As the elastic modulus of the primary support increases, the final pressure of the secondary lining does not change significantly. When the stiffness of the primary support increases from 27 GPa to 37 GPa, the final vault pressure of the secondary lining decreases from 210.5 kPa to 194.1 kPa, a reduction of only 7.8%. In practical engineering, increasing the stiffness of the primary support is associated with higher costs. Therefore, it is not feasible to reduce the loading on the secondary lining by increasing the stiffness of the primary support.
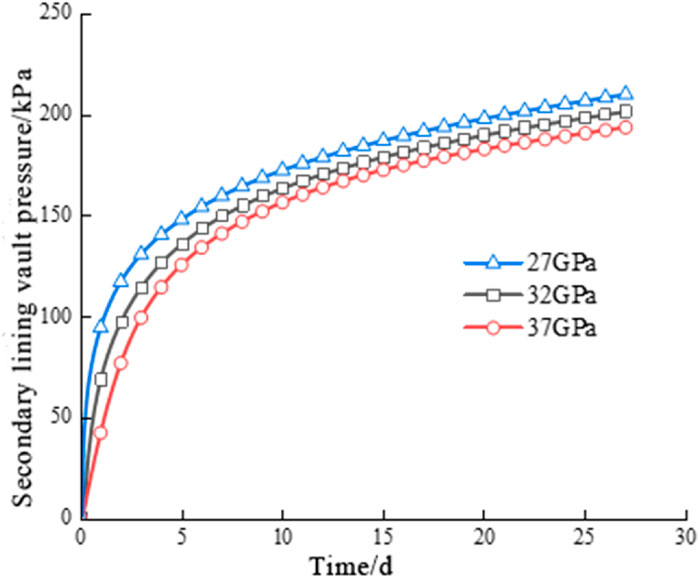
Figure 14. Variation curve of vault loading on secondary lining under different modulus ratios.
The vault pressure sharing ratio of the secondary lining under varying elastic modulus ratios between primary and secondary supports is systematically summarized in Table 4. Since the elastic constitutive model is adopted for the supporting structure in the numerical model, the material does not yield, and the surrounding rock pressure is distributed according to the stiffness of each supporting structure. although increasing the elastic modulus of the primary support can reduce the sharing ratio of the secondary lining to a certain extent, it will also restrict the deformation of the surrounding rock, leading to an increase in the surrounding rock pressure. Therefore, the final pressure value of the secondary lining does not change significantly.
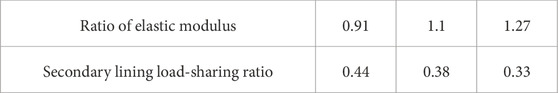
Table 4. Final pressure sharing ratio of the secondary lining under varying elastic modulus ratios.
5 Discussion
5.1 Findings and comparative research
This study systematically reveals the pressure transfer mechanism of surrounding rock and the load-sharing pattern of support structures in soft rock tunnel composite lining structure under creep effects. Core findings demonstrate: (1) both monitoring data and simulation analyses demonstrate that the Cvisc constitutive model effectively describes the creep behavior of the surrounding rock in the engineering area; (2) construction parameters have a significant impact on the stress of the primary lining, the earlier application of the secondary lining leading to greater structural stress; (3) With the increase of the elastic modulus of the primary lining, the load-sharing ratio of the secondary lining decreases, while the ultimate pressure borne by the secondary lining remains relatively stable; (4) Considering the time-dependent effects of creep behavior, when the secondary support is installed before the yield phase of initial structure, the pressure on each part of the lining structure is distributed according to the stiffness of each structure; subsequently, as the initial support enters the yield phase, the load it bears transferred to the secondary lining structure.
Compared to existing studies, this work achieves three breakthroughs: (1) at the model level, resolving the heterogeneity defects in Huang (2018b) loess model and Tang et al. (2014) sandstone model through Cvisc coupling; (2) at the mechanism level, quantifying the yield threshold (177 kPa) in Wang et al.'s (Wang et al., 2010) stiffness theory for the first time; (3) at the practical level, cross-validating with Lu and Zhou et al.'s (Lu, 2021; Zhou et al., 2023) field monitoring.
5.2 Implication and explanation of findings
According to the supporting principle of composite lining, the surrounding rock pressure should be borne jointly by the primary support and the secondary lining. The pressure borne by the primary support can be obtained by subtracting the contact pressure of the secondary lining from the surrounding rock pressure. Therefore, by processing the pressure monitoring data of the LK90 + 073 section, the evolution characteristic curves of the average surrounding rock pressure, the average primary support pressure, and the average secondary lining pressure can be obtained, as shown in Figure 15. The primary support pressure shifted from rapid increase to rapid decrease after Day 16 (post-secondary lining installation), declining from 863.86 kPa at Day 16–686.87 kPa by Day 36, marking the commencement of the coordinated bearing phase in the support system. However, the surrounding rock pressure continues to increase, and part of the pressure originally acting on the primary support is transferred to the secondary lining. Therefore, beyond Day 16, the pressure borne by the secondary lining will consist of two parts: one component is the transferred load from the primary support, while the other represents the incremental surrounding rock pressure. The former can be obtained by subtracting the increment of the surrounding rock pressure from the secondary lining pressure. As can be seen from the figure, by the 36th day, as the primary support gradually yields, the pressure transmitted from the primary support to the secondary lining increases from 0 kPa to 177 kPa.
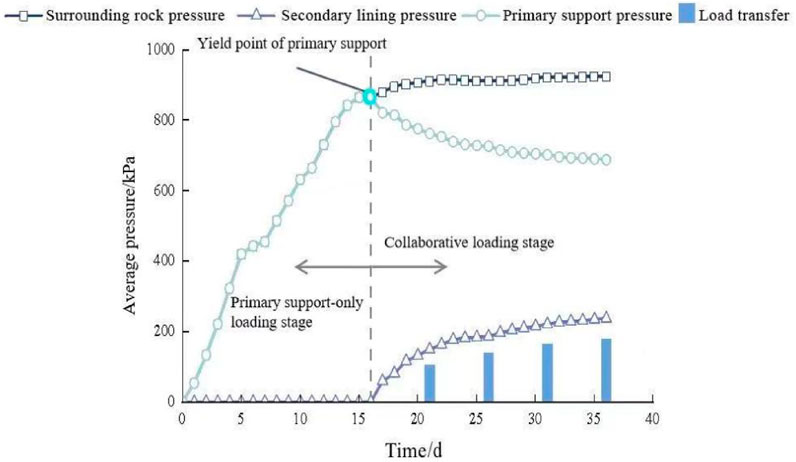
Figure 15. Evolution law of average pressure between composite lining.
As shown in Figure 16, the secondary lining sharing ratio gradually increases at an average rate of 0.013/d, rising by 0.25 between Day 20 and Day 32, while the primary support sharing ratio decreases from 1.0 to 0.75 correspondingly. Beyond Day 16, the pressure-sharing ratio stabilizes, with the primary support still serving as the main load-bearing structure, bearing approximately 74% of the surrounding rock pressure. When the stress on each component of the support structure has not reached the yield strength, the surrounding rock pressure will be distributed according to the stiffness of each component, as shown in Table 3. Conversely, once a structural unit begins to yield, part of the pressure it bears will transfer to other non-yielding components. If the yield strength of the primary support is low and the surrounding rock pressure is sufficient, the secondary lining may serve as the main support structure to bear the subsequent surrounding rock pressure.
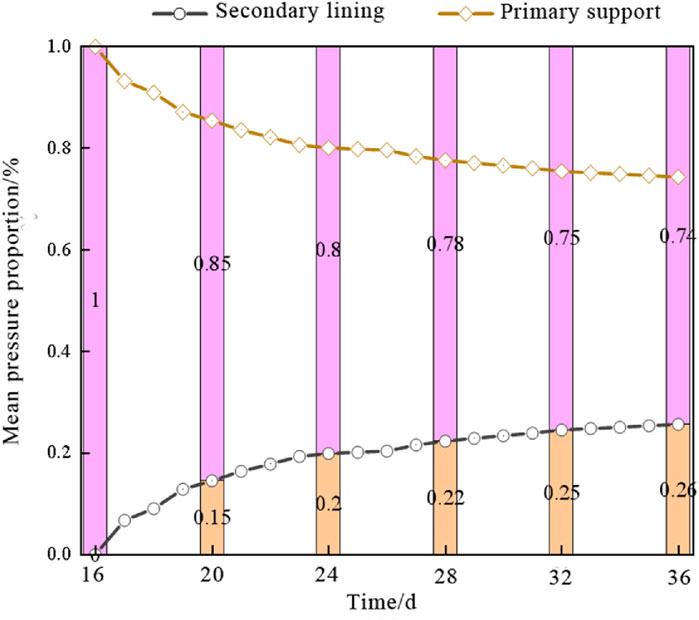
Figure 16. Average pressure sharing ratio between composite lining.
Based on the above research on the stress states of various support components and the law of loading distribution, the surrounding rock pressure transfer mechanism can be divided into the following three scenarios (Figure 17):
1. Both the primary support and secondary lining remained in the elastic state without yielding, and the surrounding rock pressure is distributed according to the stiffness ratio of each support structure. In this case, the primary support generally serves as the main load-bearing structure, as shown in Figure (a).
2. The primary support reaches the yield state, and part of the load on the primary support is transferred to the secondary lining. If the primary support is regarded as an ideal elastic-plastic component, at this stage, the incremental surrounding rock pressure is entirely assumed by the secondary lining, as shown in Figure (b).
3. If the surrounding rock pressure continues to increase and the secondary lining’s strength or stiffness is insufficient, cracks of the secondary lining is prone to occur, as shown in Figure (c).
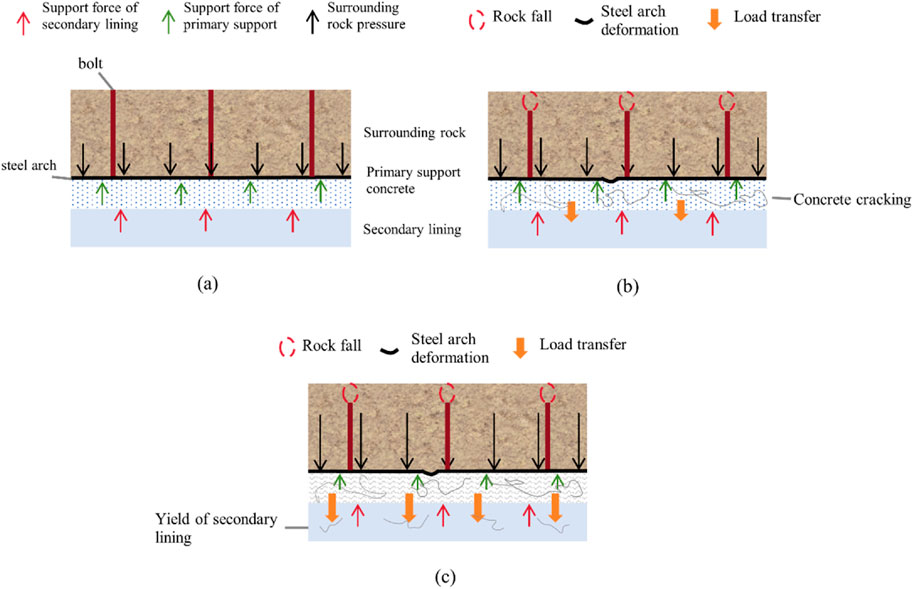
Figure 17. Pressure transfer mechanism of the surrounding rock.
5.3 Conclusion, recommendation, and future direction
Engineering applications demonstrate: Delaying installation of secondary lining reduces load by 43%, and setting a primary support limit of 37 GPa avoids diminishing marginal returns. As the final line of defense for permanent tunnel support, the safety of the secondary lining is critical. A stable final pressure indicates that the “primary load-bearing ring” formed by surrounding rock and primary support effectively withstands most strata pressure, transmitting a residual and relatively constant load to the secondary lining. This stability significantly reduces risks of secondary lining failure due to unexpected load increases during long-term operation, providing crucial safeguards for long-term structural safety. When exploring strategies to optimize composite lining structure design for soft rock tunnels, this study reveals key mechanical mechanisms and proposes targeted solutions.
The load transfer process clearly exhibits three distinct dynamic stages: Stage I (elastic collaborative bearing) is evidenced by in-situ monitoring of pressure distribution and stiffness ratio relationships; Stage II (post-yield load transfer of primary support) is supported by the 177 kPa load jump observed on Day 16; Stage III (potential secondary lining failure), though not observed during the monitoring period, is forewarned through local pressure analysis and numerical model deduction.
The fundamental approaches to reduce secondary lining stress include: (1) When surrounding rock conditions are stable, appropriately extending the secondary lining construction time serves as an optimized alternative to blindly increasing initial support stiffness, with dynamic monitoring employed to determine specific time windows. (2) adjusting the primary support structure by reducing steel arches to decrease structural rigidity and enhance flexibility; On the contrary, Faleih et al. (2024) demonstrated that geogrid reinforcement in soft soil tunnels can effectively redistribute axial loads, providing experimental support for the concept of controlled yielding through flexible reinforcement systems. (3) implementing surrounding rock improvement and cross-sectional optimization to suppress creep pressure at the source. This multi-factor collaborative design philosophy not only avoids the cost pitfall of excessive rigidity enhancement but also achieves a balance between system safety and economy through spatiotemporal dimension regulation.
Research innovations lie in Cvisc-FLAC3D simulation, parameter refinement, and yield threshold quantification, though three limitations exist: (1) neglect of portal 3D effects, (2) simplification of support material linear elastic behavior, and (3) omission of groundwater/temperature impacts. In summary, soft rock creep loads are regulated by stiffness ratio and yield threshold. Practical recommendations include adopting dynamic monitoring to optimize installation timing and systematic grouting to enhance rock mass parameters. Future research should focus on developing 3D heterogeneous models incorporating faults/seepage, investigating nonlinear support behaviors, establishing regional creep databases and exploration of intelligent monitoring technologies, exemplified by UAV-based and deep learning-enabled automatic lining crack detection technology (Sorilla et al., 2024). Optimizing decision-making processes through the SMART objective (Hazem et al., 2024) management framework delay installation of secondary lining.
6 Conclusion
To address the issues of surrounding rock deformation and support load-bearing characteristics induced by soft rock creep behavior, this study focuses on the Xianfeng tunnel project and analyzes the variation patterns of surrounding rock pressure and secondary lining stress by Field monitoring was initially employed to. The influence of construction parameters, including the timing of secondary lining installation and support stiffness, on the lining stress response under creep effects was investigated through numerical simulation analysis employing the Cvisc creep constitutive model within the finite difference software FLAC3D. The integrated analysis of field data and numerical simulations reveals the load-sharing mechanism of the support structure and the transfer mechanism of surrounding rock pressure. The conclusions are summarized as follows:
1.Field monitoring and numerical simulation results demonstrate that the pressure variation trend of the surrounding rock and the secondary lining under different construction timings remains generally consistent, all undergoing three characteristic stages: accelerated growth, decelerated growth, and constant-rate growth phases.
2.Premature installation of the secondary lining induces partial stress redistribution from the primary support system to the lining structure, ultimately resulting in excessive stress concentrations. In this specific case, the optimal timing for secondary lining installation is identified as 24 days post-excavation.
3.Maintaining the same timing for secondary lining installation, increasing the stiffness of the primary support yields a negligible reduction in stress experienced by the secondary lining. When the primary support stiffness is increased from 27 GPa to 37 GPa, the final pressure at the secondary lining’s vault decreases by only 0.08%. Although increasing the stiffness of the primary support can moderately reduce the stress sharing ratio of the secondary lining, it restricts the surrounding rock deformation, which paradoxically leads to an increase in the total load borne by the rock mass.
4.When neither the primary support nor the secondary lining has yielded, the surrounding rock pressure distributes proportionally according to the stiffness of each supporting structure. If the primary support yields, the surrounding rock load progressively transfers to the secondary lining, which gradually becomes the primary load-bearing component for rock deformation. Creep behavior emerges as a critical factor influencing lining stress and deformation patterns. To ensure the safety and reliability of tunnel engineering, the design of support systems must explicitly incorporate considerations of short-term creep effects in the surrounding rock and their resultant impacts on structural performance.
Data availability statement
The original contributions presented in the study are included in the article/supplementary material, further inquiries can be directed to the corresponding author.
Author contributions
JX: Investigation, Writing – review and editing, Software, Supervision, Funding acquisition, Resources, Data curation, Methodology, Conceptualization. JF: Resources, Funding acquisition, Writing – original draft, Software, Formal Analysis, Visualization, Data curation, Project administration, Conceptualization, Validation, Methodology, Supervision, Investigation. PJ: Data curation, Investigation, Conceptualization, Writing – review and editing, Validation, Funding acquisition, Formal Analysis. AH: Formal Analysis, Data curation, Writing – review and editing, Conceptualization, Funding acquisition. CJ: Supervision, Validation, Writing – review and editing, Software. QS: Conceptualization, Writing – review and editing, Funding acquisition, Data curation, Formal Analysis. JS: Resources, Investigation, Writing – review and editing, Project administration, Methodology. HL: Data curation, Formal Analysis, Conceptualization, Writing – review and editing. RR: Formal Analysis, Data curation, Writing – review and editing, Project administration. CZ: Software, Writing – review and editing, Investigation, Resources, Methodology, Project administration, Validation, Funding acquisition, Data curation, Supervision, Formal Analysis, Conceptualization, Visualization.
Funding
The author(s) declare that no financial support was received for the research and/or publication of this article.
Conflict of interest
Authors JX, PJ, AH, CJ, QS, JS, HL, and RR were employed by China First Metallurgical Group Co., Ltd.
The remaining authors declare that the research was conducted in the absence of any commercial or financial relationships that could be construed as a potential conflict of interest.
Generative AI statement
The author(s) declare that no Generative AI was used in the creation of this manuscript.
Any alternative text (alt text) provided alongside figures in this article has been generated by Frontiers with the support of artificial intelligence and reasonable efforts have been made to ensure accuracy, including review by the authors wherever possible. If you identify any issues, please contact us.
Publisher’s note
All claims expressed in this article are solely those of the authors and do not necessarily represent those of their affiliated organizations, or those of the publisher, the editors and the reviewers. Any product that may be evaluated in this article, or claim that may be made by its manufacturer, is not guaranteed or endorsed by the publisher.
References
Editorial Office of China Journal of Highway and Transport (2022). Academic research review of China's transportation tunnel Engineering·2022. China J. Highw. Transp. 35, 1–40. doi:10.19721/j.cnki.1001-7372.2022.04.001
Faleih, Z. H., Al-Gharbawi, A. S. A., and Baqir, H. H. (2024). The behavior of the tunnel reinforced with geogrid in soft soil under the effect of axial load. Civ. Eng. J. (2476-3055) 10 (8), 2471–2484. doi:10.28991/cej-2024-010-08-04
Fang, Q., Zhang, D. L., Wang, Y. Y., Li, P. F., and Chen, T. L, (2011). Study on contact pressure between primary support and secondary lining of high-speed railway tunnels. Chin. J. Rock Mech. Eng. 30 (S2), 3377–3385.
Fu, H. Y., Qi, S. X., Shi, Z. N., Gao, Q. F., Kang, B., and Zeng, N. (2024). Creep characteristics and nonlinear viscoelastic-plastic constitutive model of silty mudstone. J. Civ. Environ. Eng. 46 (3), 1–8.
Gu, S. C., Huang, R. B., and Su, P. L. (2018). Study on the stress distribution of composite lining considering the creep effect of the tunnel surrounding rock. J. Traffic Transp. Eng. 18, 53–60. doi:10.19818/j.cnki.1671-1637.2018.02.006
Guo, X. X., Wang, B., Wang, Z. Y., and Yu, J. W. (2023). Prediction method and practice of tunnel deformation in high-stress soft rock considering creep characteristics. Chin. J. Geotechnical Eng. 45, 652–660. doi:10.11779/CJGE20220058
Hazem, R. T., Hadi, A. H., and Nassar, Y. S. (2024). The degree of consistency through adopting SMART objectives for succession of feasibility studies to infrastructure projects. HighTech Innov. J. 5 (3), 614–626. doi:10.28991/hij-2024-05-03-05
Huang, R. B. (2018a). Study on the load transfer mechanism of tunnel lining structure considering the creep effect of loess. Xi'an, China: Xi'an University of Science and Technology. Ph.D. Dissertation.
Huang, R. B. (2018b). Study on the load transfer mechanism of tunnel lining structures considering the creep effect of loess. Xi'an, China: Xi'an University of Science and Technology. Ph.D. Dissertation.
Joel, S. (2024). The effects of seismic behavior on high ground stress soft rock tunnel: a review. Civ. Eng. J. 10 (9), 3090–3121. doi:10.28991/cej-2024-010-09-020
Lan, R. Y., Yang, K., Qiu, Y. H., Cui, Y. Z., Qiao, M. J., and Yan, Q. X. (2024). Study on the deterioration characteristics of tunnel support structures under the effect of surrounding rock creep. J. Southwest Jiaot. Univ., 1–13.
Li, J. J., and Zhang, Z. Q. (2011). Study on the influence of rock creep on tunnel secondary lining structures. Mod. Tunn. Technol. 48, 58–64+81.
Liu, X., Zhang, C., Xiao, H., Zhou, H., and Chi, F. D. (2022). Deformation and failure characteristics of a deeply buried tunnel subjected to creep slip fault movement: based on the engineering conditions of the Yunnan water intake project. Bull. Eng. Geol. Environ. 81, 1–16. doi:10.1007/s10064-022-02799-5
Lu, X. Y. (2021). Analysis of surrounding rock pressure in deeply buried small-clearance tunnels considering time effects. J. Highw. Transp. Res. Dev. 38, 100–106+143. doi:10.3969/j.issn.1002-0268.2021.10.013
Shen, C. H., Zhang, B., Hu, K. M., and Wang, Y. (2016). Simulation study on the creep behavior of tunnel surrounding rock based on Drucker-Prager series criteria. Mod. Tunn. Technol. 53, 54–62.
Shi, L. (2020). Study on the influence of surrounding rock creep effect on the long-term stability of tunnel linings. Beijing, China: Beijing Jiaotong University. Ph.D. Thesis.
Song, Z. P. (2016). Experimental investigation and numerical simulation of surrounding rock creep for deep mining tunnels. J. South. Afr. Inst. Min. Metallurgy 116, 1181–1188. doi:10.17159/2411-9717/2016/v116n12a13
Sorilla, J., Chu, T. S. C., and Chua, A. Y. (2024). A UAV based concrete crack detection and segmentation using 2-stage convolutional network with transfer learning. HighTech Innov. J. 5 (3), 690–702. doi:10.28991/hij-2024-05-03-010
Sung, O., Choi, S. O., and Hee-Son, S. (2004). Stability analysis of a tunnel excavated in a weak rock mass and the optimal supporting system design. Int. J. Rock Mech. Min. Sci. 41, 461. doi:10.1016/j.ijrmms.2004.03.151
Tang, J., Deng, Z. W., and Jiang, J. Q. (2014). Calculation method for the resistance coefficient of tunnel surrounding rock considering creep effect. J. Central South Univ. Sci. Technol. 45, 1281–1287.
Wang, Y. C., Shang, Y. Q., Sun, H. Y., Li, H. Q., and Xu, X. H. (2010). Study on the stress distribution of composite lining during the creep process of the surrounding rock. Hydrogeology and Eng. Geol. 37, 49–54.
Yang, L. L., Yang, W. B., Tian, H. S., Kou, H., and Zhang, H. (2023a). Study on deformation control of tunnel double-layer primary support considering short-term creep effect of surrounding rock. Chin. J. Rock Mech. Eng. 42, 1731–1742.
Yang, L. L., Yang, W. B., Tian, H. S., Kou, H., Zhang, H., Zhou, Z., et al. (2023b). Study on deformation control of tunnel double-layer initial support considering short-term creep effect of surrounding rock. Chin. J. Rock Mech. Eng. 42, 1731–1742.
Keywords: soft rock tunnel, creep effect, composite lining structure, surrounding rock, pressure load sharing ratio of lining
Citation: Xu J, Fang J, Jiang P, Han A, Jiang C, Sun Q, Song J, Lin H, Ren R and Zuo C (2025) Mechanical effect and load transfer mechanism of soft rock tunnel composite lining considering creep effect. Front. Earth Sci. 13:1654209. doi: 10.3389/feart.2025.1654209
Received: 26 June 2025; Accepted: 04 August 2025;
Published: 01 September 2025.
Edited by:
Gioacchino Francesco Andriani, University of Bari Aldo Moro, ItalyReviewed by:
Mohammad Reza Kavianpour, K. N. Toosi University of Technology, IranOmid Aminoroayaie Yamini, K. N. Toosi University of Technology, Iran
Copyright © 2025 Xu, Fang, Jiang, Han, Jiang, Sun, Song, Lin, Ren and Zuo. This is an open-access article distributed under the terms of the Creative Commons Attribution License (CC BY). The use, distribution or reproduction in other forums is permitted, provided the original author(s) and the copyright owner(s) are credited and that the original publication in this journal is cited, in accordance with accepted academic practice. No use, distribution or reproduction is permitted which does not comply with these terms.
*Correspondence: Changqun Zuo, enVvY2hhbmdxdW5AY3VnLmVkdS5jbg==