Abstract
To comprehensively examine the dynamic shear characteristics of the marine silica sand–geogrid interface under representative marine environmental conditions, a series of cyclic direct shear tests with controlled temperature were carried out using a custom-designed experimental apparatus. The interface between marine silica sand (particle size 0.075–2 mm) and a biaxial geogrid was examined across a wide temperature range (−5°C–80°C) and under varying normal stresses (50, 150, and 250 kPa). The coupled effects of temperature and normal stress on the interfacial cyclic shear response were systematically analyzed. The results demonstrate that the interfacial shear behavior is markedly influenced by the combined effects of temperature and normal stress. Under a normal stress of 50 kPa, the peak shear stress increases progressively with the number of loading cycles, indicating shear hardening behavior. At normal stress of 150 kPa, the peak shear stress gradually stabilizes, indicating a movement toward mechanical equilibrium. In contrast, at a normal stress of 250 kPa, the shear stress increases during the initial cycles but then declines, demonstrating a shift toward shear softening behavior. Additionally, as the temperature increases from −5 °C to 20 °C, both the interfacial strength and stiffness show noticeable improvement. However, further heating to 80 °C results in a significant deterioration of these mechanical properties. Notably, the interface behavior under 250 kPa exhibits the highest sensitivity to temperature variation. Furthermore, the maximum dynamic shear stiffness increases with temperature up to 20 °C and subsequently declines, whereas the damping ratio is highest during the initial cycle and gradually stabilizes with continued cyclic loading. The results emphasize the significant and interconnected impacts of temperature and normal stress on the dynamic behavior of the interface between marine silica sand and geogrid. These findings provide valuable insights for the design, improvement, and long-term assessment of geosynthetic-reinforced systems in marine engineering applications.
1 Introduction
As a commonly used foundation filler in offshore engineering, marine silica sand has significant engineering application value (DeMaster, 1981; Landivar Macias et al., 2024; Tamilarasan and Suganya, 2024), is also the subject of extensive study in geological processes due to its sensitivity to environmental conditions like temperature (Varkouhi et al., 2024). However, under the long-term action of complex external loads, such as waves, single silica sand foundations often face problems, including insufficient bearing capacity, which makes it challenging to meet the stability and durability requirements of high-grade marine structures (Gonabadi et al., 2024). Understanding these mechanical failures is critical, as they can contribute to larger-scale geohazards and have significant environmental consequences, a concern highlighted in studies of other geologically complex regions (Asghari et al., 2025). To enhance the performance of foundations, geogrid is widely used as an efficient reinforcing material in foundation treatments, slope protection, and other projects (Chen et al., 2023; Shi et al., 2025a; Shi et al., 2025b; Venkateswarlu et al., 2023). It effectively improves the bearing capacity and deformation control ability of the soil body by enhancing the constraint and inter-particle embedded locking effect (Ding et al., 2022; Luo et al., 2024). The performance of the reinforced structure relies on both the mechanical properties of the soil and the characteristics of the reinforcing material (Landivar Macias et al., 2024; Zhou et al., 2024), but is also significantly affected by the mechanical behavior of the interface between the two (Gao et al., 2023; Xu et al., 2019). Silica sand-grid interface is considered to be the weakest link in the reinforced system that is most prone to damage, and the stability of the marine facilities is mainly determined by the interfacial interaction between the soil body and geogrid, so it is crucial to study the mechanical behavior of the silica sand-grid interface.
In marine engineering, the marine silica sand-geogrid interface is typically subjected to the combined action of periodic external loads, including waves and traffic loads (Landivar Macias et al., 2024). The research indicates that, compared to static loading conditions, the mechanical behavior of the interface under dynamic loading has a more significant impact on the stability and service performance of the reinforced structure, and this behavior is more complex (Chao et al., 2024a). However, existing studies primarily focus on the interface shear characteristics under static loading conditions, and the understanding of the interface response mechanism under dynamic loading remains insufficient (Chao et al., 2025). Meanwhile, Changes in different stress states can significantly impact the shear behavior of the interface between geogrids and marine silica sand (Liu F. et al., 2021). Existing studies have demonstrated that, under external loading or soil weight, normal stress is a key factor influencing the contact pressure and embedment strength between particles and geogrids (Ma et al., 2023), which in turn affects the friction mechanism and shear bearing capacity of the interface. Neglecting the effect of normal stress will lead to a biased understanding of the interface response mechanism.Therefore, Therefore, to achieve an accurate understanding, it is necessary to investigate the mechanical response of the marine silica sand–geogrid interface under dynamic loading while explicitly incorporating the role of normal stress.
In addition to dynamic perturbations, significant temperature variations in the marine environment also significantly impact interface behavior. In the context of global climate change, the temperature fluctuation of the foundation of marine structures has been enhanced. The temperature of the topsoil can reach 60 °C–70 °C due to seasonal changes, solar radiation, tidal exchange, and seabed heat sources. The localized temperature of the foundation in the vicinity of submarine pipelines or thermal energy facilities can even reach 80 °C. Existing studies have shown that the thermal softening of thermoplastic geogrid materials, such as polypropylene, occurs at high temperatures, which results in a significant decrease in the modulus of elasticity and nodal strength of their embedded locks (Chao et al., 2024a; Chao et al., 2024b; Chen et al., 2024; Karademir and Frost, 2021). Furthermore, higher temperatures impact the viscosity and movement of water in the pores of silica sand. This effect alters the actual stress conditions and the contact structure between the particles, ultimately changing their frictional properties and shear strength. Temperature changes in the mechanical properties of geogrid materials and marine silica sand create a coupling effect that significantly influences the dynamic mechanical behavior at the interface between the sand and the geogrid (Feng et al., 2025). While initial studies focused on the impacts of temperature at the sand-geogrid interface, most experiments have been restricted to static loading and a limited temperature range, as seen in the works of Bilgin and Shah, Karademir and Frost, and Feng et al. (2025) (Bilgin and Shah, 2021; Feng et al., 2025; Karademir and Frost, 2014; 2021), They investigated the mechanochemical behavior of silica sand and geomembrane interfaces at temperatures ranging from 3 °C to 42 °C, and 21 °C–50 °C, but did not address the mechanism of interfacial evolution in a wide temperature domain, under dynamically loaded shear conditions. Investigating the dynamic mechanochemical interactions between marine silica sand and geogrid over a broad temperature range is essential.
Relying on a self-developed dynamic direct shear test system with temperature control, this paper systematically carries out the cyclic shear test of marine silica sand-biaxial geogrid interface under a wide range of temperatures (−5 °C–80 °C) and multilevel normal stresses (50, 150, 250 kPa). By controlling the temperature and normal stress variables, the shear mechanical response of the interface under cyclic loading was comprehensively analyzed, with the focus on investigating the response characteristics of key parameters such as peak cyclic shear strength, shear expansion and contraction characteristics, shear stiffness evolution, and damping ratio with the change of temperature. The aim is to reveal the degradation mechanism and adaptive behavior of the interface mechanical properties under high and low temperature environments, expand the understanding of the temperature and stress coupling mechanism, and provide scientific support for the structural design and long-term service performance evaluation of marine reinforced foundations under extreme climatic conditions, which is of great practical value in engineering.
2 Materials and methods
2.1 Test apparatus
The test equipment used in this research is a self-developed soil-geosynthetics interface temperature-controlled shear test system (see Figure 1), which builds upon our group’s expertise in advanced laboratory testing for geomechanical properties and is capable of simulating the dynamic shear behavior of the soil–geosynthetic interface under various thermal environments.The system integrates three functional modules: normal loading, shear loading, and high/low-temperature control, and is capable of accurately simulating shear conditions under extreme environments with a wide temperature range (−50 °C–300 °C), high loading accuracy, and large displacement. The system is equipped with high-resolution sensors and real-time data acquisition devices, which can synchronously monitor shear stress, deformation, temperature, and stress changes, meeting the demand for temperature-controlled dynamic shear testing of marine silica sand-geosynthetics interfaces.
FIGURE 1
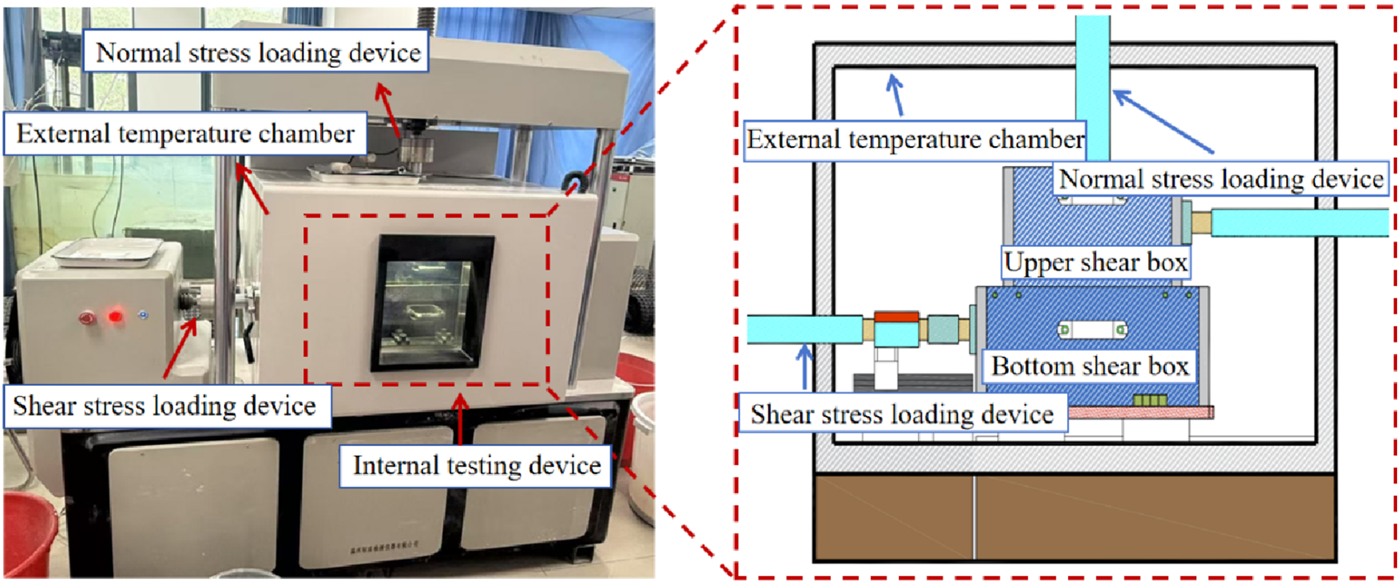
The soil-geosynthetics interface temperature-controlled shear test system.
2.2 Silica sand
In this research, the experimental material is marine silica sand (see Figure 2). The particle size ranges from 0.075 mm to 2 mm. The physical and mechanical property indexes of the specimens are shown in Table 1.
FIGURE 2
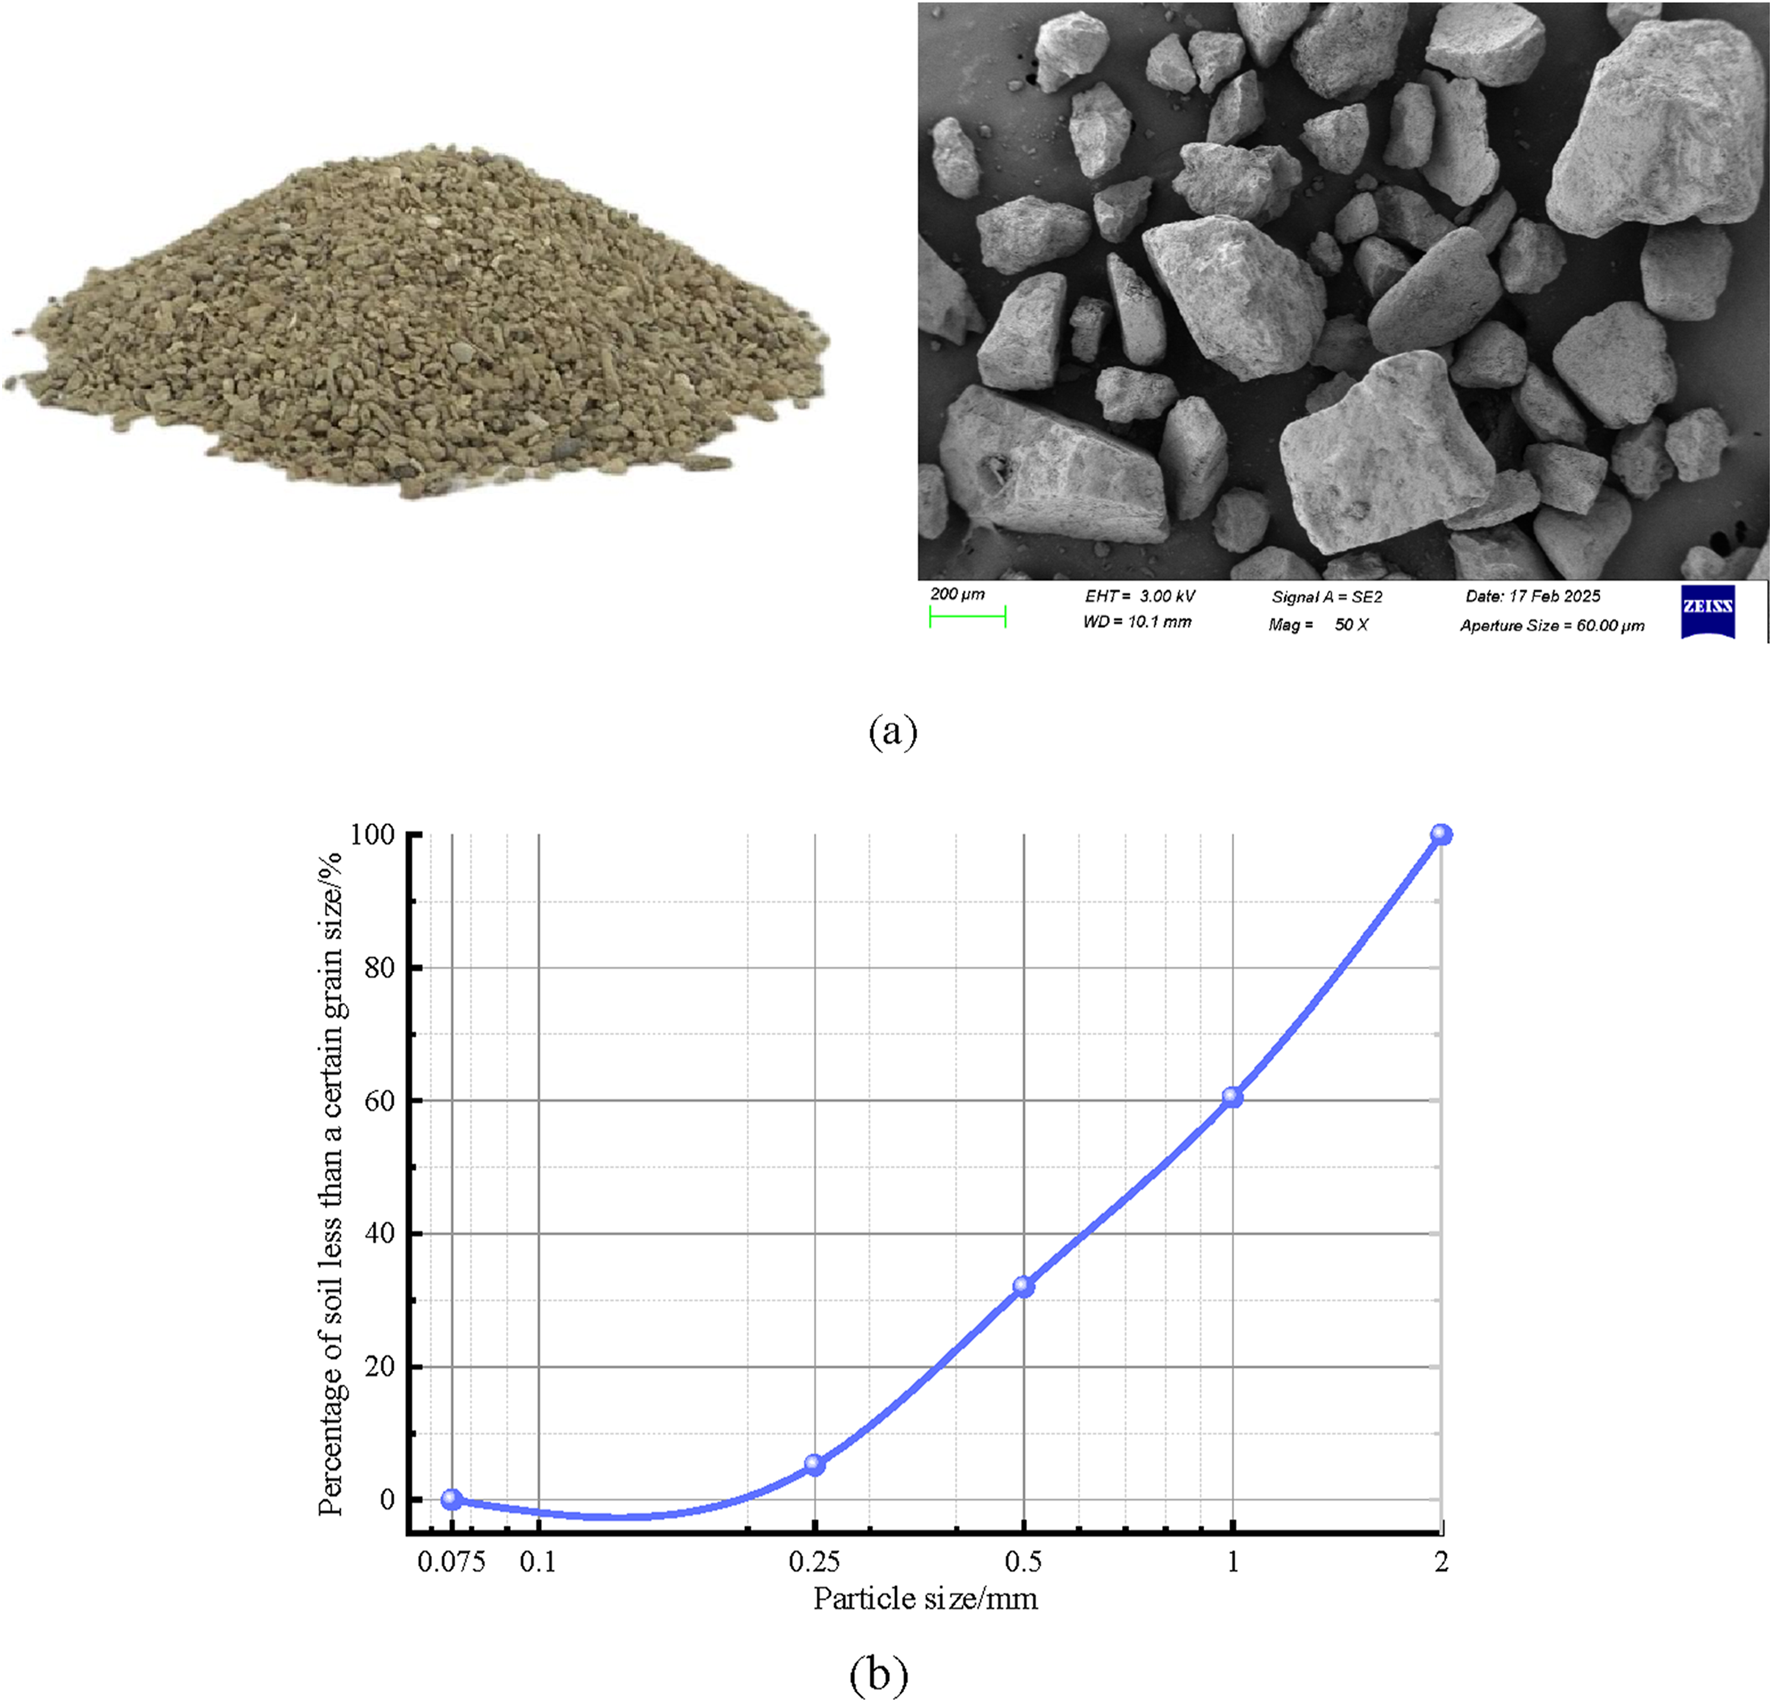
Marine silica sand and particle gradation curve. (a) Marine silica sand; (b) Particle gradation curve.
TABLE 1
| Coefficient of uniformity | Coefficient of curvature | Median particle size (mm) | Maximum void ratio |
Maximum void ratio |
Density (g/cm3) |
Relative density (%) |
|---|---|---|---|---|---|---|
| 3.45 | 0.32 | 0.800 | 0.82 | 0.50 | 1.52 | 33–36 |
Properties of marine silica sand: Physical and mechanical characteristics.
2.3 Biaxial geogrid
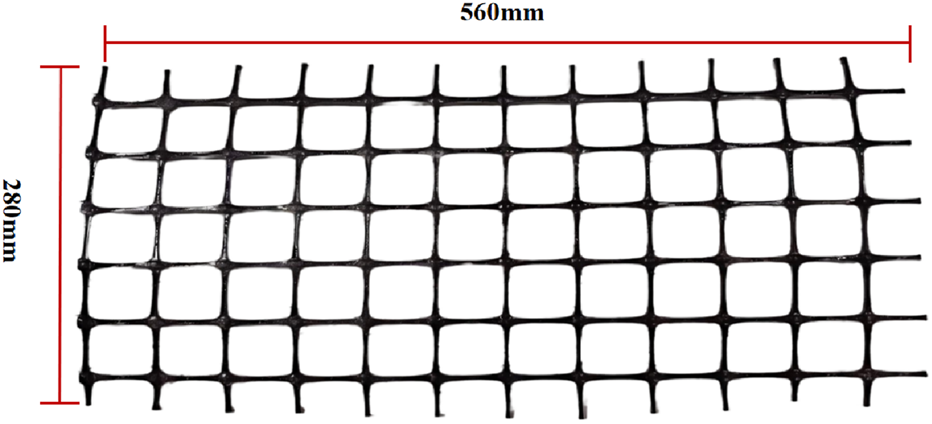
The geogrid employed in the test is a biaxially oriented plastic geogrid, shown in Figure 3. It is constructed from polypropylene (PP), with its specialized specifications outlined in Table 2.
FIGURE 3
Biaxial geogrid.
TABLE 2
| Tensile strength (Transverse, QC) (N/mm) |
Tensile strength (Longitudinal, QC) (N/mm) |
Node effectiveness (Transverse) (%) |
Node effectiveness (Longitudinal) (%) |
Aperture size (mm) | Stiffness at 0.5% strain (Transverse) (N/mm) |
Stiffness at 0.5% strain (Longitudinal) (N/mm) |
|---|---|---|---|---|---|---|
| 30 | 30 | 95 | 95 | 39 × 39 | 390 | 390 |
Specifications of the biaxially stretched geogrid.
2.4 Sample preparation process
The test was designed to investigate the dynamic shear mechanical response of the interface between marine silica sand and geogrid under various temperature conditions. It was carried out using a dynamic direct shear system equipped with a temperature control function and operated in a strain control mode. In the test, the biaxial geogrid was cut to a size of 560 mm × 280 mm, and the width of the geogrid was slightly smaller than the inner width of the shear box of 30 mm to avoid the interference of lateral constraints during the shear process. The marine silica sand used has an angular particle morphology, a rough particle surface, and a wide particle size distribution from 0.075 mm to 2 mm, which determines its strong inter-particle friction, significant embedded locking effect, and sensitivity to normal stress and temperature changes. Silica sand SEM scanned image is shown in Figure 4. In order to ensure the consistency of the interfacial contact and reduce the variability of the initial filling state, the following operations were performed. The sand samples were made of marine silica sand with 10% moisture content and were filled in five layers of 24 mm thickness (120 mm total height), with each layer being compacted 16 times using a compactive effort of approximately 25 kJ/m3 to ensure a homogeneous sample. The shear loading was performed in a strain-controlled mode at a rate of 1 mm/min, and each shearing cycle involved a 6 mm displacement in the rightward direction, followed by 6 mm in the leftward direction, constituting a complete cycle, with a total of 10 cycles performed. The shear force and displacement data were automatically collected and saved by the system, which facilitated the subsequent analysis of the hysteresis behavior and energy dissipation characteristics of the interface at different temperatures.
FIGURE 4
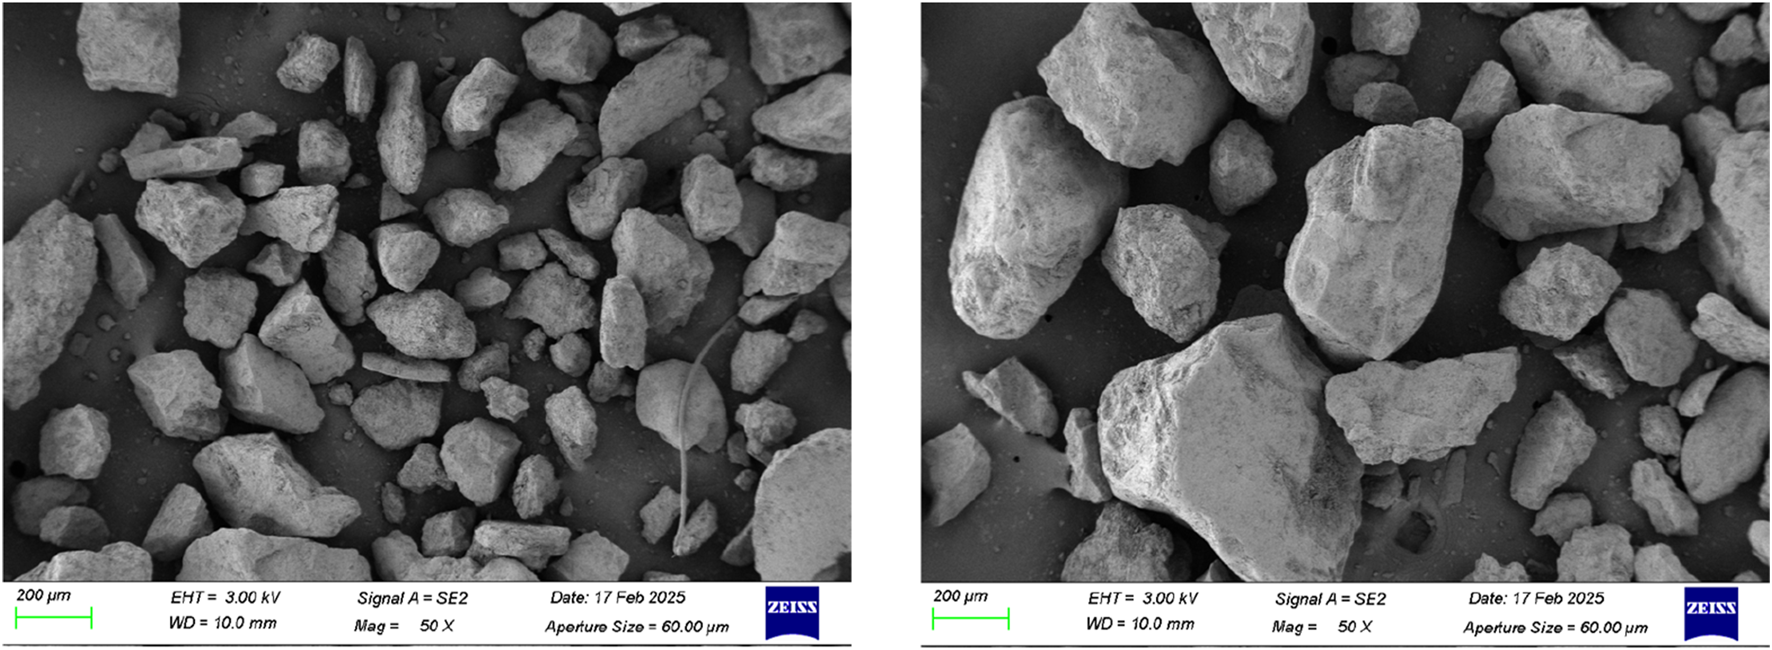
Silica sand Sem scanned image.
2.5 Experimental procedures
To systematically investigate the effect of temperature on the dynamic response characteristics of the marine silica sand-geogrid interface, this research conducted a series of undrained cyclic shear tests using a temperature-controlled shear test system at the soil-geosynthetic interface. The test was conducted using a combination of graded normal stresses and multilevel constant temperature conditions to form several groups of typical working conditions (see Table 3). Specifically, three normal stress levels, 50 kPa, 150 kPa, and 250 kPa, were set to simulate light, medium, and heavy overburden pressures, respectively. Eight constant temperatures (−5 °C, 0 °C, 20 °C, 40 °C, 50 °C, 60 °C, 70 °C, and 80 °C) were selected to cover the typical marine environment of low, normal, and high temperatures. It covers low, normal, and high temperatures in typical marine environments and takes into account potential thermal perturbations caused by seasonal changes, solar radiation, deep soil heat storage, and other factors.
TABLE 3
| Test Type | Sand layer thickness (cm) | Normal stress (kPa) | Shear rate (mm·min-1) |
Shear amplitude AW/mm | Number of cycles | Temperature (°C) |
|---|---|---|---|---|---|---|
| Temperature-Controlled Interface Dynamic Shear Test | 12.0 | 50 150 250 |
1.0 | 6.0 | 10 | −5 、0、20、40、50、60、70、80 |
Experimental procedures.
3 Results
3.1 Effect of temperature on cyclic strength index of marine silica sand-geogrid interface
To analyze the dynamic response characteristics of the marine silica sand-geogrid interface under each operation condition, Figure 5 plots the relationship between the cyclic shear stress and displacement of the marine silica sand-geogrid interface under different temperatures and normal stresses.
FIGURE 5
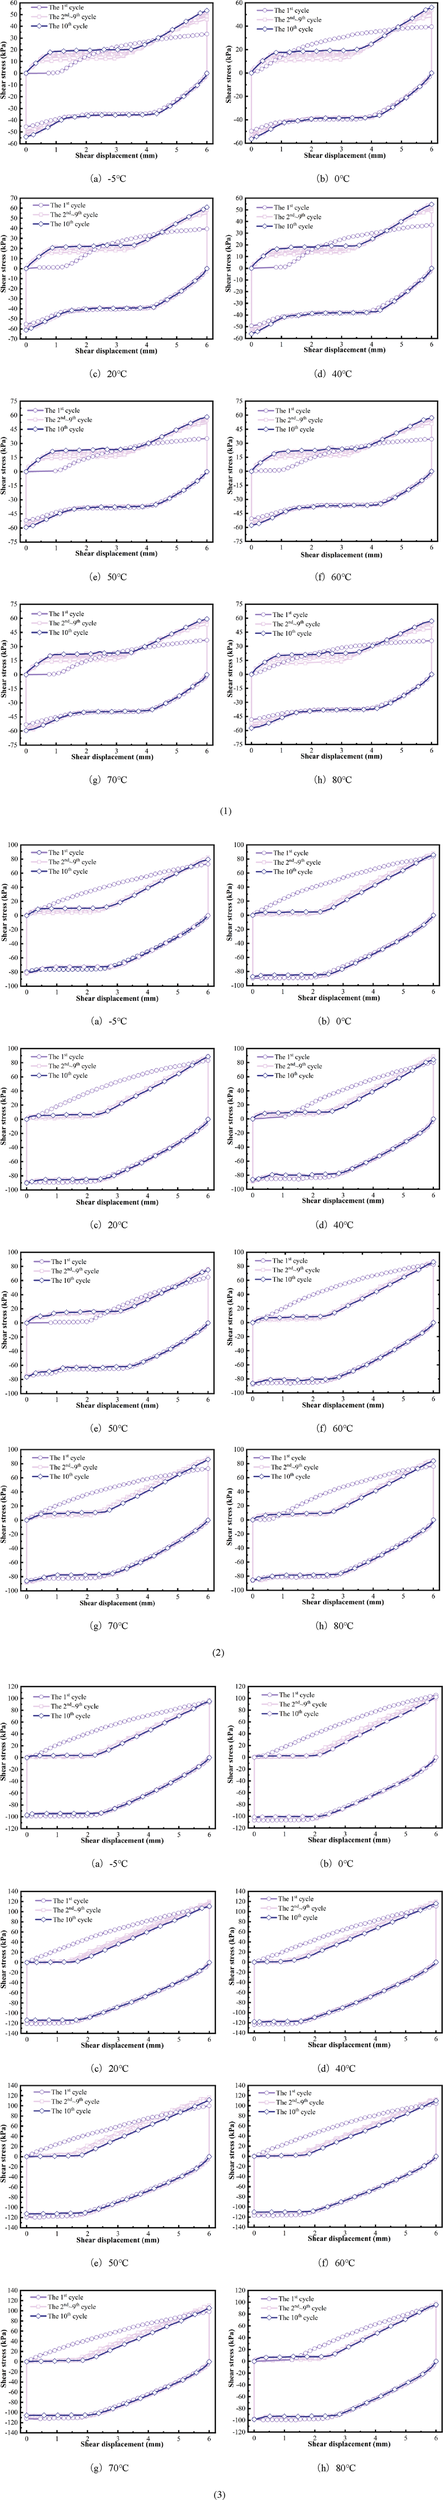
The relationship curves between cyclic shear stress and displacement. (1) Normal stress 50 kPa; (2) Normal stress 150 kPa; (3) Normal stress 250 kPa. (a) -5 °C. (b) 0 °C. (c) 20 °C. (d) 40 °C. (e) 50 °C. (f) 60 °C. (g) 70 °C. (h) 80 °C.
Based on Figure 5, under the condition of 50 kPa normal stress, the hysteresis curves at each temperature level show a continuous outward expansion from the 1st to the 10th circle, and the area of the hysteresis loop gradually increases, which shows a significant cyclic shear hardening property of the interface. This indicates that under low-stress conditions, the interface structure is gradually densified under repeated shear perturbation, which enhances the shear resistance. Under the normal stress condition of 150 kPa, an outward expansion is also observed in the hysteresis curve within the initial two cycles. Subsequently, it slowly moves toward convergence, the shear stiffness stabilizes, the hardening effect is weakened, and the interface exhibits a response characteristic of hardening first and then stabilizing. However, at elevated temperatures of 60 °C, 70 °C, and 80 °C, the hysteresis curves gradually contracted with cycling, and cyclic shear softening occurred at the interface. Under a normal stress of 250 kPa, the interface still exhibits some shear hardening tendency in the first two cycles. Still, the hysteresis curves generally contract inwardly, and the interface shows cyclic shear softening characteristics. At extreme temperatures (−5 °C and 80 °C), there is less contraction in the hysteresis curves, and the cyclic shear softening of the interface is not apparent.
To deepen the understanding of temperature and normal stress influences on the cyclic interface’s shear resistance, Figure 6 shows the relationship curves between the peak shear stress and the number of cycles for different temperatures under different normal stress conditions.
FIGURE 6
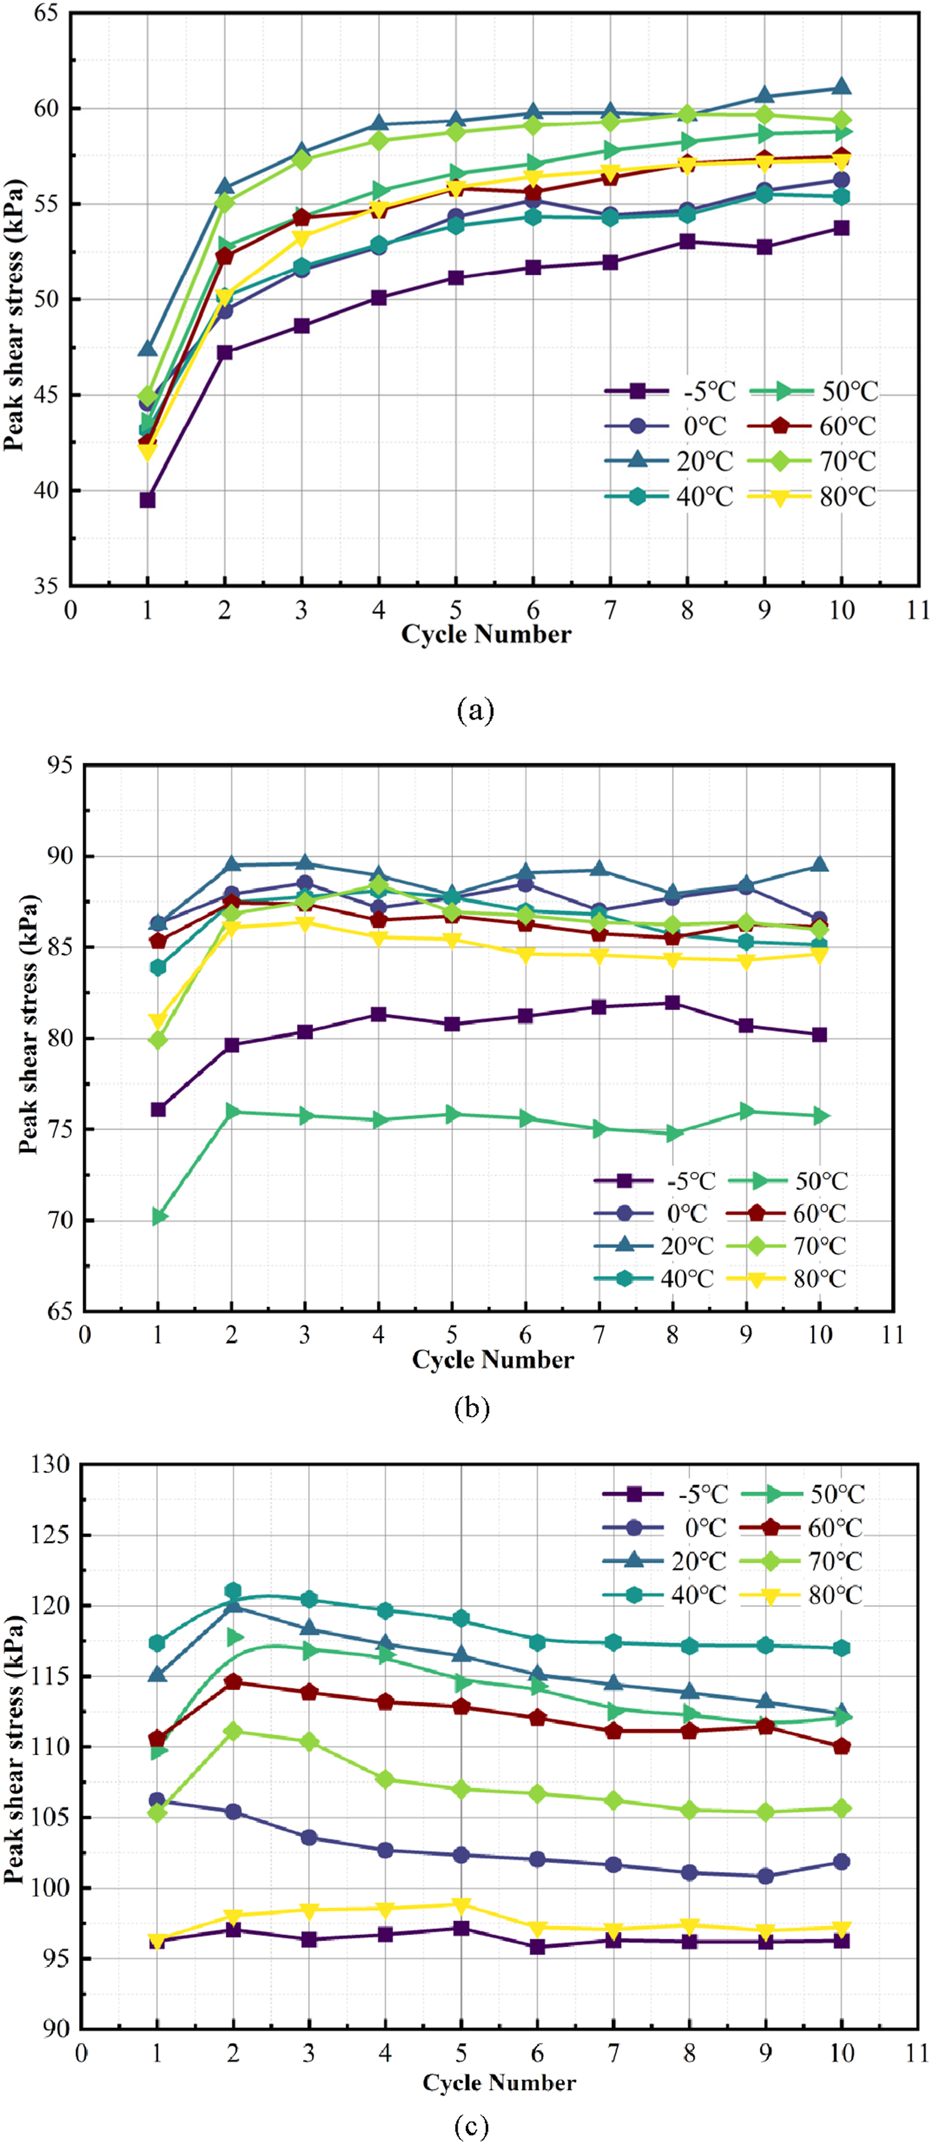
Peak shear stress versus cycle count curves under varying temperature conditions. (a) Normal stress 50 kPa; (b) Normal stress 150 kPa; (c) Normal stress 250 kPa.
As can be seen in Figure 6, the pattern of peak shear stress at the marine silica sand-geogrid interface was influenced by the frequency of cyclic shear tests conducted under varying temperature conditions, revealing significant differences across different normal stress levels. Under the action of 50 kPa normal stress, the peak shear stress of the interface continues to rise with the number of cycles, showing obvious cyclic shear-hardening characteristics. This phenomenon indicates that at lower levels of positive stress, the interface structure is gradually compacted during repeated shearing, the occlusion between particles is enhanced, and the interfacial shear strength is continuously improved. When the normal stress is increased to 150 kPa, the peak interfacial shear stress rises rapidly in the initial cycles, then tends to stabilize, and gradually approaches a certain level of residual strength, which indicates that the interface reaches a relatively stable mechanical state after the initial cyclic hardening process, and enters into the strength saturation stage. Under higher normal stress (250 kPa), the peak shear stress of the interface shows a tendency to increase and then decrease, which indicates that the interface initially undergoes cyclic shear hardening but then shows cyclic shear softening due to the decrease in shear resistance during the subsequent cycles. The above pattern is consistent with the evolution trend of the shear stress-shear displacement hysteresis curve in Figure 5, which further validates the multi-stage evolution characteristics of the dynamic response process at the soil-reinforcement interface influenced by temperature and normal stress.
In addition, the overall peak shear strength of the interface increased with increasing normal stress, a trend that the Mohr-Coulomb strength criterion can explain. As the normal stress increases, the contact force between the interface particles is enhanced, and the friction effect is intensified, which improves the shear capacity of the interface, resulting in a significant enhancement of the maximum strength of the marine silica sand–geogrid interface during cyclic shearing. It was also observed under different temperature conditions that the number of shear laps required for the interface to reach the peak strength in cyclic shear tended to decrease as the normal stress increased. This suggests that higher levels of positive stress induce faster particle rearrangement and compaction in the interface region during the initial cyclic phase, which enhances the mechanical interlocking effect between the soil and the grids and allows the interface structure to enter into an efficient shear state more rapidly. Therefore, under high normal stress conditions, the interface is more likely to realize strength excitation and hardening response in the early cycle.
The peak shear stress at the marine silica sand-geogrid interface showed a significant pattern of change under different temperature conditions. In general, the maximum shear stress at the interface increased as the temperature rose from −5 °C to 20 °C, which indicates that a certain degree of warming helps to enhance the shear resistance of the soil-grid interface. However, the peak shear stress reduces with further temperature increase up to 80 °C, which indicates that the high-temperature conditions may weaken the mechanical properties of the interfacial materials, especially the stiffness of the grillage material and the friction between the soil particles. To further explore the influence of temperature on the interfacial shear performance, this paper selected the maximum shear stress during the 1st to 10th cycles of each group of tests as the peak strength index and plotted the association of peak shear strength with temperature changes, as shown in Figure 7. The change curve helps to reveal the influence of temperature change on the interface shear response.
FIGURE 7
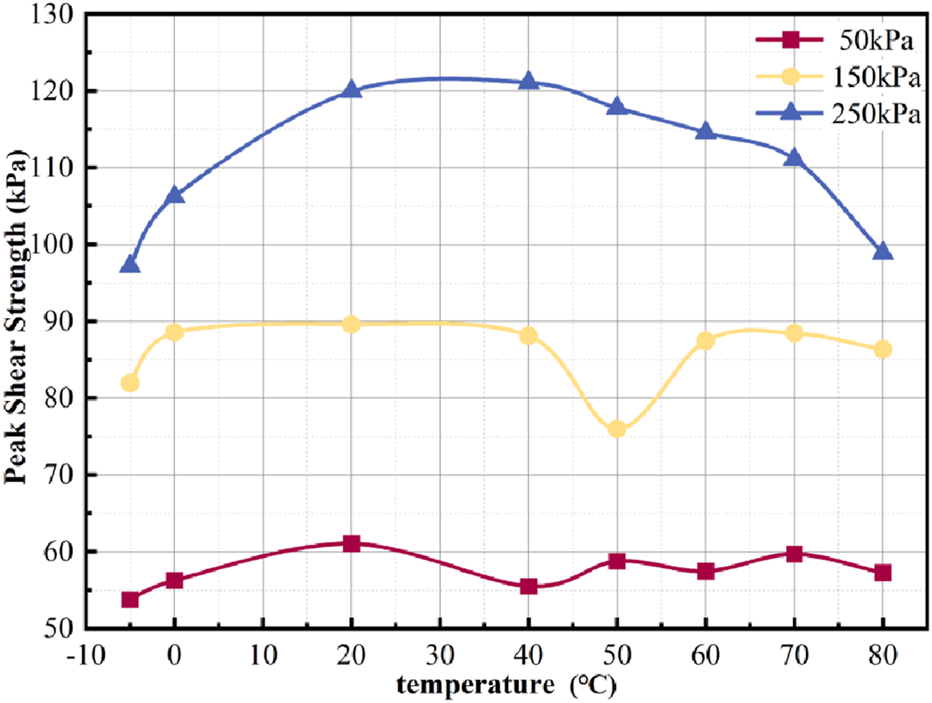
The relationship curves between peak shear strength and temperature.
As shown in Figure 7, the temperature has a significant effect on the peak shear strength of the marine silica sand-geogrid interface, with distinct stages characterizing the trend of its change. Specifically, an upward trend in interfacial shear strength is noted as the temperature shifts from −5 °C to 20 °C, which indicates that moderate warming can enhance the contact between the particles and the stiffness of the grating material, thus improving the interface shear resistance. When the temperature further rises to 80 °C, the maximum shear strength of the interface as a whole shows a decreasing trend, which reflects that under high-temperature conditions, the friction between the particles of soil is weakened. The thermal softening effect of the grating material gradually appears, which reduces the interfacial shear resistance. For example, in the case of 250 kPa normal stress, the maximum shear strength at the interface increases from 97.17 to 119.94 kPa when the temperature rises from −5 °C to 20 °C and then decreases to 98.86 kPa when the temperature increases further to 80 °C, which is typical of the characteristic of “first increase, then decrease”. Moreover, for the marine silica sand–geogrid interface, the temperature sensitivity of peak shear strength variation exhibits significant differences under different normal stress conditions. Overall, the peak shear strength is most responsive to temperature variations at a normal stress of 250 kPa, followed by 50 kPa, and least responsive at 150 kPa. For example, when the temperature decreases from 20 °C to −5 °C, the peak shear strength under 250 kPa decreases from 119.94 kPa to 97.17 kPa, a reduction of 18.99%; under 50 kPa, it decreases from 61 kPa to 53.75 kPa, a reduction of 11.97%; and under 150 kPa, it decreases from 89.58 kPa to 81.94 kPa, with a reduction of only 8.53%. Similarly, when the temperature increases from 20 °C to 80 °C, the peak shear strength under 250 kPa decreases from 119.94 kPa to 98.86 kPa, a reduction of 17.58%; under 50 kPa, it decreases from 61 kPa to 57.25 kPa, a reduction of 6.23%; and under 150 kPa, it only decreases from 89.58 kPa to 86.36 kPa, with a reduction of 3.6%. The response of the peak shear strength at the marine silica sand-geogrid interface under changing temperature conditions showed some normal stress dependence and temperature range differences. When the sample temperature was lowered from 20 °C to −5 °C (25 °C), the peak interfacial shear strength decreased by 18.99%, 11.97%, and 8.53% under 250 kPa, 50 kPa, and 150 kPa normal stresses, correspondingly. When the temperature was increased from 20 °C to 80 °C (60 °C), the shear strength decreased by 17.58%, 6.23%, and 3.60%, respectively. Although the temperature change is larger in the warming process, the strength decay under the same normal stress is significantly lower than that in the cooling process, which indicates that The peak interfacial strength shows greater sensitivity to temperature variation during the cooling phase (0 °C–20 °C) than in the warming phase (20 °C–80 °C).To further elucidate the temperature dependence of the sand–geogrid interface, the variation characteristics under different normal stress levels are analyzed in detail as follows.Within the temperature range of 20 °C–80 °C, the peak interfacial shear strength exhibits pronounced variations under different normal stress levels. At 50 kPa, the strength remains essentially within 55–62 kPa, showing only minor fluctuations, which indicates that the influence of temperature on the frictional behavior of the sand–geogrid interface is limited under low stress conditions. At 150 kPa, the strength remains relatively stable between 20 °C and 40 °C, but a marked reduction occurs at 50 °C, followed by a recovery at 60 °C–70 °C. This suggests that under medium stress levels, temperature changes may trigger a nonlinear response in both the surface friction coefficient and the interlocking effect of the geogrid. At 250 kPa, the shear strength increases with temperature, reaching a peak around 30 °C, and then gradually decreases as the temperature continues to rise. This implies that while moderate temperature increases can enhance interfacial performance, excessive temperatures may reduce the stiffness of the geogrid material and weaken its load-bearing capacity.
To quantitatively analyze the variation trend in the interface’s dynamic mechanical behavior, the maximum positive/reverse shear stresses during cyclic shear loading versus the number of cycles at different temperatures are given in Figure 8.
FIGURE 8
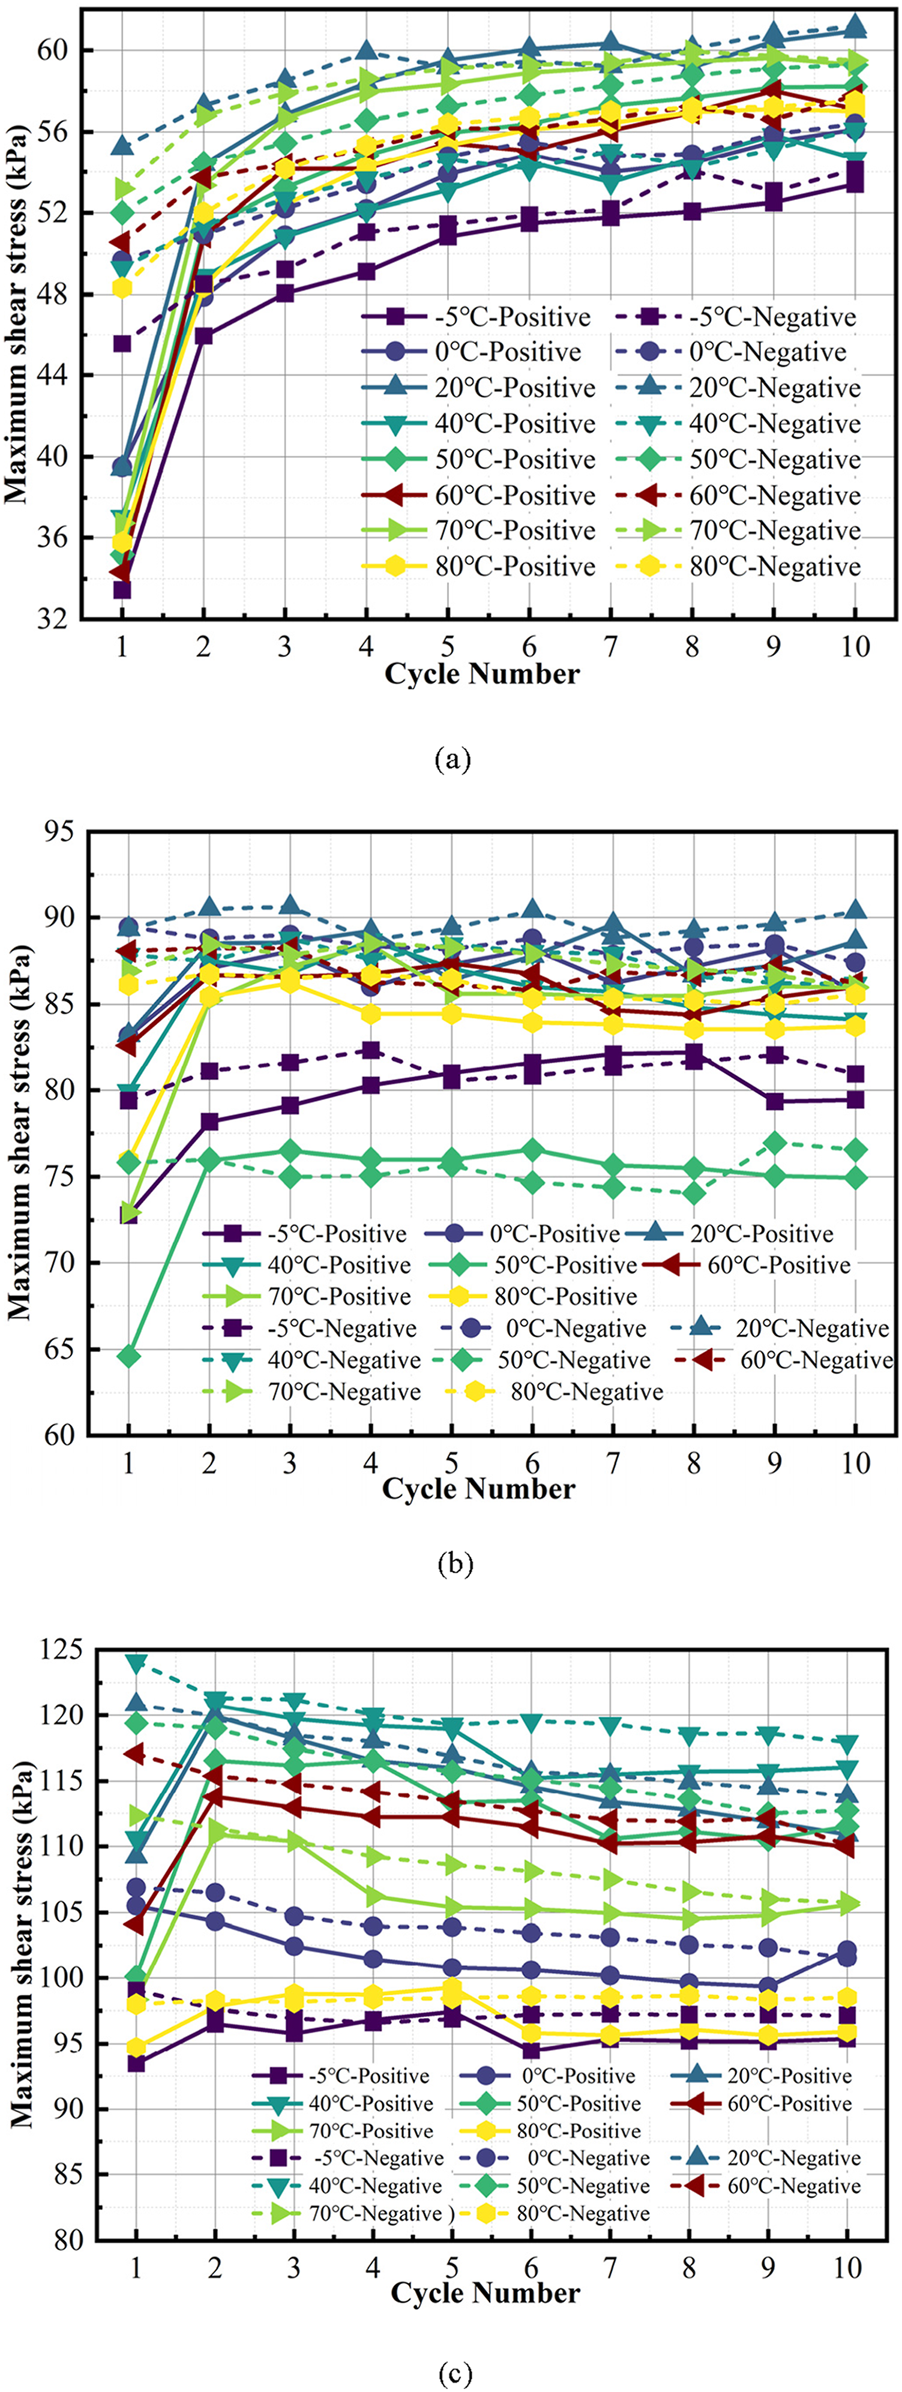
The relationship curves between the positive/negative maximum shear stress and shear cycle number. (a) Normal stress 50 kPa; (b) Normal stress 150 kPa; (c) Normal stress 250 kPa.
As shown in Figure 8, under the condition of 50 kPa normal stress, the maximum positive and negative shear stresses at the interface of marine silica sand-geogrid gradually increase with the increase of cyclic shear number at different temperatures, which shows the typical cyclic shear hardening behavior. When the normal stress is 150 kPa, the maximum positive shear stress of the interface increases gradually in the early cyclic stage. Then it tends to stabilize, which presents the characteristic of “hardening first and then stabilizing.” In contrast, the maximum negative shear stress tends to be stable on the whole. In contrast, under the 250 kPa normal stress, the interface experiences an initial increase in maximum positive shear stress, which later diminishes with further cycling, which shows the two-stage evolution law of “hardening-softening”; at the same time, the maximum negative shear stress decreases continuously at different temperatures, which reflects the more obvious cyclic shear softening characteristics.
For the marine silica sand-geogrid interface, the cyclic shear process generally exhibits the characteristic that the maximum negative shear stress is larger than the maximum positive shear stress. Especially in the first cycle, the difference in shear stress is most significant and then drops with increasing shear cycles, and this trend is more obvious under low normal stress (e.g., 50 kPa) conditions. Meanwhile, the temperature change also has a significant effect on the evolution of the maximum positive and negative shear stress at the interface. Specifically, the maximum positive and negative shear stresses of the interface increase gradually when the temperature increases from −5 °C to 20 °C and then decrease with a temperature elevation to 80 °C. This pattern of change is consistent with the temperature-dependent trend of the peak cyclic shear strength of the interface in Figure 6. To further quantify the influence of temperature on the interfacial shear performance, the temperature sensitivity coefficient γ of the maximum positive/negative shear stress is introduced to characterize the sensitivity of the interfacial shear response to the changes in the thermal environment. The temperature sensitivity coefficient is calculated according to Equation 1
, , represent the maximum positive shear stress and maximum reverse shear stress of the first cyclic shear cycle at the interface of marine silica sand-geogrid and indicate the number of cycles. In this test, the number of cycles is 10 times, and the sensitivity coefficient γ of the positive/negative maximum shear stress change is obtained as the temperature dependence curve, as shown in Figure 9.
FIGURE 9
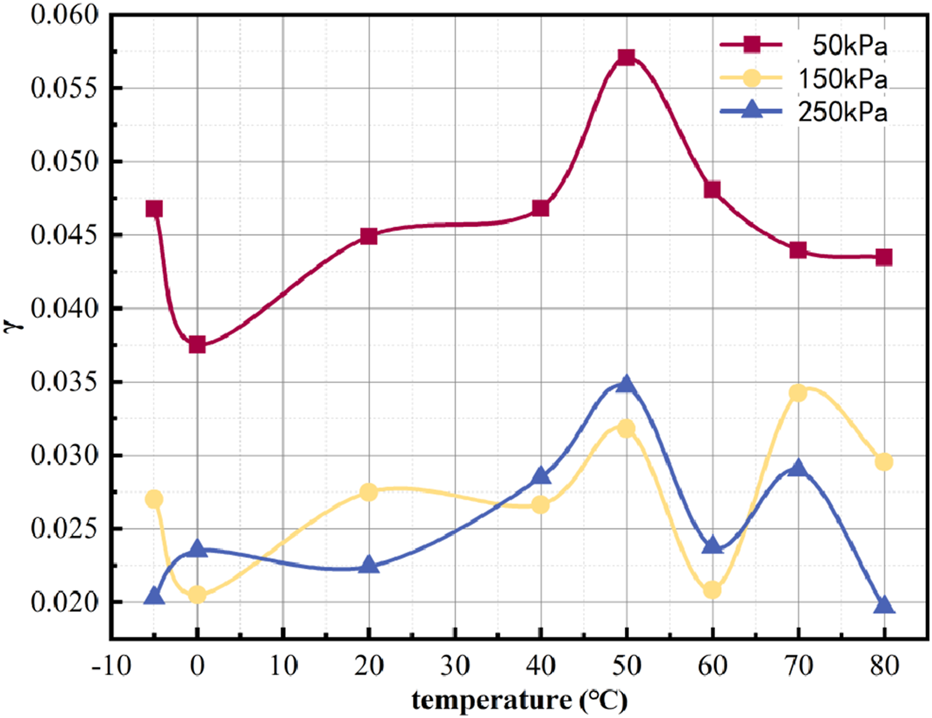
The relationship curves between the sensitivity factor for positive/negative maximum shear stress change γ and temperature.
As shown in Figure 9, changes in temperature have a pronounced effect on the sensitivity coefficient γ corresponding to both positive and negative maximum shear stresses. Overall, when the temperature increases from 0 °C to 50 °C, γ shows an increasing trend, which indicates that the higher the temperature in this interval, the difference between the positive and negative maximum shear stresses in each cycle increases, the amplitude of shear stress fluctuation intensifies, and the interface shear strength exhibits an enhanced response to temperature changes. On the contrary, when the temperature continues to increase to 60 °C, γ gradually decreases, which implies that the shear stress difference decreases. The response of the interface to the temperature change is weakened.
During the temperature decrease from 20 °C to −5 °C, the variation of γ is strongly dependent on the normal stress level. At 50 kPa, γ shows the largest fluctuation, following a “decrease–increase” pattern: at the early stage of cooling (near 0 °C), the interlocking effect between particles is weakened, which reduces the asymmetry of positive and negative shear stress responses, leading to a decrease in γ. With further cooling, however, the frictional resistance at the sand–geogrid interface is enhanced, which enlarges the shear stress difference and raises γ. At 150 kPa, γ also exhibits a “decrease–increase” trend, but the amplitude is smaller than that at 50 kPa, suggesting a relatively weaker sensitivity. In contrast, at 250 kPa, γ only undergoes slight fluctuations and follows an “increase–decrease” pattern, reflecting that under high normal stress the temperature effect is suppressed and the interface response becomes less sensitive.
In the high-temperature range of 60 °C–80 °C, γ exhibits pronounced stress dependence. At 50 kPa, γ decreases slightly and then tends to stabilize, indicating that further heating has limited influence under low stress conditions. At 150 kPa, γ increases again and reaches a local peak around 70 °C, suggesting that the positive–negative shear stress difference is re-amplified under medium stress. At 250 kPa, γ drops sharply near 60 °C but subsequently recovers to some extent, reflecting a competition between the weakening of geogrid stiffness and the strengthening of particle interlocking at high temperatures. However, from 70 °C to 80 °C, γ decreases consistently under all stress levels, confirming that excessive heating ultimately reduces the positive–negative shear stress difference at the interface.
3.2 Effect of temperature on cyclic normal displacement at the marine silica sand-geogrid interface
To explore the expansion and contraction behaviors exhibited by the marine silica sand-geogrid interface during cyclic shear, Figure 10 demonstrates the evolution of the relationship between the normal displacement and shear displacement of this interface under different temperature conditions.
FIGURE 10
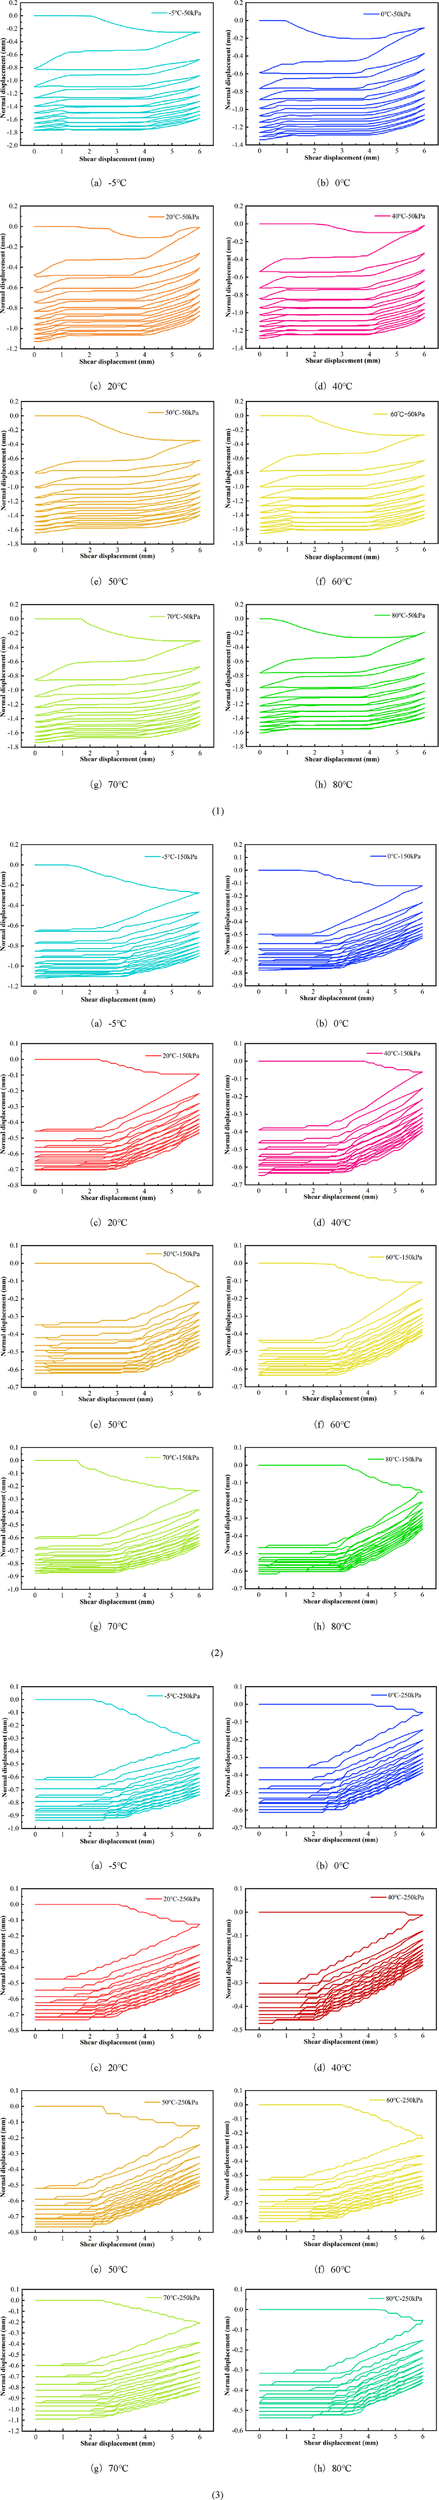
The relationship curves between the cyclic shear normal displacement and shear displacement of the marine silica sand-geogrid interface. (1) Normal stress 50 kPa; (2) Normal stress 150 kPa; (3) Normal stress 250 kPa. (a) -5 °C. (b) 0 °C. (c) 20 °C. (d) 40 °C. (e) 50 °C. (f) 60 °C. (g) 70 °C. (h) 80 °C.
As shown in Figure 10, temperature has a significant impact on the relationship between normal displacement and shear displacement at the marine silica sand-geogrid interface. Overall, with increasing cycles, the normal displacement shows a gradual decreasing trend, which reflects that the interface exhibits obvious cyclic shear shrinkage characteristics in the shear process. The normal displacement becomes progressively larger with a temperature increase from 40 °C to 70 °C, which indicates that the interfacial shear shrinkage effect is enhanced under high-temperature conditions. In comparison, the magnitude of normal displacement is relatively small in the two temperature intervals from −5 °C to 40 °C and from 70 °C to 80 °C, which indicates that the enhancement of cyclic shear shrinkage characteristics by temperature rise in this temperature range is not apparent.
3.3 Effect of temperature on dynamic mechanical property indexes of marine silica sand-geogrid interface
Dynamic interface shear stiffness and damping ratio are two important indicators for studying the dynamic mechanical properties of the soil-geosynthetics interface (Nye and Fox, 2007). The dynamic interfacial shear stiffness indicates the ability of the soil-geosynthetic interface to resist dynamic shear loads and is calculated according to Equation 2 and Figure 11.
FIGURE 11
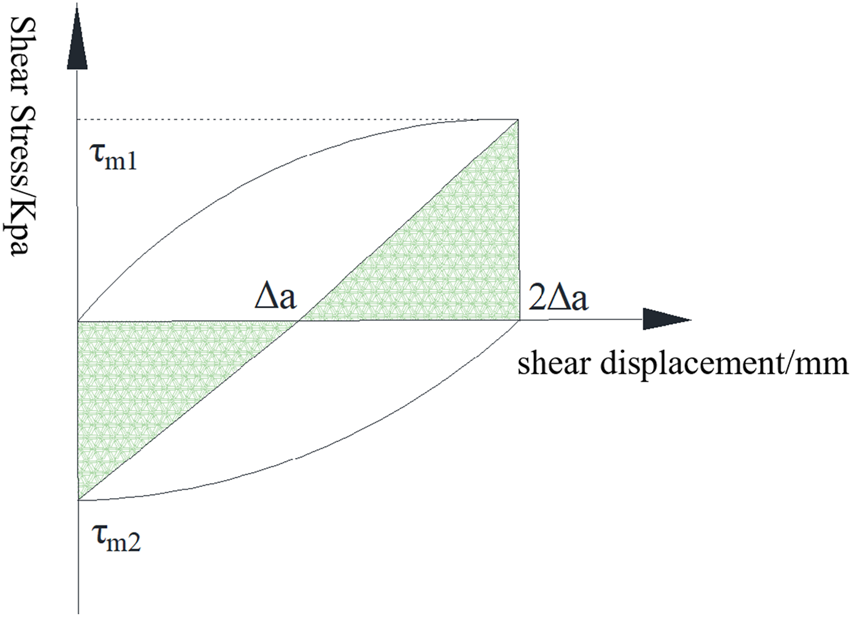
Schematic diagram of shear stiffness and damping ratio calculation.
and are the shear stiffnesses along different shear directions; and are the maximum shear stresses along different shear directions; is the magnitude of the shear displacement.
Figure 12 displays the variation in shear stiffness with cyclic loading at the marine silica sand–geogrid interface under different temperatures.
FIGURE 12
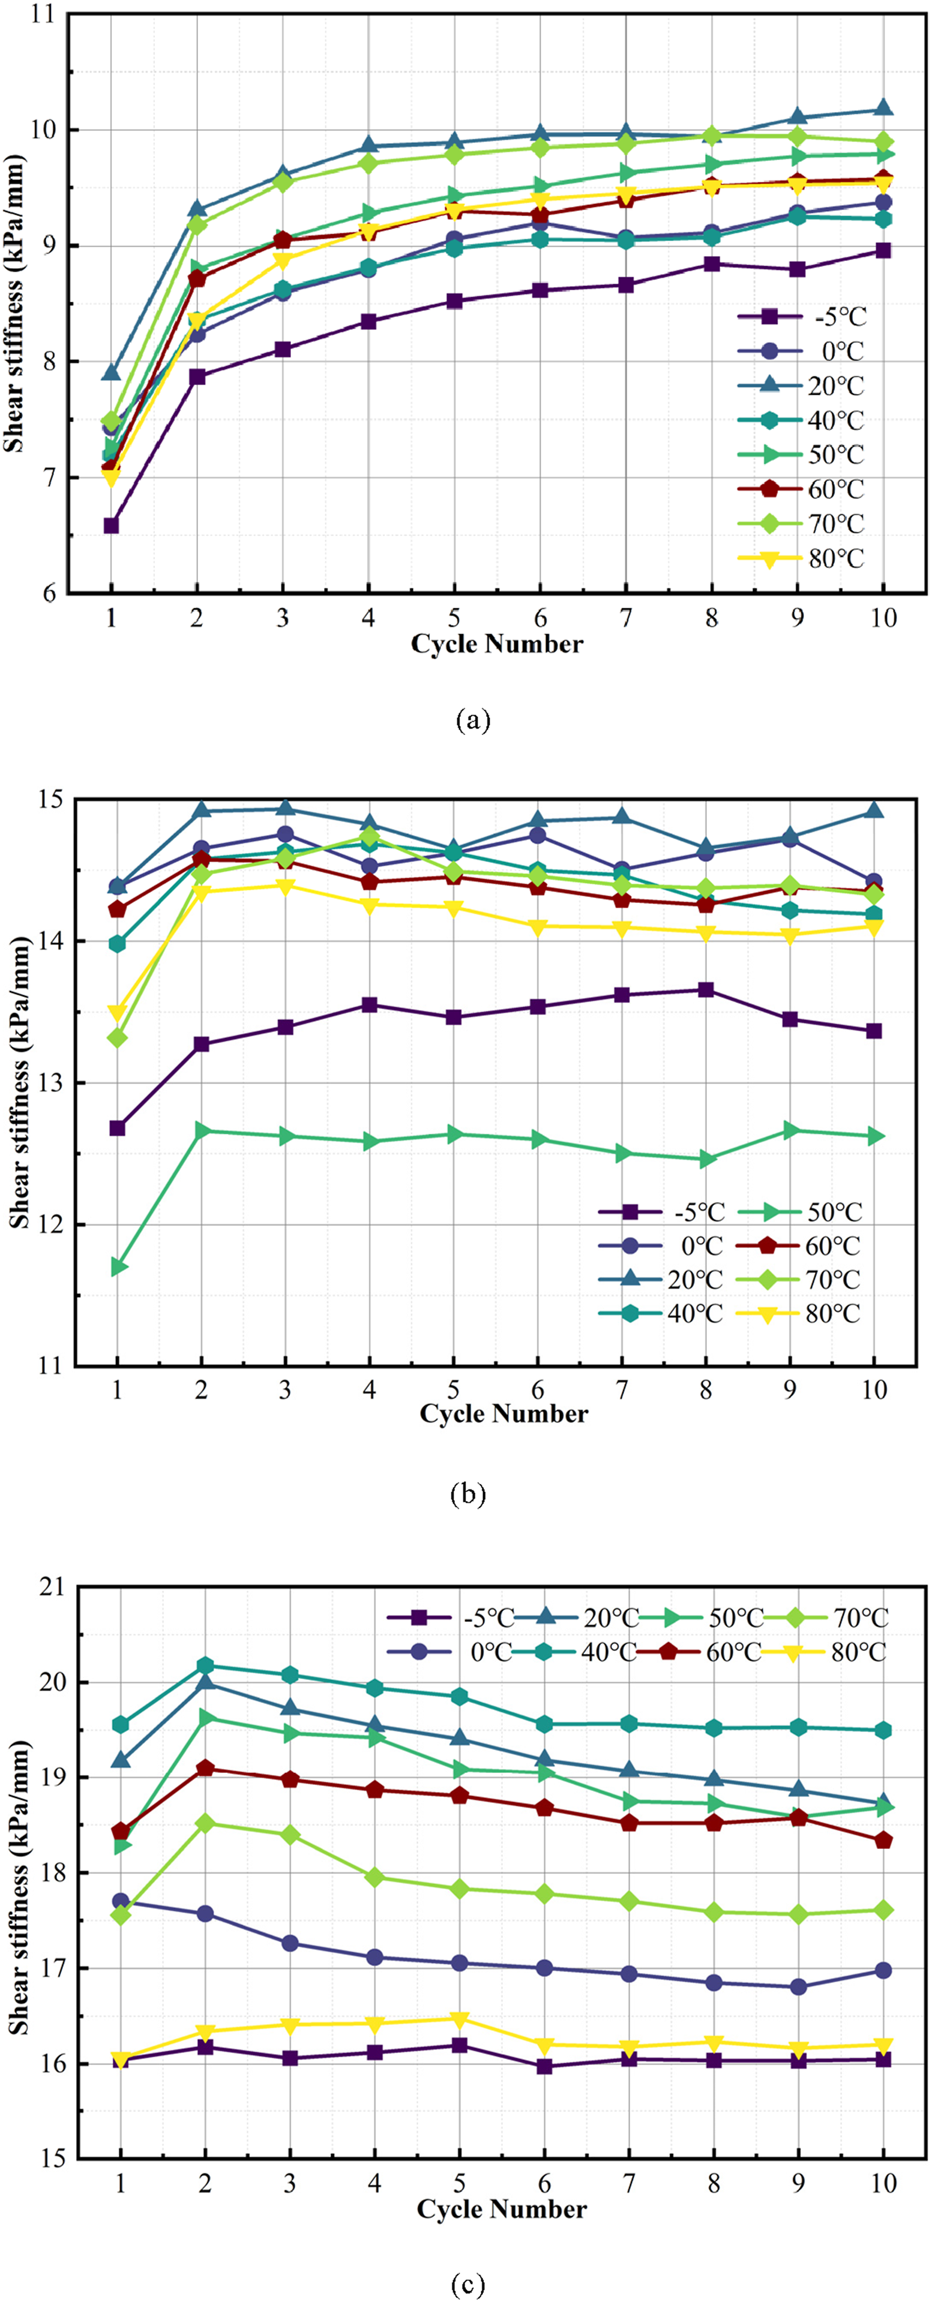
The relationship curves between dynamic shear stiffness and cyclic shear number. (a) Normal stress 50 kPa; (b) Normal stress 150 kPa; (c) Normal stress 250 kPa.
As shown in Figure 12, when the normal stress is 50 kPa, the dynamic shear stiffness of the response of the marine silica sand–geogrid interface strengthens with increasing cycles, indicating that the interface’s resistance to dynamic shear load also continues to rise. When the normal stress increases to 150 kPa, the dynamic shear stiffness first rises and then tends to stabilize with the number of shear cycles at various temperatures, and finally reaches a stable residual strength value, which indicates that the interface strength is enhanced and then enters a stable state. Under the condition of higher normal stress of 250 kPa, the dynamic shear stiffness shows a tendency to increase and then decrease, which indicates that the interfacial resistance is enhanced at the initial stage and then degraded. In addition, the number of shear cycles required for the interface to reach the maximum dynamic shear stiffness decreases significantly with the increase of normal stress under different temperature conditions. This is because the larger normal stress promotes the rapid densification of soil particles at the early stage of cycling, which enhances the embedded locking effect between the soil and the grids and makes it easier for the interface to develop to the state of maximum shear stiffness.
Under cyclic shear loading, the maximum dynamic shear stiffness of the marine silica sand-geogrid interface showed significant differences under different temperature conditions. In general, the interface stiffness shows an increasing trend as the temperature moves from −5 °C to 20 °C. However, the maximum dynamic shear stiffness decreases when the temperature increases to 80 °C. The maximum dynamic shear stiffness of the interface is also found to decrease when the temperature increases to 80 °C. To deeply explore the influence of the temperature factor on the shear stiffness of this interface, the relationship curve between temperature and the average dynamic shear stiffness of the interface was plotted, as shown in Figure 13.
FIGURE 13
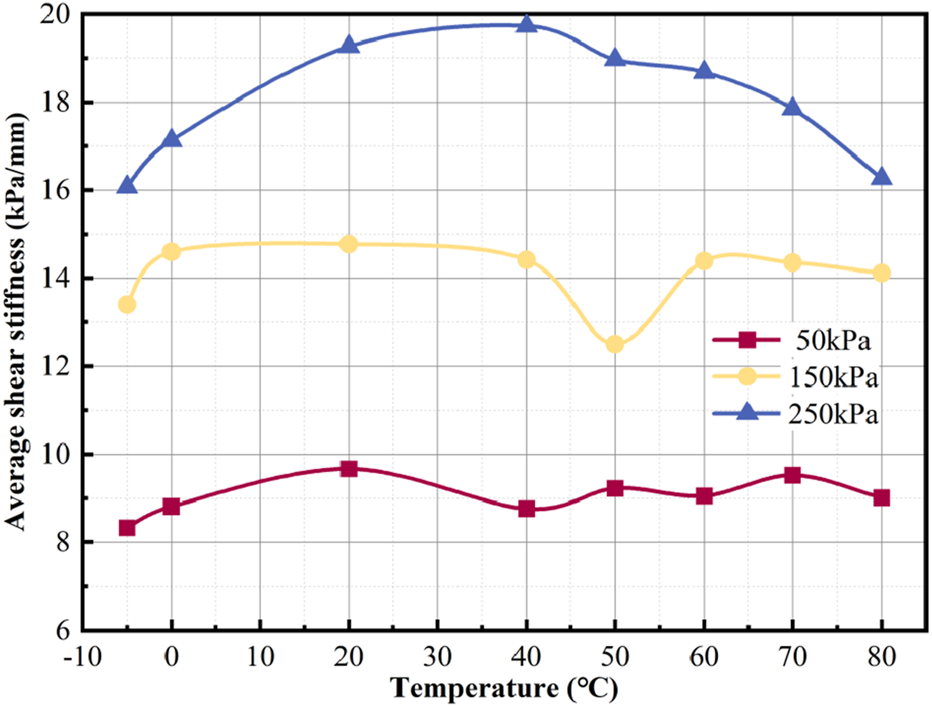
The relationship curves between average dynamic shear stiffness and temperature.
As shown in Figure 13, the average dynamic shear stiffness at the marine silica sand–geogrid interface is greatly influenced by changes in temperature. As the temperature increases from −5 °C to 20 °C, the average stiffness of the interface gradually increases, and when the temperature continues to increase to 80 °C, the overall trend of this stiffness decreases. Further analysis reveals that the interface response to temperature is significantly different under different normal stresses: the average dynamic shear stiffness is most sensitive to the temperature change when the normal stress is 250 kPa, with the most significant change; the following change is at 50 kPa, and the interface stiffness is the weakest under the 150 kPa condition. In other words, the change in stiffness is more significant at higher normal stresses for the same range of temperature changes. Although the temperature difference from normal to high temperatures is larger than that from normal to low temperatures, the decrease of the interface stiffness during the warming process is more minor for each normal stress condition, which indicates that the weakening effect of low temperatures on the interface stiffness is more pronounced compared with that of high temperatures.
The damping ratio reflects the structure’s ability to dissipate energy under external excitation, and its value is usually between 0 and 1. (Liu D. et al., 2021; Liu et al., 2022). The specific calculation of the damping ratio is presented in Equation 3 and illustrated in Figure 14.
FIGURE 14
The relationship curves between the damping ratio and the number of cycles. (a) Normal stress 50 kPa; (b) Normal stress 150 kPa; (c) Normal stress 250 kPa.
and are the damping ratios along different shear directions; A is the hysteresis loop area; and are the areas of the shaded regions in Figure 11.
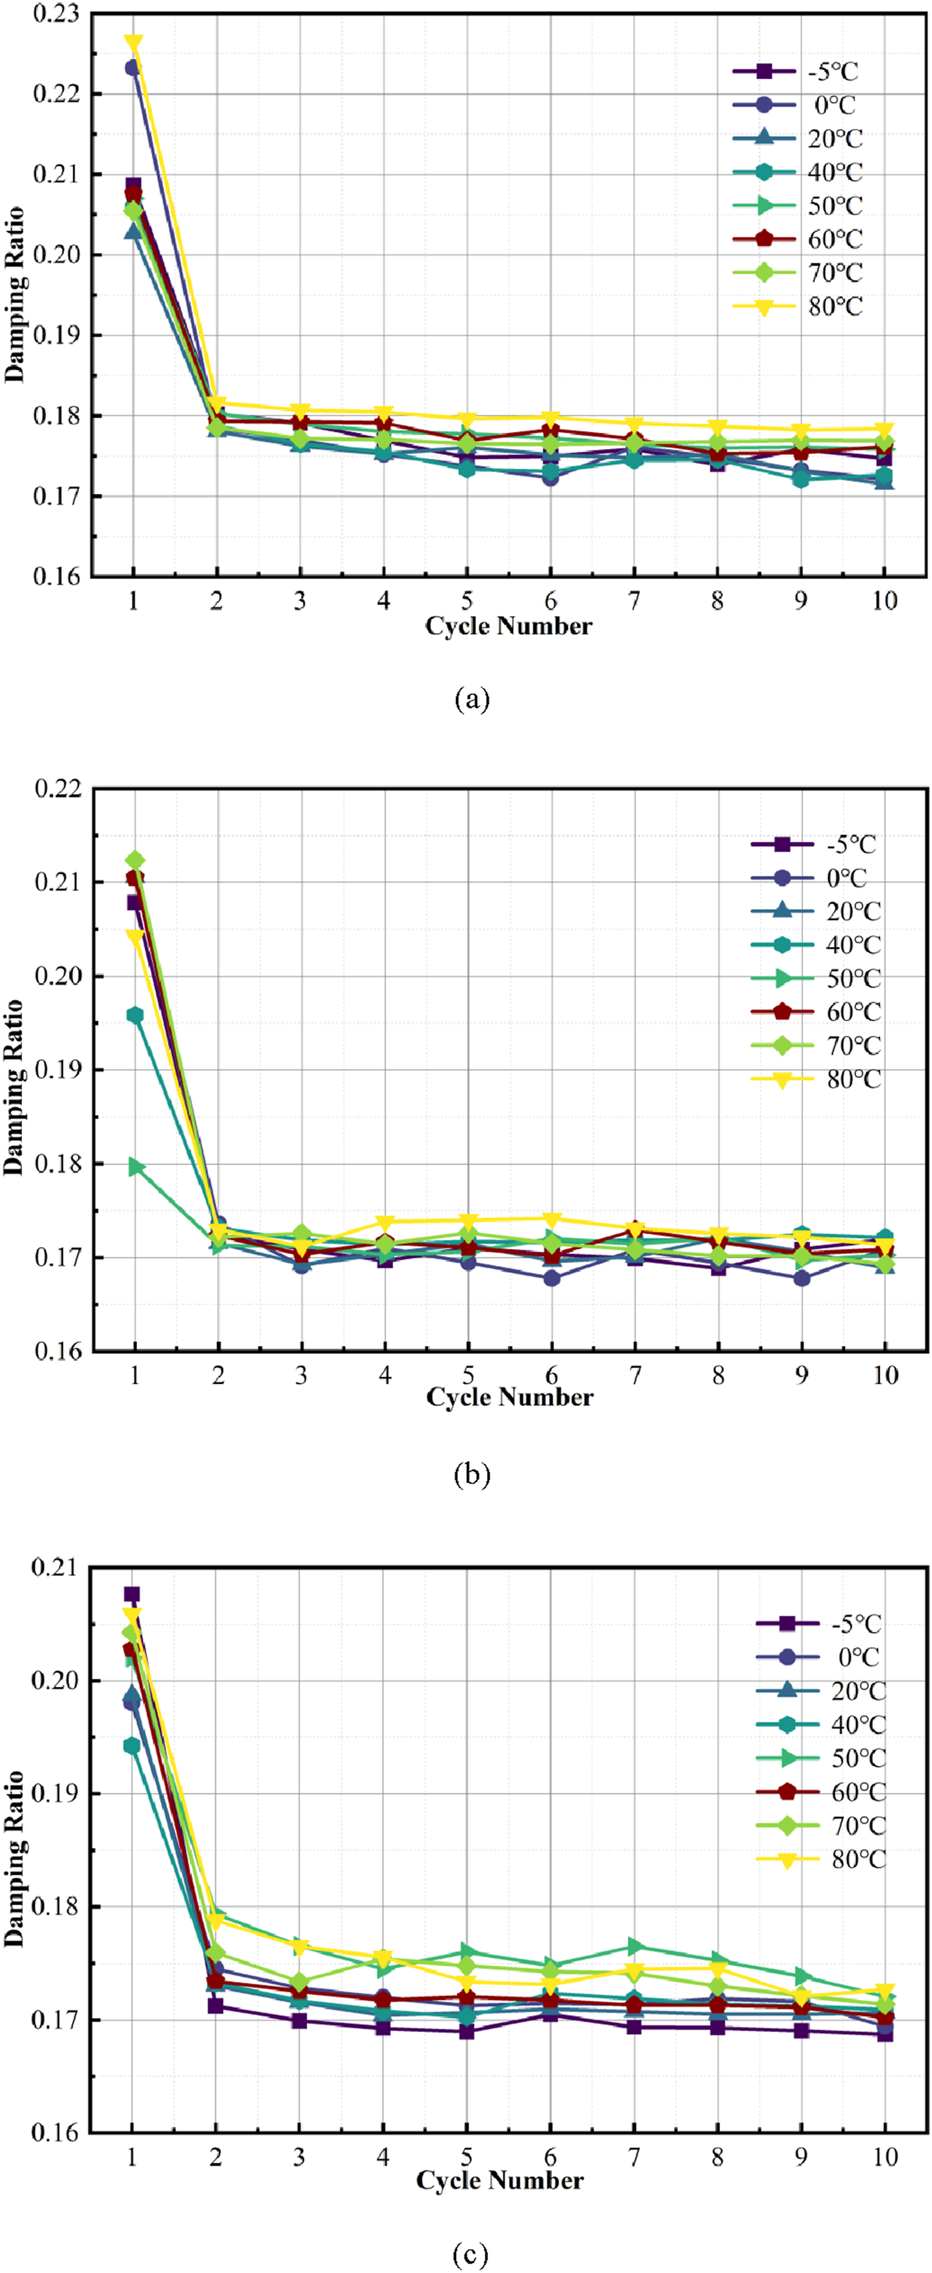
To analyze the influence of temperature variation on the energy dissipation characteristics of the interface, curves showing the variation of damping ratio with the number of cycles at the marine silica sand–geogrid interface were plotted for different temperatures, as shown in Figure 14. The results show that the damping ratio of the marine silica sand-geogrid interface exhibits more significant variability at different numbers of shear cycles compared to the dynamic interface shear stiffness. Overall, the interface exhibits the highest damping ratio in the first shear cycle. Then, the damping ratio decreases rapidly in the subsequent cycle stages and stabilizes after the second to third cycles. This pattern suggests that the marine silica sand-geogrid interface has a high energy dissipation capacity during the initial loading stage. Still, its hysteretic properties degrade as the shear cycle progresses. This phenomenon may be attributed to the significant relative displacement, slip, and crowding behaviors between particles at the interface at the initial stage of shear loading, which results in larger energy dissipation. In contrast, after several cycles, the interface structure tends to be stabilized, the particle rearrangement is completed, and the hysteresis dissipation capacity is relatively weakened. The differences in the damping ratio values of the subsequent cycles are minor, which indicates that the interfacial energy dissipation capacity enters a relatively stable stage.
For a more detailed study of temperature’s impact on the energy dissipation characteristics of the marine silica sand–geogrid interface, Figure 15 shows the relationship curve between the average damping ratio of the interface and temperature. The average damping ratio is obtained by averaging the damping ratios of each cyclic shear stage, reflecting the overall energy dissipation level of the interface under the effect of temperature.
FIGURE 15

The relationship curves between the average damping ratio and temperature.
As seen in Figure 15, temperature has a significant effect on the average damping ratio at the marine silica sand-geogrid interface. In two specific temperature intervals (0 °C–50 °C and 70 °C–80 °C), the interface average damping ratio generally tends to increase with increasing temperature, which indicates that warming helps to improve the energy dissipation capacity of the interface. A further reduction in temperature from 0 °C to −5 °C leads to significant differences in the damping ratio response for different normal stress levels: the average damping ratio increases for both the 50 and 150 kPa normal stress conditions, and decreases for the 250 kPa condition. This suggests that under the combined effect of low temperature and low normal stress, the interface is more likely to reach the hysteretic regression steady state and exhibits a stronger energy dissipation ability. However, with an increase in normal stress, the effect of low temperature gradually diminishes and can even reverse the damping ability. Similarly, in the high-temperature interval from 50 °C to 80 °C, the change in damping ratio shows a more complex trend: under 50 kPa and 150 kPa normal stress, the average damping ratio changes less in the first period and then rises significantly, while under 250 kPa, the damping ratio decreases and then rises. This indicates that the activation of the interface state by temperature increase is more evident under the high temperature-low normal stress condition, but when the normal stress is higher, the high temperature may, on the contrary, trigger the behaviors of particle slippage and grid softening, which leads to the reduction of the energy dissipation capacity for a while, and then the enhancement of energy dissipation capacity after the completion of the structural adjustments.
To achieve rapid quantitative prediction of the interfacial mechanical response, this study further constructed a prediction model based on the Back propagation neural network (BPNN) (see Figures 16,17). Taking normal stress, temperature, normal displacement, and shear displacement as input parameters, and the interfacial peak shear stress as the output parameter, this model can effectively learn the complex nonlinear coupling relationship between temperature and mechanical effects, thereby accurately characterizing the mechanical response law of the marine silica sand–geogrid interface. The prediction results and fitting analysis show that within the temperature range (−5 °C–80 °C) and normal stress levels (50 kPa, 150 kPa, 250 kPa) involved in this study, the model can accurately capture the variation trend of the interfacial peak shear stress, and the predicted values are highly consistent with the measured values. The coefficient of determination (R2 > 0.96) and regression slope of the model are close to 1, which confirms that the model has extremely high prediction accuracy and low systematic error. The BP neural network model constructed in this study not only verifies the effectiveness of this method in capturing the interfacial nonlinear stress response but also provides reliable technical support for the rapid prediction of interfacial mechanical properties, as well as the engineering design and stability evaluation of reinforced marine structures.
FIGURE 16
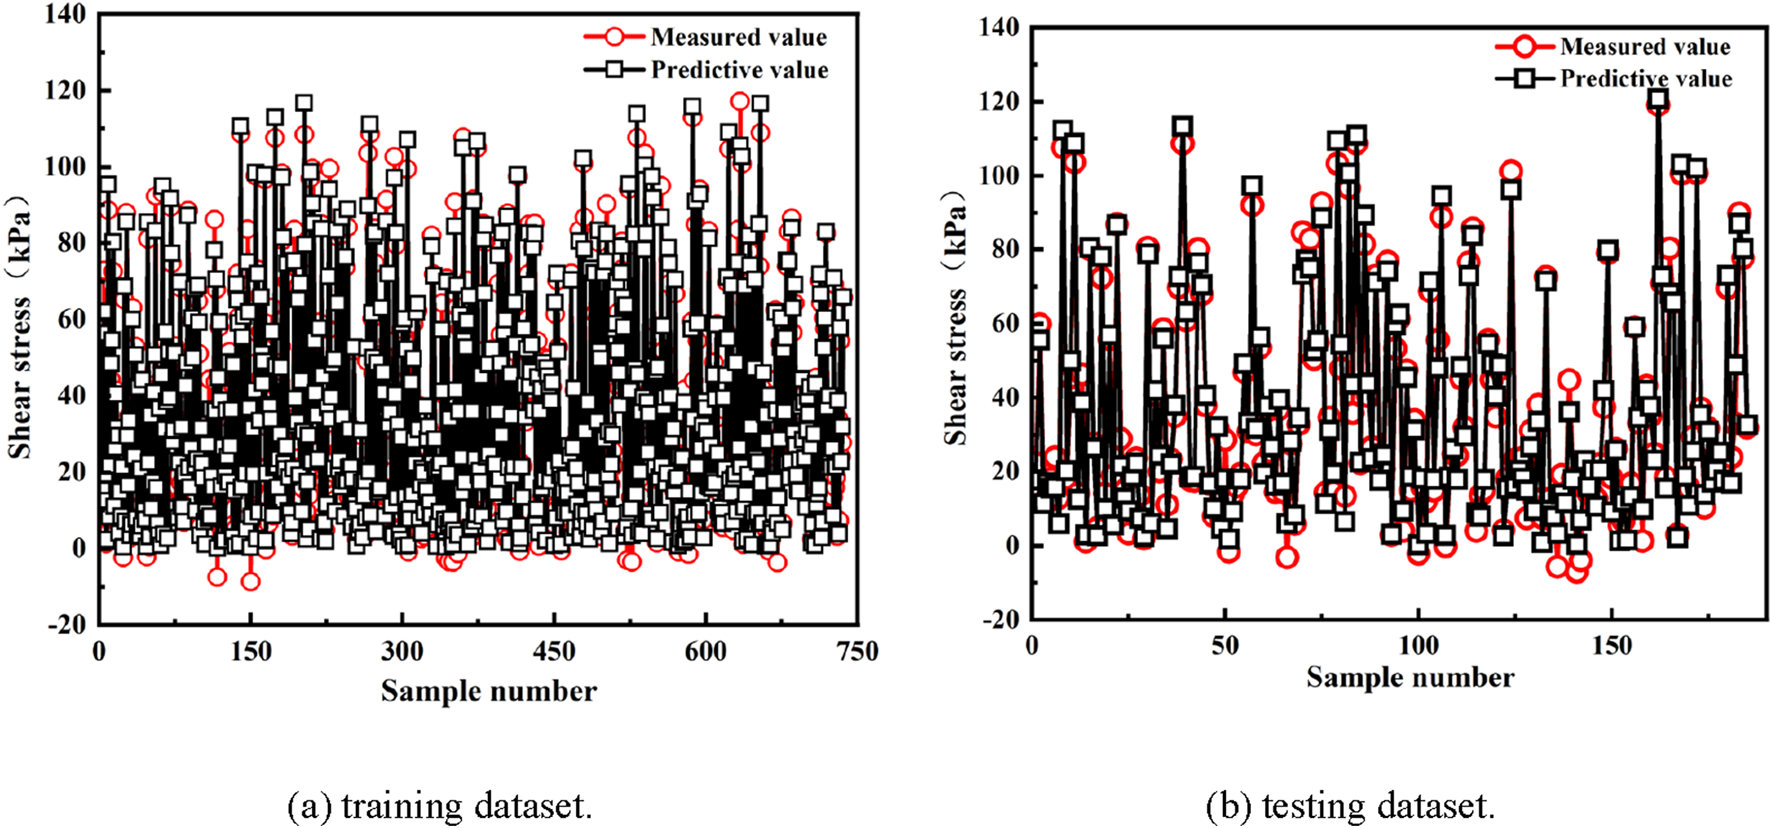
Predictive and measured values on dataset. (a) training dataset. (b) testing dataset.
FIGURE 17
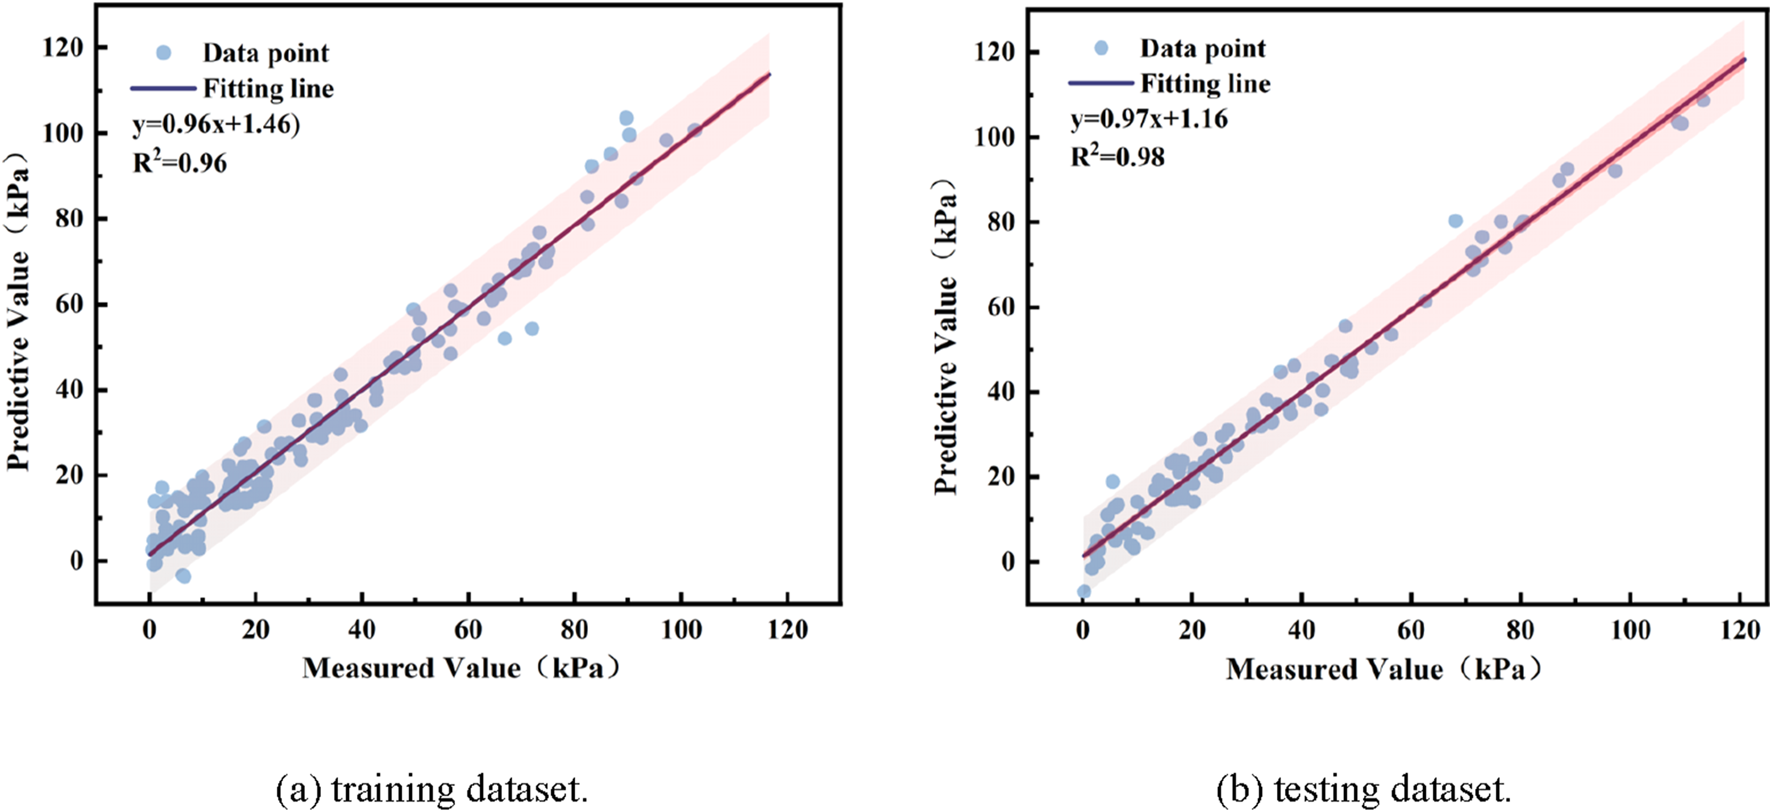
Prediction results on training\testingdatasets. (a) training dataset. (b) testing dataset.
4 Discussion
In this paper, the mechanical behavior exhibited at the marine silica sand–geogrid interface during cyclic shear was systematically investigated through temperature-controlled dynamic direct shear tests across a wide temperature range (−5 °C–80 °C) and multiple normal stress levels (50, 150, and 250 kPa). The results indicate that the interface behavior is affected to a certain extent by normal stress level and temperature changes, and its shear strength evolution, stiffness response, and energy dissipation capacity exhibit more pronounced stages and nonlinear characteristics.
The evolution of the peak shear stress at the interface with the number of shear cycles exhibits a typical staged response under different normal stress conditions. Under the low normal stress (50 kPa) condition, the interface displays a continuous shear-hardening behavior, and the shear stress increases steadily with the number of cycles. This is because, under the initial loose state, the interface structure is continuously compacted through repeated perturbation. As a result, the contact area and normal contact force between sand particles increase, which in turn enhances the friction resistance and embedded locking effect, thereby continuously improving the interface shear bearing capacity. Under the condition of medium normal stress (150 kPa), the peak interfacial shear stress rises rapidly in the initial cycle, and then tends to stabilize, indicating that the interfacial structure densifies rapidly at this stress level, and the shear strength does not change significantly after approaching the residual state. Under the high normal stress (250 kPa), the peak shear stress at the interface shows the characteristic of rising first and then falling, which reflects that the interface can still be hardened at the early stage of shear, however, with the accumulation of the cycle, the grid nodes are deformed locally due to the continuous compressive stress, and the sand particles embedded in them are fatigued due to embedded locking structure, and the relative slippage increases, which leads to a decrease in the structural integrity of the interface and a consequent weakening of the interface. The structural integrity decreases, and the shear strength is weakened.
A significant nonlinearity also characterizes the influence of temperature fluctuations on the interfacial shear behavior. During the warming process from −5 °C to 20 °C, the peak interfacial shear stress, the maximum positive/negative shear stress, and the dynamic shear stiffness all showed an upward trend. At this stage, the temperature increase reduces the pore water viscosity between sand particles, which is conducive to particle rearrangement and contact reconstruction (See Figure 18). The reduction in pore water viscosity and its subsequent effect on inter-particle friction and effective stress is a key coupled mechanism, the importance of which is supported by thermo-poroelastic modeling in other geotechnical contexts (Pirhadi et al., 2025).At the same time, the grating material maintains a high modulus of elasticity and nodal stiffness, which enhances the embedded locking and shear capacity of the interface. 20 °C can be regarded as the threshold for the thermal enhancement effect. When the temperature is further increased to 80 °C, the interface strength and stiffness decrease. This is because the polypropylene grating in the high temperature occurred significant thermal softening, its modulus of elasticity and node deformation resistance decreased, cannot effectively support the embedded sand particles to form a stable lock (See Figure 19). At the same time, high temperature exacerbated the tendency of inter-particle slippage, the interface resistance to decline, the embedded locking structure into the slippage, and the interface of the overall shear performance degradation.
FIGURE 18
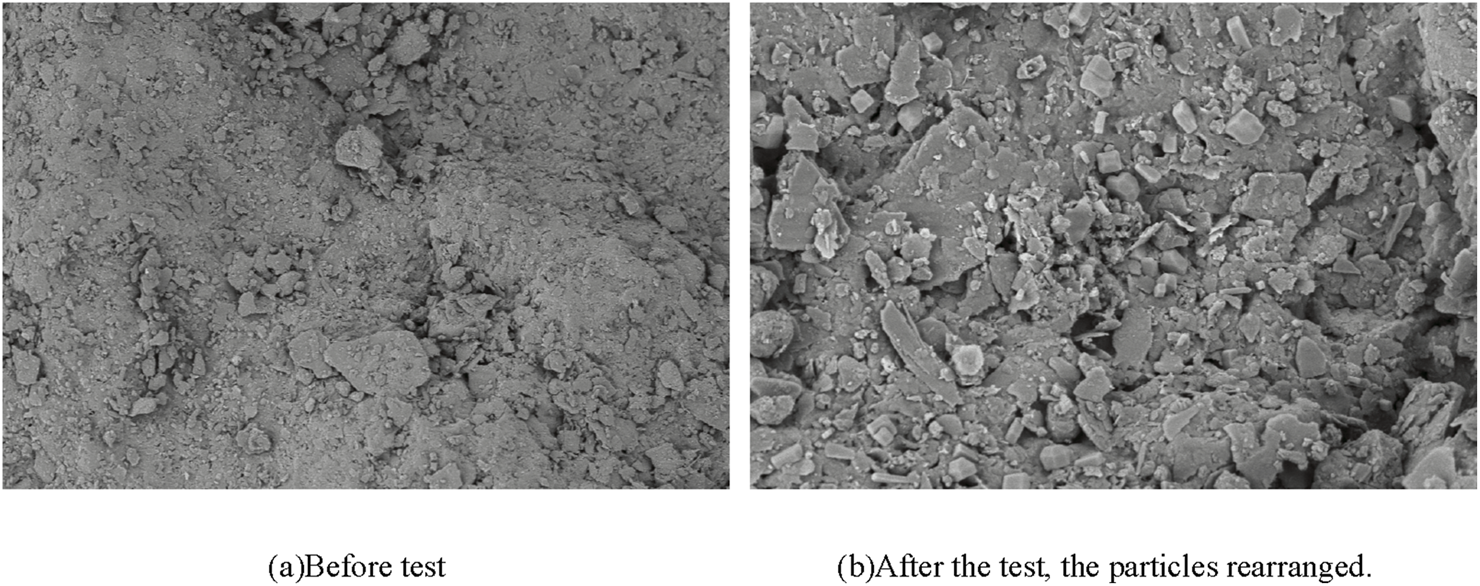
SEM images of silica sand before and after the experiment. (a) Before test. (b) After the test, the particles rearranged.
FIGURE 19
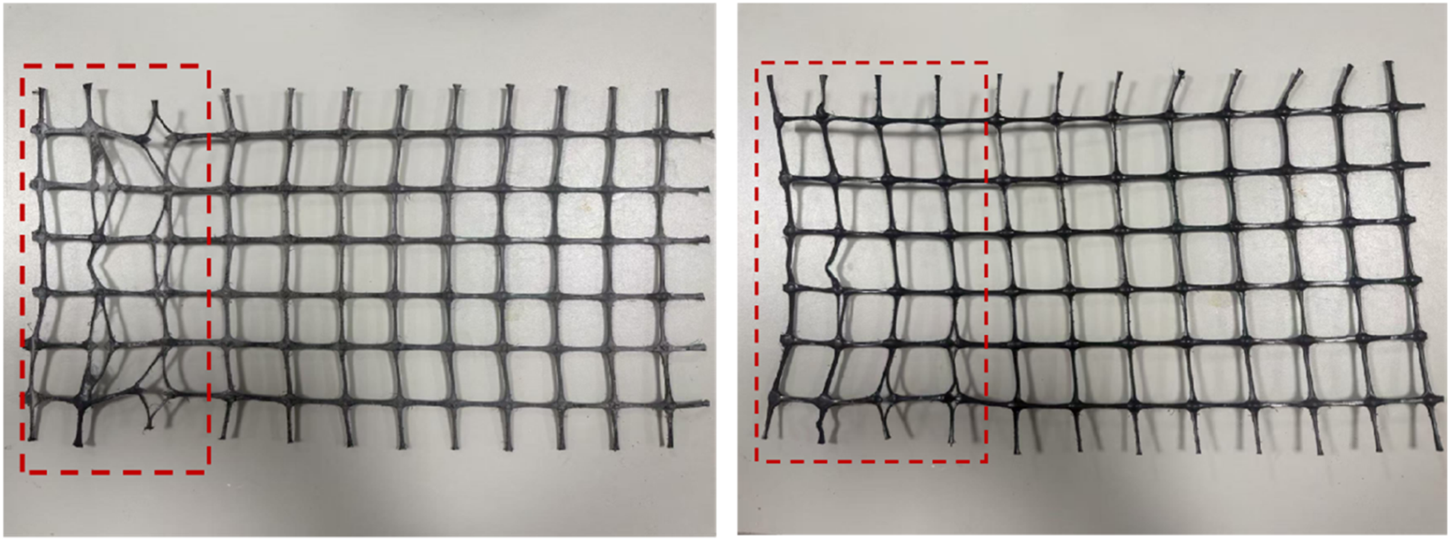
Samples of geogrids after testing.
The normal stress level has a moderating effect on the interface temperature sensitivity. Under 250 kPa normal stress, the interface peak shear strength is the most sensitive to temperature change, mainly because the high normal stress makes the sand particles more deeply embedded in the node region of the grating, which makes the grating a localized force concentration. It is more likely to soften and deform under the action of high temperature, which amplifies the effect of temperature on the structural performance. In contrast, the interface strength is least sensitive to temperature change under 150 kPa conditions. At this time, the embedded locking effect is moderate; the grating force deformation has not yet reached a sensitive criticality. The interface structural stability is higher, and the ability to resist temperature interference is stronger. In the 50 kPa condition, although the embedded locking effect is relatively weak, the interface structure still shows a specific response under the temperature change, which indicates that the temperature change cannot be ignored even under the smaller load condition.
5 Conclusion
The interfacial mechanical behavior of marine silica sand and geogrid directly affects the stability and durability of marine fill bodies and reinforced structures, and the significant influence of temperature on mechanical properties is a critical concern across various geotechnical engineering applications, from reinforced soils to wellbore integrity (
Kianoush et al., 2024).This paper, based on the self-developed soil-geosynthetics interface temperature-controlled direct shear test system, systematically studied the dynamic shear mechanical properties of the interface between marine silica sand (particle size of 0.075–2 mm) and bidirectional geogrid in a wide range of temperatures (−5 °C to 80 °C) and multilevel normal stress (50–250 kPa) coupling effect, which fills the lack of experimental data on temperature-influenced mechanisms in existing studies. The results show that there are significant differences in the interfacial cyclic shear response mechanisms under different temperatures and normal stresses, as well as the sensitivity of interfacial shear strength to temperature changes with varying normal stress.
At 50 kPa normal stress, the peak interfacial shear stress increases with the number of cycles, which shows typical shear hardening; at 150 kPa, the peak shear stress first increases and then tends to be stabilized, which reflects the transition from shear hardening to residual strength; at 250 kPa, the maximum shear stress first increases followed by a decrease during the process, and the interfacial behavior shifts from hardening to softening. The observed transition in behavior from hardening to softening could be further classified and predicted using advanced data-driven clustering techniques, similar to those used for characterizing complex reservoir facies.
The peak shear strength and the positive/negative shear stress increase as temperature goes up from −5 °C to 20 °C, and the above indexes decrease when the temperature continues to increase to 80 °C. The peak shear stress increases when the temperature increases from −5 °C to 20 °C.
The sensitivity of the interface to temperature varied significantly among different normal stresses, with 250 kPa being the most significant, 50 kPa the second, and 150 kPa relatively low.
The maximum dynamic shear stiffness of the interface increases before the temperature rises to 20 °C and gradually decreases from 20 °C to 80 °C. Moreover, the interface damping ratio is significantly higher in the first shear cycle than in the subsequent cycles, and then the damping ratio tends to stabilize in the following cycles, and the dependence of the damping ratio on the temperature change is also significant.
Overall, the results of this research have significant implications for practical engineering. By revealing the evolution law of cyclic shear performance, this study provides the foundational data to define a ‘safe design window’ for operating temperatures and stresses, much like the established practice for defining drilling mud windows in geomechanics, thereby ensuring the long-term stability of marine reinforced structures. This understanding is vital not only for structural design but also for mitigating potential geohazards and ensuring environmental protection, aligning with the growing focus on the environmental perspectives of geomechanical stability (Asghari et al., 2025).At the same time, the study reveals that the mechanical response of the interface is highly sensitive to temperature changes, which can inform adaptive design suggestions for engineering applications under extreme climatic conditions. Moreover, the complex, non-linear relationships between temperature, stress, and interface parameters revealed in this study provide a robust dataset that could be used to train predictive machine learning models, such as Artificial Neural Networks (Kianoush et al., 2023), for design purposes.
Statements
Data availability statement
The original contributions presented in the study are included in the article/supplementary material, further inquiries can be directed to the corresponding authors.
Author contributions
XK: Writing – review and editing, Methodology, Supervision, Project administration, Validation, Software. LZ: Visualization, Investigation, Supervision, Software, Conceptualization, Writing – original draft, Formal Analysis, Validation, Methodology, Data curation, Resources. KX: Supervision, Conceptualization, Writing – review and editing, Writing – original draft, Software, Project administration, Validation, Methodology, Formal Analysis, Data curation, Visualization. YL: Writing – review and editing, Methodology, Software, Supervision. PC: Supervision, Methodology, Validation, Conceptualization, Investigation, Writing – review and editing, Data curation, Funding acquisition, Resources, Project administration, Visualization. XP: Writing – review and editing, Methodology, Supervision, Project administration, Validation, Resources, Visualization.
Funding
The author(s) declare that financial support was received for the research and/or publication of this article. The authors would like to acknowledge the consistent support of National Natural Science Foundation of China: Nos 52471290 and 52301327; Project funded by China Postdoctoral Science Foundation: Nos 2024T170217 and 2023M730929; Failure Mechanics and Engineering Disaster Prevention, Key Lab of Sichuan Province: No FMEDP202209; Shanghai Sailing Program: Nos 22YF1415800 and 23YF1416100; Shanghai Natural Science Foundation: Nos 23ZR1426200 and 24ZR1427900; The Shanghai Soft Science Key Project: No 23692119700; Funded by Key Laboratory of Ministry of Education for Coastal Disaster and Protection, Hohai University, No. 202302; Funded by Key Laboratory of Estuarine and Coastal Engineering, Ministry of Transport, No. KLECE202302.
Conflict of interest
The authors declare that the research was conducted in the absence of any commercial or financial relationships that could be construed as a potential conflict of interest.
Generative AI statement
The author(s) declare that no Generative AI was used in the creation of this manuscript.
Any alternative text (alt text) provided alongside figures in this article has been generated by Frontiers with the support of artificial intelligence and reasonable efforts have been made to ensure accuracy, including review by the authors wherever possible. If you identify any issues, please contact us.
Publisher’s note
All claims expressed in this article are solely those of the authors and do not necessarily represent those of their affiliated organizations, or those of the publisher, the editors and the reviewers. Any product that may be evaluated in this article, or claim that may be made by its manufacturer, is not guaranteed or endorsed by the publisher.
References
1
Asghari M. Maleki Z. Solgi A. Ganjavian M. A. Kianoush P. (2025). Geohazard impact and gas reservoir pressure dynamics in the zagros fold-thrust belt: an environmental perspective. Geosystems Geoenvironment4 (2), 100362. 10.1016/j.geogeo.2025.100362
2
Bilgin Ö. Shah B. (2021). Temperature influence on high-density polyethylene geomembrane and soil interface shear strength. Int. J. Geosynth. Ground Eng.7, 66–10. 10.1007/s40891-021-00311-9
3
Chao Z. Shi D. Zheng J. (2024a). Experimental research on temperature–dependent dynamic interface interaction between marine coral sand and polymer layer. Ocean. Eng.297, 117100. 10.1016/j.oceaneng.2024.117100
4
Chao Z. Zhao H. Liu H. Cui P. Shi D. Lin H. et al (2024b). The temperature-dependent monotonic mechanical characteristics of marine sand–geomembrane interfaces. J. Mar. Sci. and Eng.12 (12), 2193. 10.3390/jmse12122193
5
Chao Z. Zhou J. Shi D. Zheng J. (2025). Particle size effect on the mechanical behavior of coral sand–geogrid interfaces. Geosynth. Int.32, 774–790. 10.1680/jgein.24.00143
6
Chen R. Zhao T. Wu Z. Hao D. Xue N. Yuan C. (2023). Experimental investigation on particle breakage behavior of marine silica sand under high-stress triaxial shear. J. Mar. Sci. Eng.11 (9), 1825. 10.3390/jmse11091825
7
Chen J.-F. Liu Z.-N. Gu Z.-A. Zhu Y. Gao J.-L. (2024). Large-scale direct shear test of the interface between coral sand and geogrid. Appl. Ocean Res.153, 104219. 10.1016/j.apor.2024.104219
8
DeMaster D. J. (1981). The supply and accumulation of silica in the marine environment. Geochimica Cosmochimica Acta45 (10), 1715–1732. 10.1016/0016-7037(81)90006-5
9
Ding X. Luo Z. Ou Q. (2022). Mechanical property and deformation behavior of geogrid reinforced calcareous sand. Geotext. Geomembranes50, 618–631. 10.1016/j.geotexmem.2022.03.002
10
Feng X. Zhang J. Yao X. Zhao H. Jiang D. Duan W. et al (2025). Influence of temperature on the static interface interaction of marine silica sand and geogrid. Front. Earth Sci.13, 1600985. 10.3389/feart.2025.1600985
11
Gao J. Yang Y. Zhang H. Xie Z. (2023). Effect of different forms on geogrid tensile properties based on 3D printing technology. J. Thermoplast. Compos. Mater.36 (9), 3771–3790. 10.1177/08927057221123474
12
Gonabadi H. Hosseini S. F. Chen Y. Bull S. (2024). Structural analysis of small-scale 3D printed composite tidal turbine blades. Ocean. Eng.306, 118057. 10.1016/j.oceaneng.2024.118057
13
Karademir T. Frost J. D. (2014). Micro-scale tensile properties of single geotextile polypropylene filaments at elevated temperatures. Geotext. Geomembranes42 (3), 201–213. 10.1016/j.geotexmem.2014.03.001
14
Karademir T. Frost J. D. (2021). Elevated temperature effects on geotextile–geomembrane interface shear behavior. J. Geotechnical Geoenvironmental Eng.147 (12), 04021148. 10.1061/(asce)gt.1943-5606.0002698
15
Kianoush P. Mohammadi G. Hosseini S. A. Keshavarz Faraj Khah N. Afzal P. (2023). ANN-Based estimation of pore pressure of hydrocarbon Reservoirs—A case study. Arabian J. Geosciences16 (5), 302. 10.1007/s12517-023-11373-6
16
Kianoush P. Mesgari F. Jamshidi E. Gomar M. Kadkhodaie A. Varkouhi S. (2024). Investigating the effect of hole size, bottom hole temperature, and composition on cement bonding quality of exploratory Wells in Iran. Sci. Rep.14 (1), 29653. 10.1038/s41598-024-81269-2
17
Landivar Macias A. Jacobsen S. D. Rotta Loria A. F. (2024). Electrodeposition of calcareous cement from seawater in marine silica sands. Commun. Earth and Environ.5 (1), 442. 10.1038/s43247-024-01604-3
18
Liu D. O’Sullivan C. Carraro J. A. H. (2021a). Influence of particle size distribution on the proportion of stress-transmitting particles and implications for measures of soil state. J. Geotechnical Geoenvironmental Eng.147 (3), 04020182. 10.1061/(asce)gt.1943-5606.0002466
19
Liu F. Zhu C. Yuan G. Wang J. Gao Z. Ni J. (2021b). Behaviour evaluation of a gravelly soil–geogrid interface under normal cyclic loading. Geosynth. Int.28 (5), 508–520. 10.1680/jgein.21.00011
20
Liu F. Fu J. Ying M. (2022). Experimental study on cyclic shear characteristics of geogrid and rubber–sand mixture interface. Constr. Build. Mater.357, 129328. 10.1016/j.conbuildmat.2022.129328
21
Luo Z.-g. Ding X.-m. Ou Q. Lu Y.-w. (2024). Macro-microscopic mechanical behavior of geogrid reinforced calcareous sand subjected to triaxial loads: effects of aperture size and tensile resistance. Geotext. Geomembranes52 (4), 526–541. 10.1016/j.geotexmem.2024.01.006
22
Ma Y. Guo J. Wang R. Zhang Q. Zhang Q. Li J. et al (2023). Study on cyclic shear properties of siliceous sand–steel interface under different normal loading conditions. Buildings13 (9), 2241. 10.3390/buildings13092241
23
Nye C. J. Fox P. J. (2007). Dynamic shear behavior of a needle-punched geosynthetic clay liner. J. Geotechnical Geoenvironmental Eng.133 (8), 973–983. 10.1061/(asce)1090-0241(2007)133:8(973)
24
Pirhadi A. Kianoush P. Varkouhi S. Shirinabadi R. Shirazy A. Shirazi A. et al (2025). Thermo-poroelastic analysis of drilling fluid pressure and temperature on wellbore stresses in the mansouri oilfield, SW Iran. Results Earth Sci.3, 100061. 10.1016/j.rines.2025.100061
25
Shi D. Xu K. Chao Z. Cui P. (2025a). Experimental study on mechanical properties of triaxial geogrid reinforced marine coral sand-clay mixture based on 3D printing technology. Front. Mar. Sci.12, 1660611. 10.3389/fmars.2025.1660611
26
Shi D. Xu K. Yu X. Chao Z. Cui P. (2025b). Strength estimation of textured polymer layer-reinforced materials in practical marine engineering based on physical experiments and artificial intelligence modelling. Front. Mar. Sci.12, 1653741. 10.3389/fmars.2025.1653741
27
Tamilarasan A. Suganya O. (2024). Investigation on the properties of sustainable alkali-activated GGBS mortar with nano silica and dredged marine sand: mechanical, microstructural and durability aspects. Case Stud. Constr. Mater.20, e03148. 10.1016/j.cscm.2024.e03148
28
Varkouhi S. Tosca N. Cartwright J. Guo Z. Kianoush P. Jurkowska A. (2024). Pore water chemical constraints on petrophysical shifts following biosilica diagenesis. Geochem. Perspect. Lett.32, 39–45. 10.7185/geochemlet.2440
29
Venkateswarlu H. SaiKumar A. Latha G. M. (2023). Sand-geogrid interfacial shear response revisited through additive manufacturing. Geotext. Geomembranes51 (4), 95–107. 10.1016/j.geotexmem.2023.04.001
30
Xu C. Liang C. Shen P. (2019). Experimental and theoretical studies on the ultimate bearing capacity of geogrid-reinforced sand. Geotext. Geomembranes47 (3), 417–428. 10.1016/j.geotexmem.2019.01.003
31
Zhou L. Chen J.-F. Zhu Y. Yao T. (2024). Liquefaction and post-liquefaction behaviors of unreinforced and geogrid reinforced calcareous sand. Geotext. Geomembranes52 (3), 286–303. 10.1016/j.geotexmem.2023.11.002
Summary
Keywords
temperature, geogrid, marine silica sand, silica sand-geogrid interface, cyclic shear test, dynamic interfacial interaction
Citation
Kong X, Zhang L, Xu K, Liu Y, Cui P and Pu X (2025) Dynamic interface mechanical behavior between geogrid and marine silica sand considering temperature effects. Front. Earth Sci. 13:1655178. doi: 10.3389/feart.2025.1655178
Received
30 June 2025
Revised
14 October 2025
Accepted
20 October 2025
Published
10 November 2025
Volume
13 - 2025
Edited by
Xiaolei Liu, Ocean University of China, China
Reviewed by
Pooria Kianoush, Islamic Azad University South Tehran Branch, Iran
Miao Wang, Heilongjiang Province Hydraulic Research Institute, China
Updates
Copyright
© 2025 Kong, Zhang, Xu, Liu, Cui and Pu.
This is an open-access article distributed under the terms of the Creative Commons Attribution License (CC BY). The use, distribution or reproduction in other forums is permitted, provided the original author(s) and the copyright owner(s) are credited and that the original publication in this journal is cited, in accordance with accepted academic practice. No use, distribution or reproduction is permitted which does not comply with these terms.
*Correspondence: Liman Zhang, 1278780766@qq.com; Peng Cui, cui.peng@umu.se; Xiaogang Pu, pxg0961@163.com
†These authors have contributed equally to this work
Disclaimer
All claims expressed in this article are solely those of the authors and do not necessarily represent those of their affiliated organizations, or those of the publisher, the editors and the reviewers. Any product that may be evaluated in this article or claim that may be made by its manufacturer is not guaranteed or endorsed by the publisher.