 Miaojun Sun1,2
 Gaojian Hu
- 1Zhejiang Huadong Geotechnical Investigation and Design Institute Corporation Limited, Hangzhou, China
- 2Powerchina Huadong Engineering Corporation Limited, Hangzhou, China
- 3School of Civil Engineering, Shaoxing University, Shaoxing, Zhejiang, China
- 4School of Future Cities, University of Science and Technology Beijing, Beijing, China
- 5Science and Technology Department, Beijing Institute of Economics and Management, Beijing, China
- 6Rock Mechanics Institute, Ningbo University, Ningbo, China
The shear mechanical properties of the cover interface play a key role in the stability analysis of tunnel surrounding rock structure. To further reveal the coupling effect of overlying stress and size effect on the shear strength and failure mode of the cover interface, this paper adopts the RFPA numerical simulation method to carry out direct shear simulation and normalization analysis of the cover interface under different normal stresses and interface sizes. The results show that the shear strength of the cover interface decreases significantly with the increase of interface size, exhibiting a negative exponential relationship. Normal stress enhances interfacial friction, increases peak and residual shear strength, and has an exponential relationship with the size effect coefficient. The larger the normal stress, the faster the attenuation of size effect. At different sizes, the end effect is significant in small samples, with cracks densely distributed at the ends; Cracks penetrate along the interface in large samples, and residual shear slip is more complete. Based on the normalized shear strength curve, the universality of size effect and the coupling effect of normal stress were revealed. The research results can provide theoretical support and parameter basis for the analysis of shear stability of weak surfaces in underground structures.
1 Introduction
The cover interface refers to the contact interface between the accumulation body and underlying bedrock, which is widely present in geological engineering such as tunnel surrounding rock. The mechanical properties of the cover interface are directly related to the overall stability of the engineering body, and its shear failure is often one of the key causes of tunnel instability (Zeng et al., 2008). Understanding the shear strength and failure evolution laws of the cover interface is of great theoretical significance and engineering practical value for revealing the instability mechanism of structural planes such as joint surfaces and formulating reasonable tunnel reinforcement measures.
In recent years, the issue of interface shear failure and its size effect has received widespread attention from scholars. Previous studies have shown that the shear strength of interfaces is influenced by various factors, such as interface roughness, normal stress, and interface structural dimensions. Chen (2019) conducted research on the structural planes of natural three-dimensional irregular rock masses and analyzed the influence of size effects on the peak values and residual shear strength of structural planes. Le et al. (2016), Li (2017), and Hu and Zhao (2024) conducted direct shear tests on samples with serrated structural surfaces of different sizes, exploring the influence of size effect on the shear strength of serrated structural surfaces of different sizes. Wang et al. (2018) and Liu and Qiao (2013) believe that the shear strength of structural planes is influenced by size and roughness and explain the effects of size and roughness on the shear strength of structural planes. Mao et al. (2024) and Cemiloglu et al. (2023) predicted the strength of rocks based on the Deep Random Forest Optimization algorithm and Support Vector Machine, respectively. Among these factors, the size effect is particularly significant. Xu and Ren (2007a) studied the variation of rock shear strength parameters with joint size. Shang and Wei (2014) conducted in-depth research on the shear characteristics of structural planes of different sizes and established empirical formulas for shear strength. Hu et al. (2022); Huang and Hu (2023); Hu et al. (2024) explored the influence of roughness and normal stress on the size effect. The above studies have shown that size has a significant impact on the shear strength of structural planes. However, current research mainly focuses on homogeneous structural planes, and there is relatively little research on heterogeneous cover interfaces. In practical engineering, a considerable proportion of rock masses have heterogeneous cover interfaces. Therefore, it is very important to conduct research on the size effect of cover interfaces.
Normal stress is another important factor affecting the shear strength of the cover interface. Increasing normal stress can effectively improve interfacial friction and cohesion, significantly enhancing peak shear strength and residual shear strength. Yang et al. (2007) studied the shear strength of expansive soil and found a negative correlation with the size of the cover interface. Tian (2021) studied the dynamic response characteristics of the cover interface and the overlying soil and found that the closer the interface is to the top of the slope, the more obvious the dynamic response characteristics of the overlying soil. Zou et al. (2021) studied the shear strength parameters of contact surfaces and analyzed the evolution process of landslide deposits. Wang and Zhang (2019) studied the evolution of normal and shear stresses at the interface of loess under cyclic loading with constant stiffness and analyzed the effect of interface stiffness on the rate of weakening. Lin et al. (2023) systematically investigated the influence of normal stress on the shear strength of interfaces from different material interfaces and found that the shear stress value of the interface increases with the increase of normal stress. Du et al. (2023) studied the control effect of normal stress and its variation on slope sliding, and found that with the increase of normal pressure, the asymmetry of the upper and lower interfaces of the shear band weakens. Hu et al. (2013) discovered the influence of the interface morphology of the substrate on the overall structural stability. Under high normal stress conditions, the shear failure mode also changes, and shear failure becomes more continuous. In addition, there is a coupling effect between normal stress and size effect, and the mechanism of this coupling effect is currently unclear.
The characteristic size is a parameter that characterizes the shear size effect of structural planes, representing the interface size at which the rock strength reaches stability. Xu and Ren (2007b) simulated the influence of filled joints on shear strength, providing data support for the definition and parameter values of representative elementary volume (REV). Liu et al. (2009) found that there is a power function relationship between shear strength parameters and specimen size. Wang et al. (2019) determined the method for selecting rock mechanics parameters to characterize units through numerical experiments. Du et al. (2009) calculated the mechanical parameters of the slope rock mass based on the REV size. Rojo et al. (2024); Rojo et al. (2025) revealed the stable trend of shear strength with changes in particle shape parameters through simulation studies and proposed a new statistical data-based REV evaluation method. At present, there is relatively little research on the characteristic dimensions of shear strength at the cover interface, and even less consideration is given to the influence of normal stress on it.
Compared to traditional laboratory direct shear tests, Rock Failure Process Analysis (RFPA) numerical simulation software is based on finite element stress analysis and elastic damage theory, fully considering the heterogeneity of rock materials and the random distribution characteristics of internal defects. It can accurately simulate the entire process of crack initiation, propagation, and macroscopic failure, providing efficient and reliable numerical methods for studying the shear failure mechanism of rocks under complex loads.
This article uses numerical simulation methods to systematically study the size effect law of the cover interface shear under different normal stresses, quantitatively characterizes the functional relationship between size effect and interface shear strength, and elucidates its inherent correlation mechanism. The article also analyzed the influence of size on the failure mode of the cover interface, analyzed the size effect law of the shear strength fluctuation coefficient, and obtained the relationship between the characteristic size of shear strength and normal stress.
2 Simulation plans
To systematically reveal the coupled influence mechanism of normal stress and size effect on the shear strength and failure mode of the cover interface, this paper conducted a two-dimensional direct shear simulation study on the overburden-foundation interface-bedrock combination based on the RFPA. The article constructs a shear strength prediction model based on size effect, proposes a method for solving the characteristic size, and quantifies the regulatory effect of normal stress on the stability of shear response. To investigate the size effect of the cover interface on its shear behavior, this paper constructs six two-dimensional numerical models with different sizes. The interface lengths are 20 cm, 40 cm, 60 cm, 80 cm, 100 cm, and 120 cm, as shown in Figure 1a. The model consists of three parts: the upper part is the cover layer, the middle part is the cover interface, and the lower part is the bedrock layer, as shown in Figure 1b.
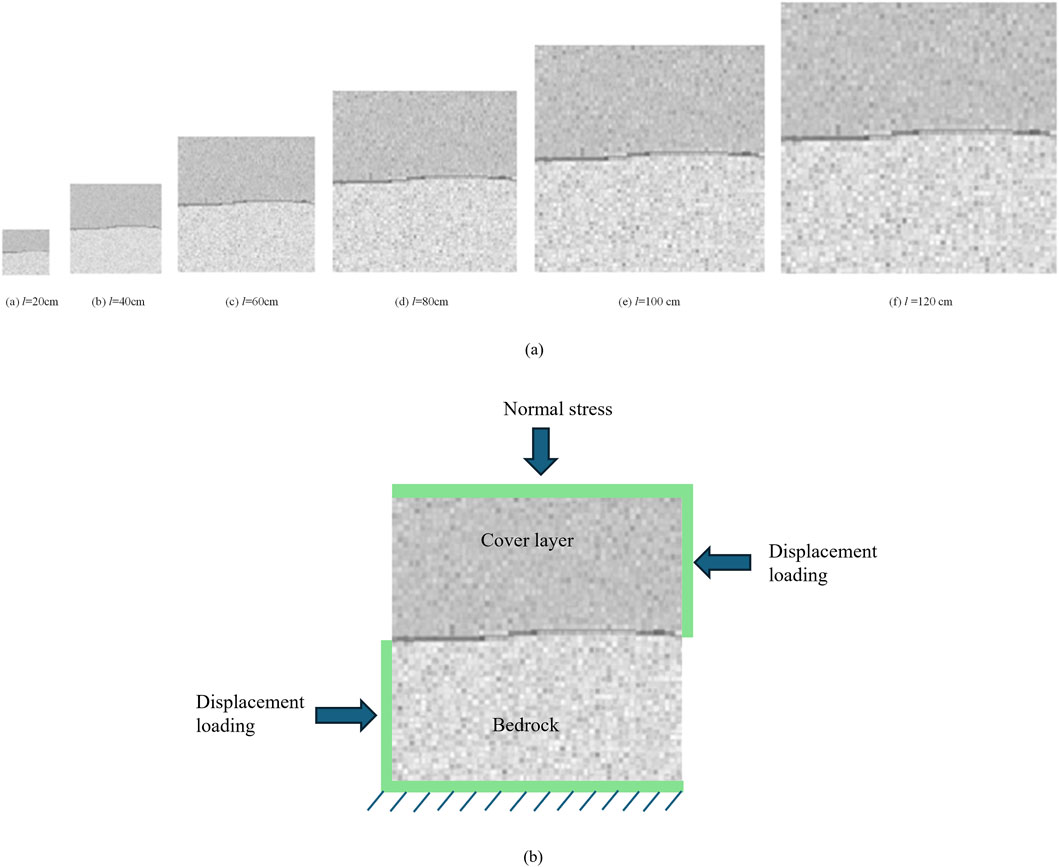
Figure 1. Schematic diagram of numerical model of cover interface. (a) Models different sizes. (b) Shear diagram.
The physical and mechanical parameters of each material are set as follows: the cohesion of the covering layer is 7.188 MPa, the internal friction angle is 45.479°, the elastic modulus is 12.26 GPa, Poisson’s ratio is 0.223, the bulk density is 2,126.04 kg/m3, and the shear strength is 7.696 MPa. The cohesion of the bedrock is 14.473 MPa, the internal friction angle is 51.69°, the elastic modulus is 16.52 GPa, Poisson’s ratio is 0.211, the bulk density is 2,283.99 kg/m3, and the shear strength is 15.106 MPa. In the model, the cover interface is set as a horizontal contact zone with significantly weakened mechanical properties, simulating the structural planes in actual rock masses. Its parameters include roughness of 13.4, cohesion of 0.001 MPa, internal friction angle of 30°, elastic modulus of 1 GPa, Poisson’s ratio of 0.35, the bulk density of 2,121 kg/m3, and shear strength of 0.29 MPa.
The article also designs five different normal loads under various working conditions to investigate the shear impact of different normal forces on the cover interface. The load values are 0.5 MPa, 1.0 MPa, 2.0 MPa, 3.0 MPa, and 4.0 MPa, as shown in Table 1.
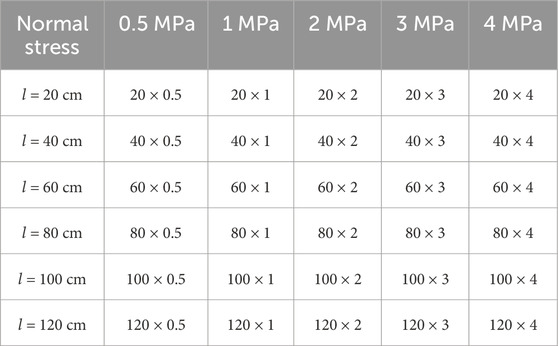
Table 1. Simulation scheme table.
The simulation software utilized in this study is RFPA. Based on the finite element method and incorporating statistical damage mechanics theory, this software can simulate the initiation, propagation, and ultimate penetration of cracks in rocks under heterogeneous conditions. It is particularly suitable for studying weak plane shear failure behavior. In terms of boundary conditions, the model is fixed at the bottom, with free boundaries on both the left and right sides, and a constant normal stress applied at the top. Horizontal shear displacement is applied to both sides of the model, with a shear loading step length of 0.001 m, to simulate the process under quasi-direct shear conditions.
3 Analysis of simulation results
3.1 Stress strain curve of different interface sizes
Using RFPA software to simulate the shear mechanics test of the cover interface, the stress-strain curves of the cover interface under different sizes were obtained, as shown in Figure 2, and the shear strength were calculated as shown in Table 2.
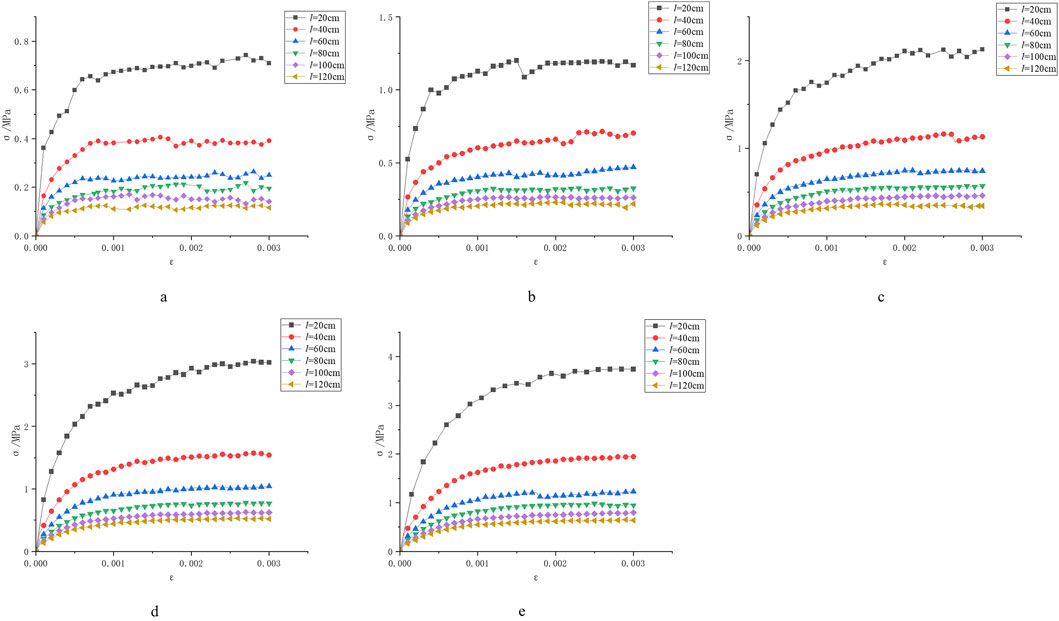
Figure 2. Stress strain curves of rocks at different sizes. (a) 0.5 MPa. (b) 1 MPa. (c) 2MPa. (d) 3 MPa. (e) 4MPa.
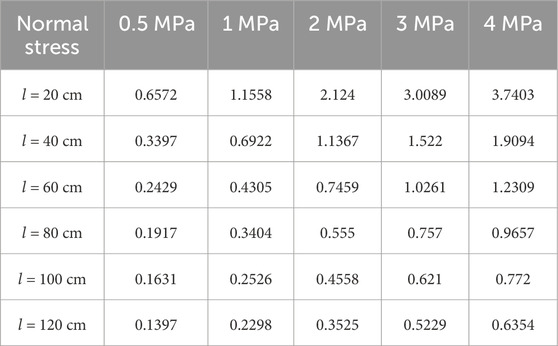
Table 2. Shear strength of different sizes of cover interface (unit: MPa).
According to the rock mechanics parameters, the shear strength of the upper and lower parts of the model is 7.696 MPa and 15.106 MPa, respectively, and the shear strength of the cover interface is 0.29 MPa. The model is a typical non-uniform strength model. Analyzing Figure 2a, when the normal stress is 0.5 MPa, the maximum shear stress is consistently low and does not reach 1 MPa; The maximum peak shear stress was observed in the 20 cm sample, which was 0.6572 MPa. As the sample size increased, the peak shear stress decreased. At 120 cm, the peak stress decreased to 0.1397 MPa, showing a significant size effect phenomenon. Figure 2b shows that when normal stress is 1 MPa, the size effect law is still evident, and the maximum shear stress still occurs on the 20 cm specimen, which is 1.1558 MPa. Compared with the normal stress of 0.5 MPa, the increase is 75.88%; The peak shear stress of the 120 cm sample is the weakest, at 0.2298 MPa, but compared to the peak stress at 0.5 MPa, it still has an increase of 64.5%. Figure 2c shows that when the normal stress is 2 MPa, the peak shear stress of the 20 cm specimen rapidly increases, reaching 2.124 MPa, while the stress-strain curve for sizes 60 cm and above becomes smoother; Overall, after the increase of normal stress, the shear strength of the cover interface has been enhanced, but it is still lower than the strength of the cover layer and bedrock. Figure 2d shows that when the normal stress is 3 MPa, the peak shear stress further increases, and the peak shear stress of the 20 cm specimen reaches 3.0089 MPa. The difference in peak shear stress for sizes 60 cm and above decreases, indicating that the size effect is weakening. Figure 2e shows that when the normal stress is 4 MPa, the shear strength significantly increases with the normal stress, with the 20 cm sample showing the most significant increase, reaching 3.7403 MPa, but still lower than the 7.696 MPa of the cover layer, indicating that the cover layer will not be damaged and the overall shear deformation is controlled by the base cover interface; The difference in peak shear stress between different sizes has further narrowed, indicating that under high normal stress, the interface “reinforcement” effect is significant, presenting a “residual strength” mode.
From this, the greater the normal stress, the more significant the increase in interfacial shear strength; The larger the model size, the lower the peak shear stress, showing a significant size effect. However, under high normal stress, this size effect phenomenon will weaken. In this series of shear tests, the upper and lower rock masses were basically not damaged, and the cover interface controlled the overall shear deformation.
3.2 Relationship between shear strength and size of cover interface
3.2.1 Proposal for the relationship
Table 2 shows that as the size of the cover interface increases, the shear strength of the cover interface gradually decreases. Therefore, we can plot the relationship curve between shear strength and the size of the cover interface as shown in Figure 3.
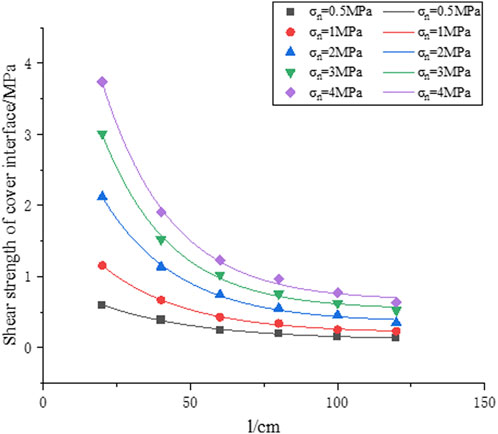
Figure 3. Shear strength curve of the cover interface.
Figure 3 shows that when the size of the cover interface is less than 40 cm, the shear strength increases significantly with the increase of normal stress. When the size of the cover interface is greater than 60 cm, the shear strength tends to “saturate”. The fitting curve rapidly decreases in the small-sized area and gradually flattens in the large-sized area, reflecting the typical weakening law of size effect. From the curve, the shear strength of the cover interface is negatively correlated with the size of the cover interface.
To obtain this relationship, the curve in Figure 3 was fitted to obtain the relationship between the shear strength and size of the cover interface, as shown in Formulas 1–5. The fitting coefficient R2 ranges from 0.997 to 0.999, indicating that the exponential model can well describe the variation of the shear strength of the cover interface with size.
When the normal stress is 1 MPa, the fitting formula is:
When the normal stress is 2 MPa, the fitting formula is:
When the normal stress is 3 MPa, the fitting formula is:
When the normal stress is 4 MPa, the fitting formula is:
When the normal stress is 5 MPa, the fitting formula is:
Based on the curves in Formulas 1–5, we propose the following relationship:
In the formula: τ (L) is the shear strength of the cover interface with a size of l, unit: MPa; l is the size of the cover interface, unit: cm; h is the residual shear strength, d is the strength increment, which increases with the increase of normal stress, and g is the size effect attenuation coefficient, which decreases with the increase of normal stress.
3.2.2 Parameter solution
Since parameters d, g, and h are all related to normal stress, we attempted to establish their relationship through normal stress. Based on Formulas 1–5, we extracted their values, and plotted their fitting curves with normal stress, as shown in Figure 4.
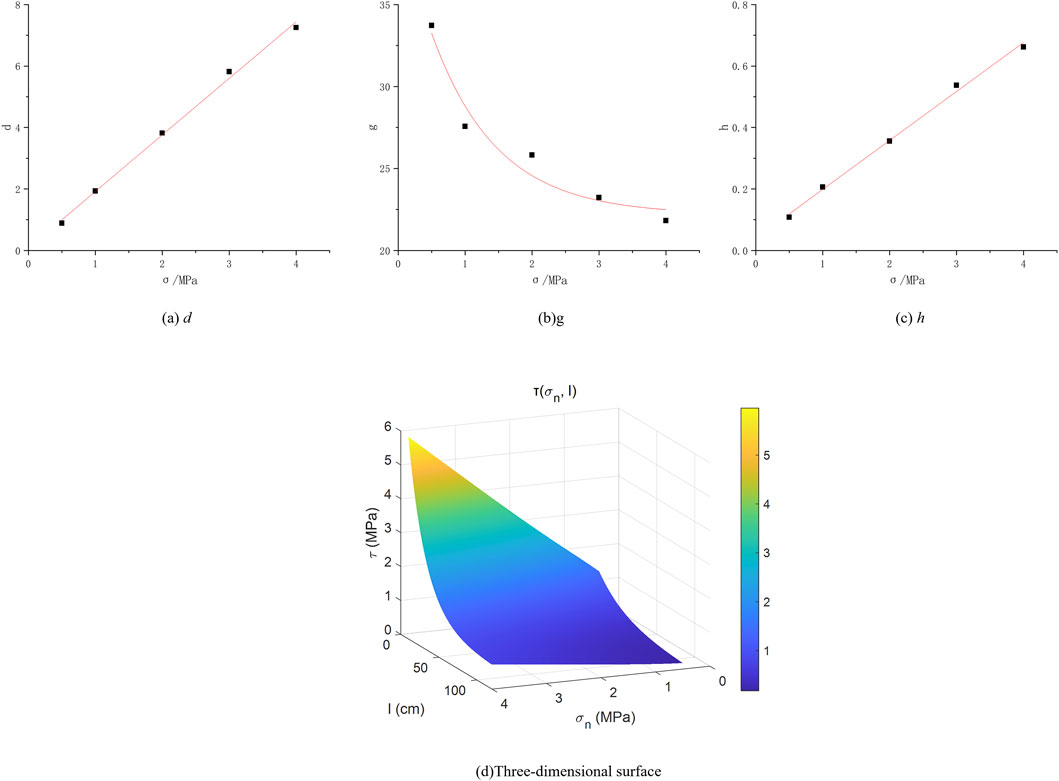
Figure 4. Fitting curve: (a) Parameter d, (b) Parameter g, (c) Parameter h, (d) Three-dimensional surface.
Figures 4a–c shows that parameter d increases linearly with normal stress, indicating that an increase in normal stress will have a linear enhancement effect on the contribution of the “incremental term” in our proposed exponential model; The parameter g shows a negative exponential decay relationship with normal stress, indicating that the larger the normal stress, the faster the size effect law decays; The parameter h increases linearly with normal stress, indicating that an increase in normal stress will enhance the residual shear strength. The relationship between parameters d, g, and h and normal stress is obtained through curve fitting as follows:
3.2.3 Size effect model of shear strength of cover interface
Based on Equations 6–9, we constructed the following size effect model for the shear strength of the cover interface and plotted a three-dimensional surface graph of normal stress-interface size-shear strength in MATLAB, as shown in Figure 4d.
In the formula: τ (L) is the shear strength of the cover interface with a size of l, unit: MPa; σn is the normal stress, unit: MPa; l is the size of the cover interface, unit: cm.
Equation 10 exhibits high fitting accuracy (R2 > 0.997) within the size range of 20–120 cm and the normal stress interval of 0.5–4 MPa, making it suitable for interface analysis where weak plane-dominated shear failure occurs. The applicable prerequisites include: (1) the interface strength is significantly lower than that of the surrounding rock mass; (2) the loading condition is two-dimensional direct shear; (3) the interface roughness and material parameters are basically consistent with the settings of this study. If used in other working conditions or formation conditions, the model coefficients should be revised based on actual measured parameters.
The 3D surface in Figure 4d fully demonstrates the comprehensive influence of normal stress and interface size on the shear strength of the cover interface. It can be used to solve the shear strength of the cover interface under any size and normal stress conditions within the model range, providing an empirical method for analyzing the shear strength and size of the cover interface in engineering practice. It can be widely applied to on-site rocks containing base cover interfaces.
3.3 Size effect analysis of shear failure at the cover interface
3.3.1 Analysis of destruction process
To analyze the failure law during the shear process of the base cover interface, acoustic emission images of 20 cm and 60 cm models with different shear steps were selected under normal stress of 1 MPa, as shown in Figure 5, where a1, a2, a3, a4 and b1, b2, b3, b4 represent step sizes of 3, 10, 20, 30 and 40, 50, 60, 70, respectively.
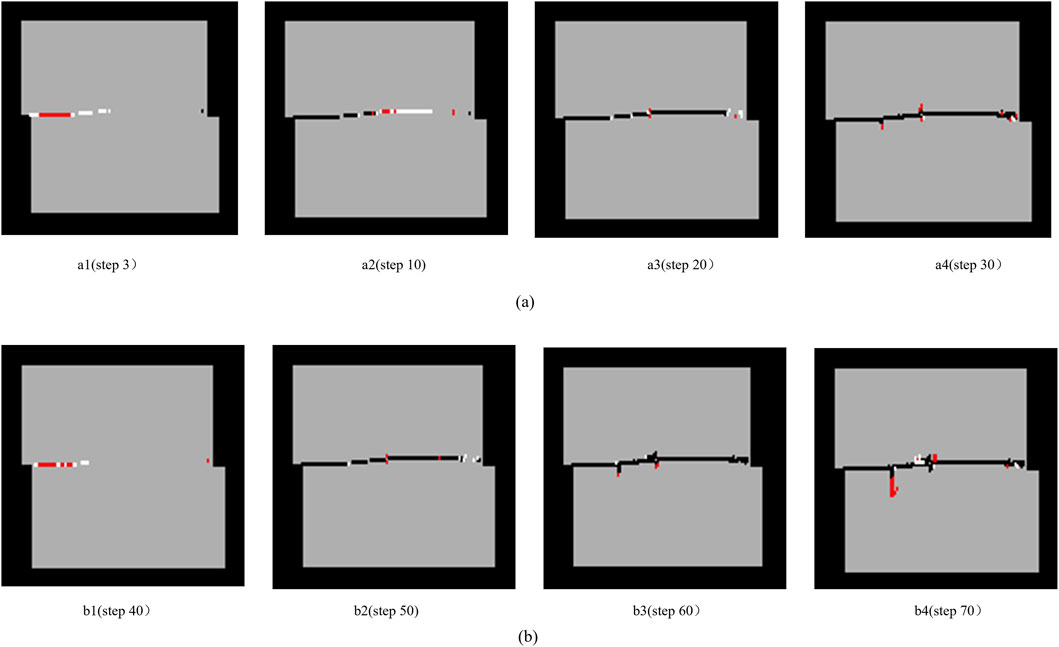
Figure 5. Shear failure process diagram of cover interfaces. (a) Shear failure process diagram of 20 cm cover interfaces under normal stress of 1 MPa. (b) Shear failure process diagram of 60 cm cover interfaces under normal stress of 1 MPa.
Figures 5a show the formation and development of cracks at the interface size of 20 cm and 60 cm, respectively, under a normal stress of 1 MPa. When the size of the cover interface is 20 cm, local white small cracks appear at the front end of the cover interface, accompanied by a small amount of acoustic emission (Figure 5a1); As the shear continues, local small cracks continue to develop along the interface shear direction and continue to develop towards the right end. At this point, a certain degree of shear failure occurs on the left side of the cover interface (Figure 5a2); In the middle stage of shearing, the crack approaches the interface and is fully penetrated, with secondary cracks in some areas, causing a certain degree of wear at the contact area between the upper and lower blocks of the cover interface, and showing an “end effect” on the right side (Figure 5a3); In the later stage of shearing, the crack fully penetrated and the interface was basically completely destroyed, resulting in complete shear slip (Figure 5a4).
When the size of the cover interface is 60 cm, small cracks also appear first on the left side of the base cover interface, but the crack length is less than that of the 20 cm model (Figure 5b1); As the shear continues, local small cracks continue to develop along the boundary towards the right end, accompanied by secondary cracks (Figure 5b2); In the middle stage of shearing, the crack approaches the interface full penetration, and the secondary crack further expands (Figure 5b3); In the later stage of shearing, the cracks fully penetrated, and the final failure mode was similar to that of the 20 cm model, showing a shear failure mode that penetrated along the cover interface, but the number and length of secondary cracks were more than those of the 20 cm model (Figure 5b4).
3.3.2 Characteristics of size effect damage
To analyze the differences in shear failure modes of the cover interface under different sizes, the final failure modes of the cover interface shear under low normal stress (0.5 MPa) and high normal stress (2 MPa) were selected, as shown in Figure 6.
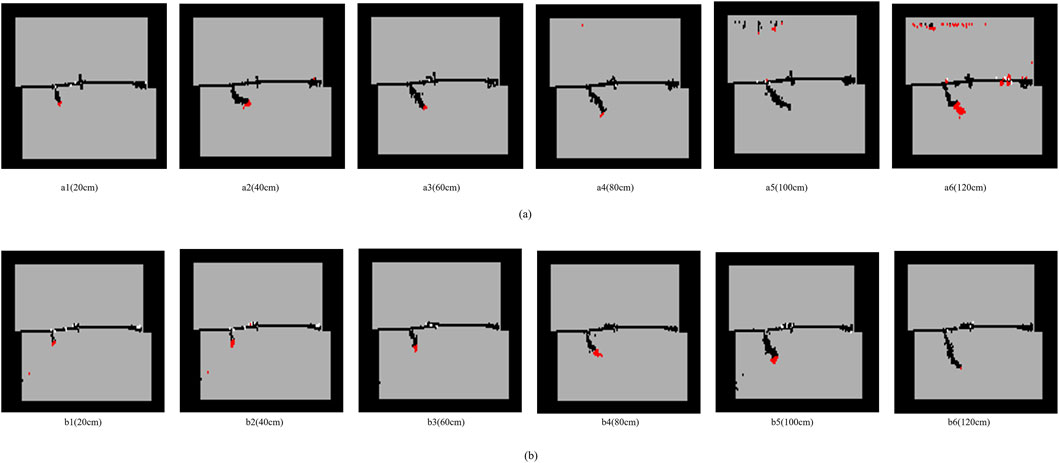
Figure 6. Shear failure modes of different sizes of cover interfaces. (a) Shear failure modes of different sizes of cover interfaces under normal stress of 0.5 MPa. (b) Shear failure modes of different sizes of cover interfaces under normal stress of 2 MPa.
Analyzing Figure 6a, under low normal stress (0.5 MPa), when the model size is less than 40 cm, the number of cracks is relatively small and mainly distributed at the edge positions on both sides of the cover interface, while the cracks in the middle area are relatively few. This indicates that the end of the small-sized model is strongly restrained at the loading boundary, leading to local stress concentration, and cracks preferentially appear near the end (Figures 6a1, a2); When the model size exceeds 80 cm, the crack length becomes longer and the number significantly increases, and the cracks are distributed in the overall area of the cover interface, rather than concentrated at the ends, indicating that the influence of end effects is weakening (Figures 6a4–a6).
Analyzing Figure 6b, under high normal stress (2 MPa), there are some changes in the interface shear failure mode compared to low normal stress. Firstly, high normal stress increases the interface shear strength, and the crack has stronger penetration along the cover interface. Especially when the model size is greater than 80 cm, the slip band on the cover interface is more uniform and continuous, and the crack will penetrate the middle of the cover interface, reflecting a strong shear slip zone; Secondly, under high normal stress, the end effect of the cover interface gradually weakens, and the overall sliding surface is controlled.
3.4 Size effect of fluctuation coefficient of shear strength at the cover interface
The fluctuation coefficient, as a dimensionless statistic, can be used to measure the degree of fluctuation in shear strength. The calculation formula for the fluctuation coefficient of shear strength at the cover interface is as follows:
Among them,
Based on Formula 11, calculate the fluctuation coefficient of the shear strength of the cover interface at different sizes, as shown in Table 3, and plot its scatter plot, as shown in Figure 7a.
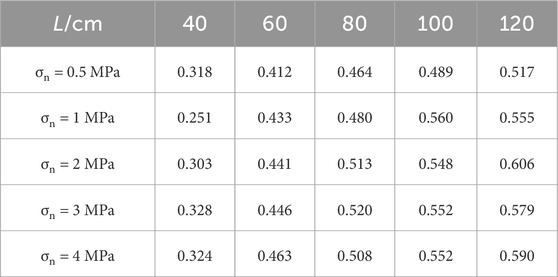
Table 3. Size effect of shear strength fluctuation coefficient.
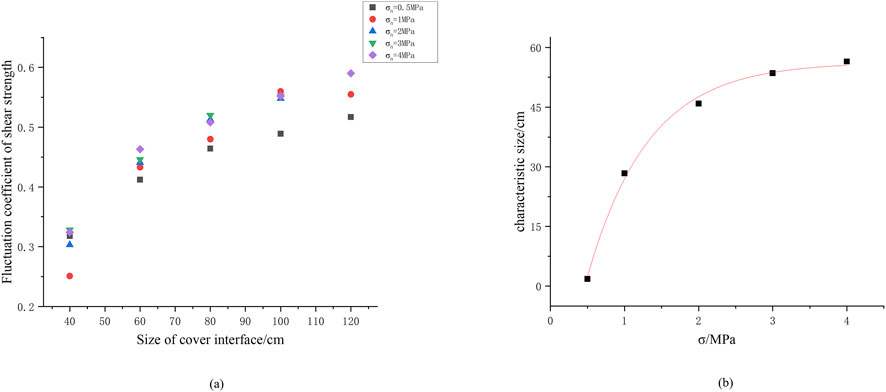
Figure 7. Relationship curves. (a) Scatter plot of fluctuation. (b) Fitting curve characteristic size.
Figure 7a shows the variation of shear strength fluctuation coefficient with the size of the cover interface. Taking normal stress of 0.5 MPa as an example, when the size is 40 cm, the fluctuation coefficient is 0.318. When it reaches 120 cm, the fluctuation coefficient increases to 0.517, an increase of 62.6%; Overall, as the size increases from 40 cm to 120 cm, the fluctuation coefficient of the cover interface increases from 0.3 to 0.6, indicating that larger cover interfaces exhibit greater variability in shear strength; The increase in fluctuation coefficient also reflects the increase in mechanical instability caused by the overall changes in the macroscopic failure surface of large-sized cover interfaces.
3.5 Relationship between characteristic size of cover interface shear strength and normal stress
The shear strength of the cover interface has a size effect, that is, as the size of the cover interface increases, the shear strength of the cover interface decreases. When the size increases to a critical size, the shear strength of the cover interface tends to stabilize, and this critical size is the Characteristic size of the shear strength of the cover interface.
It is difficult for us to directly determine the exact characteristic size, but we can obtain the characteristic size value by solving Formula 10 as follows.
In the formula: α is the absolute value of the slope that meets the engineering requirements, which is set to 0.025 in this case.
Based on Formulas 12–14, calculate the characteristic sizes values of structural planes with normal stresses of 0.5 MPa, 1 MPa, 2 MPa, 3 MPa, and 4 MPa, as shown in Table 4, and plot their fitting curves with normal stress, as shown in Figure 7b.

Table 4. Characteristic size values of the base cover interface.
Figure 7b shows that with the increase of normal stress, the characteristic size of the cover interface shear strength significantly increases, showing a trend of rapid growth followed by a gradual increase; In the low normal stress stage (0–2 MPa), characteristic size increases significantly and rapidly; In the stage of high normal stress (2–4 MPa), the increase in characteristic size slows down and tends to stabilize. We fitted the following characteristic size relationship for the shear strength of the cover interface, as shown in Formula 15
In the formula, D (σn) is the characteristic size of the shear strength of the cover interface, unit: cm.
3.6 Normalization analysis of size effect on cover interface shear strength
The shear strength of samples of different sizes has different orders of magnitude, and direct comparison may cause errors. Therefore, based on the previous analysis, further normalization data processing was carried out on the shear strength of the cover interface of different sizes. Using the maximum normalization method, the shear strength data of different sizes are scaled to the range of [0,1], and the formula is:
Among them,
Normalize the shear strength of the cover interface at different sizes using Equation 16, as shown in Table 5, and plot the normalized curve using Origin, as shown in Figure 8a.
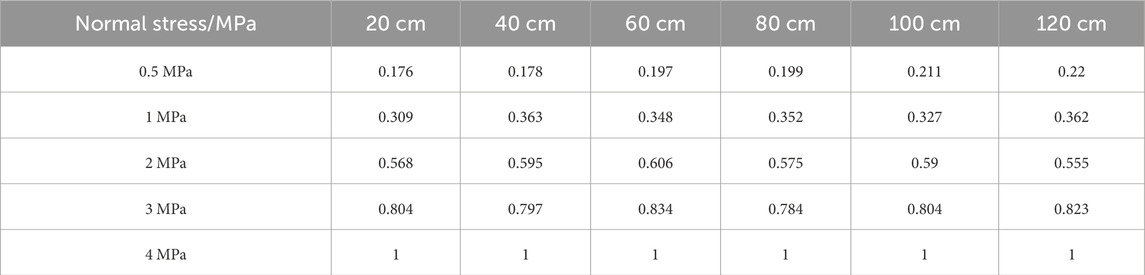
Table 5. Normalization of size effect on shear strength.
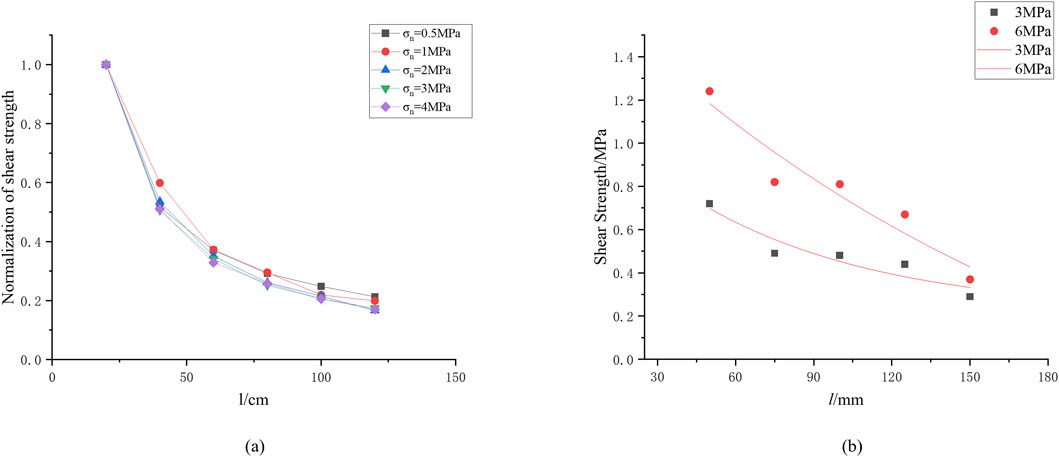
Figure 8. Normalization and verification curves. (a) Normalization curve. (b) Verification curves.
Analyzing Figure 8a, we observed that as the size of the cover interface increased from 20 cm to 120 cm, the normalized curves of the cover interface shear strength under different normal stresses showed a decreasing trend, with the
4 Validation analysis
To verify the universal applicability of Formula 6, we cited the shear strength data under different sizes and normal stresses in Chen et al. (2021). The normal stress values were 3 MPa and 6 MPa, respectively, and the size values were 50 mm, 75 mm, 100 mm, 125 mm, and 150 mm. The specific data are shown in Table 6, and corresponding scatter plots and fitting curves are plotted in Figure 8b.
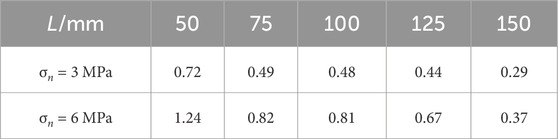
Table 6. Shear strength data (Chen et al., 2021).
The curves of 3 MPa and 6 MPa were fitted from Figure 8b, as shown in Formulas 17 and 18, respectively. Their fitting coefficients were 0.93 and 0.91, both greater than 0.9, indicating a good fitting effect.
The function types of Formulas 17 and 18 are consistent with the type of Formula 6, and the laws of attenuation coefficient, residual shear strength, and strength increment are also consistent with Formula 6 when the normal stress increases, which verifies the applicability of the relationship between the cover interface and size proposed in this paper.
5 Discussion
In the existing research on the shear mechanical properties of the cover interface, scholars have explored the evolution law of the interface shear strength from different perspectives. But it mostly focuses on the overall shear response, lacking systematic exploration of the cover interface under different normal stress and size conditions. For example, Chen (2019), Shang and Wei (2014), and Luo et al. (2024) studied the overall shear strength of joint surfaces. Although Xu and Ren (2007a) analyzed the multi-scale characteristics of shear strength parameters based on rock fractal parameters with different fractal dimension values, they did not address the influence of normal stress.
Compared with the above research, this article systematically considers the shear failure process of the cover interface under normal stress and multi-sized conditions. The results showed that the shear strength of the cover interface decreased exponentially with the increase of interface size, and the increase of normal stress overall improved the shear strength. However, its impact on the size effect showed a trend of “accelerating the size effect attenuation”. In addition, the shear failure mode also exhibits an evolution from end failure dominant to residual shear slip dominant. These results have improved the previous understanding that was limited to single size or normal stress conditions and obtained the coupling relationship between size effects and normal stress in the process of interface shear failure.
From the perspective of mechanical mechanisms, size effects lead to more pronounced end effects in short size models. The increase in normal stress not only enhances interfacial friction but also suppresses end stress concentration effects. This rule is of great significance in engineering practice: for different scales of cover interface structures, it is necessary to reasonably consider the influence of size effects to ensure the reliability of shear strength parameters and avoid safety factor deviations caused by extrapolation of small sample data.
This article still has certain limitations. The interface parameters in numerical simulation are single values, and the influence of changes in interface roughness on shear strength has not been considered; Meanwhile, this article only analyzed the strength of a single cover layer, and future research can further introduce a multi-layer strength interface model to more comprehensively reflect the complexity and diversity of natural interfaces.
6 Conclusion
This article focuses on the size effect of shear failure at the cover interface, systematically explores the coupled influence of normal stress and interface size on shear strength and failure mode, and constructs a three-dimensional coupled model based on normal stress-size-shear strength.
1. The shear strength of the cover interface gradually decreases with the increase of the cover interface size, showing a significant size effect phenomenon, and there is a negative exponential relationship between them. A size effect model for the shear strength of the base cover interface was constructed:
2. The increase of normal stress will have a linear enhancement effect on the contribution of the “incremental term” in the size effect model of the shear strength, which will improve the residual shear strength. However, it has a negative exponential relationship with the size coefficient, and the size effect law will decay faster.
3. In this series of shear simulations, the upper and lower rock masses were not damaged, and the cover interface controlled the overall shear deformation; Under low normal stress, small-sized models exhibit end effects, while the influence of end effects on large-sized models is weakening; Under high normal stress, the slip bands on the cover interface are more uniform and continuous, and cracks will penetrate the middle of the cover interface, forming a strong shear slip zone.
4. The large-sized cover interface exhibits greater fluctuation in shear strength; The influence of normal stress changes on size effects is relatively small for small-sized cover interfaces.
5. The relationship between the characteristic size of the shear strength of cover interface and the normal stress has been obtained as follows:
Data availability statement
The original contributions presented in the study are included in the article/supplementary material, further inquiries can be directed to the corresponding authors.
Author contributions
MS: Investigation, Writing – original draft. ZZ: Methodology, Data curation, Writing – review and editing. YD: Software, Writing – original draft, Data curation. CD: Writing – original draft, Methodology, Investigation. GH: Methodology, Writing – review and editing. GL: Formal Analysis, Writing – review and editing, Investigation.
Funding
The author(s) declare that financial support was received for the research and/or publication of this article.
Conflict of interest
Authors MS and ZZ were employed by Zhejiang Huadong Geotechnical Investigation and Design Institute Corporation Limited.
Authors MS and ZZ were employed by Powerchina Huadong Engineering Corporation Limited.
The remaining authors declare that the research was conducted in the absence of any commercial or financial relationships that could be construed as a potential conflict of interest.
The authors declare that this study received funding from Power China Resources Limited. The funder had the following involvement in the study: proposing preliminary investigation routes, assisting in the refinement of the research scope, conducting analysis on shear behavior and size effects, and contributing to the drafting of the manuscript.
Generative AI statement
The author(s) declare that no Generative AI was used in the creation of this manuscript.
Any alternative text (alt text) provided alongside figures in this article has been generated by Frontiers with the support of artificial intelligence and reasonable efforts have been made to ensure accuracy, including review by the authors wherever possible. If you identify any issues, please contact us.
Publisher’s note
All claims expressed in this article are solely those of the authors and do not necessarily represent those of their affiliated organizations, or those of the publisher, the editors and the reviewers. Any product that may be evaluated in this article, or claim that may be made by its manufacturer, is not guaranteed or endorsed by the publisher.
References
Cemiloglu, A., Zhu, L., Arslan, S., Xu, J., Yuan, X., Azarafza, M., et al. (2023). Support vector machine (SVM) application for uniaxial compression strength (UCS) prediction: a case study for maragheh limestone. Appl. Sci. Basel. 13 (4), 2217. doi:10.3390/app13042217
Chen, C. (2019). Research on stress effect and side effect of shear strength based on natural three-dimensional irregular rock structure surface. Hangzhou, Zhejiang, China: Zhejiang University of Science and Technology. doi:10.7666/d.D01736188
Chen, S., Gao, Z., Gu, Y., and Ji, C. (2021). Size effect analysis on peak shear strength of rock-like structure interface. Min. Res. Dev. 41 (4), 88–95. doi:10.13827/j.cnki.kyyk.2021.04.017
Du, Z., Gao, Y., Zhu, J., and Cui, B. (2009). Simulation testing method of mechanical parameters of a rock slope based on REV. J. Univ. Sci. Technol. Beijing 31 (02), 139–143. doi:10.3321/j.issn:1001-053X.2009.02.001
Du, W., Nie, R., Li, L., Tan, Y., and Yang, Y. (2023). DEM study on interface performance of geogrid-reinforced aeolian sand. J. Railw. Sci. Eng. 20 (05), 1695–1707. doi:10.19713/j.cnki.43-1423/u.T20221012
Hu, B., and Zhao, J. (2024). Experimental study on grouting shear on sawtooth structural surface based on size effect. Min. Technol. 24 (2), 78–82. doi:10.3969/j.issn.1671-2900.2024.02.015
Hu, P., Wang, L., Ma, L., and Luo, Q. (2013). Comparative analysis of the reinforcement measures on the slope of a certain deposit body based on the morphological characteristics of the bedrock cover interface. Yellow River 35 (08), 71–73. doi:10.3969/j.issn.1000-1379.2013.08.022
Hu, G., Zhang, J., Liang, W., Wang, J., Hu, J., and Wang, L. (2022). Effect of joint roughness coefficient and size on shear and characteristic strengths of structural planes. PLoS One 17 (4), e0265916. doi:10.1371/journal.pone.0265916
Hu, G., Xie, Z., Xing, Y., Gu, Y., Feng, H., and Sun, L. (2024). Study on the influence of rock bridge angle on the size effect of rock uniaxial compression. PLoS One 19 (5), e0299230. doi:10.1371/journal.pone.0299230
Huang, Y., and Hu, G. (2023). Influence of normal stress on the shear strength of the structural plane considering the size effect. Front. Earth Sci. 2023, 1116302. doi:10.3389/feart.2023.1116302
Le, H., Wu, J., Gao, X., Shi, W., and Song, J. (2016). Influence of size effect on shearing strength of zig-zag structure plane. J. Liaoning Tech. Univ. Nat. Sci. Ed. 35 (7), 745–750. doi:10.11956/j.issn.1008-0562.2016.07.015
Li, C. (2017). Study of stress effect on shear strength of single saw-tooth structural plane. Hangzhou, Zhejiang, China: Zhejiang University of Science and Technology. doi:10.7666/d.D01388890
Lin, P., Guo, P., Guo, C., Chen, L., and Wang, F. (2023). Experimental study on interfacial shear properties of steel plate, polymer and soil. Chin. J. Geotechnical Eng. 45 (01), 85–93. doi:10.11779/CJGE20210845
Liu, Y., and Qiao, C. (2013). Study on the size effect of shear strength of continuous structural plane. J. Beijing Jiaot. Univ. 37 (4), 94–97. doi:10.3969/j.issn.1673-0291.2013.04.018
Liu, S., Chi, Y., Wang, S., Liu, H., and Shi, A. (2009). Size effect on shear strength of basalt rock mass with columnar joints. J. Eng. Geol. 17 (03), 367–370. doi:10.3969/j.issn.1004-9665.2009.03.014
Luo, Z., Deng, L., Huang, M., Yong, R., and Li, G. (2024). Study on shear strength test and model of rock reinforced joint with weak interlayer. J. Zhejiang Univ. Sci. Technol. 36 (06), 529–537. doi:10.3969/j.issn.2097-5236.2024.06.007
Mao, Y., Li, Y., Teng, F., Nanehkaran, Y. A., Azarafza, M., and Zhang, M. (2024). Predicting the elasticity modulus of sedimentary rocks using Deep Random Forest Optimization (DRFO) algorithm. Environ. Earth Sci. 83 (16), 487. doi:10.1007/s12665-024-11768-y
Rojo, Q., Cantor, D., Renouf, M., Emilien, A., and Carlos, O. (2025). Micro- and macro-mechanical analysis of rev in sheared polydisperse granular samples. IOP Conf. Ser. Earth Environ. Sci. 1480 (1), 012076. doi:10.1088/1755-1315/1480/1/012076
Rojo, Q., Cantor, D., Renouf, M., Carlos, O., and Emilien, A. (2024). Rev assessment of granular materials with varied grading based on macro- and micro-mechanical statistical data. Acta Geotech. 20 (4), 1–14. doi:10.1007/s11440-024-02498-3
Shang, Z., and Wei, J. (2014). Study of impaction of size effecton structural plane shear strength. J. Xihua Univ. Sci. Ed. 33 (6), 101–104. doi:10.3969/j.issn.1673-159X.2014.06.0023
Tian, J. (2021). Numerical simulation research on dynamic response and stability of deposit slope with bedrock under earthquake. Chengdu, Sichuan: Southwest Jiaotong University.
Wang, T., and Zhang, Z. (2019). Experimental studies on cyclic shear behavior of steel-silt interface under constant normal stiffness. Chin. J. Geotechnical Eng. 41 (10), 1921–1927. doi:10.11779/CJGE201910017
Wang, P., Ren, F., and Cai, M. (2018). Mechanical analysis and size effect of rough discrete fractures network model under direct shear tests based on particle flow code. J. China Coal Soc. 2018. doi:10.13225/j.cnki.jccs.2017.1061
Wang, H., Yuan, Y., Cao, H., and Wang, Z. (2019). Mechanical parameters selection of rock mass based on representative element volume (REV). China Min. Mag. 28 (11), 131–135.
Xu, L., and Ren, Q. (2007a). Numerical test for size effect of shear strength of fractal joints. J. Min. Saf. Eng. 24 (4), 405–408. doi:10.3969/j.issn.1673-3363.2007.04.006
Xu, L., and Ren, Q. (2007b). Numerical simulation on the shear strength of fractal rock joints with different filling percentage. Coal Geol. Explor. 2007 (3), 52–55. doi:10.0000/issn.1001-1986.2007.35.35255
Yang, Y., Zhao, M., and Guan, P. (2007). Research for dimensional effect of anti - shear strength for expansive soil. Yangtze River, 38(9):18–19. doi:10.3969/j.issn.1001-4179.2007.09.009
Zeng, Q., Yang, Z., Shang, Y., Yang, G., and Zhu, J. (2008). Study on discontinuity between bedrock and Quaternary covers in No.102 landslide group section of Sichuan-Tibet highway. Hydrogeology & Eng. Geol. 35 (3), 1–6. doi:10.3969/j.issn.1000-3665.2008.03.002
Keywords: cover interface, shear strength, normal stress, size effect, end effect
Citation: Sun M, Zhang Z, Deng Y, Du C, Hu G and Liu G (2025) Analysis of shear size effect and failure characteristics of cover interface considering normal force. Front. Earth Sci. 13:1658450. doi: 10.3389/feart.2025.1658450
Received: 02 July 2025; Accepted: 11 August 2025;
Published: 10 September 2025.
Edited by:
Wenling Tian, China University of Mining and Technology, ChinaReviewed by:
Mohammad Azarafza, University of Tabriz, IranFei Wang, Northeastern University, China
Jianyong Han, Shandong Jianzhu University, China
Copyright © 2025 Sun, Zhang, Deng, Du, Hu and Liu. This is an open-access article distributed under the terms of the Creative Commons Attribution License (CC BY). The use, distribution or reproduction in other forums is permitted, provided the original author(s) and the copyright owner(s) are credited and that the original publication in this journal is cited, in accordance with accepted academic practice. No use, distribution or reproduction is permitted which does not comply with these terms.
*Correspondence: Gaojian Hu, aHVnYW9qaWFuOEAxNjMuY29t; Guangjian Liu, bGl1Z3VhbmdqaWFuNUAxNjMuY29t