 A. Filippova1,2
 A. Fomochkina
 V. Kossobokov
 A. Nekrasova
- 1Institute of Earthquake Prediction Theory and Mathematical Geophysics, RAS, Moscow, Russia
- 2Pushkov Institute of Terrestrial Magnetism, Ionosphere and Radio Wave Propagation, RAS, Troitsk, Russia
- 3Gubkin Russian State University of Oil and Gas, Moscow, Russia
- 4Accademia Nazionale delle Scienze detta dei XL, Rome, Italy
We continue analyzing earthquake sequences in terms of their variability and scaling properties, including the behavior of the control parameter η of the unified scaling law for earthquakes (USLE), along with a detailed analysis of the surface wave records for reconstruction of the source in approximation of the second moments of the stress glut tensor to obtain integral estimation of its length, orientation, and seismic process development over time. In particular, we present the analysis of the cases of the four recent earthquakes in Southern Alaska – 22 July 2020, Mw 7.8 at 105 km SSE of Perryville, 19 October 2020, Mw7.6 at 97 km SSE of Sand Point, 29 July 2021, Mw 8.2 at 99 km SE of Perryville and 16 July 2023, Mw7.2 at 106 km S of Sand Point that have occurred right at the western edge of the rupture zone of the 1964 Great Alaska, M9.3 mega-earthquake and contribute to apparent activation of the region started with the three major earthquakes (24 January 2016, Mw7.1, 23January 2018, Mw7.9, and 30 November 2018, Mw7.1) at its north and southern borders.
1 Introduction
After 5 decades since the 1964 Great Alaska, Mw9.3 megathrust earthquake the seismicity of the Southern Alaska experiences disturbing rise of activity started with (1) the 24 January 2016, Mw7.1, 47 km ESE of Pedro Bay earthquake (Old Iliamna) and followed by (2) the 23 January 2018, Mw7.9, 261 km SE of Chiniak, (3) the 30 November 2018, Mw7.1, 1 km SE of Point MacKenzie, (4) the 22 July 2020, Mw7.8, 99 km SSE of Perryville, (5) the 19 October 2020, Mw7.6, 99 km SE of Sand Point, (6) the 29 July 2021, Mw8.2, Alaska Peninsula, and (7) the 16 July 2023, Mw7.2, 106 km S of Sand Point earthquakes. The largest of the first three–the Mw7.9 earthquake on 23 January 2018 – ruptured the Pacific plate in front of the continental crust of Alaska while the cluster of next four ruptured a 200-km segment of the Aleutian megathrust fault. All seven appear to rupture the subducting Pacific plate right at the border of or within the extended source region of the 27 March 1964 Great Alaska earthquake (Press and Jackson, 1965; Wyss and Brune, 1967; Kanamori, 1970; Christensen and Beck, 1994). The complexity of the megathrust is characterized with a multiple rupture of several segments of subducting Pacific plate, including the lateral transition faulting along the Yakutat block at the corner of the Pacific–North America plate boundary. The apparent reactivation of this region at the level of significant major earthquakes deserves special attention. In the following sections, we provide integral characterization of the fore- and aftershock sequences for each of the recent major earthquakes in terms of their magnitude–space–time distributions and the control parameter of the Unified Scaling Law for Earthquakes (Kossobokov and Mazhkenov, 1994; Bak et al., 2002; Kossobokov and Nekrasova, 2019; Kossobokov, 2021), as well as the average estimates of the rupture extent, duration, and velocity, making use of the low-degree moments of the stress glut rate (Backus, 1977a; Backus, 1977b).
Note: After the submittal of the article on 5 July 2025, the seismic process at the northern boundary of the Pacific plate has further developed with the major M 7.3, 2025 Sand Point, Alaska Earthquake on July 16th and M 7.4, 2025 Eastern Kamchatka, Russia Earthquake on July 20 that appear to be a foreshock of the M 8.8, 2025 Kamchatka Peninsula Earthquake mega-thrust earthquake on July 29 (similar to the M 7.3 on March 9 in advance the 11 March 2011 M 9.1, Great Tohoku Earthquake in Japan). It is worth noting that the 2025 Kamchatka Peninsula earthquake has ruptured the same segment of the Kuril-Kamchatka subduction as the M 9.0, 89 km ESE of Petropavlovsk-Kamchatsky earthquake on 4 November 1952 – the first of the four mega-thrusts of the 20th century, namely, “Kamchatka, 1952/11/04, Mw 9.0; Andreanoff Islands, 1957/03/09, Mw 9.1; Chile, 1960/05/22, Mw 9.5; Alaska, 1964/03/28, Mw 9.2” (Kossobokov, 2011).
2 Data and methods
The seismicity of the Southern Alaska from 1 January 2006, through 11 November 2024, is analyzed within the geographic bounds of 50°–65°N and 140°–170°W. An online search of the U.S. Geological Survey Advanced National Seismic System (ANSS) database provided 55,681 records of earthquake with magnitudes of 2.5 or greater in the study area (Figure 1). A detailed analysis of the events from the ANSS catalogue (U.S. Geological Survey, 2017) within circles around the three major 2016–2018 earthquakes (Bukchin et al., 2020) confirmed that the catalogue offers a complete record for the region. Specifically, “graphs of the monthly number of M ≥ 2.5 earthquakes confirm the stability of hypocentre determinations in the ANSS catalogue prior to the major events.” Moreover, “the Gutenberg-Richter plot (Gutenberg and Richter, 1944) of the cumulative number of earthquakes with magnitudes ranging from 2.5 to 7.9 for the period 2006–2018 follows an exponential best-fit trend line, with a b-value of 0.868 (R2 = 0.993)” (Bukchin et al., 2020), which has changed to 0.796 (R2 = 0.989) in 2016–2024.
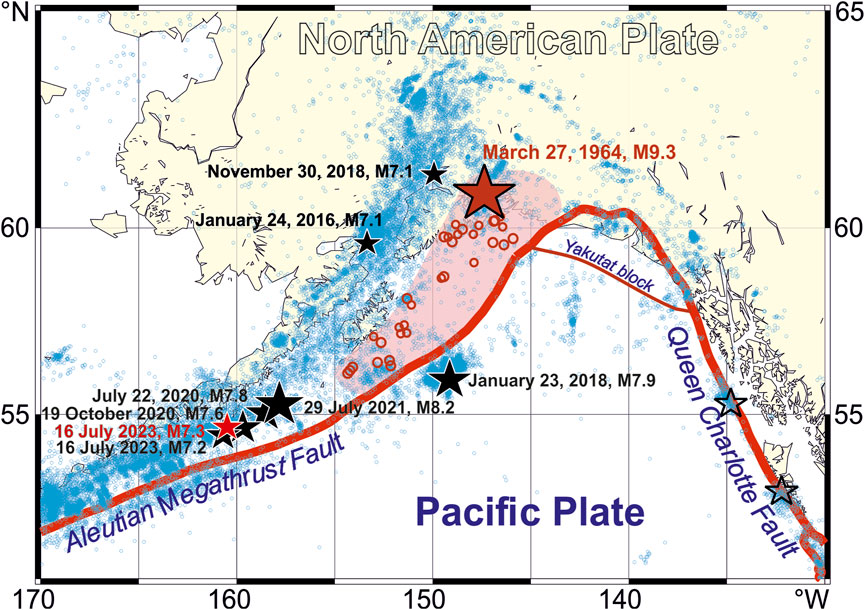
Figure 1. Epicenters of the M ≥ 2.5 earthquakes (ANSS, 1 January 2006 to 11 November 2024; small blue circles) and the five major earthquakes (black stars) in Southern Alaska. Note: Red line marks the boundary of the North American and the Pacific Plates. The epicenters of the 1964 Great Alaska earthquake (big red star) and its first aftershocks (red circles) are given on top the subsurface rupture zone (shaded pink). The Mw 7.3, 2025 Sand Point, Alaska Earthquake (red star) occurred on July 16th after the manuscript submittal.
Figure 2 presents a comprehensive five-dimensional visualization of seismic activity in southern Alaska from 2006 to 2024. The display combines magnitude, latitude, longitude, depth, and time to illustrate the spatial and temporal variability of earthquake occurrence in the region. Variability in earthquake occurrence frequency and energy distribution over time is visible, highlighting the dynamic and complex nature of seismic processes in southern Alaska during the occurrence of the four large earthquakes in the current analysis, as well as the three previously described in (Bukchin et al., 2020). One can see how seismicity varies in space and time, providing insight into the patterns of foreshock and aftershock activity of seven major earthquakes, as well as potential correlations between seismic events and their location, depth, and magnitude over nearly 2 decades.
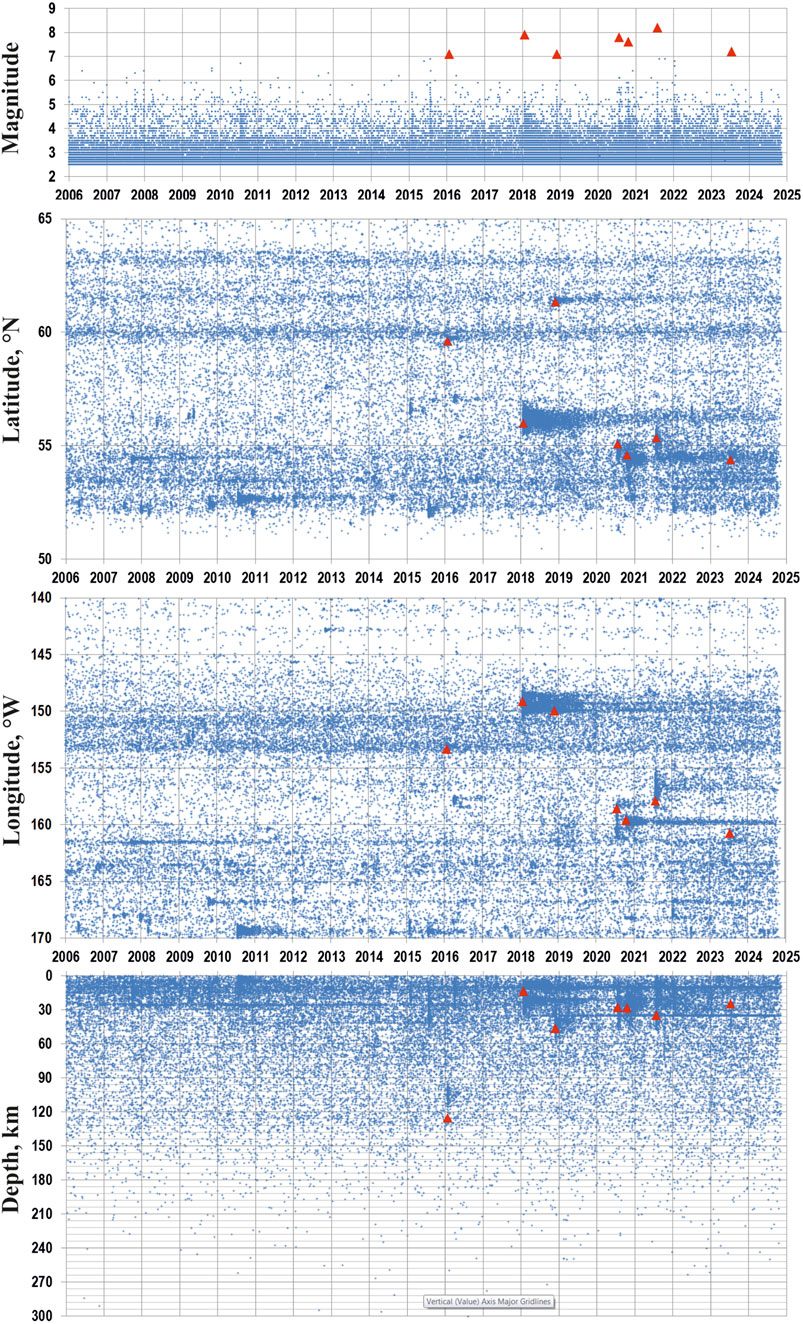
Figure 2. Magnitude-Latitude-Longitude-Depth versus Time distribution of earthquakes in Southern Alaska, 2006-2024. The 5-D display of seismic activity shows the variable space-time intensity of earthquake energy release in the region; in particular, the irregular shapes of aftershock clusters including those of the seven major earthquakes (red triangles).
We applied uniformly the same methodological approach described in (Bukchin et al., 2020) and earlier in (Kossobokov and Nekrasova, 2019; Kossobokov and Nekrasova, 2017). Specifically, for each of the four major M ≥ 7.0 earthquakes that occurred in Southern Alaska during 2020–2024 (i.e., 22 July 2020, Mw 7.8, 105 km SSE of Perryville; 19 October 2020, Mw 7.6, 97 km SSE of Sand Point; 29 July 2021, Mw 8.2, 99 km SE of Perryville; and 16 July 2023, Mw 7.2, 106 km S of Sand Point) we analyzed the foreshock and aftershock sequences. These were characterized in terms of their variations and scaling properties, including the behaviour of the control parameter η = τ × 10B×(5−M) × LC (where τ is the time between the two successive earthquakes, M is the magnitude of the second one, and L is the distance between the two) of the Unified Scaling Law for Earthquakes (USLE) that generalizes the Gutenberg-Richter relationship as follows (Kossobokov, 2021):
where N(M, L) is the number of earthquakes of a certain magnitude M expected in a year within an earthquake-prone area of diameter L; A and B are constants characterizing the annual rate of magnitude 5 events and the magnitude exponents analogous to a- and b-values of the Gutenberg-Richter relationship, and C estimates the fractal dimension of the epicenter loci at a given site.
Additionally, we conducted a detailed analysis of surface wave records to reconstruct the earthquake source, approximating the second moments of the stress glut tensor to derive integral estimates of source length, orientation, and temporal development. Same as in our previous study (Bukchin et al., 2020), we estimated source parameters of the four recent major seismic events from surface wave data. Records at broadband seismic stations of the IRIS, GEOFON, and GEOSCOPE networks (Danish Seismological Network, 2023; GEOFON seismic network, 1993; Geoscope, 1982; Scripps Institution of Oceanography, 1986; Albuquerque Seismological Laboratory /USGS, 1992; Albuquerque Seismological Laboratory/USGS. Global SeismographNetwork, 2014) were analyzed using a frequency-time analysis (FTAN) procedure (Levshin et al., 1989) to isolate fundamental modes of Rayleigh and Love waves and to estimate their spectra. Waveforms with a low signal-to-noise ratio (<3) were rejected from further calculations. The data on a number of the selected seismic stations, their minimum and maximum epicenter distances, and periods, in which surface waves were filtered, are presented in Table 1. It is worth noting that for each study earthquake an azimuthal distribution of the analyzed stations is uniform (Figure 3).
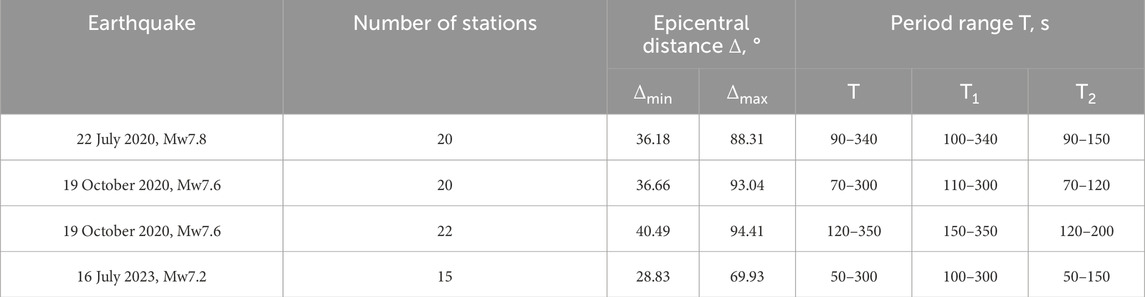
Table 1. Initial data for calculations of source parameters for the four major earthquakes in Southern Alaska in 2020–2023. Notes: T is a period range in which surface waves were filtered. T1 and T2 are period ranges used for calculations of source parameters in an instant point source and finite source approximations, respectively.
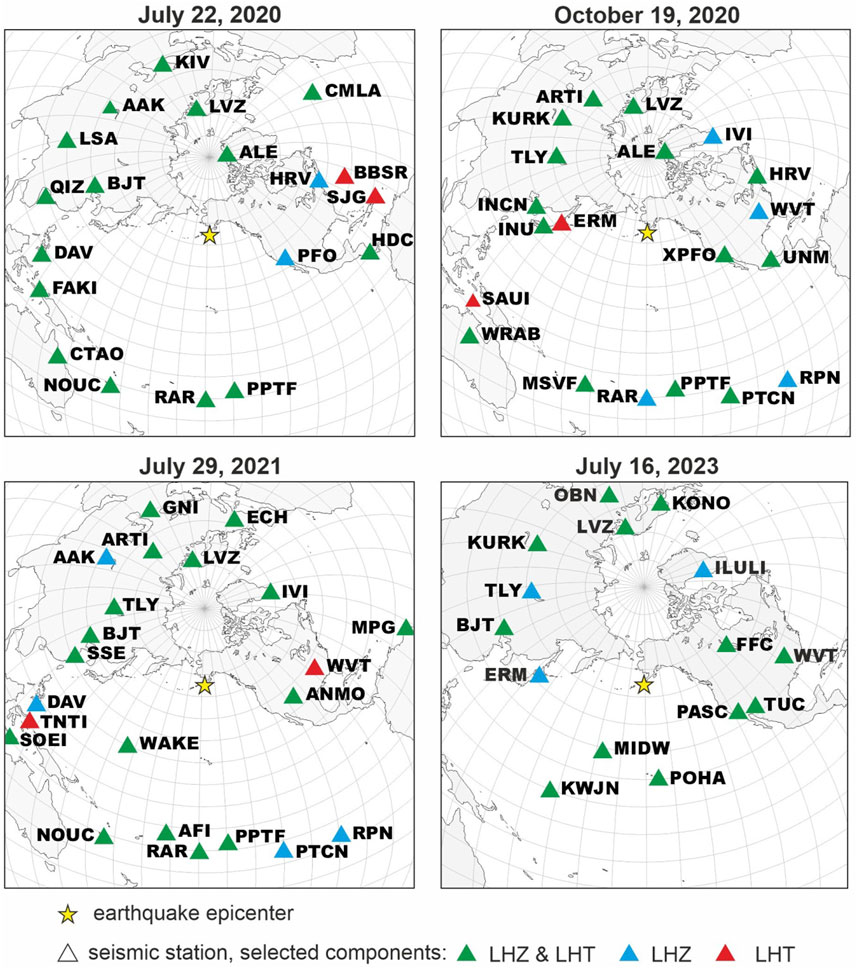
Figure 3. Epicenters of the studied earthquakes and seismic stations, which records are used in the inversion of source parameters. LHZ is a vertical component of the record, LHT is a transversal component obtained from the rotation of the LHN (northern) and LHE (eastern) components.
Earthquake source parameters were calculated in two stages:
First, we modelled each seismic event in an instant point source approximation assuming a source to be a pure double-couple (Bukchin, 1990). In this case, a source can be determined by its depth, scalar seismic moment, and focal mechanism, which can be presented in terms of two equivalent nodal planes (their strike, dip and slip angles) or principal stress axis (compression (P), tension (T) and null (B) axis characterized by their azimuths and plunge angles). We estimated the source parameters by systematic exploration of 5D parametric space minimizing residuals between synthetic and determined using the FTAN procedure amplitude surface wave spectra. A moment magnitude was calculated from a relation by Hanks and Kanamori (1979). It is well-known that a unique focal mechanism solution cannot be obtained from surface wave amplitude spectra only – there are four equivalent solutions which differ in the directions of slip and vertical axes (Mendiguren, 1977). To constrain a unique focal mechanism, P-wave first-motion polarities are used (Lasserre et al., 2001; Bukchin et al., 2020). Nevertheless, P-wave polarities, published in bulletins, are controversial in many cases and surface wave phase spectra can be applied to choose one of four equivalent solutions (Filippova and Fomochkina, 2023; 2024). The latter approach was preferred in this study. The period range, used for each of the considered earthquakes for modeling in an instant point source approximation, is presented in Table 1.
Second, an earthquake source was assumed to be an elliptical dislocation with a finite duration of faulting and we estimated its six integral characteristics: lengths of a source ellipse major and minor axis (lmax and lmin), duration (Δt), modulus of an average value of an instant centroid velocity (|v|), an angle between the fault strike axis and major axis of source ellipse (φl), and an angle between the fault strike axis and instant centroid velocity axis (φv) (Backus, 1977a; Backus, 1977b; Bukchin, 1995). The residual function, defined at the same manner as at the first stage of the inversion, was minimized by systematic exploration of a 6D parametric space. Both the nodal planes, obtained previously, were tried for probable identification of the fault plane (Bukchin, 2017). Naturally, shorter periods were used for calculations (Table 1). To determine real source dimensions and duration, the integral characteristics – lengths of a source ellipse major and minor axis and duration – should be multiplied by 2.5 and 3, respectively (Bukchin et al., 2020).
We calculated synthetic surface wave spectra using a model of weak lateral inhomogeneity of the Earth’s structure (Babich et al., 1976; Woodhouse, 1974). Therefore, the Green’s function of surface waves depends only on the medium structure in the vicinity of an earthquake source and under a seismic station (Bukchin, 1990; 1995). We modeled the crustal structure using the 3SMAC 3D global crustal model (Nataf and Ricard, 1996). It is worth noting, that the inversion results are robust relative to a choice of the crustal model (Seredkina and Kozmin, 2017; Seredkina et al., 2020). The PREM model was applied to describe the mantle structure and to calculate surface wave attenuation (Dziewonski and Anderson, 1981) with different methods (Sipkin, 1982; Dziewonski and Anderson, 1983; Kanamori and Rivera, 2008; Hayes et al., 2009).
3 Results
3.1 Characterizing earthquake sequences
Figure 4 shows the spatial distribution and temporal clustering of seismicity around the epicenters of the four analyzed major earthquakes. The epicenters of M ≥ 2.5 earthquakes from the ANSS catalogue, located within angular distances of 2.5° for the 22 July 2020; 19 October 2020; and 29 July 2021, main events, and within 1° for the 16 July 2023, main event, are displayed as small blue crosses. These represent the background seismicity within the 10 years preceding each major earthquake. Yellow circles highlight the foreshock activity, showing earthquakes that occurred within 128 days before the origin time of each major event, which time interval allows for a sevenfold doubling of the 1-day period appropriate in analyzing either acceleration or deceleration of a daily time series.
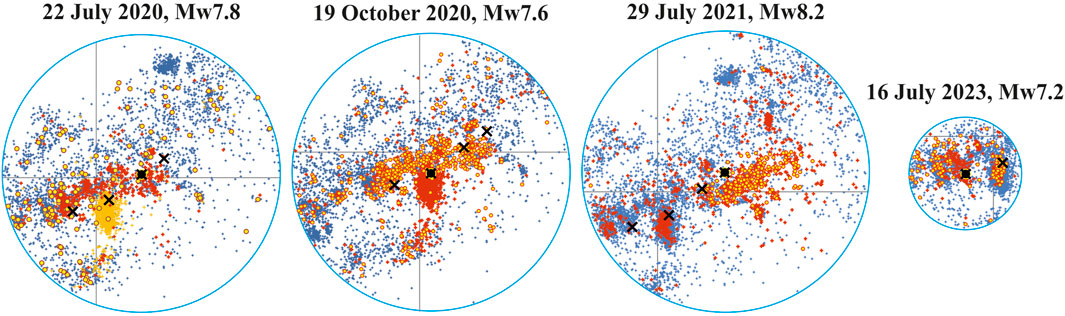
Figure 4. Epicenters of the M ≥ 2.5 earthquakes at angular distance of 2.5° and 1° from the epicenter (black square) of each of the four major earthquakes (black crosses) in Southern Alaska. Notes: Small blue crosses are epicenters of earthquakes 10 years in advance each of the four major shocks. Yellow circles and small red crosses are those events occurring within 128 days before and 128 days after the origin time of a major event, respectively; small dark yellow crosses on the 22 July 2020, Mw7.8 plate are aftershocks of the 19 October 2020, Mw7.6 earthquake as well, for which the Mw7.8 event appears as a major foreshock some 39 days in advance its origin time. Two out of the four epicenters of the major earthquakes fall out of the smaller circle associated with the Mw7.2 earthquake on 16 July 2023. Latitude 55°N and longitude 160°N are marked grey.
We analyzed the distribution of inter-event times between earthquakes in foreshock and aftershock series in terms of the USLE control parameter η, which according to Bak et al. (2002) is in charge of inter-event times between earthquakes.
The characteristics of the seven major earthquakes including those in 2016–2018 (Bukchin et al., 2020) are given in Table 2.
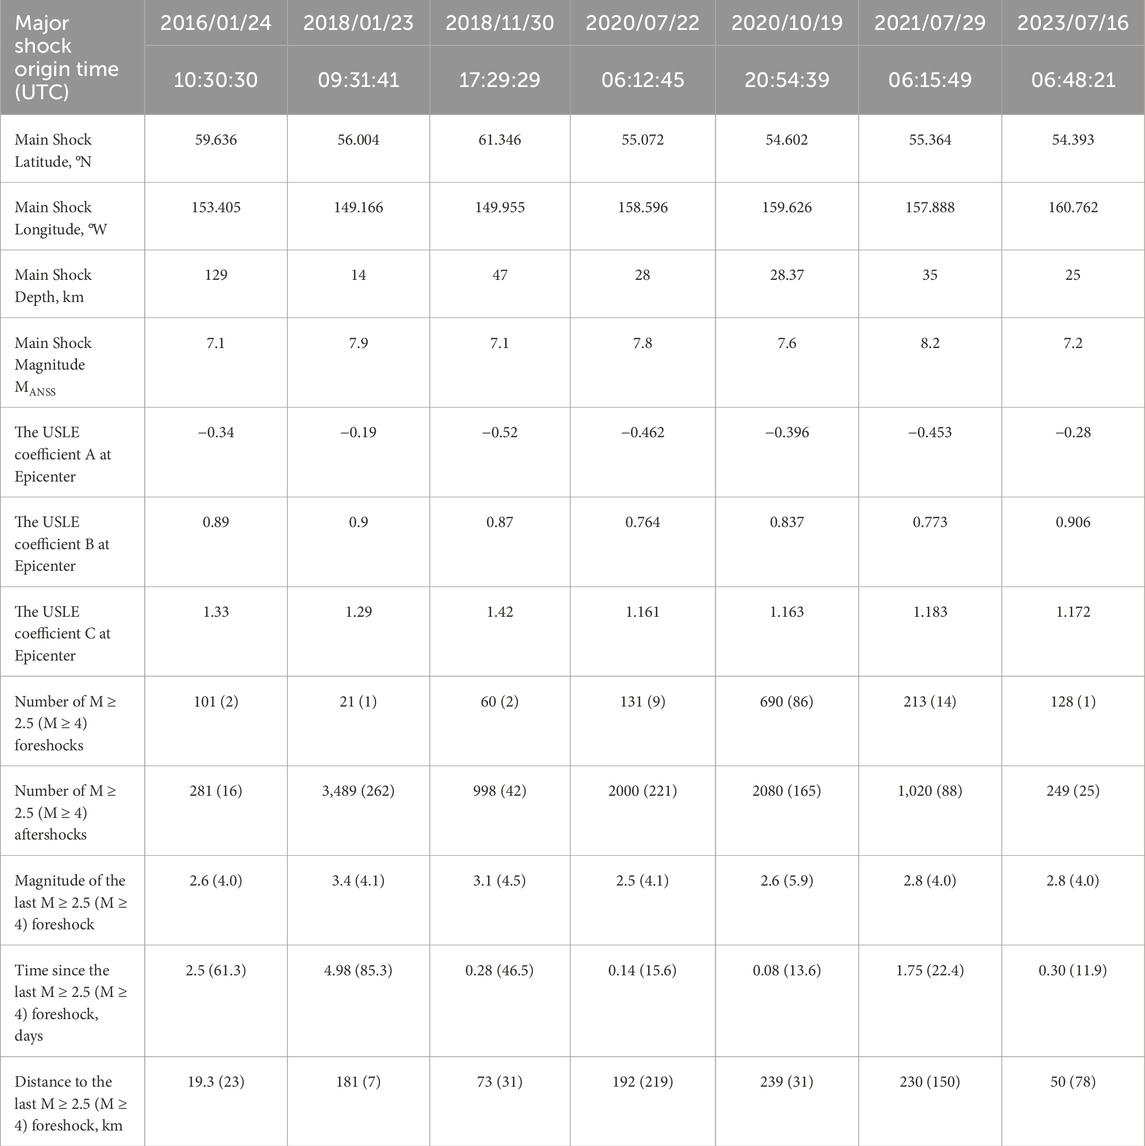
Table 2. Characteristics of the seven major earthquake series in Southern Alaska, 2016–2023. Notes: Shaded grey the results from (Bukchin et al., 2020). Coefficients of the Unified Scaling Law for Earthquakes (USLE) are from the global map determinations available from the ISC Dataset Repository (Nekrasova and Kossobokov, 2019).
Figure 5 illustrates the evolution of the USLE control parameter η in the vicinity of four major earthquakes in Southern Alaska during 2013–2024. The values of parameter η are shown as small crosses plotted against the origin time of earthquakes within angular distances of 2.5° for the Mw7.8 (22 July 2020), Mw7.6 (19 October 2020), and Mw 8.2 (29 July 2021) main shocks, and within 1° for the Mw7.2 (16 July 2023) event. The average <η> values per 50 events are depicted as lines in each panel, providing a smoothed presentation of the USLE control parameter variation over time.
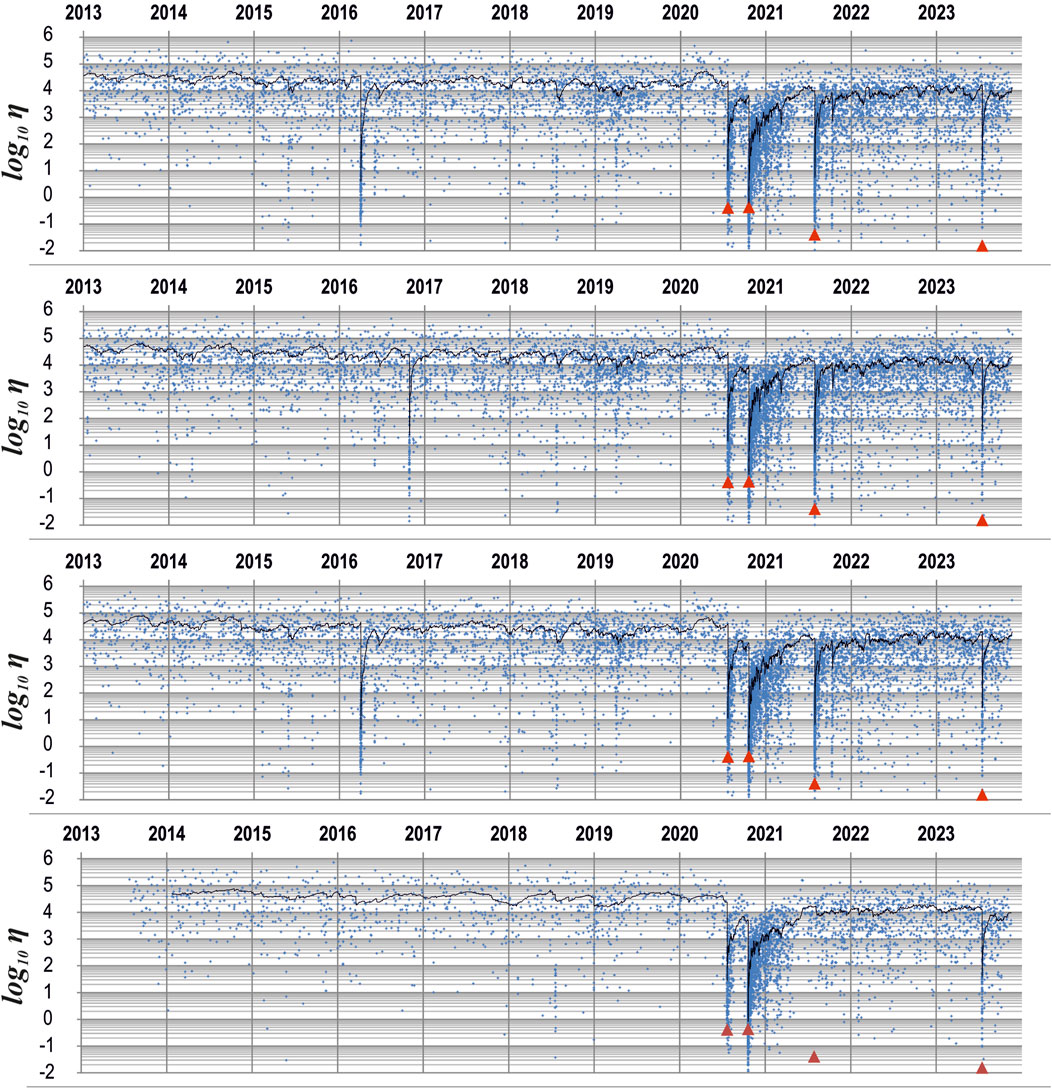
Figure 5. The values of the USLE control parameter η (little crosses) versus earthquake origin time within angular distance of 2.5° from the epicenters of the MW7.8 2020/07/22 (top panel), MW7.6 2020/10/19 (second panel), and MW8.2 2021/07/29 (third panel) and within 1° from the epicenter of the MW7.2 2023/07/16 (bottom panel) main shocks. Black lines display the 50 per moving averages <η> of the control parameter.
The top panel in Figure 5 shows the <η> trends in advance and after the 22 July 2020 main shock. One can see that shortly after a spike associated to the 2 April 2016, Mw6.2 earthquake 98 km NNE of Chignik Lake the <η> curve remains relatively stable in the years leading up to the main shock, showing minor fluctuations around a baseline level except for a notable increase-then-decrease in 2020 shortly before July 22, 2020, Mw7.8 shock, indicating a detectable drop in seismic activity in the region, which could be regarded as precursory quiescence observable in the overlap of the three 2.5° circles in Figure 4. Following the Mw7.8 earthquake, <η> experiences a sharp drop, reflecting a significant release of accumulated stress. In spite of a sharp rise due to the aftershocks of July 22 main shock, the level of <η> was still 5 times lower in the first days of October in advance the Mw7.6 earthquake on 19 October 2020 (Figure 5, second panel). Similarly, the rise of the <η> level after a sharp drop on October 19 did not reach the baseline level in the vicinity of the MW8.2 earthquake before its occurrence on 29 July 2021; the sharp drop and rise of <η> resumed at rather stable level about 104 to be compared to 7 × 10⁴ in May 2020 (Figure 5, third panel). In a smaller 1° vicinity of the Mw7.2 earthquake on 16 July 2023 (Figure 5, bottom panel) the evolution of <η> is in common to its behaviour in larger 2.5° vicinities of the other three major earthquakes except for missing a spike associated with the Mw8.2 earthquake, which epicenter and most of its aftershocks fall outside the small 1° circle in Figure 4.
For each of the four major earthquakes Figure 6 provides in detail analysis of the 50 per moving averages <η> given in logarithmic scale of days before (t* ˗ t) and after (t ˗ t*) the main shock origin time, t*. Specifically, 128 days before (left of the four panels) and 128 days after the main shocks origin time (right of the four panels) are presented. That choice of time interval allows for a sevenfold doubling of the 1-day period which is appropriate in analyzing either acceleration or deceleration of a daily time series. The decay of the aftershock series appear following the power law trends in all the four cases in Figure 6. Moreover, although the best fit of individual η values show up not so high goodness of fit (R2 in range from ¼ to ⅔), its 50-points moving average <η> fits quite well the Omori law (R2 > 0.9) for all the seven aftershock series of the major earthquakes in 2016–2023 (Bukchin et al., 2020; Figure 6). The evident flattering of <η>(t ˗ t*) observed for the 2016, 2021, and 2023 series after 80, 30, and 35 days after the major shock, respectively, suggests an early termination of direct impact on local seismic activity in these three out of seven cases. Table 3 lists the best fit power laws for the USLE control parameter individual η(t ˗ t*) values and its moving average <η>(t ˗ t*) in the first 128 days after the major shocks of Southern Alaska.
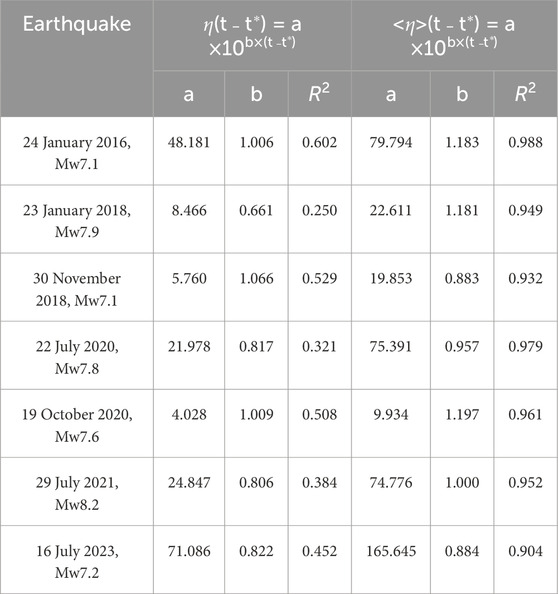
Table 3. The best fit power law for USLE control parameter η(t ˗ t*) and its moving average <η>(t ˗ t*) in the first 128 days after the origin time of the major shock t*.
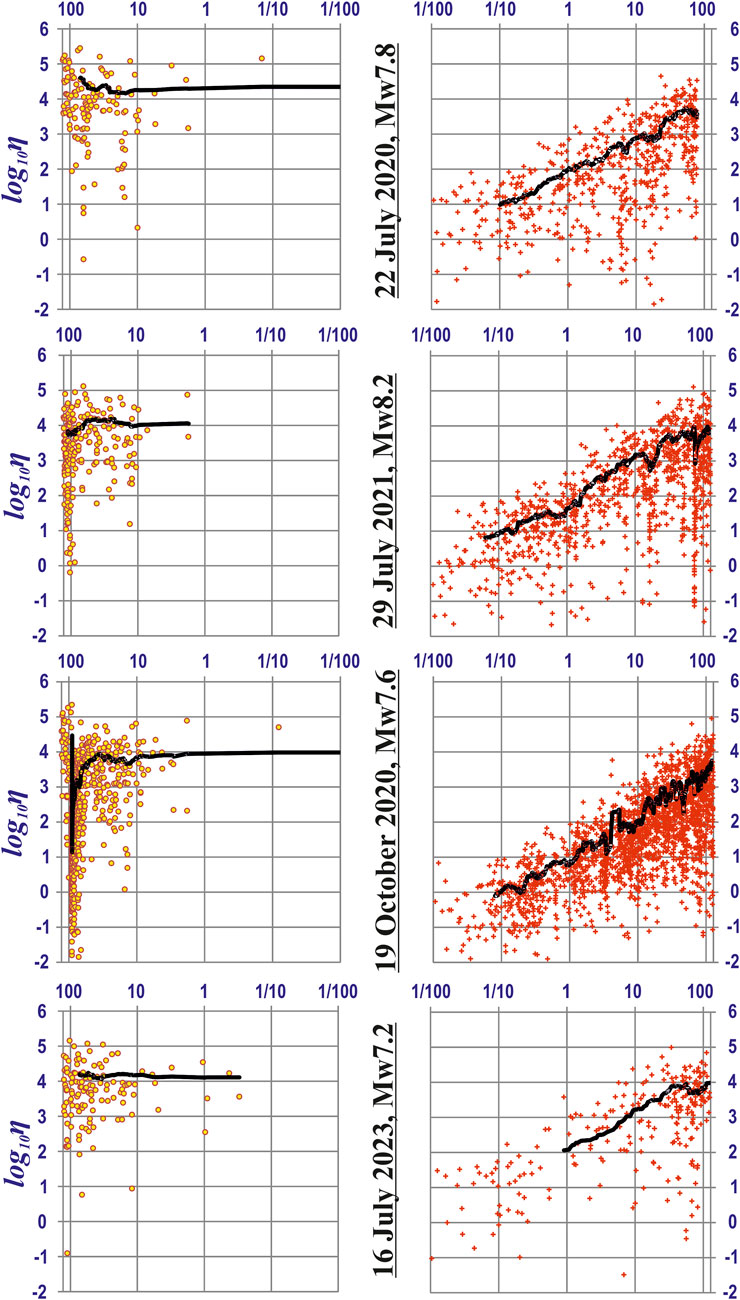
Figure 6. The USLE control parameter η in advance (yellow circles) and after (red points) each of the four major shocks. Time is given in days before (t* ˗ t) and after (t ˗ t*) each major earthquake origin time, t*. The black line marks the 50 per moving average. Note the span of 89 days between the two major earthquakes of July 22nd and 19 October 2020.
3.2 Characterizing an earthquake source
The parameters of the study earthquakes, calculated in an instant point source approximation, are shown in Figures 7, 8. In all the cases, they are characterized by low residuals (ɛ < 0.4) evidencing for good data fitting. Moreover, the resolution of the obtained parameters is rather high that is illustrated for the depth values (Figure 7) which are distributed in the range of 22–38 km. In contrast to strong seismic events in 2016–2018 demonstrating diverse focal mechanisms (Bukchin et al., 2020), thrust fault movements were realized in the sources of the 22 July 2020, 29 July 2021, and 16 July 2023 earthquakes, i.e., they were formed under the influence of the dominating SE-NW compression (Figure 8). This is in accordance with a lithospheric stress-strain pattern reported in the latest release of the World Stress Map (WSM) – WSM 2016 (Heidbach et al., 2016) – and is controlled by the NW subduction of the Pacific plate which rate is about 6.5 cm/yr in the considered region (DeMets et al., 2010). The focal mechanism of the 19 October 2020 earthquake is quite different as it demonstrates strike-slip motions along the nearly NS-oriented nodal plane (Figure 8). The occurrence of this event is connected, on the one hand, with the 22 July 2020 mainshock and subsequent afterslip (Herman and Furlong, 2021) and, on the other hand, it can be facilitated by structural heterogeneity of the Pacific slab, namely, by changes in the plate hydration (Gou et al., 2022).
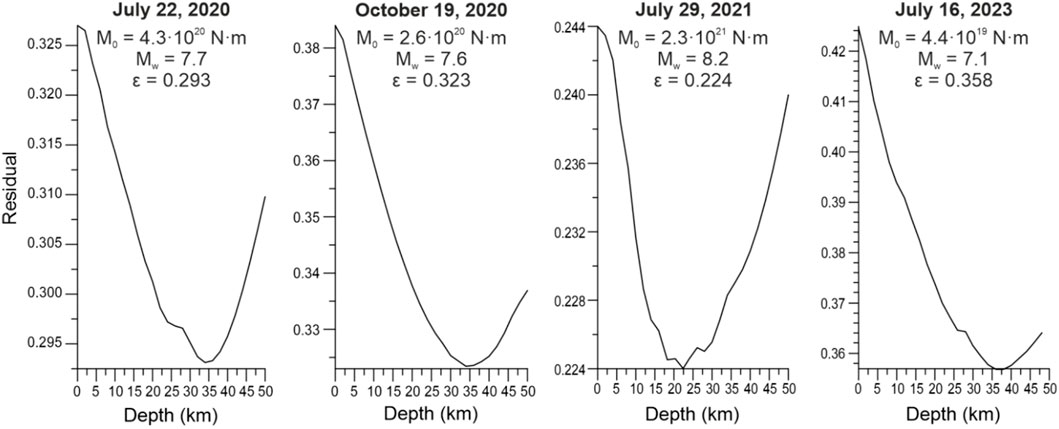
Figure 7. Source depth residual functions, scalar seismic moments, moment magnitudes and residuals determined in this study for the four major earthquakes in Southern Alaska, 2020–2023.
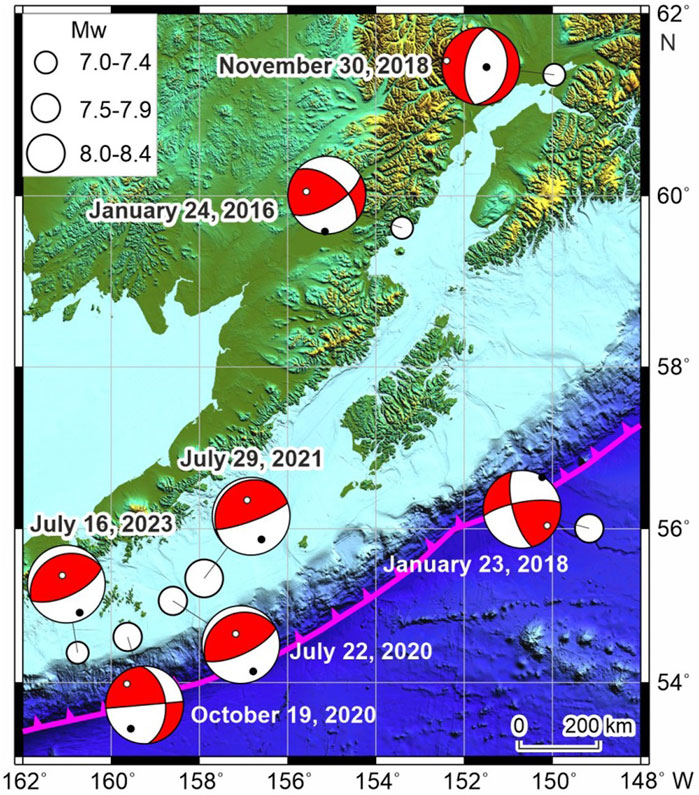
Figure 8. Focal mechanisms of seven major earthquakes in Southern Alaska, 2016–2023 determined in this study and in (Bukchin et al., 2020). Notes: The plate boundary according to (Bird, 2003) is plotted by the thick magenta line. The ETOPO 2022 elevation model (NOAA National Centers for Environmental Information, 2024) is used to image the topography and bathymetry.
The integral source characteristics with their residuals, determined for the both calculated nodal planes, are presented in Table 3 and include earlier determinations (Bukchin et al., 2020). We find resolution of characteristics in this study being unequal: it is good for the length of a source ellipse major axes and duration, as their uncertainties do not exceed 5 km and 3 s, respectively. It is also acceptable for both the estimated angles but it is poor for the other two parameters – the length of a source ellipse minor axes lmin and modulus of an average centroid velocity |v|. For lmin the range of values with very close residuals can be as wide as 20 km. For |v| the uncertainty is about 0.7 km/s. Therefore, in our further analysis we focus on the well-resolved integral parameters lmax and Δt and related real rupture lengths and durations.
According to surface wave theory (Bukchin, 2017), a fault plane can be distinguished from calculations of the integral source characteristics as they are characterized by lower residuals than values determined for the second auxiliary nodal plane. It is applicable for pure strike-slip earthquakes while the selection of the fault plane is difficult for pure thrust and normal faults. From the study seismic events, only the 19 October 2020 earthquake has a significant strike-slip component in its focal mechanism solution (Figure 8). Naturally, the residual values related to different nodal planes vary significantly in this case evidencing for the near-longitudinal (strike = 355°) inclined (dip = 45°) nodal plane to be a fault plane (Table 4). It is confirmed by the orientation of the aftershock epicenter field (Herman and Furlong, 2021). For the other considered seismic events, in which sources thrust-fault movements dominate, residual values are almost identical for both the nodal planes and selection of the fault plane requires additional data. As all of them are likely to be connected with the subduction of the Pacific plate under the North American plate, we suggest that nodal planes with dip angles close to the slab dip to be fault planes. As an average dip of the Alaska-Aleutian slab is 11–14 according to the Slab 2.0 model (Hayes et al., 2018), gently-dipping nodal planes (dip angle values are in the range of 11°–25°) are preferred as fault planes, and steep nodal planes are, consequently, the auxiliary ones. For the 22 July 2020 and 16 July 2023 earthquakes, these nodal planes are formally characterized by lower residuals confirming that even a small difference in the residuals can provide information on a fault plane that has been shown previously by the detailed seismotectonic analysis of some weak and strong seismic events (Filippova and Fomochkina, 2023; 2024; Filippova et al., 2022; 2024). Nevertheless, lower residuals are attributed to the auxiliary nodal plane in the case of the largest 29 July 2021, Mw8.2 earthquake. Moreover, the length of the minor axes, calculated for the fault plane, is obviously overestimated. Taking this into account, we consider the nodal with a dip angle of 11° as a fault plane for this event.
Based on the obtained integral characteristics (Table 4) and the fault plane selection discussed above, we can estimate real fault duration (t) and rupture length (L) multiplying lmax and Δt by 3 and 2.5, respectively (Bukchin et al., 2020). Therefore, the most compact source with t = 12 s and L = 50 km is observed for the 16 July 2023 earthquake. As expected, the most long (300 km) and long-lasting (66 s) rupture is attributed to the 29 July 2021 earthquake. The 22 July 2020, Mw7.8, and 19 October 2020, Mw7.8 events are characterized by t = 45 s, L = 187 km and t = 36 s, L = 112 km, respectively.
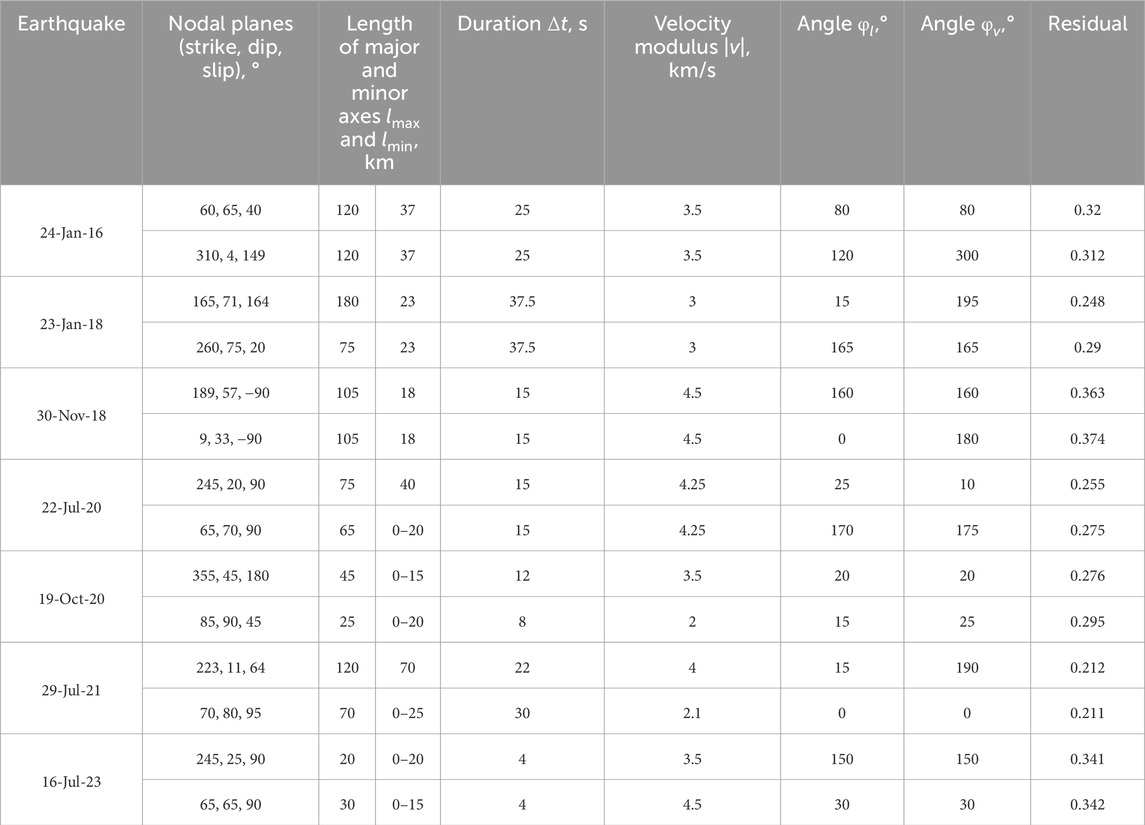
Table 4. Integral source characteristics for the seven major earthquakes in Southern Alaska, 2016–2024. The earthquake source parameters are given for each of the two nodal planes.
4 Discussion and conclusion
Focal mechanism solutions obtained for the considered earthquakes from surface wave analysis and reported by various seismological agencies (GCMT, USGS, GEOFON) agree well with each other (Table 1S of the Supporting Information). Quantitatively, the difference between them can be estimated by calculating the Kagan angle Φ–an angle in a 3-D space by which one double-couple can be rotated into another one (Kagan, 1991; 2007). Its minimum value Φ = 0° corresponds to identical focal mechanisms. Its maximum value is 120°. The focal mechanisms, determined from surface wave analysis in this study, are used as the reference solutions. For all the considered earthquakes, the Kagan angles do not exceed 30°, indicating good agreement between results obtained with different methods. It is worth noting that all the deviatoric seismic moment tensors, determined in the seismological agencies, are characterized by a small compensated linear vector dipole component (Supplementary Table S1 of the Supporting Information), i.e., they are very close to a pure double-couple model assumed in our calculations.
Scalar seismic moments and moment magnitudes, estimated using various approaches, are close to each other for the study earthquakes (Supplementary Table S1 of the Supporting Information). Difference in their magnitude values, which is likely connected with difference in the frequency ranges of the initial data, does not exceed 0.2 that is typical for seismic events with a comparable energy level (Kagan, 2003; Filippova and Fomochkina, 2023). Variations in source depth values are more significant as they can be as large as tens of kilometres (Supplementary Table S1 of the Supporting Information). The same tendency is observed in special studies, for instance, the source depth of the 29 July 2021 earthquake is estimated in the depth range from about 24 km (Sunil et al., 2022) to 33–35 km (Liu et al., 2022; Ye et al., 2022). On the one hand, it could be a result of uncertainties arising in depth determinations based on teleseismic data. On the other hand, it could be due to a finite width of an earthquake source (Table 4). Scattering in depth determinations are also mentioned for three strong earthquakes in Southern Alaska in 2016–2018 (Bukchin et al., 2020).
A good agreement is observed for rupture length and duration, determined for the 16 July 2023 earthquake in this study, and the USGS finite-fault model (https://earthquake.usgs.gov/earthquakes/eventpage/us7000kg30/finite-fault) evidencing for the coseismic slip distribution in a compact area. Close values are also obtained for both the discussed parameters of the 19 October 2020 seismic event and the fault length of the 22 July 2020 earthquake. In the latter case, our estimate of the rupture duration (45 s) is significantly lower than the total time of moment release provided by USGS (∼110 s). Nevertheless, the maximum moment release is concentrated in a time range of about 50 s which is consistent with our results. It is interesting to note that the 19 October 2020 earthquake has longer and more long-lasting rupture in comparison with the 16 July 2023 event with the same moment magnitude. This could be due to the fact that strike-slip earthquakes can rupture the connected fault segments more easily and, consequently, produce longer ruptures than those developed by dip-slip events of the same magnitude (Leonard, 2010; Thingbaijam et al., 2017).
Two USGS finite-fault models are available for the 29 July 2021 earthquake (https://earthquake.usgs.gov/earthquakes/eventpage/ak0219neiszm/finite-fault). One of them is based on teleseismic data only and shows the rupture duration of 98 s and the non-zero coseismic slip in the area of about 300 km long. The second one, also incorporating regional strong-motion and GNSS data, evidences for a more compact seismic source with duration of 68 s and large slips extend along approximately 175 km rupture. This model better suits the tsunami modelling results (Mulia et al., 2022). Close estimates of the length of maximum slip distribution are provided in most of special studies (Liu et al., 2022; Mulia et al., 2022; Sunil et al., 2022; Ye et al., 2022). Nevertheless, the slip is non-zero in a wider area whose lengths is up to 300 km in all the discussed models that does not contradict our results (L = 300 km). Our rupture duration (66 s) is also consistent with the regional USGS finite-fault model and estimates by Ye et al. (2022). In contrast, Liu et al. (2022) give the total rupture duration of ∼110 s, while the main phase of the moment release is about 70 s.
Our analyzes of earthquake sequences associated to the recent major shocks in Southern Alaska, 2016–2023, (Bukchin et al., 2020; this study), appear to confirm once again that their occurrences are not random, but rather lacking any obvious principle of organization (Kossobokov and Nekrasova, 2017; Kossobokov and Nekrasova, 2019; Kossobokov et al., 2022; Kossobokov and Nekrasova, 2024). Moreover, Nekrasova et al., 2011 have demonstrated a complex distribution of the USLE coefficients A, B, and C, which do not display any evident general correlation, although following well-organized attractor in the 3D domain of possible values. Liu and Kossobokov (2021) described the observed high variability of the correlation between geodetic and seismic integrals in advance and after the 2004 Sumatra–Andaman Mw9.2 earthquake in the Indian Ocean, the 2011 Tohoku Mw9.1 earthquake in Japan, the 2010 offshore Maule Mw8.8 and the 2015 Illapel Mw8.3 earthquakes in Chile, the 2018 Kodiak Mw7.9 earthquake in the Gulf of Alaska, and the 2016 Kaikoura Mw7.8 earthquake in New Zealand, which are indicative of a partial contribution of earthquakes to a generally aseismic apparently sporadic motion of small lithospheric blocks.
A uniform characterization of the fore- and aftershock sequences of the recent major earthquakes in Southern Alaska confirms the existence of the long-term periods of seismic stability defined by the averages of the USLE control parameter <η> that are interrupted by mid- or even short-term bursts of activity associated with catastrophic events. Neither of the two Mw7.1 events on 24 January 2016 and 30 November 2018 showed a change in the level of <η> observed in advance of their origin times, while the other five major shocks have eventually decreased the level of stable <η> by a factor of 4 for the 23 January 2018, Mw7.9 Kodiak earthquake, which aftershock series appears to continue, and by a factor of 2 for the cluster of the four most recent major shocks SW off the 1964 Great Alaskan earthquake rupture zone.
Apparently all the seven aftershock series follow the Omori power law trends, characterized by high goodness of fit for the USLE control parameter 50 per moving average <η>. There is a notable agreement in coefficients of the <η> Omori law fit for the aftershocks of the 22 July 2020, Mw7.8, and the 29 July 2021, Mw8.2 earthquakes, which are the nearest in location among the seven events considered. The evident flattering of <η> in aftershock series after 80, 30, and 35 days passed the 24 January 2016, Mw7.1, the 29 July 2021, Mw8.2, and the 16 July 2023, Mw7.2 major shocks, respectively, suggests an optional early termination of direct impact on local seismic activity independent of the earthquake magnitude in these three out of seven cases (Table 2). On the other hand, the above mentioned <η> series of the 2018 Kodiak earthquake keeps growing following the Omori power law trend for more than 7 years. It is also notable that in this case as shown in (Liu and Kossobokov, 2021) the correlation of large variance resides around steady low levels of 0.1–0.2 between geodetic and seismic integrals, except for an excursion to highly coherent values about 1 lasted just for 2 weeks after the main shock. This Mw7.9 strike-slip earthquake 280 km SE of Kodiak Island occurred right in front of the southern border of the rupture zone of the 1964 Great Alaska, Mw9.3 mega-earthquake.
Thus, the uniform analyzes of foreshock-main shock-aftershock sequences in Central Italy, New Zealand, Southern Alaska, Japan, Taiwan, and worldwide (5, 9, 7, 1, 1, and 156 cases, respectively) do not support a unique scenario in seismic energy release, but (i) provide fundamental constrains on modelling realistic earthquake sequences, (ii) give a new confident insight into better understanding of regional seismic dynamics, and (iii) can be used to improve seismic hazard assessments, including forecast/prediction claims at different magnitude-space-time scales.
It seems premature to discuss if the observed quantitative characteristics of seismic variability and their scaling properties at regional scale in Southern Alaska (the level of the η moving average, in particular) disclose clear patterns useful in operational forecasting of extreme seismic catastrophes, due to the yet rather small number of the abovementioned regional and global case studies. Nevertheless, the observed group of seven major (Mw ≥ 7) earthquakes (see Figures 1, 2, 9) calls for a special attention and monitoring of the ongoing seismic activation in the Pacific Northeast, in particular, keeping in mind the above mentioned on-going development of the seismic process at the northern boundary of the Pacific plate.
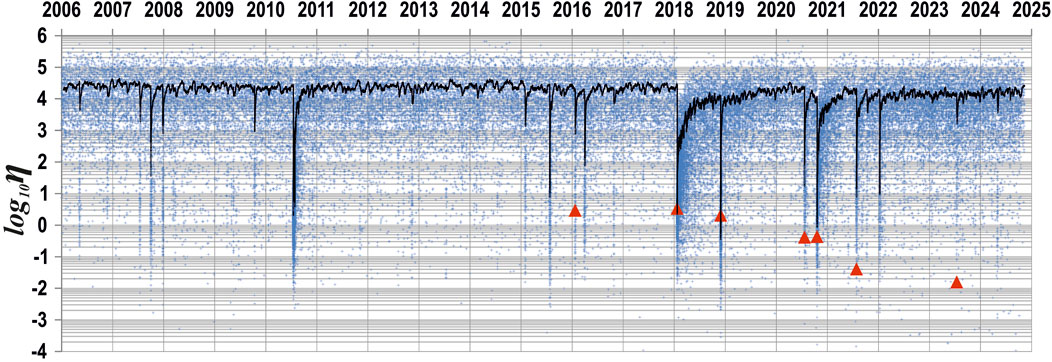
Figure 9. The values of the USLE control parameter η (little crosses, red triangles at the times of major Mw ≥ 7.0 earthquakes) within the geographic bounds of 50°–65°N and 140°–170°W Black line displays the 50 per moving average <η> of the control parameter.
Data availability statement
Publicly available datasets were analyzed in this study. This data can be found here: Advanced National Seismic System (ANSS) Comprehensive Catalog of Earthquake Events and Products (https://earthquake.usgs.gov/data/comcat accessed 25 November 2024). Unified Scaling Law for Earthquakes: Global Map of Parameters https://doi.org/10.31905/XT753V44, hosted at the International Seismological Centre (ISC) Dataset Repository. Wilber 3: Select Event (https://ds.iris.edu/wilber3/find_event). Data were accessed from the NSF SAGE data archive operated by EarthScope Consortium (NSF award 1724509).
Author contributions
AFI: Visualization, Investigation, Conceptualization, Writing – review and editing, Writing – original draft. AFO: Writing – review and editing, Writing – original draft, Software, Conceptualization, Visualization, Investigation. VK: Writing – original draft, Visualization, Conceptualization, Methodology, Data curation, Writing – review and editing, Investigation. AN: Writing – review and editing, Software, Investigation, Conceptualization, Writing – original draft, Visualization.
Funding
The author(s) declare that no financial support was received for the research and/or publication of this article.
Acknowledgments
The study is carried on in the framework of the Russian State Task of Scientific Research Works of IEPT RAS.
Conflict of interest
The authors declare that the research was conducted in the absence of any commercial or financial relationships that could be construed as a potential conflict of interest.
The authors declared that VK was an editorial board member of Frontiers, at the time of submission. This had no impact on the peer review process and the final decision.
Generative AI statement
The authors declare that no Generative AI was used in the creation of this manuscript.
Any alternative text (alt text) provided alongside figures in this article has been generated by Frontiers with the support of artificial intelligence and reasonable efforts have been made to ensure accuracy, including review by the authors wherever possible. If you identify any issues, please contact us.
Publisher’s note
All claims expressed in this article are solely those of the authors and do not necessarily represent those of their affiliated organizations, or those of the publisher, the editors and the reviewers. Any product that may be evaluated in this article, or claim that may be made by its manufacturer, is not guaranteed or endorsed by the publisher.
Supplementary material
The Supplementary Material for this article can be found online at: https://www.frontiersin.org/articles/10.3389/feart.2025.1660221/full#supplementary-material
References
Albuquerque Seismological Laboratory (ASL)/USGS (1992). New China digital seismograph network. Int. Fed. Digital Seismogr. Netw. doi:10.7914/SN/IC
Albuquerque Seismological Laboratory/USGS. Global Seismograph Network (GSN – IRIS/USGS) (2014). Int. Fed. Digital Seismogr. Netw. doi:10.7914/SN/IU
Babich, V., Chikachev, B., and Yanovskaya, T. (1976). Surface waves in a vertically inhomogeneous elastic half-space with weak horizontal inhomogeneity. Izv. Akad. Nauk. Fiz. Zemli 4, 24–31. (in Russian).
Backus, G. E. (1977a). Interpreting the seismic glut moments of total degree two or less. Geophys. J. R. Astronomical Soc. 51, 1–25. doi:10.1111/j.1365-246X.1977.tb04187.x
Backus, G. E. (1977b). Seismic sources with observable glut moments of spatial degree two. Geophys. J. R. Astronomical Soc. 51, 27–45. doi:10.1111/j.1365-246X.1977.tb04188.x
Bak, P., Christensen, K., Danon, L., and Scanlon, T. (2002). Unified scaling law for earthquakes. Phys. Rev. Lett. 88, 178501–178504. doi:10.1103/PhysRevLett.88.178501
Bird, P. (2003). An updated digital model of plate boundaries. Geochem. Geophys. Geosystems 4 (3), 2001GC000252. doi:10.1029/2001GC000252
Bukchin, B. G. (1990). Determination of source parameters from surface wave recording allowing for uncertainties in the properties of medium. Izv. Akad. Nauk. SSSR. Fiz. Zemli 25, 723–728.
Bukchin, B. G. (1995). Determination of stress glut moments of total degree 2 from teleseismic surface wave amplitude spectra. Tectonophysics 248 (3–4), 185–191. doi:10.1016/0040-1951(94)00271-A
Bukchin, B. G. (2017). Second-moment approximation of the earthquake source and fault plane identification. Izvestiya, Phys. Solid Earth 52, 243–249. doi:10.1134/S1069351317020045
Bukchin, B. G., Fomochkina, A. S., Kossobokov, V. G., and Nekrasova, A. K. (2020). Characterizing the foreshock, main shock, and aftershock sequences of the recent major earthquakes in southern Alaska, 2016–2018. Front. Earth Sci. 8, 584659. doi:10.3389/feart.2020.584659
Christensen, D. H., and Beck, S. L. (1994). The rupture process and tectonic implications of the great 1964 Prince William Sound earthquake. Pageoph 142, 29–53. doi:10.1007/BF00875967
Danish Seismological Network (2023). GEUS geological Survey of Denmark and Greenland, copenhagen, Denmark. Available online at: http://www.fdsn.org/networks/detail/DK/.
DeMets, C., Gordon, R. G., and Argus, D. F. (2010). Geologically current plate motions. Geophys. J. Int. 181, 1–80. doi:10.1111/j.1365-246x.2009.04491.x
Dziewonski, A. M., and Anderson, D. L. (1981). Preliminary reference Earth model. Phys. Earth Planet. Inter. 25, 297–356. doi:10.1016/0031-9201(81)90046-7
Dziewonski, A. M., and Woodhouse, J. H. (1983). An experiment in systematic study of global seismicity: centroid-moment-tensor solutions for 201 moderate and large earthquakes of 1981. J. Geophys. Res. 88, 3247–3271. doi:10.1029/JB088iB04p03247
Filippova, A. I., and Fomochkina, A. S. (2023). Source parameters of strong Turkish earthquakes on February 6, 2023 (Mw = 7.8 and Mw = 7.7) from surface wave data. Izvestiya, Phys. Solid Earth 59 (6), 899–911. doi:10.1134/S1069351323060071
Filippova, A. I., and Fomochkina, A. S. (2024). Seismotectonic position of the source of the July 13, 2023, earthquake in the Eastern laptev sea Shelf from surface wave data. Izv. Phys. Solid Earth 60, 1116–1124. doi:10.1134/S1069351324700927
Filippova, A. I., Bukchin, B. G., Fomochkina, A. S., Melnikova, V. I., Radziminovich, Ya.B., and Gileva, N. A. (2022). Source process of the September 21, 2020 Mw 5.6 Bystraya earthquake at the south-eastern segment of the main Sayan fault (Eastern siberia, Russia). Tectonophysics 822, 229162. doi:10.1016/j.tecto.2021.229162
Filippova, A. I., Fomochkina, A. S., Gileva, N. A., Radziminovich, Ya.B., and Melnikova, V. I. (2024). The September 6, 2021 MW 5.4 tofalaria earthquake at a weakly active segment of the main sayan fault (Eastern Siberia). J. Struct. Geol. 188, 105255. doi:10.1016/j.jsg.2024.105255
GEOFON seismic network (1993). Deutsches GeoForschungsZentrum GFZ. other/seismic network. doi:10.14470/TR560404
Geological Survey, U. S. (2017). Earthquake hazards program, advanced national seismic system (ANSS) comprehensive catalog of earthquake events and products. Various. doi:10.5066/F7MS3QZH
Geoscope (1982). French global network of broad band seismic stations. Paris, France: Institut de Physique du Globe de Paris. doi:10.18715/GEOSCOPE
Gou, T., Xia, S., Huang, Z., and Zhao, D. (2022). Structural heterogeneity of the alaska-aleutian forearc: implications for interplate coupling and seismogenic behaviors. J. Geophys. Res. Solid Earth 127, e2022JB024621. doi:10.1029/2022JB024621
Gutenberg, R., and Richter, C. F. (1944). Frequency of earthquakes in California. Bull. Seism. Soc. Am. 34 (4), 185–188. doi:10.1785/BSSA0340040185
Hanks, T., and Kanamori, H. (1979). A moment magnitude scale. J. Geophys. Res. 84 (B5), 2348–2350. doi:10.1029/JB084iB05p02348
Hayes, G. P., Rivera, L., and Kanamori, H. (2009). Source inversion of the W-phase: real-Time implementation and extension to low magnitudes. Seism. Res. Lett. 80 (5), 817–822. doi:10.1785/gssrl.80.5.817
Hayes, G. P., Moore, G. L., Portner, D. E., Hearne, M., Flamme, H., Furtney, M., et al. (2018). Slab2, a comprehensive subduction zone geometry model. Science 362 (6410), 58–61. doi:10.1126/science.aat4723
Heidbach, O., Rajabi, M., Reiter, K., and Ziegler, M. (2016). World stress map 2016. Potsdam, Germany: GFZ data service. doi:10.5880/WSM.2016.002
Herman, M. W., and Furlong, K. P. (2021). Triggering an unexpected earthquake in an uncoupled subduction zone. Sci. Adv. 7 (13), eabf7590. doi:10.1126/sciadv.abf7590
Kagan, Y. Y. (1991). 3-D rotation of double-couple earthquake sources. Geophys. J. Int. 106, 709–716. doi:10.1111/j.1365-246X.1991.tb06343.x
Kagan, Y. Y. (2003). Accuracy of modern global earthquake catalogs. Phys. Earth Planet. Inter. 135, 173–209. doi:10.1016/S0031-9201(02)00214-5
Kagan, Y. Y. (2007). Simplified algorithms for calculating double-couple rotation. Geophys. J. Int. 171 (1), 411–418. doi:10.1111/j.1365-246X.2007.03538.x
Kanamori, H. (1970). The Alaska earthquake of 1964: radiation of long-period surface waves and source mechanism. J. Geophys. Res. 75, 5029–5040. doi:10.1029/jb075i026p05029
Kanamori, H., and Rivera, L. (2008). Source inversion of W phase: speeding up seismic tsunami warning. J. Int. 175 (1), 222–238. doi:10.1111/j.1365-246X.2008.03887.x
Kossobokov, V. (2011). Are mega earthquakes predictable? Izvestiya, Atmos. Ocean. Phys. 46 (8), 951–961. doi:10.1134/S0001433811080032
Kossobokov, V. (2021). “Unified scaling law for earthquakes that generalizes the fundamental gutenberg-richter relationship,” in Encyclopedia of solid Earth geophysics. Encyclopedia of Earth sciences series. Editor H. K. Gupta (Cham: Springer), 1893–1896. doi:10.1007/978-3-030-58631-7_257
Kossobokov, V. G., and Mazhkenov, S. A. (1994). “On similarity in the spatial distribution of seismicity,” in Computational seismology and geodynamics. Editor D. K. Chowdhury (Washington DC: Am. Geophys. Union), 6–15. doi:10.1029/CS001p0006
Kossobokov, V. G., and Nekrasova, A. K. (2017). “Characterizing aftershock sequences of the recent strong earthquakes in central Italy,”, 174. Springer International Publishing AG, 3713–3723. doi:10.1007/s00024-017-1624-9Pure Appl. Geophys
Kossobokov, V. G., and Nekrasova, A. K. (2019). “Aftershock sequences of the recent major earthquakes in New Zealand,”, 176. Springer International Publishing AG, 1–23. doi:10.1007/s00024-018-2071-yPure Appl. Geophys.
Kossobokov, V., and Nekrasova, A. (2024). Myths about earthquakes: quo vadis? Acta Geol. Sin. Eng. Ed. 98 (Suppl. 1), 30–32. doi:10.1111/1755-6724.15231
Kossobokov, V. G., Nekrasova, A. K., and Schepalina, P. D. (2022). Seismic dynamics in advance of and after the largest earthquakes, 1985–2020. Geophys 43, 423–436. doi:10.1007/s10712-021-09674-0
Lasserre, C., Bukchin, B., Bernard, P., Tapponier, P., Gaudemer, Y., Mostinsky, A., et al. (2001). Source parameters and tectonic origin of the 1996 June 1 Tianzhu (Mw=5.2) and 1995 July 21 Yongden (Mw=5.6) earthquakes near the Haiyuan fault (Gansu, China). Geophys. J. Int. 144, 206–220. doi:10.1046/J.1365-246X.2001.00313.X
Leonard, M. (2010). Earthquake fault scaling: Self-consistent relating of rupture length, width, average displacement, and moment release. Bull. Seismol. Soc. Am. 100, 1971–1988. doi:10.1785/0120090189
Levshin, A. L., Yanovskaya, T. B., Lander, A. V., Bukchin, B. G., Barmin, M. P., Ratnikova, L. I., et al. (1989). “Recording, identification, and measurement of surface wave parameters,” in Seismic surface waves in a laterally inhomogeneous Earth. Modern approaches in geophysics. Editor V. I. Keilis-Borok, 9, 131–182. doi:10.1007/978-94-009-0883-3_5
Liu, T., and Kossobokov, V. G. (2021). Displacements before and after great earthquakes: geodetic and seismic viewpoints. Pure Appl. Geophys. 178, 1135–1155. doi:10.1007/s00024-021-02694-2
Liu, C., Lay, T., and Xiong, X. (2022). The 29 July 2021 MW 8.2 Chignik, Alaska Peninsula earthquake rupture inferred from seismic and geodetic observations: re-rupture of the Western 2/3 of the 1938 rupture zone. Geophys. Res. Lett. 49, e2021GL096004. doi:10.1029/2021GL096004
Mendiguren, J. A. (1977). Inversion of surface wave data in source mechanism studies. J. Geophys. Res. 82 (5), 889–894. doi:10.1029/JB082i005p00889
Mulia, I. E., Gusman, A. R., Heidarzadeh, M., and Satake, K. (2022). Sensitivity of tsunami Data to the Up-Dip Extent of the July 2021 Mw 8.2 Alaska earthquake. Seismol. Res. Lett. 93 (4), 1992–2003. doi:10.1785/0220210359
Nataf, H.-C., and Ricard, Y. (1996). 3SMAC: an a priori tomographic model of the upper mantle based on geophysical modeling. Phys. Earth Planet. Interiors 95, 101–122. doi:10.1016/0031-9201(95)03105-7
Nekrasova, A., Kossobokov, V., Peresan, A., Aoudia, A., and Panza, G. F. (2011). A multiscale application of the unified scaling law for earthquakes in the central mediterranean area and alpine region. Pure Appl. Geophys. 168, 297–327. doi:10.1007/s00024-010-0163-4
Nekrasova, A. K., and Kossobokov, V. G. (2019). Unified scaling law for earthquakes: global map of parameters. ISC’s Seismol. Dataset Repos. doi:10.31905/XT753V44
NOAA National Centers for Environmental Information (2024). ETOPO 2022 15 arc-second global relief model. NOAA Natl. Centers Environ. Inf. doi:10.25921/fd45-gt74
Press, F., and Jackson, D. (1965). Alaskan earthquake, 27 march 1964: vertical extent of faulting and elastic strain energy release. Science 147, 867–868. doi:10.1126/science.147.3660.867
Scripps Institution of Oceanography (1986). Global seismograph network – IRIS/IDA. Int. Fed. Digital Seismogr. Netw. [Data set]. doi:10.7914/SN/II
Seredkina, A. I., and Kozmin, B. M. (2017). Source parameters of the taimyr earthquake of June 9, 1990. Dokl. Earth Sci. 472, 342–345. doi:10.1134/S1028334X1702026X
Seredkina, A. I., Melnikova, V. I., Radziminovich, Y. B., and Gileva, N. A. (2020). Seismicity of the Erguna region (Northeastern China): evidence for local stress redistribution. Bull. Seismol. Soc. Am. 110, 803–815. doi:10.1785/0120190182
Sipkin, S. (1982). Estimation of earthquake source parameters by the inversion of waveform data: synthetic waveforms. Phys. Earth Planet. Int. 30 (2–3), 242–259. doi:10.1016/0031-9201(82)90111-X
Sunil, A. S., Sunil, P. S., Shrivastava, M. N., Maurya, A. K., Thomas, D., and Gonzalez, G. (2022). Seismic induced ground deformation and ionospheric perturbations of the 29 July 2021, Mw 8.2 Chignik Earthquake, Alaska. J. Geophys. Res. Space Phys. 127, e2022JA030576. doi:10.1029/2022JA030576
Thingbaijam, K. K. S., Mai, P. M., and Goda, K. (2017). New empirical earthquake source-scaling laws. Bull. Seismol. Soc. Am. 107, 2225–2246. doi:10.1785/0120170017
Woodhouse, J. H. (1974). Surface waves in a laterally varying layered structure. Geophys. J. R. Astronomical Soc. 37, 461–490. doi:10.1111/j.1365-246X.1974.tb04098.x
Wyss, M., and Brune, J. (1967). The Alaska earthquake of 28 March 1964: a complex multiple rupture. Bull. Seism. Soc. Am. 57 (5), 1017–1023. doi:10.1785/BSSA0570051017
Keywords: earthquake sequences, earthquake source, Pacific and north America plate boundary, unified scaling law for earthquakes, USLE control parameter
Citation: Filippova A, Fomochkina A, Kossobokov V and Nekrasova A (2025) Characterizing the foreshock, main shock, and aftershock sequences of the recent major earthquakes in Southern Alaska, 2020–2024. Front. Earth Sci. 13:1660221. doi: 10.3389/feart.2025.1660221
Received: 05 July 2025; Accepted: 27 August 2025;
Published: 22 September 2025.
Edited by:
Giovanni Martinelli, National Institute of Geophysics and Volcanology, ItalyReviewed by:
Boyko Ranguelov, University of Mining and Geology “Saint Ivan Rilski”, BulgariaSomak Hazra, University of Alberta, Alberta, Canada
Copyright © 2025 Filippova, Fomochkina, Kossobokov and Nekrasova. This is an open-access article distributed under the terms of the Creative Commons Attribution License (CC BY). The use, distribution or reproduction in other forums is permitted, provided the original author(s) and the copyright owner(s) are credited and that the original publication in this journal is cited, in accordance with accepted academic practice. No use, distribution or reproduction is permitted which does not comply with these terms.
*Correspondence: V. Kossobokov, dm9sb2R5YUBtaXRwLnJ1
†ORCID: V. Kossobokov, orcid.org/0000-0002-3505-7803