 Li Tao
 Wu Peng
 Hu Shanchao
 Wu boyuan1
- 1State Key Laboratory of Inteligent Construction and Healthy Operation and Maintenance of Deep Underground Engineering, China University of Mining and Technology, Xuzhou, China
- 2School of Physics and New Energy, Xuzhou University of Technology, Xuzhou, China
- 3CCTEG Chongqing Research Institute, Chongqing, China
The sandstone in open-pit coal mines frequently experiences freeze-thaw cycles and cyclic impact loads. To investigate the strength, deformation, and damage evolution laws of freeze-thaw sandstone under cyclic impacts, cyclic impact experiments was conducted by SHPB, and the failure mode was further elucidated by high-speed camera technology and SEM in the laboratory. The results indicate that: (1) The number of impacts, peak stress, and elastic modulus are negatively correlated with the number of freeze-thaw cycles. With the impacts times increasing, the peak stress and elastic modulus of sandstone initially decline gradually before plummeting sharply in the final few loadings. (2) With freeze-thaw cycles and impact quantity increasing, dissipated energy and reflected energy increase, whereas transmitted energy decreases. (3) The failure mode of sandstone is characterized by tensile failure, with cracks initially forming on the sample’s side, then propagating radially and ultimately penetrating the entire specimen. Freeze-thaw exacerbate the fragmentation of sandstone, and induce a transition from transgranular to intergranular failure. (4) As the quantity of impacts increases, the damage factor of sandstone initially rises slowly and then accelerates rapidly, which aligns with the evolution law of the peak stress of sandstone. These findings provide valuable reference for ensuring safe mining operations.
1 Introduction
In China, the majority of open-pit coal mines are situated in cold regions, characterized by frequent and periodic temperature fluctuations. Additionally, the rocks in these mines are often exposed to water. Consequently, the rocks in cold-region open-pit coal mines are highly susceptible to freeze-thaw cycles (Aleksander et al., 2023; Huang et al., 2022; Zhang et al., 2022). At present, the majority of open-pit coal mines employ delay blasting techniques. Under ultra-high pressure, the rock mass adjacent to the blasting holes experiences comminuted failure. The distant rock mass retains its structural integrity, but internal particle detachment and crack propagation occur, leading to damage. This damage significantly increases the susceptibility of the rock to slope collapse and slippage (Aleksander et al., 2023; Hongbo et al., 2011; Shi et al., 2024). Thus, investigating the mechanical properties of sandstone under freeze-thaw and cyclic impact loading, holds great significance for the safe and efficient mining of open-pit coal mines.
For various engineering conditions, researchers have employed diverse loading methods on freeze-thaw rocks to investigate their mechanical properties. Based on the differences in loading strain rates, these methods can be broadly categorized into quasi-static and impact loading. Mutluturk et al. (2004) posited that the rate of strength degradation in rocks, induced by singular freeze-thaw cycles, remains invariant. From this premise, he formulated a predictive equation correlating the uniaxial compressive strength of freeze-thawed sandstone with the quantity of freeze-thaw cycles endured. This equation has been widely acknowledged by researchers (Zhang K. et al., 2024; Zhang Q. et al., 2024; Zhang and Yang, 2024). The equation demonstrates that the integrity parameters of freeze-thawed rocks decay exponentially with increasing freeze-thaw cycles, introducing the attenuation coefficient λ. The introduction of this coefficient has sparked significant interest among researchers in evaluating the frost resistance of rocks. Khanlari and Abdilor (2015); Wu et al. (2024) conducted static uniaxial loading tests on six varieties of freeze-thaw sandstone. Their research unveiled that the mechanical strength of sandstone diminished markedly with an increasing number of freeze-thaw cycles, and that the silicate content and initial porosity were negatively correlated with the frost resistance of sandstone. However, due to the substantial variability in the physical and mechanical properties among different sandstones, this experimental approach was insufficient to isolate and examine the influence of individual variables on frost resistance. To overcome this limitation (Hou et al., 2024; Wu et al., 2025; Zhang J. et al., 2020) performed cyclic loading-unloading tests on sandstone specimens, followed by freeze-thaw cycle experiments. They proposed a frost resistance index K, which integrates the effects of freeze-thaw cycles and initial porosity, thus allowing for a quantitative characterization of the relationship between initial porosity and sandstone’s frost resistance.
In practical engineering scenarios, rocks are frequently subjected to confining pressure. Investigators (Fu et al., 2018; Hou et al., 2025; Lu et al., 2023; Peng et al., 2025b; Zhang H. et al., 2020) conducted triaxial loading tests on rocks subjected to freeze-thaw cycles, revealing a transition from brittle to ductile behavior under influence of confining pressure. Confining pressure exhibits a strengthening effect on freeze-thawed rocks, leading to the establishment of a statistical damage constitutive equation that incorporates participation strength. Li et al. (2021); Shi et al. (2023) conducted uniaxial impact experiments on freeze-thawed granite, revealing that under similar strain rates, freeze-thaw processes reduce the impact strength of granite while increasing the complexity of its failure modes. Liu et al. (2018) established the relationship between strain rate, the number of freeze-thaw cycles, and the impact tensile strength of granite through Brazilian splitting tests. Meng et al. (2021); Meng et al. (2023) conducted impact triaxial experiments on sandstone, revealing that freeze-thawed sandstone exhibits a pronounced strain rate effect, with freeze-thaw cycles significantly enhancing the strain rate sensitivity of sandstone. Consequently, a freeze-thaw damage equation considering pore size and an impact constitutive equation accounting for confining pressure were formulated. Moreover, the dynamic strength factor (DIF) was observed to rise in conjunction with freeze-thaw cycles.
The continuous advancement of rock mechanics has enabled rock engineering design to become increasingly scientific and reasonable. Under a single impact, rock masses typically do not fail; however, instability induced by multiple impact loads remains a common phenomenon (Luo et al., 2016; Tian et al., 2024). Consequently, scholars have investigated the mechanical response of rocks under cyclic impact loading. Bing et al. (2005) performed equal-amplitude cyclic impact experiments on granite using large-scale SHPB experimental equipment. They identified the range of incident energy required for cyclic impact and discovered that the fragmentation size of rocks is inversely correlated with both impact velocity and the number of impacts. Fan et al. (2024); Wang et al. (2019); Wang et al. (2018) conducted cyclic impact experiments on high-temperature-treated granite and found that tensile failure predominates. Once the temperature surpasses 400°C, the pace of rock degradation quickens. Electron microscope scanning results revealed that increasing temperature induces a brittle-to-ductile transition in granite and the formation of transgranular cracks. The damage factor was defined based on the maximum strain and elastic modulus; however, this method fails to quantify the damage factor after the first impact. Shu et al. (2019) analyzed the failure mechanism of heat-treated sandstone under cyclic impact from an energy dissipation perspective. Consequently, Wang et al. (2018), Peng et al. (2025a) employed LS-DYNA to investigate the mechanical behavior of heat-treated marble under cyclic impact, delineating the failure process into four distinct stages. Nevertheless, finite element software cannot fully capture crack propagation processes. Wang et al. (2019) investigated the crack propagation behavior of rocks under cyclic impact using particle flow software. The results revealed that during the cyclic impact, the number of cracks in the sample progressively increased, resulting in a gradual degradation of the rock’s mechanical properties. Furthermore, crack initiation and propagation predominantly occurred from the ends toward the center of the sample. In comparison with single-impact scenarios, the complexity of crack networks was found to be lower under cyclic impact conditions, which aligns well with findings from laboratory experiments (Cao et al., 2023; Dai et al., 2022; Luo et al., 2024; Tian et al., 2025).
To summarize, currently, the majority of experimental studies on the mechanical response of rocks under cyclic impact focus on heat-treated rocks, while there is a scarcity of laboratory experimental investigations into freeze-thaw sandstone. Hence, in this study, freeze-thaw sandstone is chosen as the research subject to examine its mechanical response, macroscopic and microscopic failure modes, and damage evolution laws under cyclic impact loading.
2 Sample preparation and test scheme
2.1 Preparation of freeze-thaw sandstone
The basic parameters are presented in Table 1. In accordance with the testing specifications, the specimens were dried at a temperature of 105°C until their mass stabilized. Following cooling, the specimens were vacuum-saturated with water until their mass remained constant. To prevent water loss, the specimens were wrapped in cling film and subsequently placed in the freeze-thaw chamber, as illustrated in Figure 1. The number of freeze-thaw cycles, represented by N, was established at 0, 10, 20, and 30 which meets the requirements (Mao et al., 2025).

Table 1. Sandstone’s basic parameters.
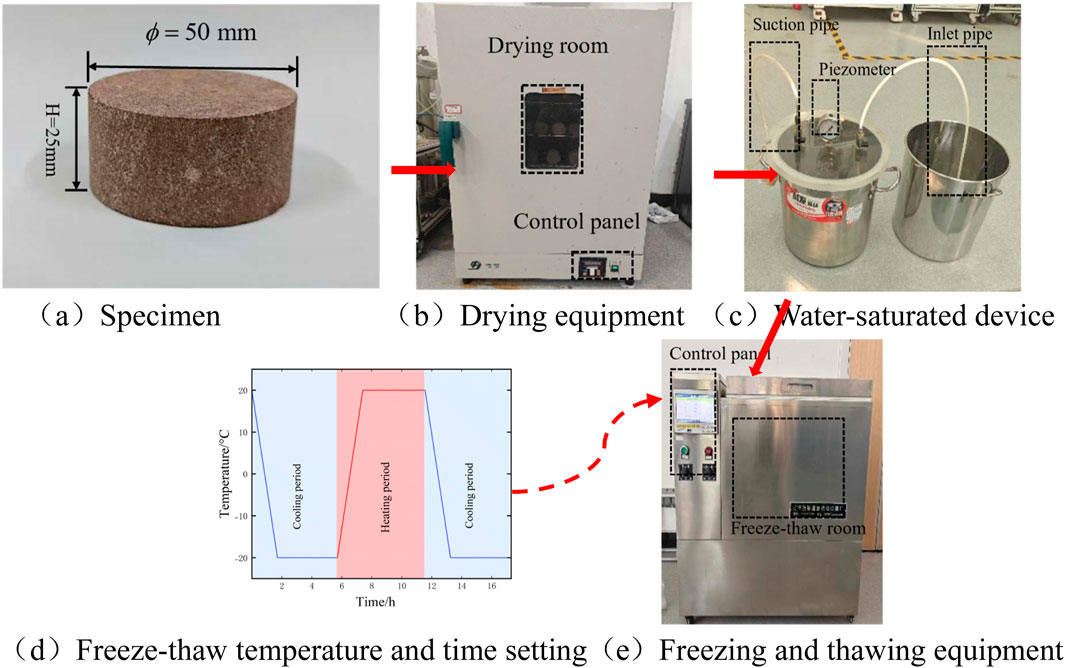
Figure 1. (a) Specimen (b) Drying equipment (c) Water-saturated device (d) Freeze-thaw temperature and time setting (Li et al., 2025) (e) Freezing and thawing equipment. The preparation process of freeze-thaw sandstone.
2.2 Acquisition of cyclic impact test data
2.2.1 Test equipment
As illustrated in Figure 2, SHPB experimental system primarily comprises the loading system, impact bar, energy absorption system, control system, and data acquisition system. The bars are fabricated from 40Cr steel, a material selected for its ability to prevent yielding during testing. The high-speed camera system, which is critical for data capture, consists of a high-speed camera and two LED light sources. The camera operates at a sampling frequency of 105 fps, ensuring sufficient resolution to meet the experimental requirements.
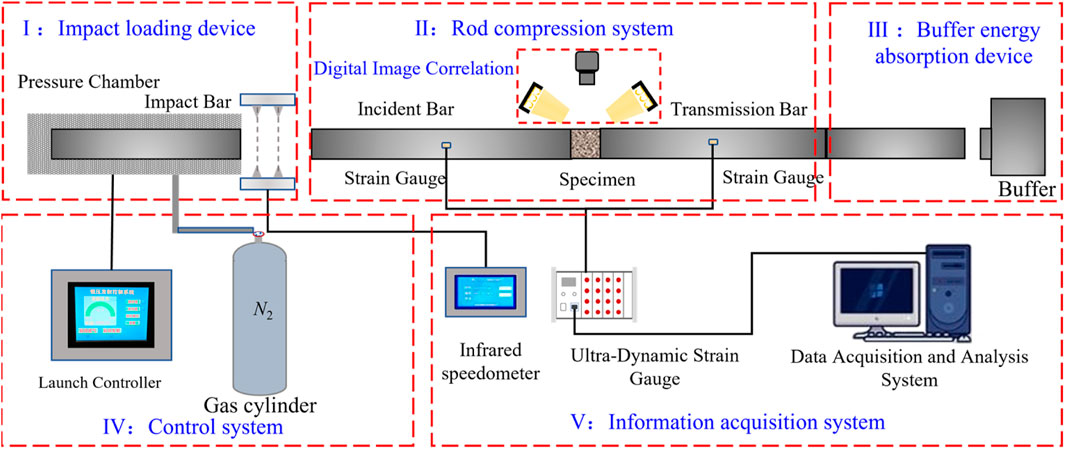
Figure 2. SHPB and high-speed camera system.
2.2.2 Principles and configurations of the SHPB test
As depicted in Figure 3, when the impact bar strikes the incident bar, an incident waveis generated. This stress wave is then reflected at the contact interface (AA) between the incident bar and the specimen, giving rise to a reflected wave. The stress wave then propagates into the specimen, subjecting the rock specimen to impact loading, followed by the generation of a transmitted wave in the transmission bar.
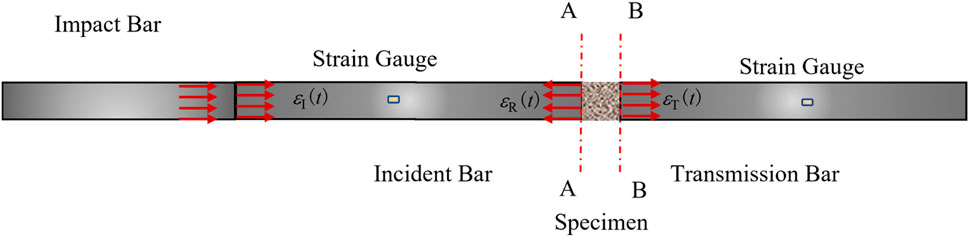
Figure 3. Stress wave propagation in the Hopkinson pressure bar.
The SHPB experimental system, devoid of servo-control, captures stress waves through strain gauges affixed to the incident and transmission bars. The experimental data are then derived in conjunction with two fundamental assumptions: (1) Stress uniformity assumption: During the propagation of stress wave, the stress is presumed to be uniformly distributed throughout the rock sample; (2) One-dimensional stress wave propagation assumption: By neglecting dispersion effects, the stress wave propagates exclusively along the axial direction of the bars. The average strain of the rock sample is calculated by Equations 1–3 (Chen et al., 2018):
Where
The strain rate
The yield strength of the impact rod is significantly higher than that of the rock sample (Meng and Li, 2003). Consequently, during the experiment, the rod remains in the elastic stage, and the assumption of one-dimensional stress wave propagation is applicable, and the stress magnitude of the sample can be calculated by Equations 5–7:
Where
Based on the assumption of uniform stress distribution, the strain and stress of the incident rod is equal to those of the transmitted rod, as shown in Equation 8:
By combining Equations 1, 4, 5, 8, the average stress
Due to the influence of factors such as friction between the bars in the SHPB experimental system and the cavity wall and guide wheels, the isobaric cyclic impact pressure cannot be set too low. Additionally, excessively high pressure can cause sandstone specimens to fail under a single impact. After conducting a series of continuous experiments, the cyclic impact pressure Pd was ultimately determined to be 0.18 MPa which is consistent with the actual engineering situation (Bing et al., 2005). The superposition of the incident and reflected stress waves closely approximates the transmitted stress wave, indicating that the stress has reached equilibrium, as depicted in Figure 4.
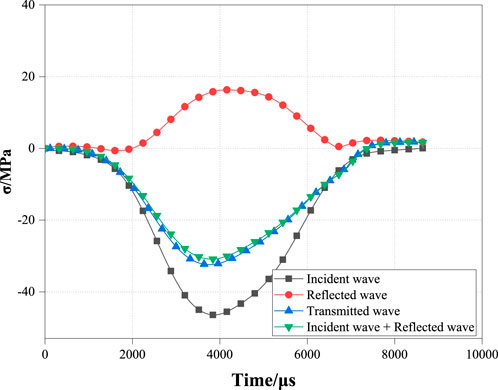
Figure 4. Stress equilibrium diagram.
3 Analysis of experimental results
3.1 Stress-strain curve
Figure 5 presents the stress-strain curve of freeze-thaw sandstone. It can be observed: (1) Except for the final loading cycle, the sandstone retains a certain degree of integrity. Consequently, undamaged freeze-thaw sandstone exhibits a distinct rebound phase following the peak stress. (2) Freeze-thaw lead to the development of internal cracks and a reduction in matrix cementation strength. As shown in Figure 4, fresh sandstone fails after the fifth impact, whereas sandstone subjected to 30 freeze-thaw cycles fails after only three impacts. This indicates that freeze-thaw significantly accelerate the deterioration of sandstone.
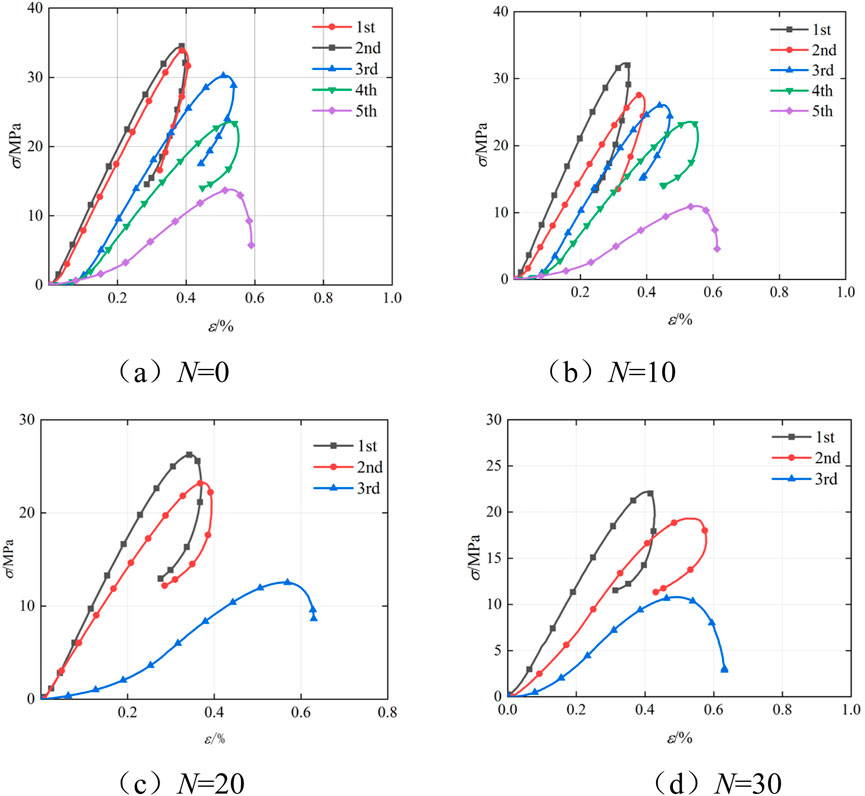
Figure 5. (a) N = 0 (b) N = 10 (c) N = 20 (d) N = 30. Stress-strain curve of freeze-thaw sandstone.
3.2 Strength and deformation characteristics of freeze-thaw sandstone
The internal crack size within the rock progressively expands with increasing freeze-thaw cycles (Liu et al., 2025). As shown in Figures 6, 7, under the same number of impact cycles, both the peak stress and elastic modulus of the sandstone decrease as the number of freeze-thaw cycles increases.

Figure 6. The curve of the peak stress σmax of freeze-thaw sandstone varying with the impact times Ti.
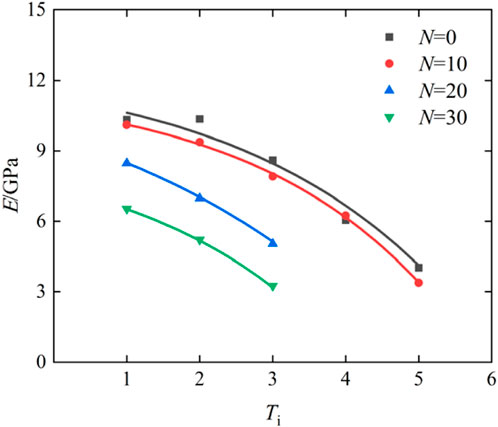
Figure 7. The curve of the elastic modulus E of freeze-thaw sandstone varying with the impact times Ti.
The stress pulse induced both the expansion and closure of internal cracks in sandstone, which collectively governed its mechanical behavior. After two impacts, the peak stress of fresh sandstone increased slightly from 34.41 MPa to 34.52 MPa. Similarly, the elastic modulus increased from 10.15 GPa to 10.32 GPa. At this stage, both crack closure and expansion jointly influenced the mechanical behavior of sandstone. As the number of impacts increased, crack size also increased, making cracks more susceptible to expansion. Therefore, during the subsequent third to fifth impacts, there was a substantial decrease in both the peak stress and elastic modulus of sandstone. Specifically, the peak stress dropped markedly from 30.26 MPa to 13.8 MPa, while the elastic modulus decreased significantly from 8.6 GPa to 4.02 GPa. At this point, the mechanical behavior of sandstone was predominantly controlled by crack expansion. Notably, this experimental phenomenon did not occur under other experimental conditions and as the number of impacts increases, the mechanical properties of sandstone deteriorate rapidly.
The strain rate serves as a critical parameter for characterizing the instantaneous deformation capability of rocks. As depicted in Figure 8, the strain rates of sandstone differ with varying numbers of freeze-thaw cycles. It is clear that the strain rates of sandstone increase with the increasing number of impacts. Furthermore, under the same number of impacts, the strain rate of sandstone rises with an increasing number of freeze-thaw cycles. For instance, during the third impact, the strain rate of fresh sandstone is 31.39 s-1, whereas those of sandstones that endure 10, 20, and 30 freeze-thaw cycles are 33.05 s-1, 43.53 s-1, and 55.58 s-1, respectively, corresponding to increases of 5.3%, 38.67%, and 77.06%.
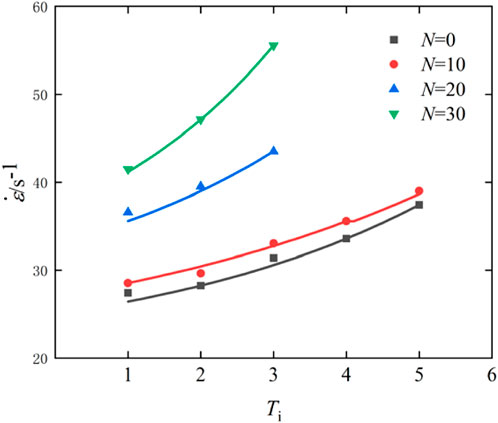
Figure 8. The curve of the strain rate
3.3 Energy dissipation of freeze-thaw sandstone
The failure of rocks is invariably associated with the input and transfer of energy, and the energy variation law provides insight into crack propagation mechanisms. In the impact experiment, energy is introduced when the bullet strikes the incident bar. A portion of the incident energy is reflected back to the incident bar, referred to as the reflected energy. Another part propagates through the sample, contributing to crack initiation, development, and closure, known as the dissipated energy, while the remaining energy is transmitted to the absorption bar, known as the transmitted energy. The various forms of energy involved in the experiment can be quantified by Formulas 10–13.
where
Figure 9 presents the energy variation curves. From these figures, the following observations can be made: (1) As impact number increases, the pore size within the sandstone gradually enlarges. The transmitted energy exhibits a gradual decrease during the initial impacts but undergoes a sharp decline in the final impacts near failure. Conversely, the reflected energy and dissipated energy display an opposite trend, increasing slowly at first and then rapidly escalating during the final impacts near failure; (2) Stress waves cannot propagate through air. Hence, when a stress wave travels to a rock pore, it undergoes reflection firstly; and then the stress wave continues to propagate forward after pore closing. Freeze-thaw cycles result in an increase in the porosity, so under the same number of impacts, dissipated energy and reflected energy is positively correlated with freeze-thaw times, and transmitted energy is negatively correlated with freeze-thaw times.
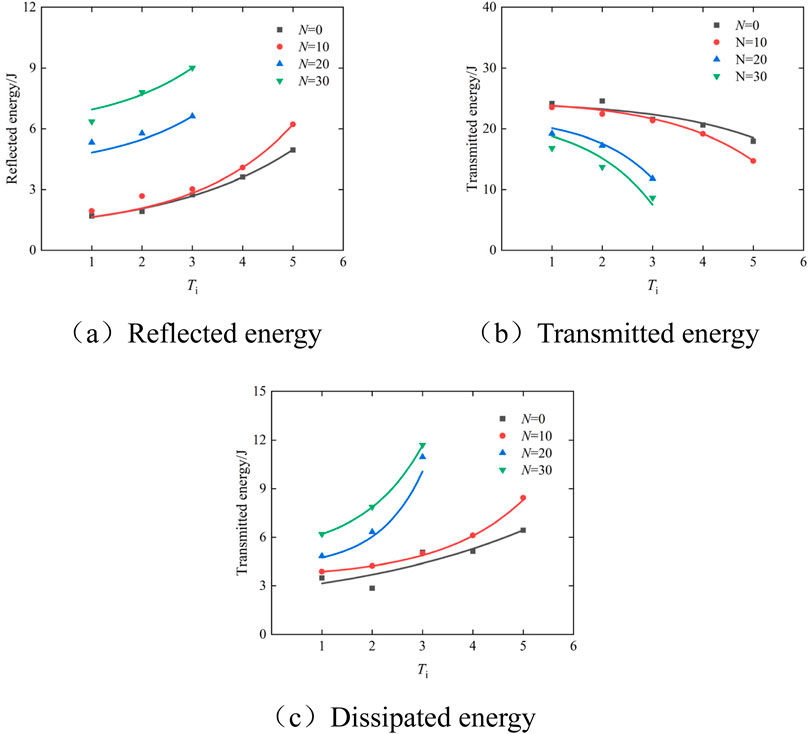
Figure 9. (a) Reflected energy (b) Transmitted energy (c) Dissipated energy. The variation curves of energy with the impact number Ti.
3.4 Failure mechanism of sandstone
3.4.1 The macroscopic failure process and failure mode
The failure process of freeze-thaw sandstone was captured using a high-speed camera. Figures 10, 11 illustrate the failure processes of fresh and 20 times freeze-thaw sandstone, respectively. Only the impact events that clearly exhibit macroscopic cracks are presented for analysis. It can be seen from them that: (1) Since there is no constraint on the lateral surface of the rock, cracks tend to initiate here first. (2) For fresh sandstone during the third impact, cracks initially nucleated at one end of the sample and progressively propagated toward the center. At this stage, the crack dimensions were small and nearly imperceptible to the naked eye, with no visible cracks on the cross-section. During the subsequent fourth impact loading, cracks continued to evolve simultaneously along both axial and radial directions, leading to an increase in crack size. However, radial penetration did not occur at this point. During the fifth impact loading, cracks further propagated radially, resulting in the formation of a single through-crack and eventual tensile failure of the sample; (3) For sandstone that endures 20 freeze-thaw cycles, during the second impact, a crack initiated at one end of the sample and progressively extended to the opposite end, forming the primary crack. At this stage, the crack had not fully penetrated radially, and the sample retained some structural integrity. During the subsequent third loading cycle, the primary crack continued to propagate, and a secondary crack of smaller size formed below it, ultimately leading to sample failure; (4) Based on Griffith’s fracture theory, cracks are more likely to initiate at larger pores. Freeze-thaw cycles enhance the uniformity of pore sizes (Jia et al., 2020). Consequently, sandstone subjected to 20 freeze-thaw cycles exhibits a higher degree of fragmentation compared to non-freeze-thaw sandstone.
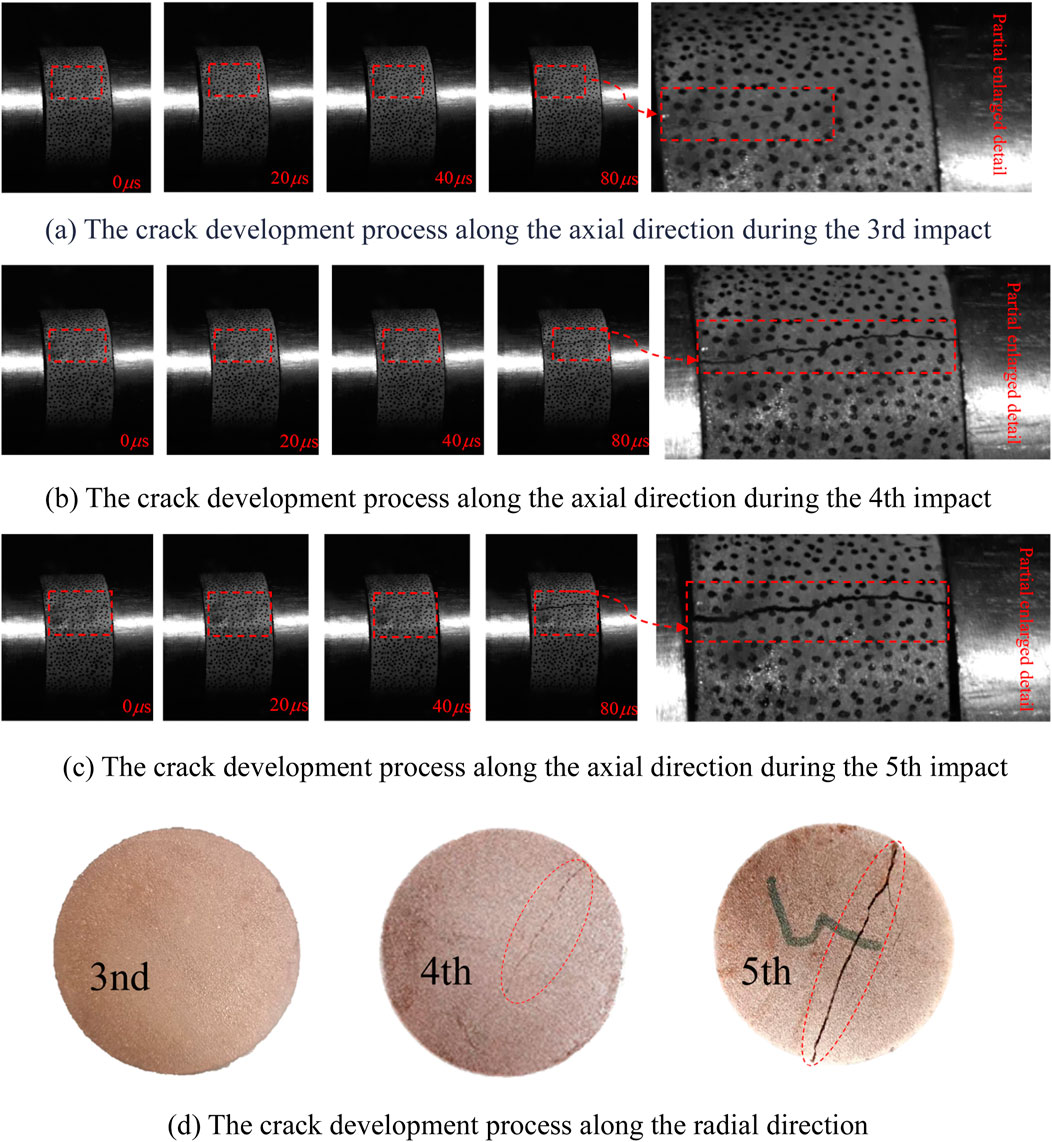
Figure 10. (a) The crack development process along the axial direction during the third impact. (b) The crack development process along the axial direction during the fourth impact. (c) The crack development process along the axial direction during the fifth impact. (d) The crack development process along the radial direction. The failure process of fresh sandstone.
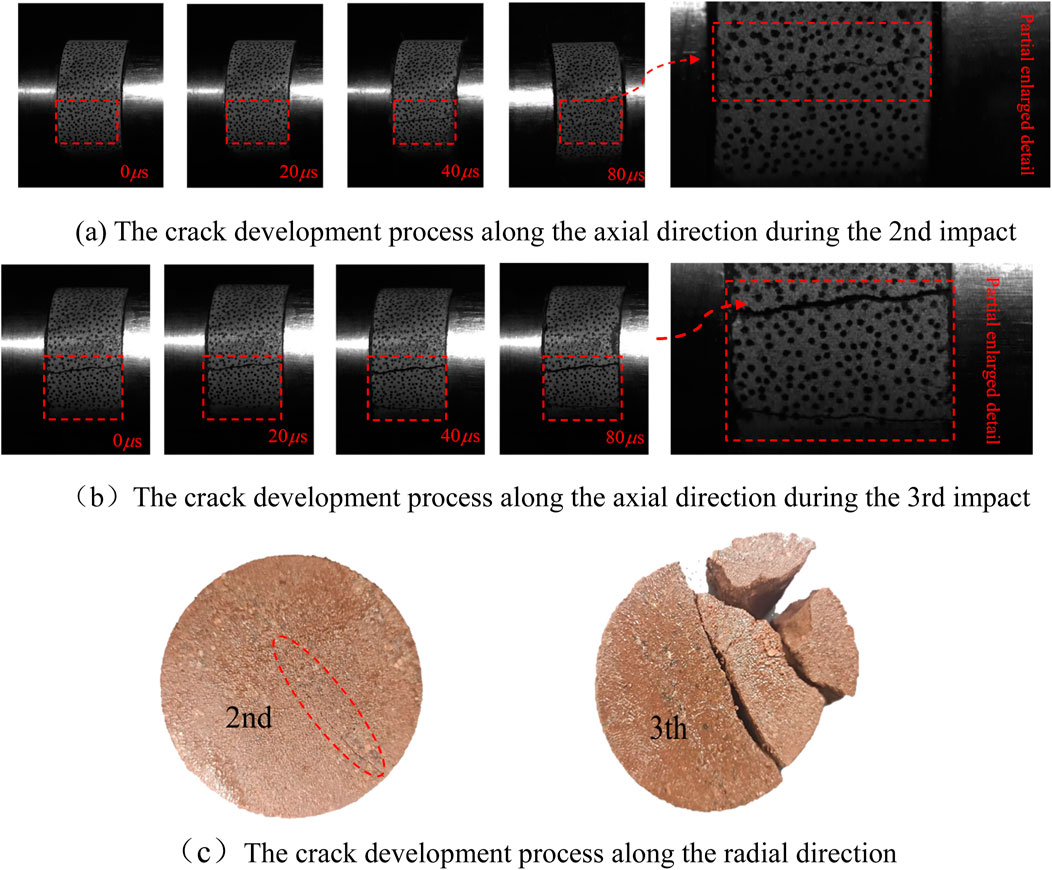
Figure 11. (a) The crack development process along the axial direction during the second impact. (b) The crack development process along the axial direction during the third impact. (c) The crack development process along the radial direction. The failure process of sandstone that endures 20 freeze-thaw.
3.4.2 The microscopic failure mode
In order to conduct a more in-depth analysis of the sandstone failure mechanism, the SEM equipment is utilized to examine the fracture surfaces of freeze-thaw sandstone after rupture, as illustrated in Figure 12. The freeze-thaw cycles lead to a reduction in the cementation force between sandstone particles and the matrix, causing the sandstone to become looser (Ma et al., 2018) and promoting crack propagation along grain boundaries. Consequently, the microscopic morphological characteristics of the sandstone failure surface exhibit transgranular failure (river pattern and step pattern) after 0 and 10 freeze-thaw cycles, whereas intergranular failure (rock candy pattern) is observed after additional freeze-thaw cycles. Simultaneously, the microscopic morphological features of the micro-failure surface in freeze-thaw sandstone (including river pattern, step pattern, and rock candy pattern) represent typical tensile failure characteristics (Chen et al., 2020), which align well with the macroscopic failure model.
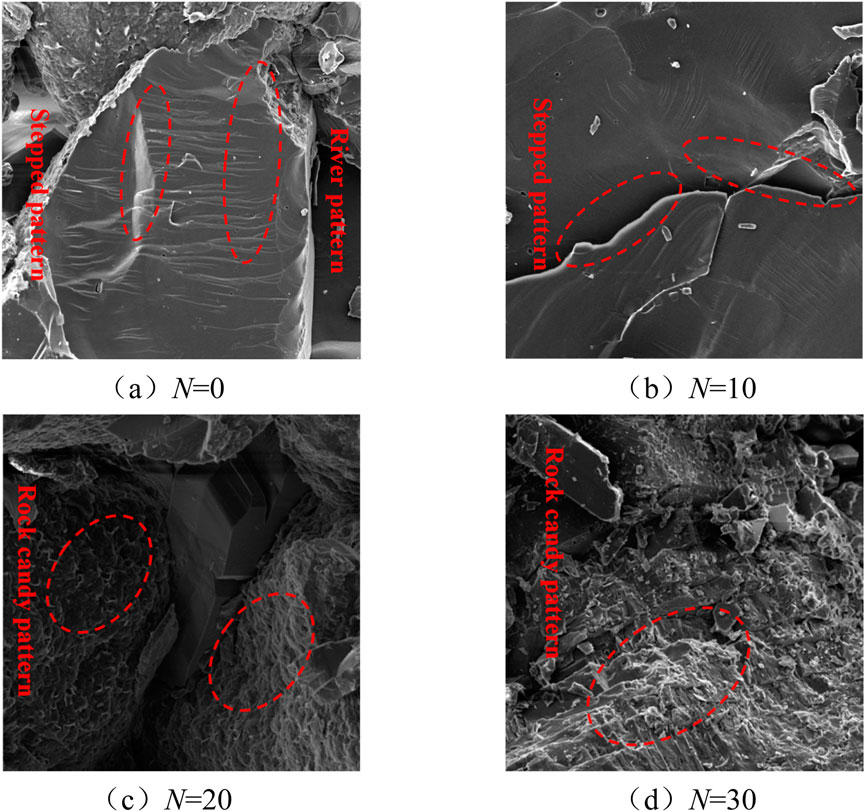
Figure 12. (a) N = 0 (b) N = 10 (c) N = 20 (d) N = 30. Microscopic characteristics of failed freeze-thaw sandstone.
4 The sandstone damage evolution
Based on the strain equivalence principle, the cumulative damage caused by cyclic impact on freeze-thaw sandstone can be quantitatively characterized by the variation in elastic modulus. The damage to sandstone occurs under the coupled effects of freeze-thaw cycles and cyclic impact loads. Consequently, the total cumulative damage can be defined by Equation 14 (Fan et al., 2024; Wang et al., 2018):
It should be noted that
Figure 13 illustrates the variation curve of the cumulative damage factor Dr for sandstone that endures different freeze-thaw cycles as a function of impact times Ti. From this figure, the following observations can be made: (1) As the number of impact times increases continuously, the cumulative damage factor of freeze-thaw sandstone exhibits an increasing trend. Specifically, the cumulative damage grows slowly in the early stages and accelerates in the later stages. (2) Freeze-thaw cycles inflict irreversible damage upon sandstone. The initial damage values of sandstones which endure 0, 10, 20, and 30 freeze-thaw cycles are 0, 0.02, 0.18, and 0.36, respectively, which corroborates Li (Li et al., 2025) indicating minimal rock damage below a critical freeze-thaw cycle threshold. Conversely, when freeze-thaw times exceeds this threshold, the damage escalates rapidly. (3) For a given impact number, the sandstone cumulative damage is positively correlated with freeze-thaw cycles.
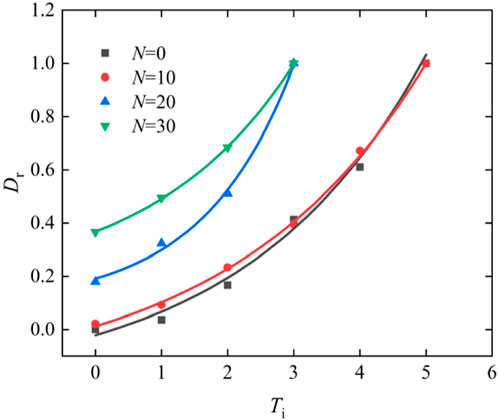
Figure 13. The curve of cumulative damage factor Drvarying with the impact times Ti.
5 Conclusion
This paper presents an experimental investigation on freeze-thaw sandstone by SHPB , high-speed camera,and SEM detection technology. The study elucidates the relationships between peak stress, elastic modulus, strain rate, energy, impact pressure, and the number of freeze-thaw cycles. The influence of freeze-thaw cycles on the failure modes and establishes the damage evolution law of sandstone is further disclosed. The primary conclusions are summarized as:
(1) During the cyclic impact process, except for the last loading cycle, freeze-thaw sandstone exhibited significant rebound behavior. The freeze-thaw cycle exerts a substantial impact on the fatigue life. Only the sandstone without freeze-thaw treatment showed a slight increase in peak stress and elastic modulus during the first two impacts and both the peak stress and elastic modulus of freeze-thaw sandstone decreased with the increase in the number of impacts under other test conditions. Under the same number of impacts, the elastic modulus and peak stress decreased with an increasing freeze-thaw cycles, while the strain rate showed an opposite trend.
(2) The variations in energies are intricately linked to the alterations in the pore structure of sandstone. Transmission energy initially decreases gradually and then drops sharply as the number of impacts increases continuously. In contrast, dissipated energy and reflected energy, which are associated with crack propagation, exhibit an opposite trend: they increase slowly at first and subsequently rise rapidly.
(3) Cracks initially form on the side of the specimen and subsequently propagate along the radial direction. Fresh xxxxxxxxxxxsandstone fractures with only one dominant crack. Conversely, after undergoing 20 freeze-thaw cycles, sandstone exhibits two through-cracks upon fracture, accompanied by a higher degree of fragmentation. Meanwhile, the microscopic morphological characteristics of the sandstone failure surface evolve from transgranular failure to intergranular failure.
(4) The cumulative damage of freeze-thaw sandstone initially increases slowly and then rapidly with the increasing impacts number, exhibiting a negative correlation with the freeze-thaw cycles.
Data availability statement
The original contributions presented in the study are included in the article/supplementary material, further inquiries can be directed to the corresponding author.
Author contributions
LT: Formal Analysis, Writing – review and editing. WP: Methodology, Writing – original draft. HS: Data curation, Visualization, Writing – review and editing. WB: Formal Analysis, Writing – review and editing. CZ: Project administration, Writing – original draft.
Funding
The author(s) declare that financial support was received for the research and/or publication of this article. This work was supported by National Natural Science Foundation of China (52304102) and Xuzhou Key Research and Development Plan (KC23314) for experimental equipment and rock samples.
Conflict of interest
The authors declare that the research was conducted in the absence of any commercial or financial relationships that could be construed as a potential conflict of interest.
Generative AI statement
The author(s) declare that no Generative AI was used in the creation of this manuscript.
Publisher’s note
All claims expressed in this article are solely those of the authors and do not necessarily represent those of their affiliated organizations, or those of the publisher, the editors and the reviewers. Any product that may be evaluated in this article, or claim that may be made by its manufacturer, is not guaranteed or endorsed by the publisher.
References
Aleksander, G. P., Yifan, T., and Fuming, Z. (2023). Predicting service life of polyethylene pipes under crack expansion using “random forest” method. Int. J. Eng. Trans. C, Aspects 36 (12), 2243–2252. doi:10.5829/ije.2023.36.12c.14
Bing, L. X., Lok, T. S., and Zhao, J. (2005). Dynamic characteristics of granite subjected to intermediate loading rate. Rock Mech. Rock Eng. 38 (1), 21–39. doi:10.1007/s00603-004-0030-7
Cao, R., Wang, H., Qiu, X., Wang, C., Lin, H., and Qiao, Q. (2023). Damage characteristics and fracture behaviour of marble after cycle impact loading. Theor. Appl. Fract. Mech., 125. doi:10.1016/j.tafmec.2023.103903
Chen, R., Yao, W., Lu, F., and Xia, K. (2018). Evaluation of the stress equilibrium condition in axially constrained triaxial SHPB tests. Exp. Mech. 58 (3), 527–531. doi:10.1007/s11340-017-0344-5
Chen, J., Zhou, H., Zeng, Z., and Lu, J. (2020). Macro- and microstructural characteristics of the tension–shear and compression–shear fracture of granite. Rock Mech. Rock Eng. 53 (1), 201–209. doi:10.1007/s00603-019-01896-4
Dai, B., Shan, Q., Chen, Y., and Luo, X. (2022). Mechanical and energy dissipation characteristics of granite under cyclic impact loading. J. Central South Univ. 29 (1), 116–128. doi:10.1007/s11771-022-4897-9
Fan, L. F., Li, H., Xi, Y., and Wang, M. (2024). Effect of cyclic impact on the dynamic behavior of thermally shocked granite. Rock Mech. Rock Eng. 57 (7), 4473–4491. doi:10.1007/s00603-024-03819-4
Fu, H., Zhang, J., Huang, Z., Shi, Y., and Chen, W. (2018). A statistical model for predicting the triaxial compressive strength of transversely isotropic rocks subjected to freeze-thaw cycling. Cold Regions Sci. Technol. 145, 237–248. doi:10.1016/j.coldregions.2017.11.003
Hongbo, G., Weiguo, L., Suguo, X., Chuanda, Z., and Xiaoqin, Y. (2011). Study of mechanical behavior response of salt rock under cyclic loading. Chin. J. Rock Mech. Eng. (Z1).
Hou, R., Cui, Q., Guo, Y., Shi, Y., and Fu, J. (2024). A new elasto-visco-plastic damage model and numerical simulation method used for time-dependent behavior prediction of deep tunnel. Comput. Geotechnics 168 (1), 106129. doi:10.1016/j.compgeo.2024.106129
Hou, R., Cui, Q., Liu, H., Shi, Y., and Chang, Y. (2025). A nonlinear visco-elasto-plastic creep model for sandstone considering creep initiation conditions and experimental verification. Mech. Time-Dependent Mater. 29 (1), 6. doi:10.1007/s11043-024-09753-w
Huang, S., He, Y., Yu, S., and Cai, C. (2022). Experimental investigation and prediction model for UCS loss of unsaturated sandstones under freeze-thaw action. Int. J. Min. Sci. Technol. 32 (1), 41–49. doi:10.1016/j.ijmst.2021.10.012
Jia, H., Ding, S., Zi, F., Dong, Y., and Shen, Y. (2020). Evolution in sandstone pore structures with freeze-thaw cycling and interpretation of damage mechanisms in saturated porous rocks. Catena 195, 104915. doi:10.1016/j.catena.2020.104915
Khanlari, G., and Abdilor, Y. (2015). Influence of wet-dry, freeze-thaw, and heat-cool cycles on the physical and mechanical properties of Upper Red Sandstones in central Iran. Bull. Eng. Geol. Environ. 74 (4), 1287–1300. doi:10.1007/s10064-014-0691-8
Li, Y., Zhai, Y., Meng, F., and Zhang, Y. (2021). Study on the influence of freeze–thaw weathering on the mechanical properties of huashan granite strength. Rock Mech. Rock Eng. 54 (9), 4741–4753. doi:10.1007/s00603-021-02497-w
Li, T., Wu, P., Hu, S., Wu, B., and Chen, Z. (2025). Numerical simulation research on the micro failure mechanism of sandstone under freeze-thaw cycles. Front. Earth Sci. 13, 1548089. doi:10.3389/feart.2025.1548089
Liu, C., Deng, H., Zhao, H., and Zhang, J. (2018). Effects of freeze-thaw treatment on the dynamic tensile strength of granite using the Brazilian test. Cold Regions Sci. Technol. 155, 327–332. doi:10.1016/j.coldregions.2018.08.022
Liu, M., Ding, Y., Liu, Y., Zhang, Y., and Cheng, Y. (2025). Macro-mesoscopic correlation investigation on damage evolution of sandstone subjected to freeze–thaw cycles. Rock Mech. Rock Eng. 58 (1), 887–903. doi:10.1007/s00603-024-04201-0
Lu, H., Bao, W., Yin, Y., Sun, X., Li, H., Pan, Z., et al. (2023). Experimental study on multi-scale damage and deterioration mechanism of carbonaceous slate under freeze-thaw cycles. Bull. Eng. Geol. Environ. 82 (12), 458. doi:10.1007/s10064-023-03493-w
Luo, X., Jiang, N., Wang, M., and Xu, Y. (2016). Response of leptynite subjected to repeated impact loading. Rock Mech. Rock Eng. 49 (10), 4137–4141. doi:10.1007/s00603-015-0896-6
Luo, H., Gong, H., Luo, Y., Xia, D., Zhang, X., and Li, X. (2024). The macroscopic and microscopic fatigue failure mechanisms of high-temperature thermally-damaged granite under cyclic impact loading. Geothermics 121, 103047. doi:10.1016/j.geothermics.2024.103047
Ma, Q., Ma, D., and Yao, Z. (2018). Influence of freeze-thaw cycles on dynamic compressive strength and energy distribution of soft rock specimen. Cold Regions Sci. Technol. 153, 10–17. doi:10.1016/j.coldregions.2018.04.014
Mao, Y., Li, M., Wu, P., Guo, S., and Zhu, F. (2025). Research on damage and degradation of coal-bearing sandstone under freeze-thaw cycles. Front. Earth Sci. 12, 1522502. doi:10.3389/feart.2024.1522502
Meng, F., Zhai, Y., Li, Y., Zhao, R., Li, Y., and Gao, H. (2021). Research on the effect of pore characteristics on the compressive properties of sandstone after freezing and thawing. Eng. Geol., 286.
Meng, F., Zhai, Y., Li, Y., Xie, Q., Gao, Q., and Li, Y. (2023). Research on deterioration mechanism and dynamic triaxial compression characteristics of freeze–thaw sandston. Rock Mech. Rock Eng. 56 (3), 2333–2355. doi:10.1007/s00603-022-03172-4
Meng, H., and Li, Q. M. (2003). Correlation between the accuracy of a SHPB test and the stress uniformity based on numerical experiments. Int. J. Impact Eng. 28 (5), 537–555. doi:10.1016/s0734-743x(02)00073-8
Mutluturk, M., Altindag, R., and Turk, G. (2004). A decay function model for the integrity loss of rock when subjected to recurrent cycles of freezing-thawing and heating-cooling. Int. J. Rock Mech. Min. Sci. 41 (2), 237–244. doi:10.1016/s1365-1609(03)00095-9
Peng, K., Liu, X., Huang, W., Haoyu, H., Ji, R., and Luo, S. (2025a). The role of minimum principal stress in tunnel strainburst considering spatial structure effect. Theor. Appl. Fract. Mech. 139 (26), 105085. doi:10.1016/j.tafmec.2025.105085
Peng, K., Liu, X., Jing, M., Wu, T., Luo, K., and Luo, S. (2025b). Impact-water interaction effects on mechanical and energy characteristics of granite during uniaxial compression. Geoenergy Sci. Eng. 254, 214033. doi:10.1016/j.geoen.2025.214033
Shi, H., Wenlong, C., Zhang, H., Lei, S., Ming, L., Miaojing, W., et al. (2023). Dynamic strength characteristics of fractured rock mass. Eng. Fract. Mech., 292. doi:10.1016/j.engfracmech.2023.109678
Shi, H., Zhang, H., Chen, W., Song, L., and Li, M. (2024). Pull-out debonding characteristics of rockbolt with prefabricated cracks in rock: a numerical study based on particle flow code. Comput. Part. Mech. 11 (1), 29–53. doi:10.1007/s40571-023-00607-9
Shu, R., Yin, T., Li, X., Yin, Z., and Tang, L. (2019). Effect of thermal treatment on energy dissipation of granite under cyclic impact loading. Trans. Nonferrous Metals Soc. China 29 (2), 385–396. doi:10.1016/s1003-6326(19)64948-4
Tian, Y., Palaev, A. G., Shammazov, I. A., and Ren, Y. (2024). Non-destructive testing technology for corrosion wall thickness reduction defects in pipelines based on electromagnetic ultrasound. Front. Earth Sci. 12, 1432043. doi:10.3389/feart.2024.1432043
Tian, Y., Palaev, A., Goluntsov, A., Liu, Z., Shao, M., and Wang, B. (2025). Early assessment method for damage to polyethylene pipes based on linear directional waves. Mech. Adv. Mater. Struct., 1–21. doi:10.1080/15376494.2025.2456102
Wang, Z., Tian, N., Wang, J., Liu, J., and Hong, L. (2018). Experimental study on damage mechanical characteristics of heat-treated granite under repeated impact. J. Mater. Civ. Eng. 30 (11), 04018274. doi:10.1061/(asce)mt.1943-5533.0002465
Wang, P., Yin, T., Li, X., Zhang, S., and Bai, L. (2019). Dynamic properties of thermally treated granite subjected to cyclic impact loading. Rock Mech. Rock Eng. 52 (4), 991–1010. doi:10.1007/s00603-018-1606-y
Wu, J., Wong, H. S., Zhang, H., Yin, Q., Jing, H., and Ma, D. (2024). Improvement of cemented rockfill by premixing low-alkalinity activator and fly ash for recycling gangue and partially replacing cement. Cem. and Concr. Compos., 145. doi:10.1016/j.cemconcomp.2023.105345
Wu, J., Yang, S., Williamson, M., Wong, H. S., Bhudia, T., Pu, H., et al. (2025). Microscopic mechanism of cellulose nanofibers modified cemented gangue backfill materials. Adv. Compos. Hybrid Mater. 8 (2), 177. doi:10.1007/s42114-025-01270-9
Zhang, T., and Yang, Y. (2024). Slake durability and mineralogical characteristic of carbonaceous rocks. Bull. Eng. Geol. Environ. 83 (10), 421. doi:10.1007/s10064-024-03921-5
Zhang, H., Meng, X., and Yang, G. (2020a). A study on mechanical properties and damage model of rock subjected to freeze-thaw cycles and confining pressure. Cold Regions Sci. Technol., 174. doi:10.1016/j.coldregions.2020.103056
Zhang, J., Deng, H., Deng, J., and Guo, H. (2020b). Influence of freeze-thaw cycles on the degradation of sandstone after loading and unloading. Bull. Eng. Geol. Environ. 79 (4), 1967–1977. doi:10.1007/s10064-019-01634-8
Zhang, Q., Liu, Y., Dai, F., and Jiang, R. (2022). Experimental assessment on the fatigue mechanical properties and fracturing mechanism of sandstone exposed to freeze-thaw treatment and cyclic uniaxial compression. Eng. Geol., 306. doi:10.1016/j.enggeo.2022.106724
Zhang, K., Lu, H., Zhu, R., Weng, L., Zhou, X., Kong, X., et al. (2024a). Study on pore structure evolution and water damage of asphalt mixture under cyclic loading. Constr. Build. Mater. 440, 137461. doi:10.1016/j.conbuildmat.2024.137461
Keywords: freeze-thaw cycles, cyclic impact, failure mode, damage evolution
Citation: Tao L, Peng W, Shanchao H, boyuan W and Zhanqing C (2025) Cyclic impact experimental study on the mechanical behavior of sandstone subjected to freeze-thaw cycles. Front. Earth Sci. 13:1661900. doi: 10.3389/feart.2025.1661900
Received: 08 July 2025; Accepted: 31 July 2025;
Published: 03 September 2025.
Edited by:
Hao Shi, Anhui University of Science and Technology, ChinaReviewed by:
Rongbin Hou, North China University of Water Resources and Electric Power, ChinaYan Zhang, Anhui University of Science and Technology Affiliated Fengxian Hospital, China
Copyright © 2025 Tao, Peng, Shanchao, boyuan and Zhanqing. This is an open-access article distributed under the terms of the Creative Commons Attribution License (CC BY). The use, distribution or reproduction in other forums is permitted, provided the original author(s) and the copyright owner(s) are credited and that the original publication in this journal is cited, in accordance with accepted academic practice. No use, distribution or reproduction is permitted which does not comply with these terms.
*Correspondence: Wu Peng, cGVuZ3dAeHppdC5lZHUuY24=