 Daniya Shoganbekova1,2
 Asset Urazaliyev1*
 Walyeldeen Godah3
 Serik Nurakynov1
 Nailya Zhaksygul1,2
 Magzhan Kozhakhmetov1
- 1Laboratory of Satellite and Geodynamic Research, Institute of Ionosphere, Almaty, Kazakhstan
- 2International Education Corporation, Almaty, Kazakhstan
- 3Office of the Surveyor General, Divisional Support Branch, Regional Operations Division, Ministry of Natural Resources, Peterborough, ON, Canada
Introduction: We quantify temporal variations of geoid heights (ΔN) across Kazakhstan during 2019–2024 using satellite gravimetry, and relate these changes to recent extreme hydrological and seismic events.
Methods: Monthly ΔN fields were derived from GRACE-FO–based global geopotential models. We applied seasonal-trend decomposition to isolate seasonal and long-term components, mapped linear trends, and assessed 2024 mass-change anomalies. Consistency checks included correlations with Caspian Sea water-level records and a preliminary comparison between ΔN and ellipsoidal height changes from five continuous GPS stations within the study area.
Results: ΔN exhibits a clear seasonal cycle with amplitudes up to ∼3.5 mm. A persistent decline in geoid heights during 2019–2022 is observed along the Caspian Sea coast, reaching rates of up to −1.57 mm yr−1. In 2024, mass anomalies associated with seismic and hydrological events interrupted this decline. ΔN correlates strongly with Caspian Sea level variations (r = 0.91). GPS–GRACE-FO comparisons show an inverse seasonal pattern, consistent with mass-loading effects.
Discussion/conclusions: GRACE-FO robustly captures regional, mass-related geoid variability over Kazakhstan. The results support applications in geodetic infrastructure maintenance, hazard assessment and early warning, and climate-impact analysis. They also provide inputs relevant to the realization of the International Height Reference Frame by accounting for time-variable gravity in Central Asia.
1 Introduction
The high–precision geoid model represents an equipotential surface of Earth’s gravitational field and is crucial in various scientific and engineering disciplines. In geodesy, it serves as a reference surface for measuring the orthometric height. This model is essential for converting the ellipsoidal height obtained from Global Navigation Satellite Systems (GNSS) observations into gravity–dependent height, particularly the orthometric height. Additionally, an accurate and high–resolution geoid model significantly contributes to several Earth science fields, such as geophysics and geodynamics. It helps examine the Earth’s internal mass distribution and assists oceanography by facilitating the study of ocean surface topography, dynamics, and circulation patterns that influence global climate (Torge et al., 2023). The accuracy of geoid models depends on multiple factors, including the quality and distribution of gravity data, the reliability of topographic and bathymetric models, the precision of global gravity field models, computational methods, and consistency across geodetic reference frames. Advances in scientific knowledge, technological innovations, and improved computational algorithms have greatly enhanced the precision of the static geoid models (Sansò and Sideris, 2013). However, due to the dynamic nature of Earth—influenced by geodynamic activities such as tectonic movements, hydrological variations like changes in total water storage, glacier melting, sea–level fluctuations, atmospheric dynamics including air–mass circulation and ocean currents, and tidal effects—regular updates that account for spatiotemporal variations of geoid height are becoming increasingly necessary (Godah et al., 2017a).
According to Godah et al. (2017a), variations in mass distribution, whether beneath or above the geoid surface, lead to changes in the Earth’s gravitational potential, which in turn affect the geoid height, as illustrated in Figure 1. For example, when there are redistributions of subsurface mass, an increase of such mass raises the gravitational potential and results in an uplift of the geoid surface. Conversely, a decrease in mass reduces the gravitational potential and leads to subsidence of the geoid surface. Similarly, variations in surface mass, often caused by hydrological processes such as water accumulation or depletion, follow a comparable pattern: an increase in surface mass elevates both the gravitational potential and the geoid surface, while a decrease in surface mass lowers the geoid surface (Godah et al., 2018a; Godah et al., 2020; Szelachowska, et al., 2022).
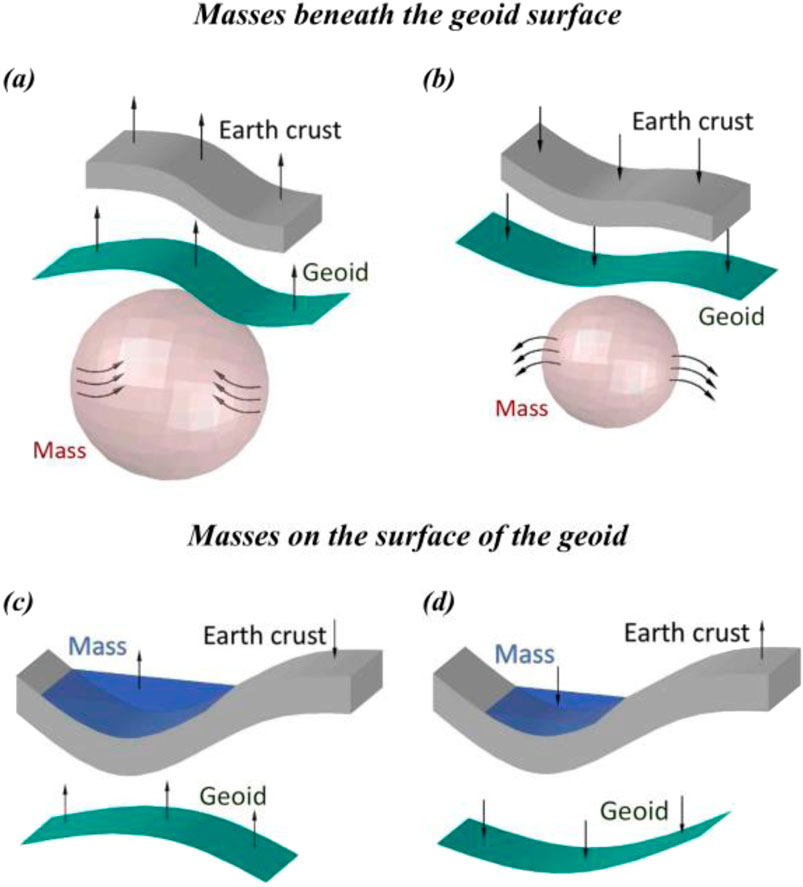
Figure 1. Relationship between mass transports within the Earth’s system and temporal variations of geoid heights. (a) Increase in mass below the geoid surface, (b) decrease in mass below the geoid surface, (c) increase in mass at the Earth’s surface, (d) decrease in mass at the Earth’s surface (after Godah et al., 2018a; Godah et al., 2020; Szelachowska et al., 2022).
Over the past two decades, satellite gravimetry has boosted our ability to monitor temporal variations of the Earth’s gravity field, primarily through the dedicated gravity satellite missions, i.e., CHAMP (Challenging Mini–satellite Payload; Reigber et al., 2003), GRACE (Gravity Recovery and Climate Experiment; Tapley et al., 2004), GOCE (Gravity field and steady-state Ocean Circulation Explorer; Drinkwater et al., 2003) and GRACE–FO (GRACE Follow–On; Landerer et al., 2020). In particular, GRACE and its successor GRACE–FO have enabled the derivation of highly accurate time-variable gravity field solutions, providing monthly datasets with unprecedented temporal and spatial resolution (Tapley et al., 2019; Landerer et al., 2020). The datasets from those dedicated gravity satellite missions have catalyzed significant advancements in global and regional geoid modeling and its temporal variations. They allow achieving accuracies on the order of 1 cm for static geoid (e.g., Bako et al., 2024). In the early years of the GRACE satellite mission (i.e., around 2003), monthly variations of geoid height were determined with an accuracy of 2–3 mm (Tapley et al., 2004). Since then, this accuracy has improved thanks to efforts such as the reprocessing of GRACE data—from Release 4 to Release 6 solutions—and the implementation of new technologies, including the Laser Ranging Interferometer (LRI) used in the GRACE–FO mission (Landerer et al., 2020).
The ability of GRACE/GRACE–FO satellite missions to detect the mass transport within the Earth’s system, i.e., hydrosphere, cryosphere, and solid Earth, has been widely demonstrated. Numerous previous studies have employed these datasets to quantify the dynamics of terrestrial water storage, glacial mass balance, and crustal deformation (e.g., Chen et al., 2022). Concerning the use of GRACE data for the determination of temporal variations of geoid heights, Rangelova et al. (2010) implemented a dynamic geoid in Canada as a vertical reference surface, developed by combining GRACE and terrestrial gravity data. Jacob et al. (2012) estimated that geoid heights in North America could vary by approximately 10 mm per decade in response to glacier retreat and groundwater extraction. Krynski et al. (2014) and Godah et al. (2017b) revealed that seasonal variations of geoid height can reach 15 mm over Central Europe. For the area of Poland, these seasonal variations can reach the level of 12 mm (Godah et al., 2017a; Godah et al., 2017b; Godah, 2019; Szelachowska et al., 2022). Godah et al. (2020) investigated temporal variations of geoid/quasigeoid heights for twenty-four large river basins and indicated that the dispersions (Max-Min) of temporal variations of geoid/quasigeoid heights range from 30 mm in the Amazon River basin that dominated by strong water mass variations signal to a couple of millimeters in the Orange River basin where the hydrological change signal is weak. Seasonal variations of geoid heights at the proposed International Height Reference Frame (IHRF) sites can reach approximately 40 mm (e.g., at the IHRF site ‘MABA’ in Brazil; Yadeta et al., 2024; Godah et al., 2025). Zhang et al. (2024) indicated that the amplitude of temporal variations of geoid heights are approximately 2 mm in the Mississippi River basin, respectively. Temporal variations of geoid heights obtained from GRACE data were sufficiently modeled using spectral analysis (e.g., Fourier analysis), seasonal decomposition and Principal Component Analysis (e.g., Rangelova et al., 2010; Krynski et al., 2014; Godah et al., 2017a; Godah et al., 2018b). Xu et al. (2025) proposed a method for dynamically updating regional height reference frames by accounting for temporal geoid variations, using GRACE/GRACE–FO data over Beijing and Shandong, China. They applied Independent Component Analysis and wavelet analysis to investigate temporal changes in geoid height. Their findings show that these variations can reach magnitudes of up to ±6 mm in Beijing and Shandong. Those recent efforts on the determination of temporal variations of geoid heights allowed the estimation of the time-varying orthometric heights that would be required for the modernization of vertical datums (e.g., Godah et al., 2017b; Godah et al., 2020; Szelachowska et al., 2022; Guo et al., 2024; Zhang et al., 2024; Yadeta et al., 2024; Godah et al., 2025). Computationally discretized frameworks, such as dynamic lattice or element-based models, share certain methodological similarities with time-stepped spectral analyses used in gravity-field monitoring (Rizvi et al., 2020). However, Central Asia, and Kazakhstan in particular, remains underrepresented in such analyses despite its significant geodynamic and hydrological variability.
The main aim of this study is to quantify the temporal variations in geoid heights over the territory of Kazakhstan during the period 2019–2024. Kazakhstan represents a geodynamically active region characterized by complex geophysical conditions resulting from its diverse topography, ongoing tectonic deformation, and pronounced variability in surface and subsurface water resources. These factors make the region suitable for studying temporal variations in the Earth’s gravity field. The novelty of this study lies in being the first systematic assessment of temporal variations in geoid height over Kazakhstan using GRACE/GRACE–FO data.
This investigation is particularly significant in the context of a national geodetic initiative aimed at developing a high–resolution geoid model for the Republic of Kazakhstan to support the establishment of a unified national coordinate and height reference system. To date, this study constitutes the first systematic assessment of both seasonal and secular geoid height variations across Kazakhstan based on satellite gravimetric observations from the GRACE and GRACE–FO missions.
Beyond national relevance, such scientific research—the relation between temporal variations from GRACE/GRACE–FO satellite gravimetry data with seismic activity and climatic insights—can be carried out in other regions globally, especially those in tectonically active or extreme hydrologically dynamic environments. Recent studies have shown that data-driven predictive frameworks are effective in extracting dominant features and long-term trends from environmental time-series data, supporting similar decomposition and pattern-recognition strategies as applied in the present work (Ahmad et al., 2025). The results reveal coherent spatiotemporal patterns of mass redistribution attributable to climatic and tectonic drivers and enable the refinement of regional gravity field parameters. These insights are essential for the realization of a precise and geodynamically stable vertical datum that would offer important contributions to international geodetic efforts such as the realization of the International Height Reference Frame (IHRF). Furthermore, the outcomes of this study offer substantial methodological value, laying the groundwork for future research on the enhancement of geoid modeling strategies, integration of satellite and terrestrial geodetic data, and the development of applied frameworks for climate impact analysis, hydrological monitoring, and seismic risk assessment in Central Asia.
2 Study area and data used
2.1 Study area
The area of Kazakhstan (40° ≤ latitudes ≤ 56° and 46° ≤ longitudes ≤ 88°) is located in the core of Eurasia with a territorial area of 2.72 km2 × 106 km2 (Figure 2). This region consists mainly of plains, lowlands, and hills, with fewer mountains, rivers, and lakes. The plains are mostly located in the west, north, and southwest, while the central area is dominated by the Kazakh Hills. To the east and southeast lie the Altai and Tianshan Mountains. Between the Caspian Sea and the Tianshan Mountains, farmland, grasslands, and deserts extend from north to south. Farmlands are concentrated in the northern plains, eastern areas, and eastern foothills, while grasslands are found primarily in the central, northeastern, and northwestern plains. Deserts are mainly located in the central and southern regions. Forests are relatively scarce, mainly situated in the Altai Mountains in the east, the Tianshan Mountains in the south, and the hilly and mountainous areas in the north (Kraemer et al., 2015; Urazaliyev et al., 2024). The spatiotemporal variations in the gravitational field within this area can result primarily from the dynamic redistribution of mass within the Earth’s system. Key contributors to these mass redistribution include declining Caspian Sea levels, ongoing degradation of the Aral Sea, accelerated melting of glaciers in the Tien Shan mountains, and persistent tectonic activity. Nonetheless, spatiotemporal variations of geoid heights in this area remain uninvestigated. In 2024, Kazakhstan experienced extreme hydrological events, such as large-scale flooding, anomalously high precipitation levels, and heightened tectonic activity in adjacent regions (e.g., Van Dijk et al., 2025). Such extreme events can induce significant temporal variations of the Earth’s gravitational field and geoid heights within the area of Kazakhstan.
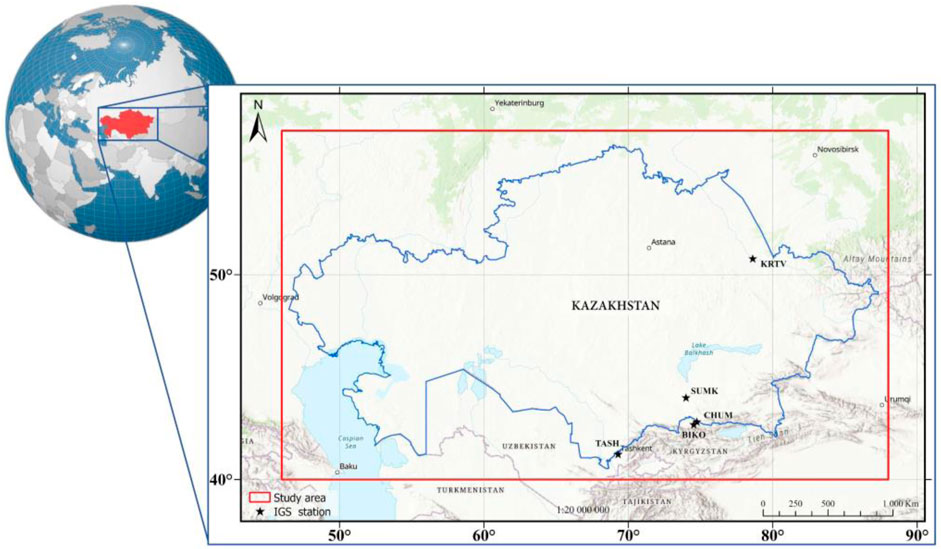
Figure 2. Study area.
2.2 Data used
Within the course of this study, spatiotemporal variations of geoid heights across Kazakhstan for the period 2019–2024 were investigated using GRACE–FO satellite mission data, accessed via the International Centre for Global Earth Models (ICGEM; Ince, 2019). Specifically, Release–06.3 (RL06.3) GRACE–FO based monthly Global Geopotential Models (GGMs), provided by the Helmholtz Centre for Geosciences (GFZ; Dahle et al., 2019), were utilized. The first–degree (degree −1) and the second–degree (degree −2) spherical harmonic coefficients of these GGMs were replaced by their corresponding ones obtained by the solution presented in (Sun et al., 2016) and satellite laser ranging (SLR) data (Loomis et al., 2019), respectively. To reduce the noise included in those GGMs, the decorrelation filter DDK3 was applied (Kusche et al., 2009). This filter provides a balance between noise reduction and preservation of the signal (Godah et al., 2017a). In addition, these GGMs were truncated at degree and order (d/o) 60 (approx. 330 km) which corresponds to the spatial resolution of the DDK3 filter. It is important to note that while the DDK3 filter significantly reduces noise in GRACE–FO–based GGMs, signal leakage or attenuation from nearby areas—particularly those with strong local gradients, such as mountainous regions and coastlines—could impact the determination of gravity functionals from GRACE–FO–based GGMs. In this study, these signal leakage or attenuation were assumed insignificant and would not alter the conclusions of this research. However, we suggest that future research should focus on studying these leakage effects on obtaining gravity functionals (e.g., temporal variations of geoid height) more rigorously over the area of Kazakhstan using GRACE–FO–based GGMs.
In addition to GRACE–FO data, monthly Caspian Sea level records for the period 2019–2024 obtained from the National Hydrometeorological Service of the Republic of Kazakhstan (Kazhydromet; https://www.kazhydromet.kz/) were used to evaluate the hydrological contributions to temporal variations of geoid heights, especially in western Kazakhstan. These records could be beneficial for quantifying the impact of large–scale surface water mass fluctuations on regional gravitational field dynamics. Furthermore, climatic information was also used to assess the impact of precipitation variability and its influence on regional hydrology and thereby temporal variations of geoid heights in Kazakhstan. In particular, data on the dynamics of precipitation in the western area of Kazakhstan, Kostanay, and Kyzylorda regions were obtained from the Famine Early Warning Systems Network (FEWS NET; https://earlywarning.usgs.gov/fews/), operated by the United States Geological Survey (USGS). The precipitation trends in these regions were utilized to support the interpretation of mass redistribution signals detected by GRACE/GRACE-FO, particularly within areas prone to drought or seasonal water stress.
Furthermore, earthquake statistics from the USGS Earthquake Catalog (https://earthquake.usgs.gov/) for the area of Kazakhstan were analyzed for the 2019–2024 period. Information on the timing, magnitude, and depth of seismic events in Kazakhstan and surrounding regions were used to investigate potential relations between abrupt geoid anomalies and tectonic activity. The inclusion of seismic data will help to identify geophysically active zones and improve the interpretation of short-term fluctuations in the residual component of the geoid height time series.
Moreover, within the course of this study, time series of vertical ellipsoidal height in a daily interval from five continuously operating GPS (Global Positioning System) reference stations (CORS)—KRTV, TASK, SUMK, CHUM, and BIKO (see Figure 2)—were utilized. These time series were obtained from the Nevada Geodetic Laboratory (NGL; https://geodesy.unr.edu/NGLStationPages/gpsnetmap/GPSNetMap.html; Blewitt et al., 2018). The NGL processes three-dimensional daily position estimates in a consistent global terrestrial reference frame, such as IGS20 (International GNSS Service reference frame 2020). Data processing is carried out by the NGL using the GipsyX software developed by the Jet Propulsion Laboratory (JPL), incorporating precise satellite orbit and clock products, tropospheric delay modeling, corrections for ocean and solid Earth tides, antenna phase center calibrations, and other GNSS processing standards (cf. https://geodesy.unr.edu/gps/ngl.acn.IGS20.txt).
3 Methods
Temporal variations of geoid heights (ΔN) were determined using the IGiK–TVGMF software (Instytut Geodezji i Kartografii–Temporal Variations of Gravity/Mass Functionals; Godah, 2019). This software is developed in the MATLAB environment and includes three graphical user interfaces: TVGMF–Computation, TVGMF–Analysis (PCA/EOF) and TVGMF–Analysis (SA). TVGMF–Computation allows the computation of thirteen TVGMF functionals based on monthly release 5 GRACE-based Global Geopotential Models (GGMs), while the TVGMF–Analysis (PCA/EOF) and TVGMF–Analysis (SA) graphical user interfaces are designed for analyzing and modeling TVGMF using principal component analysis (PCA) and seasonal adjustment (SA), also known as seasonal decomposition (SD), methods, respectively. Within the course of this study, the IGiK–TVGMF software has been modified to handle GRACE–FO–based GGMs. The ΔN are computed according to Equation 1:
where φ, λ are the spherical geocentric coordinates of the computation point, R is the reference radius, GM is the product of Newton’s gravitational constant G and the Earth’s mass M, r is the geocentric radius of the computation point, Plm are the fully normalized Legendre polynomials of degree l and order m, γ is the normal gravity at the computation point on the physical surface of the Earth, ΔClm and ΔSlm represent residuals between fully normalized spherical harmonics coefficients (SHC) from GRACE–FO–based GGMs and a specified average of SHCs, and lmax is the applied maximum degree.
To identify the long–term (trend) and seasonal fluctuations in ΔN, the SD method was utilized. The analysis is based on an additive time series model, in which the overall ΔN(t) signal is represented as a sum of several components shown in Equation 2:
where t denotes time expressed in months, T(t) is a trend (long-term) component reflecting gradual changes associated with tectonic processes and long-term changes in water mass changes, S(t) is a seasonal component that characterizes recurring fluctuations associated with hydrological cycles (for example, seasonal changes in water levels and glacier melting), and ε(t) is the anomalous (unmodeled) component, which includes short-term and unpredictable variations such as earthquakes, extreme floods and other natural disasters.
4 Results and discussions
Temporal variations of geoid heights (ΔN) over Kazakhstan estimated for the period between 01/2019 and 12/2024 using GRACE–FO data specified in Section 2, are given in Section 4.1. Section 4.2 provides the analysis and modelling of these ΔN. Section 4.3 is dedicated to the analysis of ΔN and their relation with hydrological changes and recent seismic activities over Kazakhstan in 2024. To evident ΔN in Kazakhstan, Section 4.4 presents a preliminary comparison between vertical displacement from GPS data as independent data, and ΔN.
4.1 Temporal variations of geoid heights
Maps of ΔN for January 2019–December 2024 over Kazakhstan are shown in Figure 3. It should be mentioned that these ΔN were determined using the average SHCs for the first year of this investigation (i.e., year 2019). The time series of the mean values of ΔN over the whole area of Kazakhstan is illustrated in Figure 4.
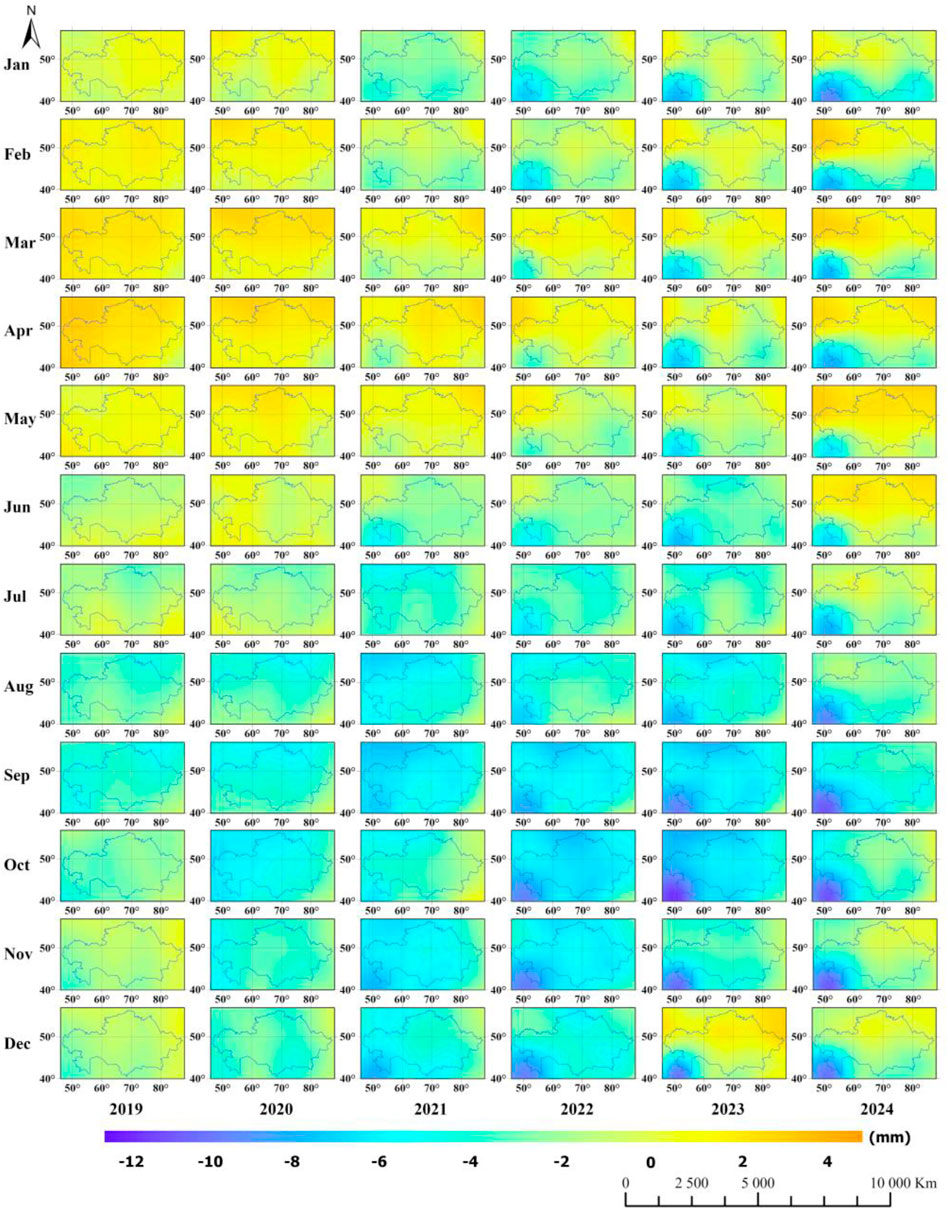
Figure 3. Maps of temporal variations of geoid heights (ΔN) for the period January 2019 to December 2024 over the territory of Kazakhstan.
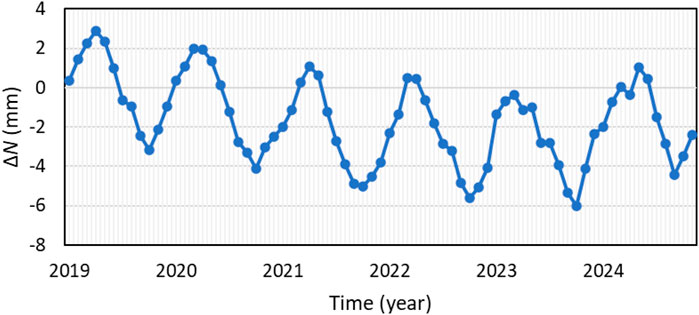
Figure 4. Time series of mean temporal variations of geoid heights (ΔN) over the whole territory of Kazakhstan from January 2019 to December 2024.
The results presented in Figures 3, 4 reveal a distinct pattern of seasonal variation of geoid heights, with the highest values observed at the beginning of spring–due to the accumulation hydrological mass, and the lowest at the end of summer caused by terrestrial water mass loss through evaporation. The results illustrated in Figure 3 demonstrate that ΔN can be seen not only across different epochs but also vary among different subareas of Kazakhstan during the same period. These findings indicate that the differences in ΔN from one epoch to another (e.g., April 2019 and October 2023) within the same subarea can reach up to 18 mm, and there may be a difference of approx. 10 mm between two distinct subareas at the same time (e.g., December 2023). Figure 3 also indicates differences in the amplitudes of ΔN over Kazakhstan within the years investigated. This can be ascribed to inconsistent changes in hydrological and climatic conditions, including extreme weather events, within those years. Furthermore, Figure 4 reveals a general downward trend in the geoid height until 2022, indicating long-term changes in mass distribution in the region. However, since 2023, the trend has shown signs of stabilization, which may indicate a slowdown in mass loss processes over Kazakhstan.
4.2 Analysis and modelling of temporal variations of geoid heights
Figure 5 shows seasonal variations of geoid heights over Kazakhstan for the period 2019–2024, based on data from the GRACE–FO data. The average of these seasonal variations is illustrated in Figure 6. Figures 5, 6 reveal that the amplitude of ΔN over Kazakhstan over the period investigated is approximately 3.5 mm. It confirms the results provided in Figures 3, 4 as the maximum values of ΔN are recorded in the spring (March–May), and the minimum ones in the fall (September–November), which reflects the influence of seasonal processes associated with the redistribution of hydrological mass in the region. The estimated ΔN amplitude in Kazakhstan is consistent with values reported over the Ob River basin, which encompasses parts of Kazakhstan (Godah et al., 2020). It also falls within the range of ΔN amplitudes observed in different regions around the world. For instance, Godah et al. (2017b) reported ΔN dispersions (maximum–minimum) ranging from 4 mm to 9.6 mm across Central Europe. On a broader scale, Godah et al. (2020) showed that dispersion of ΔN can vary significantly among major river basins, with extremes such as 30 mm over the Amazon River basin in South America and 7 mm over the Orange River basin in South Africa. In contrast, Zhang et al. (2024) estimated an annual ΔN amplitude of 1.9 ± 0.02 mm over the Mississippi River basin in North America. Figure 5 shows the average seasonal variations of the geoid in Kazakhstan for the period from 2019 to 2024. It illustrated that in fall, geoid heights are decreasing in the northern and central regions, which is associated with the accumulation of snow cover and soil freezing. At the same time, geoid heights over the Caspian Sea remain relatively stable. The most significant change occurs in spring–geoid heights rise in the areas of large rivers (Irtysh, Syr Darya, Ural) due to frequent floods caused by melting snow and glaciers in the Altai and Tien Shan mountains. This leads to an increase in the hydrological mass and a redistribution of the load on the lithosphere. In summer, the geoid height stabilizes. In the southern regions, a slight decrease is observed, associated with a decrease in river runoff and evaporation. At the same time, the level of the Caspian Sea also decreases, which is reflected in negative changes in the geoid height. In autumn, the geoid height begins to gradually decrease, caused by the reduction of water reserves in rivers and underground waters. During this period, precipitation partially compensates for the losses.
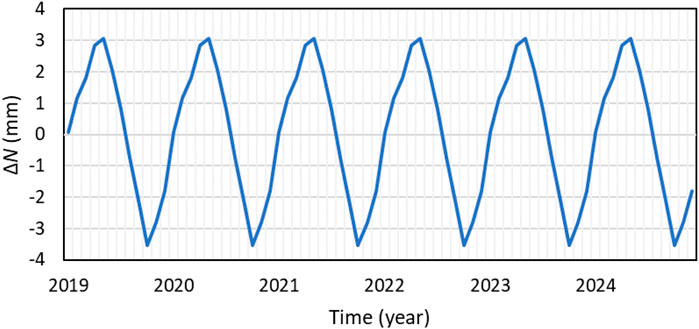
Figure 5. Seasonal component of temporal variations of geoid heights (ΔN) in Kazakhstan from 2019 to 2024.
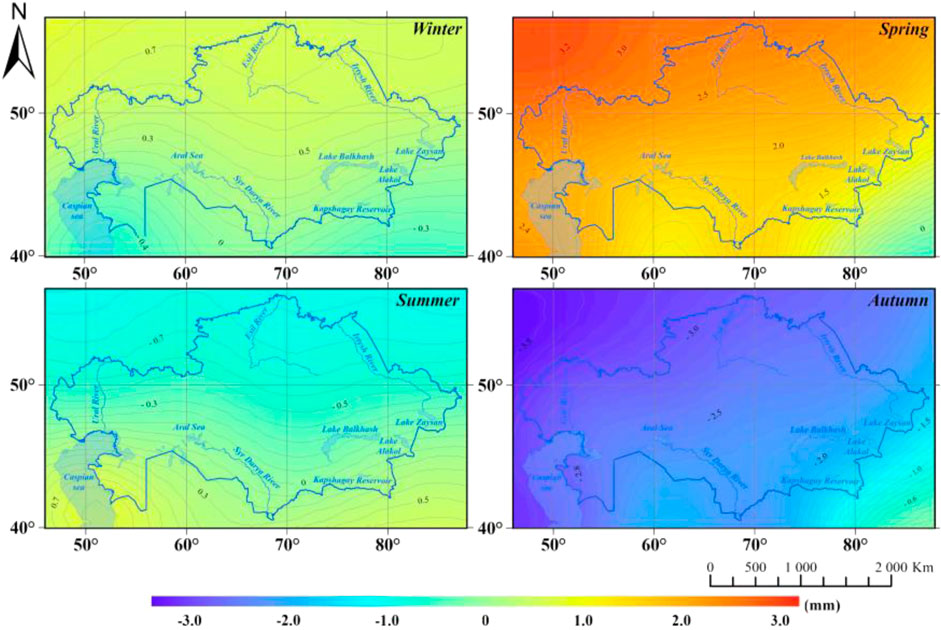
Figure 6. Average seasonal variations of geoid heights for Kazakhstan from 01/2019 to 12/2024.
Figure 7 shows long-term (trend) variations of geoid heights over Kazakhstan for the period from 2019 to 2024. It indicates a continuous decrease in geoid heights over the whole area of Kazakhstan from the winter of 2020 to the winter of 2023. From the winter of 2023, long-term (trend) variations of geoid heights over Kazakhstan are negligible (i.e., approx. Zero per year). It also demonstrates that long-term (trend) variations of geoid heights over Kazakhstan are dependent on the region. The maximum decrease in geoid heights during this period is observed in the Caspian Sea region, where the change was −7.83 mm over 5 years (approx. −1.57 mm yr−1). In the southeastern regions, including Almaty and Tien Shan, the geoid decrease was 3 mm over 5 years (approx. −0.6 mm yr−1). In the central regions of Kazakhstan, the change is less pronounced as it is about −1.5 mm over 5 years (approx. −0.3 mm yr−1), while in the northern regions, the changes are minimal approximately–0.5 mm over 5 years (approx. −0.1 mm yr−1). Overall, those long–term (trend) variations can be observed in the western part of Kazakhstan, which is associated with changes in the water level of the Caspian Sea that related to the redistribution of water mass and isostatic processes in the lithosphere (Rakhimbayeva et al., 2023; Drygval et al., 2024; Kholoptsev and Naurozbayeva, 2024).
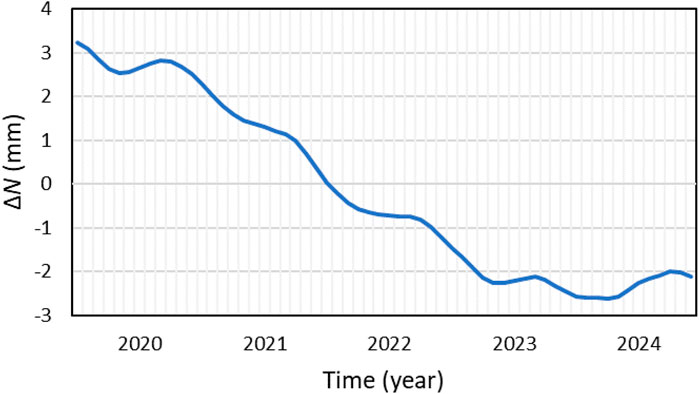
Figure 7. Long-term (trend) variation of the geoid heights from 2019 to 2024.
Figure 8 shows the relation between the change in the water level of the Caspian Sea according to Kazhydromet data and ΔN in the northern and middle areas of the Caspian Sea. It indicates that the Pearson correlation coefficient between ΔN and the changes in the water level is 0.91. To ensure the statistical robustness of this relationship, this correlation was computed from deseasonalized monthly time series covering 2019–2024, thereby minimizing the influence of annual periodic components. Cross-correlation analysis revealed that the strongest correlation occurs with a lag of 1.5-month, indicating that the geoid variations slightly lag behind the sea-level changes, likely due to the delayed lithospheric response to water mass redistribution. A simple linear regression model between ΔN and the Caspian Sea level change yielded a slope coefficient of a = 4.8 × 10⁻³ mm yr−1, R-squared = 0.83, and p-value < 0.01, confirming a significant and physically consistent dependence.
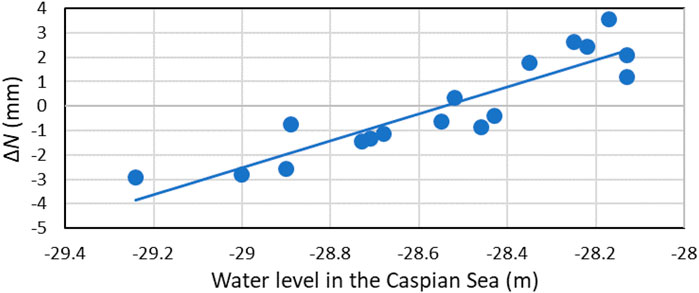
Figure 8. The relation between the change of the water level in the Caspian Sea and temporal variations of geoid heights (ΔN).
The water level in the Caspian Sea dropped by 1.2 m between 2019 and 2024, accompanied by a decrease in the geoid to 5.9 mm in coastal regions. The main mechanisms of this relation include several factors. First, a decrease in the mass of water because of evaporation or reductions in Volga, Ural and Kura rivers flow reduces the total volume of water mass, which weakens the local gravitational field (Völgyesi and Tóth, 2005; Safarov et al., 2024). Second, a decrease in the water load on the lithosphere causes an isostatic reaction - the crust begins to slowly rise, which also affects the geoid surface (Hofstetter and Lister, 1989). Third, opening coastal areas are subject to erosion and changes in groundwater, as well as new sedimentation, which changes the distribution of mass and additionally affects the gravitational parameters (Kooi and Groen, 2003). Climate models predict further reductions of Sea level due to increased evaporation and reduced river inflow, which may strengthen the negative trend of geoid heights (Koriche et al., 2021). These changes require constant monitoring, as they affect the geodynamics of the region, the ecosystem, infrastructure, and water resources (Putans et al., 2022).
In general, ΔN in southeastern Kazakhstan, reaching approximately −0.6 mm yr−1, are caused by combined effects of tectonic, glaciodynamic, and isostatic processes in the Tien Shan as this region is a subject to horizontal compression caused by the extrusion of stable blocks (Burchfiel et al., 1999), which leads to the activation of tectonic movements. Continental collision in the Cenozoic caused the rise of the Tien Shan and the corresponding subsidence of adjacent basins, forming the modern morphostructural configuration (Pan et al., 2019). The results obtained Pan et al. (2019) revealed that GPS (Global Positioning System) and GRACE data allow the separation of contributions from glacier melting and tectonic processes to vertical crustal movements in the Tianshan region. According to their results analysis, the average vertical velocity from GPS observations is 0.72 ± 0.12 mm yr−1. The elastic deformation caused by variations in the mass of surface fluids is estimated at 0.39 mm yr−1, while the contribution from local glacier melting does not exceed 0.19 mm yr−1. The authors concluded that the present-day uplift of the Tianshan (approx. 0.33 mm yr−1) is primarily associated with crustal shortening and thickening due to horizontal compression. Due to climate warming in recent decades, there has been a reduction in Tien Shan glaciers, reaching 8.5% since the 1970s (e.g., Brun et al., 2017). Deglaciation leads to crustal unloading and its compensatory uplift, partially leveling the tectonic signal. The elastic response of the crust to the loss of glacial mass affects the gravitational field and, accordingly, causes changes in geoid heights.
Overall, the results presented in Figures 3, 8 are consistent with the information in Figure 1. An increase in geophysical mass signals—such as those masses induced from hydrology or seismic activity—leads to an increase in gravitational potential, resulting in a rise in geoid height, and vice versa.
4.3 Temporal variations of geoid heights over Kazakhstan for 2024
In 2024, significant ΔN that exceeds the average seasonal and long-term trend of ΔN over Kazakhstan were determined (Figures 3, 4). These changes can be associated with a number of natural processes, including increased seismic activity, extreme floods, and changes in the water level of the Caspian Sea. Data from the GRACE–FO satellite mission allows for estimating significant mass redistribution caused by such natural phenomena that may impact the gravitational field in Kazakhstan. In Sections 4.3.1, 4.3.2, the relationship between ΔN and (1) floods and (2) tectonic activity, are respectively addressed.
4.3.1 Relationship between temporal variations of geoid heights and floods
According to the USGS FEWS NET (cf. https://earlywarning.usgs.gov/fews/), the amount of precipitation in Western and northern Kazakhstan at the end of 2023 was higher than in previous years, as well as compared to the average long-term norm of precipitation over Kazakhstan for the period 2000–2018, as shown in Figure 9.
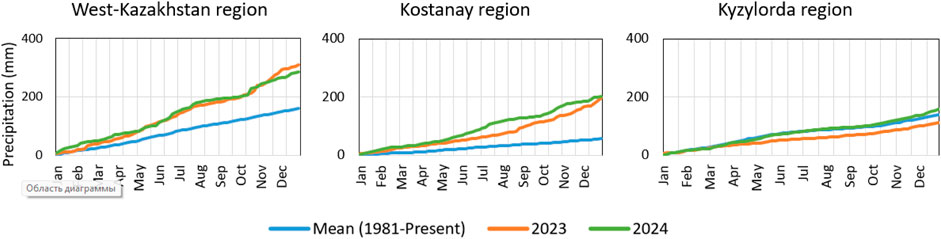
Figure 9. Dynamics of precipitation inWest Kazakhstan as well as in Kostanay and Kyzylorda regions of Kazakhstan.
The analysis of precipitation for the years 2023–2024 in the West Kazakhstan, Kostanay, and Kyzylorda regions, as shown in Figure 9, indicates a notable increase compared to the long-term average. By the end of 2023, precipitation in the Western region of Kazakhstan reached approximately 300 mm, which is about 250 mm above the average level. In the Kostanay region, precipitation is expected to be around 200 mm by the end of the year, significantly higher than the average of approximately 130 mm.
Figure 10 shows ΔN in December 2023 and 2024. It indicates an increase in geoid heights in the western region (West Kazakhstan) of up to 1.70 mm and in the northern regions (Akmola, Kostanay, and North Kazakhstan) of up to 1.35 mm. This can be ascribed to an abnormal accumulation of snow mass. Such changes can be associated with increased seasonal sedimentation, which resulted in a significant rise in the water mass changes. These changes had a direct impact on the hydrological regime in 2024, becoming one of the primary causes of spring floods. The rapid melting of snow cover in these areas caused a significant increase in surface runoff, leading to rising river levels and flooding in low-lying areas.
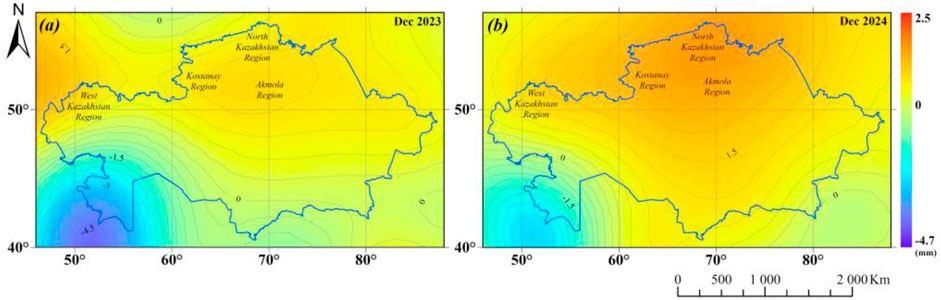
Figure 10. Maps of geoid height over Kazakhstan: (a) December 2023; (b) December 2024.
A significant increase in water level was noted in the Yesil, Buktyrma, Ural, and Kara Ertis rivers between late March and early April 2024, as illustrated in Figure 11. The highest readings were recorded at hydrological monitoring stations on different dates: on the Yesil River, the water level exceeded the critical mark by 392 cm on April 17; on the Buktyrma River, it exceeded the mark by 57 cm on May 2; on the Ural River, by 163 cm on May 22; and on the Kara Ertis River, by 40 cm on May 26 (see the Kazhydromet daily hydrological Bulletin on the rivers; https://www.kazhydromet.kz/). Large values of geoid heights, recorded as early as December 2023, were important indicators of the accumulation of significant masses of snow and harbingers of the spring flood. By December 2024, geoid height anomalies reached 2.47 mm, exceeding the December 2023 levels, indicating an intensifying snow accumulation process and a possible recurrence of spring floods.
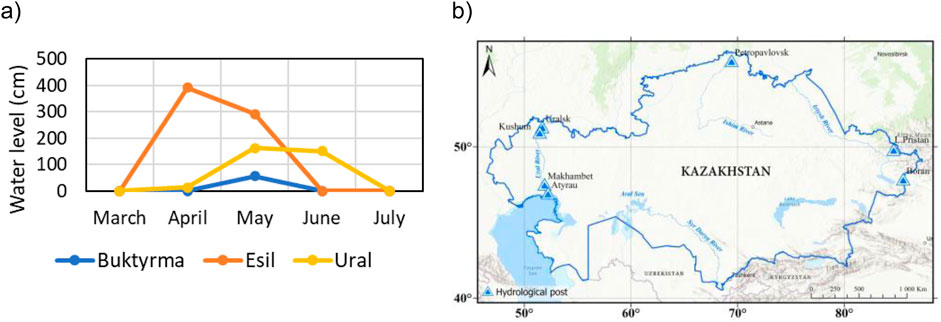
Figure 11. (a) A record of exceeding the critical mark of the water level at the hydrographic posts of the rivers Yesil, Ural, Irtysh, and (b) the location of hydrographic posts.
4.3.2 Relationship between temporal variations of geoid heights and tectonic events
One of the most significant factors influencing the geoid dynamics in 2024, particularly in the southern and southeastern regions of Kazakhstan, could be a rapid increase in seismic activity. According to the USGS Earthquake Catalog (https://earthquake.usgs.gov/), the number of earthquakes with a magnitude greater than 4.5 within a radius of 300 km from the borders of Kazakhstan in 2024 increased fivefold compared to previous years, which emphasizes the scale of the ongoing tectonic processes, as shown in Figure 12.
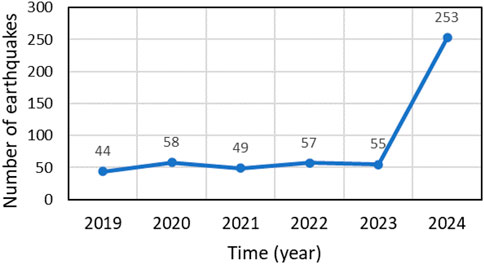
Figure 12. Number of earthquakes with a magnitude greater than 4.5 points within a radius of 300 km from the borders of Kazakhstan.
Figure 13 shows maps of anomalous variations of geoid heights and the density of epicenters of earthquakes with a magnitude greater than 4.5 for the period from January to March 2024. A detailed analysis of these data allows us to identify the following key patterns.
1. In the southeastern part of Kazakhstan, on the border with Kyrgyzstan and China, from January to March 2024, a stable area of negative geoid heights is observed, reaching values of up to −2.6 mm near the epicenters of earthquakes with a magnitude of more than 5. This phenomenon indicates a significant loss or redistribution of mass in this region, which may be associated with both intense tectonic processes and changes in the hydrological regime; and
2. At the same time, a high density of earthquake epicenters is recorded in the specified region. The maximum concentration of seismic events with a magnitude of more than 4.5 coincides with the zone of lower values of geoid heights, which confirms a direct relationship between tectonic activity and changes in the gravitational field.
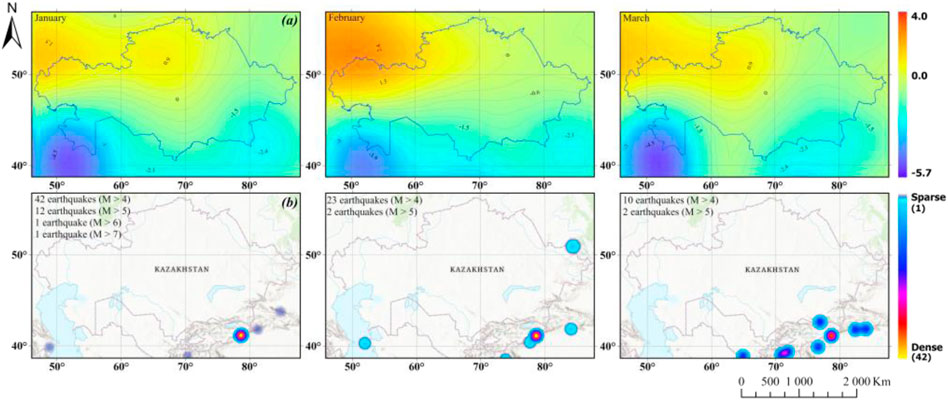
Figure 13. (a) Maps of temporal variations of geoid heights from January to March 2024 and (b) the density of earthquake epicenters with a magnitude greater than 4.5.
Changes in the gravitational potential field can be caused by mass redistribution induced by earthquakes that are associated with the movement of tectonic plates, faults, and deformations of the Earth’s crust. These processes lead to mass redistribution in the Earth’s interior, which in turn causes local changes in the gravitational field and, as a result, geoid heights. After strong earthquakes, changes in the gravitational field can be observed, for example, due to the uplift or subsidence of areas of the Earth’s surface, displacement of rocks or changes in the density of material in the upper layers of the lithosphere. This statement is correct from the point of view of modern geophysics. Thus, seismic activity from January to March 2024 not only led to a local lowering of the geoid, but also had a significant impact on geodynamic processes in the region.
However, the possibility of reverse causality should not be ruled out. For example, gravitational anomalies caused by the movement of mantle plumes or changes in the load on the lithosphere (e.g., due to melting glaciers or large floods) can create additional stresses in the Earth’s crust. These stresses can trigger earthquakes, especially in regions with already high tectonic activity. That is, changes in the gravitational field cause earthquakes - this is a less obvious but possible scenario that requires taking into account long-term processes such as mantle movement, changes in the load on the lithosphere, or gravitational instability.
These data highlight the importance of further monitoring of temporal and spatial variations of the geoid in Kazakhstan and seismic activity, which is particularly relevant for predicting potential risks and understanding long-term changes in the region’s geodynamics.
4.4 Preliminary comparison between vertical displacement from GPS data and ΔN
A preliminary comparison was conducted between vertical ellipsoidal height changes (Δh) derived from GPS data and ΔN obtained from GRACE-FO-based GGMs. Time series of daily Δh from five GPS CORS—KRTV, TASK, SUMK, CHUM, and BIKO—located within or near the study area (see Figure 2) were analyzed. Corresponding time series of monthly ΔN at the locations of these stations were also examined. To explore the temporal patterns in both Δh and ΔN associated with mass transport processes within the Earth’s system, sinusoidal functions were fitted to each time series. Figure 14 presents these Δh and ΔN time series along with their respective sinusoidal fits.
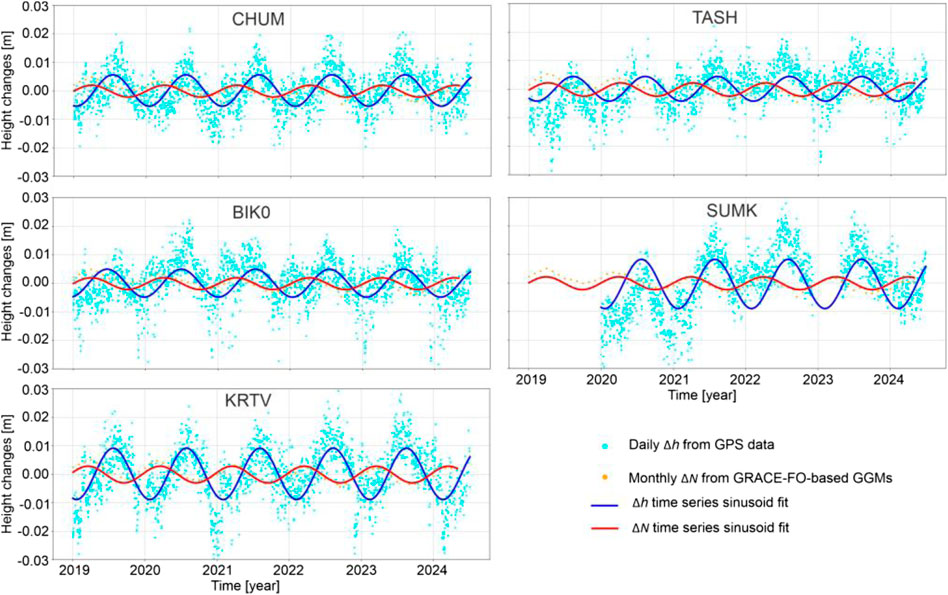
Figure 14. Daily ellipsoidal height changes (Δh) from GPS data and monthly variations of geoid height (ΔN) from GRACE–FO–based GGMs as well as their sinusoidal fit at GPS CORS: CHUM, TASH, BIK0, SUMK and KRTV.
Figure 14 demonstrates that for all GPS CORS used, seasonal variations in Δh derived from GPS data are inversely correlated with corresponding changes in ΔN obtained from GRACE‒FO data, especially during periods of peak hydrological mass accumulation in spring (March‒May) and depletion in summer (June‒September). This finding supports the interpretation that an increase in mass above the geoid causes the geoid height to rise while simultaneously exerting mass loads that result in the downward displacement of the Earth’s surface; conversely, a decrease in mass produces the opposite effect (see Godah et al., 2017b; 2025). Additionally, Figure 14 illustrates that for all GPS CORS utilized the amplitude of Δh from GPS data is notably larger than that of ΔN from GRACE‒FO data. This can be justified to the fact that the Earth’s surface deforms elastically under loading, which GPS captures as point-based vertical displacements. In contrast, the geoid surface responds to changes in gravitational potential and is represented as a smooth surface at coarse spatial resolution (3° × 3°), averaging out localized mass changes. Figure 14 also depicts that for all GPS CORS used the phase shifts between Δh derived from GPS data and ΔN from GRACE‒FO data are approximately 7 or 8 months. These amplitudes and phase shifts are consistent with those reported by Godah et al. (2020) for the Ob River basin, which includes Kazakhstan. Overall, the preliminary results from the comparison between Δh from GPS data and ΔN from GRACE‒FO–based GGMs indicate that GRACE–FO data effectively captures ΔN in the region. However, a more comprehensive analysis involving additional GPS CORS across Kazakhstan and longer time series is recommended to better understand the relationship between GPS–derived Δh and GRACE‒FO–derived ΔN in the context of hydrological mass variations and seismic activity.
5 Conclusion
This study quantitatively assessed the temporal variations of geoid heights (ΔN) in Kazakhstan determined from GRACE-FO satellite mission data in the period 2019–2024. Furthermore, the relations between ΔN and (1) hydrological changes and (2) seismic activity have been investigated.
The findings of this study revealed a general downward trend of geoid height observed until 2022, reflecting long-term mass redistribution in the region, which then stabilized from 2023 onward, possibly indicating a slowdown in mass loss. Seasonal variations in geoid height were evident throughout the study period, with a dispersion (Max-Min) of approximately 7 mm. These variations are attributed to hydrological processes such as snowmelt, floods, evaporation, and changes in river runoff, with maximum geoid heights occurring in spring and minimum values in autumn. The results obtained also demonstrated that the greatest geoid height changes were in the western regions, particularly around the Caspian Sea, where a significant decline in sea level corresponded with a reduction in water mass and a resulting decrease in geoid height. This relationship was strongly supported by a high positive correlation coefficient of 0.91 between Caspian Sea water level changes and geoid height variations. Conversely, in southeastern Kazakhstan, including the Tien Shan and Almaty regions, an increase in geoid height was linked to glacier melting and isostatic compensation processes. These phenomena cause vertical crustal movements that impact mass distribution and the gravitational field.
An unusual temporal variations of geoid heights was observed in 2024. This can be attributed to extreme hydrological events and seismic activity as heavy precipitation in late 2023 led to abnormal snow accumulation, influencing an increase in geoid height in northern and western Kazakhstan. The subsequent large–scale floods in spring 2024 caused a redistribution of water masses and temporary geoid anomalies. Additionally, increased seismic activity in southern Kazakhstan, particularly in the Altai and Tien Shan regions, induced changes in lithospheric mass distribution, resulting in localized geoid height shifts up to 2.6 mm.
The preliminary comparison of vertical ellipsoidal height changes (Δh) from GPS with ΔN from GRACE–FO–based GGMs reveals a distinct inverse seasonal pattern, highlighting mass loading effects on both the Earth’s surface and geoid. GPS data capture larger, localized elastic surface displacements, whereas GRACE–FO reflects smoother, broader regional geoid variations. These results are consistent with earlier studies, supporting the reliability of GRACE–FO data in representing mass–related geoid changes in the region.
Overall, this study underscores the critical role of monitoring geoid height variations for comprehending hydrological, tectonic, and climatic processes in Kazakhstan. The findings would offer valuable insights for predicting changes in water resources, assessing tectonic risks, and managing natural disasters in the region. They would also play a vital role in addressing international geodetic issues such as the realization of the International Height Reference Frame (IHRF) considering the temporal variations of the Earth gravity field in Central Asia, particularly, the area of Kazakhstan.
Prospects for further research could focus on the development of improved temporal variations of geoid heights prediction models, capable of predicting such variations over the next 5 years, based on a combination of GRACE–FO satellite data, GNSS, altimetry, and hydrological models. Moreover, investigating the potential of integrating data from GRACE/GRACE–FO RL07 and Swarm missions to improve the temporal continuity of ΔN. Comprehensive research concerning the influences of hydrological and seismic-related anomalies on geoid dynamics through GNSS CORS, and ground–based gravimetric observations are also warranted. Moreover, investigating leakage effects on temporal variations of geoid heights in Kazakhstan determined from GRACE–FO–based GGMs.
Data availability statement
The data presented in this study are available on request from the corresponding author.
Author contributions
DS: Writing – original draft, Supervision, Conceptualization, Methodology, Investigation. AU: Writing – original draft, Formal Analysis, Conceptualization, Validation. WG: Software, Writing – review and editing. SN: Writing – original draft, Funding acquisition, Project administration. NZ: Visualization, Writing – original draft, Resources, Validation, Data curation. MK: Validation, Writing – original draft.
Funding
The authors declare that financial support was received for the research and/or publication of this article. This research was funded by Committee of Science of the Ministry of Science and Higher Education of the Republic of Kazakhstan (Grant No. BR21882366).
Conflict of interest
The authors declare that the research was conducted in the absence of any commercial or financial relationships that could be construed as a potential conflict of interest.
Generative AI statement
The authors declare that no Generative AI was used in the creation of this manuscript.
Any alternative text (alt text) provided alongside figures in this article has been generated by Frontiers with the support of artificial intelligence and reasonable efforts have been made to ensure accuracy, including review by the authors wherever possible. If you identify any issues, please contact us.
Publisher’s note
All claims expressed in this article are solely those of the authors and do not necessarily represent those of their affiliated organizations, or those of the publisher, the editors and the reviewers. Any product that may be evaluated in this article, or claim that may be made by its manufacturer, is not guaranteed or endorsed by the publisher.
References
Ahmad, S., Ahmad, S., Akhtar, S., Ahmad, F., and Ansari, M. A. (2025). Data-driven assessment of corrosion in reinforced concrete structures embedded in clay dominated soils. Sci. Rep. 15 (1), 22744. doi:10.1038/s41598-025-08526-w
Bako, M., Elsaka, B., Kusche, J., and Fenoglio-Marc, L. (2024). Evaluation of GOCE/GRACE and combined global geopotential models using GNSS/levelling data over Nigeria. Studia Geophys. Geod. 69, 1–21. doi:10.1007/s11200-023-0804-6
Blewitt, G., Hammond, W. C., and Kreemer, C. (2018). Harnessing the GPS data explosion for interdisciplinary science. Eos 99. doi:10.1029/2018EO104623
Brun, F., Berthier, E., Wagnon, P., Kääb, A., and Treichler, D. (2017). A spatially resolved estimate of high mountain Asia glacier mass balances from 2000 to 2016. Nat. Geosci. 10 (9), 668–673. doi:10.1038/ngeo2999
Burchfiel, B. C., Brown, E. T., Qidong, D., Xianyue, F., Jun, L., Molnar, P., et al. (1999). Crustal shortening on the margins of the tien Shan, Xinjiang, China. Int. Geol. Rev. 41 (8), 665–700. doi:10.1080/00206819909465164
Chen, J., Cazenave, A., Dahle, C., Llovel, W., Panet, I., Pfeffer, J., et al. (2022). Applications and challenges of GRACE and GRACE follow-on satellite gravimetry. Surv. Geophys. 43 (1), 305–345. doi:10.1007/s10712-021-09685-x
Dahle, C., Murböck, M., Flechtner, F., Dobslaw, H., Michalak, G., Neumayer, K. H., et al. (2019). The GFZ GRACE RL06 monthly gravity field time series: processing details and quality assessment. Remote Sens. 11 (18), 2116. doi:10.3390/rs11182116
Drinkwater, M. R., Floberghagen, R., Haagmans, R., Muzi, D., and Popescu, A. (2003). GOCE: ESA’s first earth explorer core mission. Space Sci. Rev. 108 (1–2), 419–432. doi:10.1023/A:1026104216284
Drygval, A., Drygval, P., Gorbunova, T., and Kerimov, I. (2024). Analyses of air temperature and precipitation anomalies with in the south and west coastal regions of the Caspian sea for the period 1961-2023. Sustain. Dev. Mt. Territ. 16 (3), 1054–1070. doi:10.21177/1998-4502-2024-16-3-1054-1070
Godah, W. (2019). IGiK–TVGMF: a MATLAB package for computing and analysing temporal variations of gravity/mass functionals from GRACE satellite based global geopotential models. Comput. and Geosciences 123, 47–58. doi:10.1016/j.cageo.2018.11.008
Godah, W., Szelachowska, M., and Krynski, J. (2017a). On the analysis of temporal geoid height variations obtained from GRACE-based GGMs over the area of Poland. Acta Geophys. 65, 713–725. doi:10.1007/s11600-017-0064-3
Godah, W., Szelachowska, M., and Krynski, J. (2017b). On the estimation of physical height changes using GRACE satellite mission data–A case study of central Europe. Geodesy Cartogr. 66 (2), 211–226. doi:10.1515/geocart-2017-0013
Godah, W., Szelachowska, M., Öztürk, E. Z., and Krynski, J. (2018a). “On the contribution of physical height changes estimated with the use of GRACE satellite mission data to the modernization of a national vertical system,” in AGU fall meeting abstracts.
Godah, W., Szelachowska, M., and Krynski, J. (2018b). Application of the PCA/EOF method for the analysis and modelling of temporal variations of geoid heights over Poland. Acta Geod. Geophys. 53, 93–105. doi:10.1007/s40328-017-0206-8
Godah, W., Szelachowska, M., Krynski, J., and Ray, J. D. (2020). Assessment of temporal variations of orthometric/normal heights induced by hydrological mass variations over large river basins using GRACE mission data. Remote Sens. 12 (18), 3070. doi:10.3390/rs12183070
Godah, W., Yadeta, S. M., Szelachowska, M., and Fotopoulos, G. (2025). Assessment of temporal variations of geoid, ellipsoidal and orthometric heights at proposed IHRF sites using space geodetic data. J. Appl. Geodesy. doi:10.1515/jag-2025-0018
Guo, J., Shi, T., Jin, X., Liu, X., Zhao, B., and Qiao, X. (2024). Geodetic analysis of orthometric height variations in mainland China using GRACE, hydrological models, and GPS data. IEEE Trans. Geoscience Remote Sens. 62, 1–15. doi:10.1109/TGRS.2024.3386879
Hofstetter, A., and Lister, C. R. B. (1989). Effects of isostasy on large-scale geoid signal—I. Geoid anomaly over an earth-like planet. Geophys. J. Int. 97 (1), 59–74. doi:10.1111/j.1365-246X.1989.tb00485.x
Ince, E. S., Barthelmes, F., Reißland, S., Elger, K., Förste, C., Flechtner, F., et al. (2019). ICGEM–15 years of successful collection and distribution of global gravitational models, associated services, and future plans. Earth Syst. Sci. Data 11 (2), 647–674. doi:10.5194/essd-11-647-2019
Jacob, T., Wahr, J., Gross, R., Swenson, S., and A, G. (2012). Estimating geoid height change in North America: past, present and future. J. Geodesy 86 (5), 337–358. doi:10.1007/s00190-011-0522-7
Kholoptsev, A. V., and Naurozbayeva, Z. K. (2024). Correlations of interannual variations in average monthly levels of the caspian sea, as well as the total precipitation in its basin, and their changes under modern climate warming. Geogr. i Vodn. Resur. 3, 21–36. doi:10.55764/2957-9856/2024-3-21-36.23
Kooi, H., and Groen, J. (2003). Geological processes and the management of groundwater resources in coastal areas. Neth. J. Geosciences 82 (1), 31–40. doi:10.1017/S0016774600022770
Koriche, S. A., Singarayer, J. S., and Cloke, H. L. (2021). The fate of the Caspian Sea under projected climate change and water extraction during the 21st century. Environ. Res. Lett. 16 (9), 094024. doi:10.1088/1748-9326/ac1af5
Kraemer, R., Prishchepov, A. V., Müller, D., Kuemmerle, T., Radeloff, V. C., Dara, A., et al. (2015). Long-term agricultural land-cover change and potential for cropland expansion in the former virgin lands area of Kazakhstan. Environ. Res. Lett. 10 (5), 054012. doi:10.1088/1748-9326/10/5/054012
Krynski, J., Kloch-Glowka, G., and Szelachowska, M. (2014). “Analysis of time variations of the gravity field over Europe obtained from GRACE data in terms of geoid height and mass variation,” in Earth on the Edge: Science for a Sustainable Planet: Proceedings of the IAG General Assembly, Melbourne, Australia, June 28-July 2, 2011 (Springer Berlin Heidelberg), 365–370.
Kusche, J., Schmidt, R., Petrovic, S., and Rietbroek, R. (2009). Decorrelated GRACE time-variable gravity solutions by GFZ, and their validation using a hydrological model. J. Geodesy 83, 903–913. doi:10.1007/s00190-009-0308-3
Landerer, F. W., Flechtner, F. M., Save, H., Webb, F. H., Bandikova, T., Bertiger, W. I., et al. (2020). Extending the global mass change data record: GRACE follow-on instrument and science data performance. Geophys. Res. Lett. 47 (12), e2020GL088306. doi:10.1029/2020gl088306
Loomis, B. D., Rachlin, K. E., and Luthcke, S. B. (2019). Improved Earth oblateness rate reveals increased ice sheet losses and mass-driven sea level rise. Geophys. Res. Lett. 46 (12), 6910–6917. doi:10.1029/2019gl082929
Pan, Y., Chen, R., Yi, S., Wang, W., Ding, H., Shen, W., et al. (2019). Contemporary mountain-building of the tianshan and its relevance to geodynamics constrained by integrating GPS and GRACE measurements. J. Geophys. Res. Solid Earth 124 (11), 12171–12188. doi:10.1029/2019JB017566
Putans, V. A., Trimonova, M., and Merklin, L. R. (2022). Hidden hydrosphere under the caspian sea: geophysical evidence and sea level influence. Interpretation 11 (1), 181–188. doi:10.1190/int-2021-0102.1
Rakhimbayeva, D., Kyrgizbayeva, G., Shoganbekova, D., Nurpeissova, T., and Yusupov, K. (2023). Study of the method for monitoring the Caspian Sea coastline based on the data of remote sensing of the Earth. News Natl. Acad. Sci. Repub. Kazakhstan, Ser. Geol. Tech. Sci. 6 (462), 157–173. doi:10.32014/2023.2518-170X.356
Rangelova, E., Fotopoulos, G., and Sideris, M. G. (2010). “Implementing a dynamic geoid as a vertical datum for orthometric heights in Canada,” in Gravity, geoid and Earth observation: IAG commission 2: gravity field, chania, Crete, Greece, 23-27 June 2008 (Berlin, Heidelberg: Springer Berlin Heidelberg).
Reigber, C., Schwintzer, P., Neumayer, K. H., Barthelmes, F., König, R., Förste, C., et al. (2003). The CHAMP-only Earth gravity field model EIGEN-2. Adv. Space Res. 31 (8), 1883–1888. doi:10.1016/s0273-1177(03)00162-5
Rizvi, Z. H., Mustafa, S. H., Sattari, A. S., Ahmad, S., Furtner, P., and Wuttke, F. (2020). “Dynamic lattice element modelling of cemented geomaterials,” in Advances in computer methods and geomechanics: IACMAG symposium 2019 (Singapore: Springer Singapore), 1, 655–665. doi:10.1007/978-981-15-0886-8_53
Safarov, E. S., Safarov, S. H., and Bayramov, E. (2024). Changes in the hydrological regime of the volga River and their influence on Caspian Sea level fluctuations. Water 16 (12), 1744. doi:10.3390/w16121744
Sansò, F., and Sideris, M. G. (2013). Geoid determination. Theory Methods. doi:10.1007/978-3-540-74700-0
Sun, Y., Riva, R., and Ditmar, P. (2016). Optimizing estimates of annual variations and trends in geocenter motion and J2 from a combination of GRACE data and geophysical models. J. Geophys. Res. Solid Earth 121 (11), 8352–8370. doi:10.1002/2016jb013073
Szelachowska, M., Godah, W., and Krynski, J. (2022). Contribution of GRACE satellite mission to the determination of orthometric/normal heights corrected for their dynamics—a case study of Poland. Remote Sens. 14 (17), 4271. doi:10.3390/rs14174271
Tapley, B. D., Bettadpur, S., Ries, J. C., Thompson, P. F., and Watkins, M. M. (2004). GRACE measurements of mass variability in the Earth system. Science 305 (5683), 503–505. doi:10.1126/science.1099192
Tapley, B. D., Watkins, M. M., Flechtner, F., Reigber, C., Bettadpur, S., Rodell, M., et al. (2019). Contributions of GRACE to understanding climate change. Nat. Clim. Change 9 (5), 358–369. doi:10.1038/s41558-019-0456-2
Torge, W., Müller, J., and Pail, R. (2023). Geodesy in De Gruyter Textbook. 5th edn. (Berlin and Boston: De Gruyter). doi:10.1515/9783110723304
Urazaliyev, A. S., Shoganbekova, D. A., Shults, R., Kozhakhmetov, M. S., and Maratovna, I. G. (2024). Investigation of lSMSA approach in local geoid modeling. News Natl. Acad. Sci. Repub. Kazakhstan, Ser. Geol. Tech. Sci. 4 (466), 261–273. doi:10.32014/2024.2518-170X.440
Van Dijk, A. I. J. M., Beck, H. E., Boergens, E., de Jeu, R. A. M., Dorigo, W. A., Edirisinghe, C., et al. (2025). Global water monitor 2024, summary report. Available online at: https://www.globalwater.online/globalwater/wp-content/uploads/2018/09/GWM-Report-2024.pdf.
Völgyesi, L., and Tóth, G. (2005). “Modelling gravity gradient variation due to water mass fluctuations,” in Gravity, geoid and space missions: GGSM 2004 IAG international symposium Porto, Portugal August 30–September 3, 2004 (Springer Berlin Heidelberg), 364–368.
Xu, P., Jiang, T., Zhang, C., Qu, G., Zhang, H., and Li, W. (2025). Temporal variations of the geoid and dynamic maintenance of height reference frame using surface mass loading and GRACE/GRACE-FO data. Geophys. J. Int. 242 (2), ggaf215. doi:10.1093/gji/ggaf215
Yadeta, S. M., Godah, W., Szelachowska, M., and Fotopoulos, G. (2024). Assessment of temporal variations of orthometric/normal heights at proposed international height reference frame sites using GRACE/GRACE-FO. Surv. Rev. 56 (398), 489–499. doi:10.1080/00396265.2023.2293367
Keywords: geoid height, GRACE–FO, seasonal variations, long–term variations, seismic activity, extreme hydrological events
Citation: Shoganbekova D, Urazaliyev A, Godah W, Nurakynov S, Zhaksygul N and Kozhakhmetov M (2025) Temporal variations of geoid heights over Kazakhstan from GRACE–FO data and their relation with hydrological changes in the Caspian Sea and seismic activity. Front. Earth Sci. 13:1662855. doi: 10.3389/feart.2025.1662855
Received: 09 July 2025; Accepted: 29 October 2025;
Published: 12 November 2025.
Edited by:
Filippo Greco, National Institute of Geophysics and Volcanology (INGV), ItalyReviewed by:
Zarghaam Rizvi, GeoAnalysis Engineering GmbH, GermanyXingyu Kang, Changsha University of Science and Technology, China
Copyright © 2025 Shoganbekova, Urazaliyev, Godah, Nurakynov, Zhaksygul and Kozhakhmetov. This is an open-access article distributed under the terms of the Creative Commons Attribution License (CC BY). The use, distribution or reproduction in other forums is permitted, provided the original author(s) and the copyright owner(s) are credited and that the original publication in this journal is cited, in accordance with accepted academic practice. No use, distribution or reproduction is permitted which does not comply with these terms.
*Correspondence: Asset Urazaliyev, YS51cmF6YWxpeWV2QGlvbm9zLmt6