 Yi Zhang†
 Yan Zhou
- Sichuan Earthquake Administration, Chengdu, China
Introduction: To reduce the risks associated with earthquake relief decision-making and improve the efficiency of earthquake information services, this paper proposes a seismic emergency decision-making utility evaluation process and emergency information utility evaluation method based on the perception of user demand, starting from user needs.
Materials and Methods: An evaluation model is constructed based on user preferences, information volume, and decision effectiveness. This article explores the quantification of earthquake emergency information utility and the decision-making utility evaluation process. It establishes a user preference model using Bayesian methods, introduces information entropy into it, and constructs a quadratic polynomial function linking demand probability, information quantity, and utility to quantify the decision-making utility of information products. Based on the threshold, effective information products were selected.
Results: The reliability was tested, and the results showed that the correlation coefficient (R2), root mean square error (RMSE), and bias of the modeling set were 0.8955, 0.6492, and 0.0033, respectively. In addition, a 5-fold cross-validation was conducted to confirm the model's robustness and stability across different data partitions. The 6.0-magnitude earthquake that occurred in Luxian County, Sichuan Province, in 2021 was used as an example to test the feasibility of the evaluation process, demonstrating the rationality and effectiveness of the model.
Conclusion: This method provides a new approach for evaluating information utility in a set scenario, which is beneficial for improving the decision-making ability of earthquake resistance and disaster-relief management, and effectively reducing the losses caused by earthquakes.
1 Introduction
After an earthquake, relief departments need to rapidly make decisions in highly complex and multi-dimensional demand scenarios, making information the lifeline of earthquake emergency decision-making (Alexander, 2002; Boin et al., 2005).The government-affiliated earthquake relief command centers and research institutions process and refine massive volumes of information to generate diverse forms of emergency information products, including written reports, maps, and tables, thereby providing decision-making support for rescue departments(Zhang et al., 2016). There are two main requirements for information products. First, due to the harm caused by earthquakes, effectively providing information for decision-making according to the requirements of the affected population is the key to effective earthquake relief and reduction of losses. Second, there is a need to evaluate the effectiveness of emergency information dissemination and screen the resulting information products to provide timely feedback according to the requirements of the demand side, as well as to promote continuous optimization of such information products. Based on these requirements, this study considers the combined optimization and development of earthquake emergency information products regarding the effectiveness of decision-making from the perspective of user demand. The main goals are to promote development through evaluation, thereby forming a virtuous cycle, and developing targeted information products that effectively promote decision-making during earthquake relief efforts.
In the existing literature, there is little in-depth discussion concerning the evaluation of the utility of information products. The evaluation of decision utility for emergency information is based on simple numerical comparisons (e.g., the deviation between estimates of the numbers of casualties, the size of the disaster area, and estimates of earthquake intensity and the actual situation). Due to the limited evaluation of these forms of information, the current methods perhaps rely too heavily on simple indicator analyses, ignoring the dynamic and uncertain nature of information dissemination and making it difficult to fully reflect the actual effects of decisions. The existing methods are mostly post-evaluation approaches that are difficult to adapt to the real-time needs of emergency decision-making and are not conducive to feedback and optimization from the perspective of product development (Zhang et al., 2021a; Zhang et al., 2021b). Subjective factors may not be fully considered, and the impact of factors such as decision-makers’ experience and psychological state on information utility has not been fully incorporated into the present evaluation systems.
Based on the above considerations, this article explores the quantification of the utility of earthquake emergency information and the evaluation of decision processes using the decision-making scenario of provincial-level emergency command institutions after a moderate earthquake. By introducing a multidimensional evaluation system and implementing dynamic real-time evaluation, the utility of information products is continuously quantified and optimized to improve the level of information processing and decision support. Taking the 6.0-magnitude earthquake in Luxian County, Sichuan Province, China, in 2021 as an example, the rationality and effectiveness of the evaluation model are verified, ultimately providing a more effective information product development process and an evaluation method for enhancing earthquake emergency decision-making capabilities.
2 Materials and methods: construction of a seismic emergency information decision-making utility evaluation model based on user demand
2.1 Research hypothesis
In the dissemination of earthquake emergency information, each earthquake will have unique characteristics, and thus specific information is needed to support decision-making. Earthquake emergency information needs to be continuously updated and optimized according to decision-makers’ demands to assess the disaster situation as soon as possible and reduce casualties. Therefore, taking moderate-to-strong earthquakes as the application scenario, we propose the following three hypotheses.
Assumption 1. After a moderate earthquake (
Assumption 2. The decision-making utility of information products increases with the number of user preferences, and within a specific range, the utility increases with the volume of information.
Assumption 3. Knowledge-intensive information products (e.g., rapid assessment reports and disaster briefings) and specialized products related to human factors (e.g., population casualty distribution maps, personnel search and rescue distribution maps, the status of high-intensity buildings, and key target distribution maps) have higher decision-making value than other products.
2.2 Development, use, and evaluation of the decision-making effectiveness of earthquake emergency information products
2.2.1 The necessity of developing earthquake emergency information products
Within 2 hours or less after an earthquake, responsible parties need to use earthquake emergency information for decision-making in highly uncertain situations. Since 2000, China has continuously developed various types of earthquake emergency information decision-making products, but only a few products can effectively aid in emergency decision-making. Therefore, it is necessary to establish a dynamic optimization information product and an evaluation model that considers the needs of the users.
2.2.2 Application scenarios and sources of earthquake emergency information
After a moderate to strong earthquake (
The earthquake emergency information selected in this article was obtained from government-affiliated earthquake relief command centers and research institutions. The classification of metadata was based on more than 10 years of earthquake emergency information system services, and this study does not consider the technical investment and economic costs of information in the production and circulation processes.
The 34 selected earthquake disaster events have a spatial range of Sichuan and Yunnan Provinces, a time range of 2010–2021, and a magnitude range of 5.0–7.0. Products with the same name repeatedly appearing in multiple earthquake disasters and from multiple sources were recorded as one product. For products with different names but highly similar content, those with the most recent product were retained. Products produced 24 h after the earthquake were excluded. A total of 100 information products were obtained for statistical analysis.
2.2.3 Development and evaluation process of earthquake emergency information products based on perceptions of user demand
Based on the theory of utility as a subdivision of information theory (Cheng et al., 1994), we propose that in earthquake emergency decision-making, an evaluation of the decision utility of information involves evaluating the degree to which information flows from the production department to the decision-making scenario and meets the needs of the user. This includes one batch of earthquake emergency information products (hereafter referred to as information products), one production department, one earthquake relief command organization and commander (hereinafter referred to as users), one decision-making scenario, and one set of evaluation methods. Therefore, the evaluation process of information decision utility designed in this study differs from existing evaluation methods by incorporating user needs and the perception of utility. Evaluation is a dynamic, cyclic process that comprises three modes (Figure 1). One is to construct a utility evaluation model, the focus of this article and the foundation of the evaluation process. The second is the “product demand” iterative mode, which is suitable for the emergency preparedness stage. Based on the model, the utility value of information products is quickly evaluated and tested to form a product utility list. The median principle method (Hu, 2011) is used to determine the utility threshold. Products with utility values not lower than the threshold are considered effective products, and the production department uses feedback information to update product information. This process is repeatedly optimized to obtain information products that approximate user preferences. The third is the parameter correction mode. After an earthquake event occurs, users will receive the latest effective information products by obtaining the decision utility value of the information product in the decision-making scenario, expanding the sample size, further correcting the utility parameters, updating the utility evaluation model, and feeding back the information to the production department.
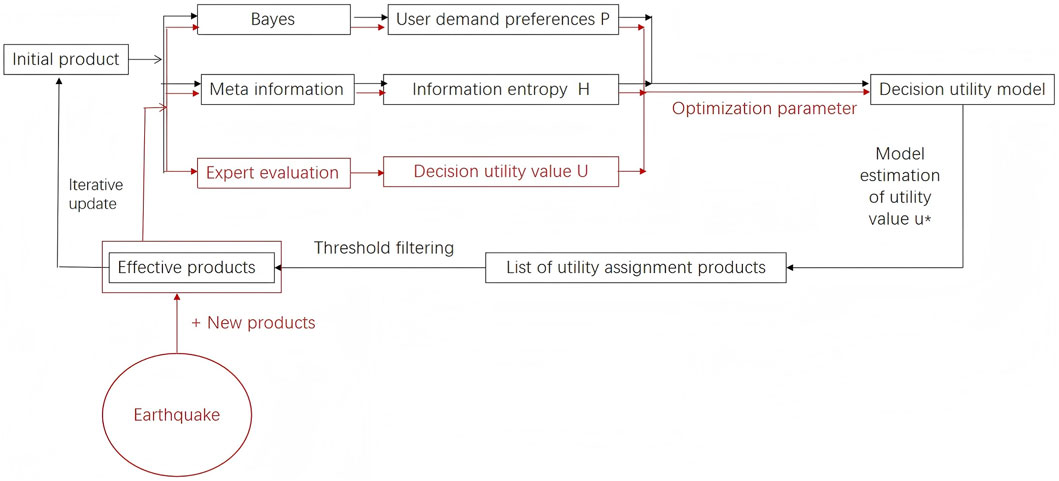
Figure 1. Flow chart for information decision utility assessment.
2.3 Construction of an earthquake emergency information utility evaluation model based on user demand
Using the three indicators of information H, user demand preference P, and decision utility U, the relationship between the three modes is shown by the construction of the earthquake emergency information utility evaluation model based on user demand.
2.3.1 Calculation of model parameters
First, information entropy calculation formulas and user demand preferences are separately established, after which user utility values are obtained through expert ratings. Then, data on the three variables is used to establish a regression model. The specific process is as follows.
1 Calculation of information entropy
The information content of a product is the leading indicator for evaluating its utility. The Shannon information entropy is used as a quantitative measure of information in mathematics (Fu, 2015). This study introduces the concept of information entropy to quantitatively measure the information content of products. To accurately measure the content of emergency information products, information is segmented into the smallest effective units, namely, metadata, based on content features.
The Shannon information entropy is calculated by multiplying the various possible amounts of information by their probabilities of occurrence, then summing the results to represent the expected value of the information in the entire data set (Equation 1).
Here, x represents a random variable; p(x) represents the set of all possible outputs, the output probability function, and H measures the information content of the product. The previous text assumed that the probability of meta information appearing in information products is the same, and each type of meta information corresponds to different content features. Therefore, the meta information contained in each information product is positively correlated with the amount of information. Thus, the amount of information in each product can be determined only by the number of such information products, and then calculated using information entropy, i.e., the meta information in the product is exponentially calculated (Equation 2):
where
The original information classification was based on relevant research in the field of earthquakes (Su et al., 2003; Dong and Yang, 2014; Gong et al., 2018). Emergency information products were divided into eight categories: preparation information, earthquake situational information, basic information of the earthquake zone, assessment information, disaster situation, public opinion, emergency action, and intensity of investigation. Feature elements were extracted for each category of products to construct an earthquake emergency metadata table based on 210 categories (Table 1).
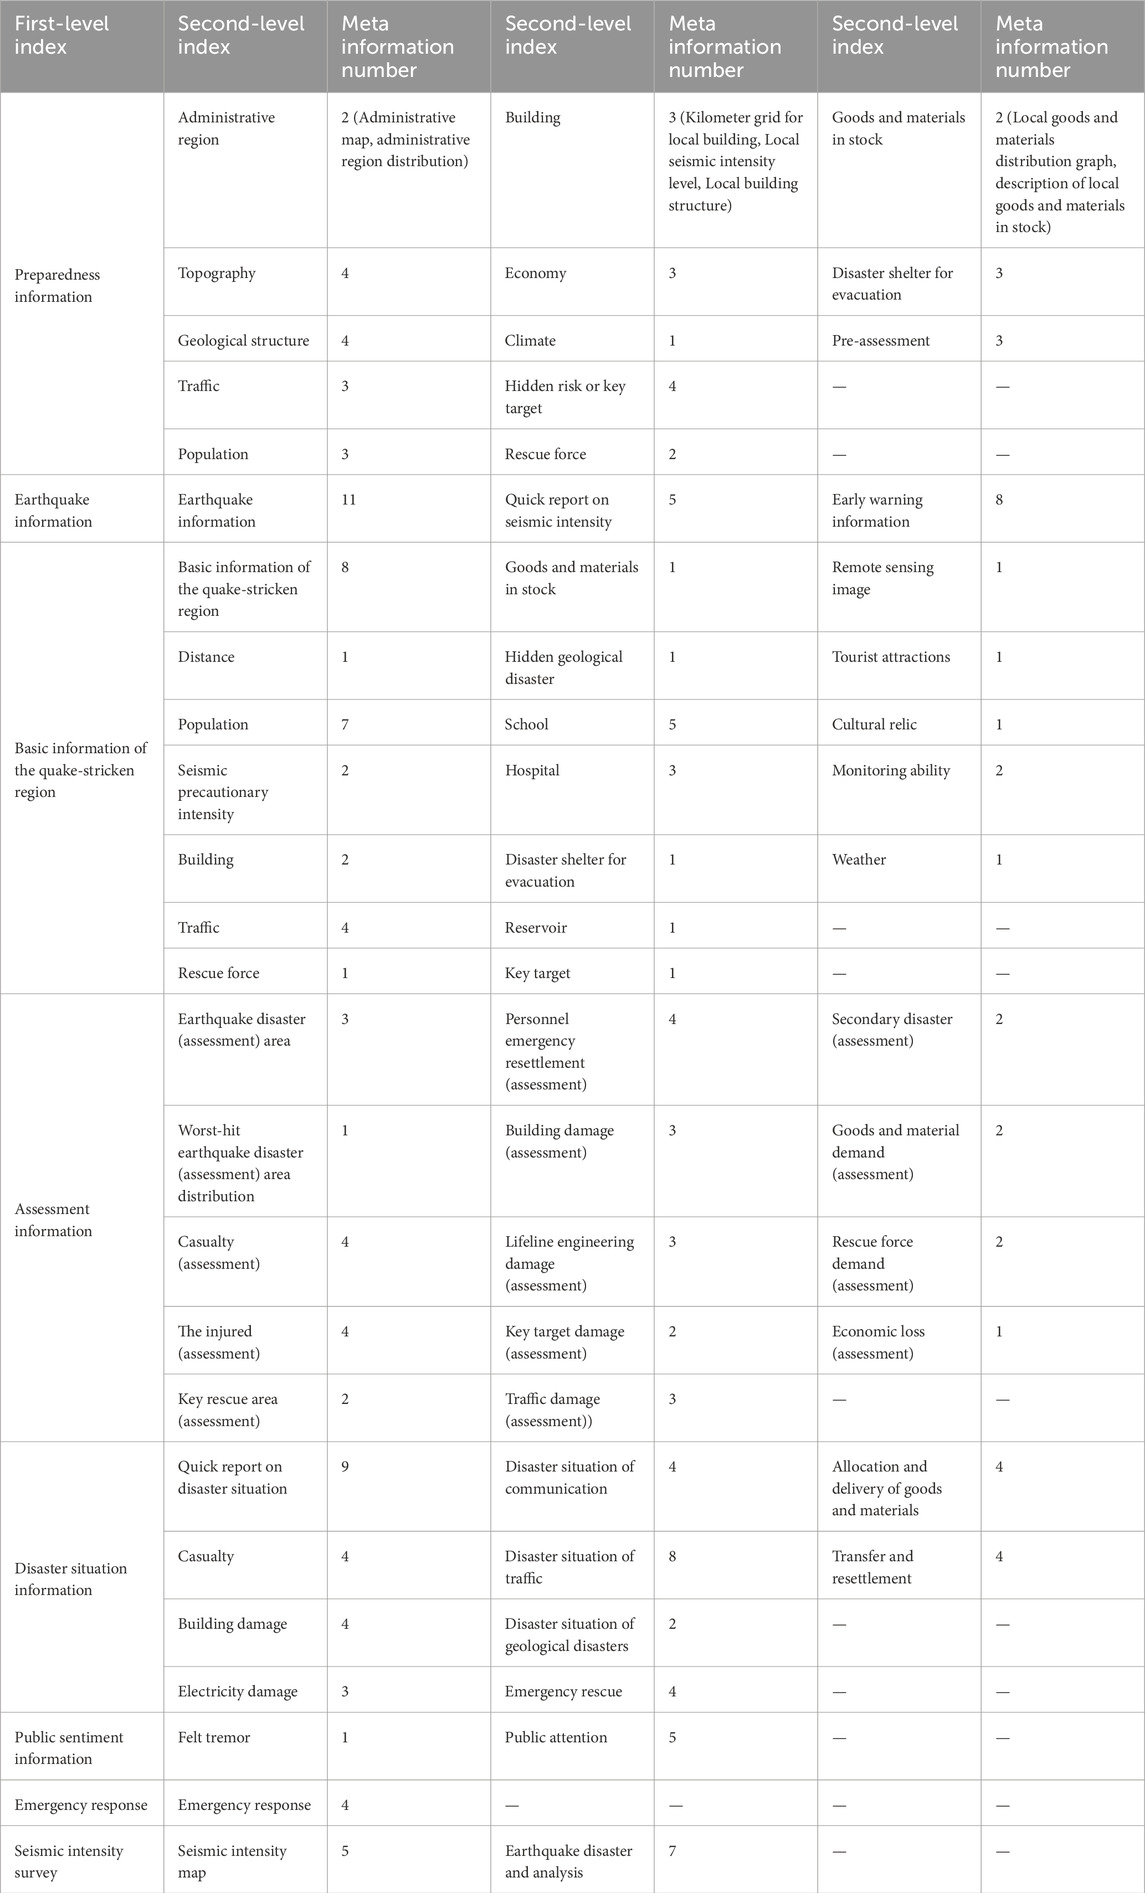
Table 1. Earthquake emergency meta information.
In accordance with the above, this study compiled the number of meta information products contained in 100 earthquake information product samples and measured the information content of the product samples using the information entropy H calculation method (Table 2).
2 Calculation of user demand preference
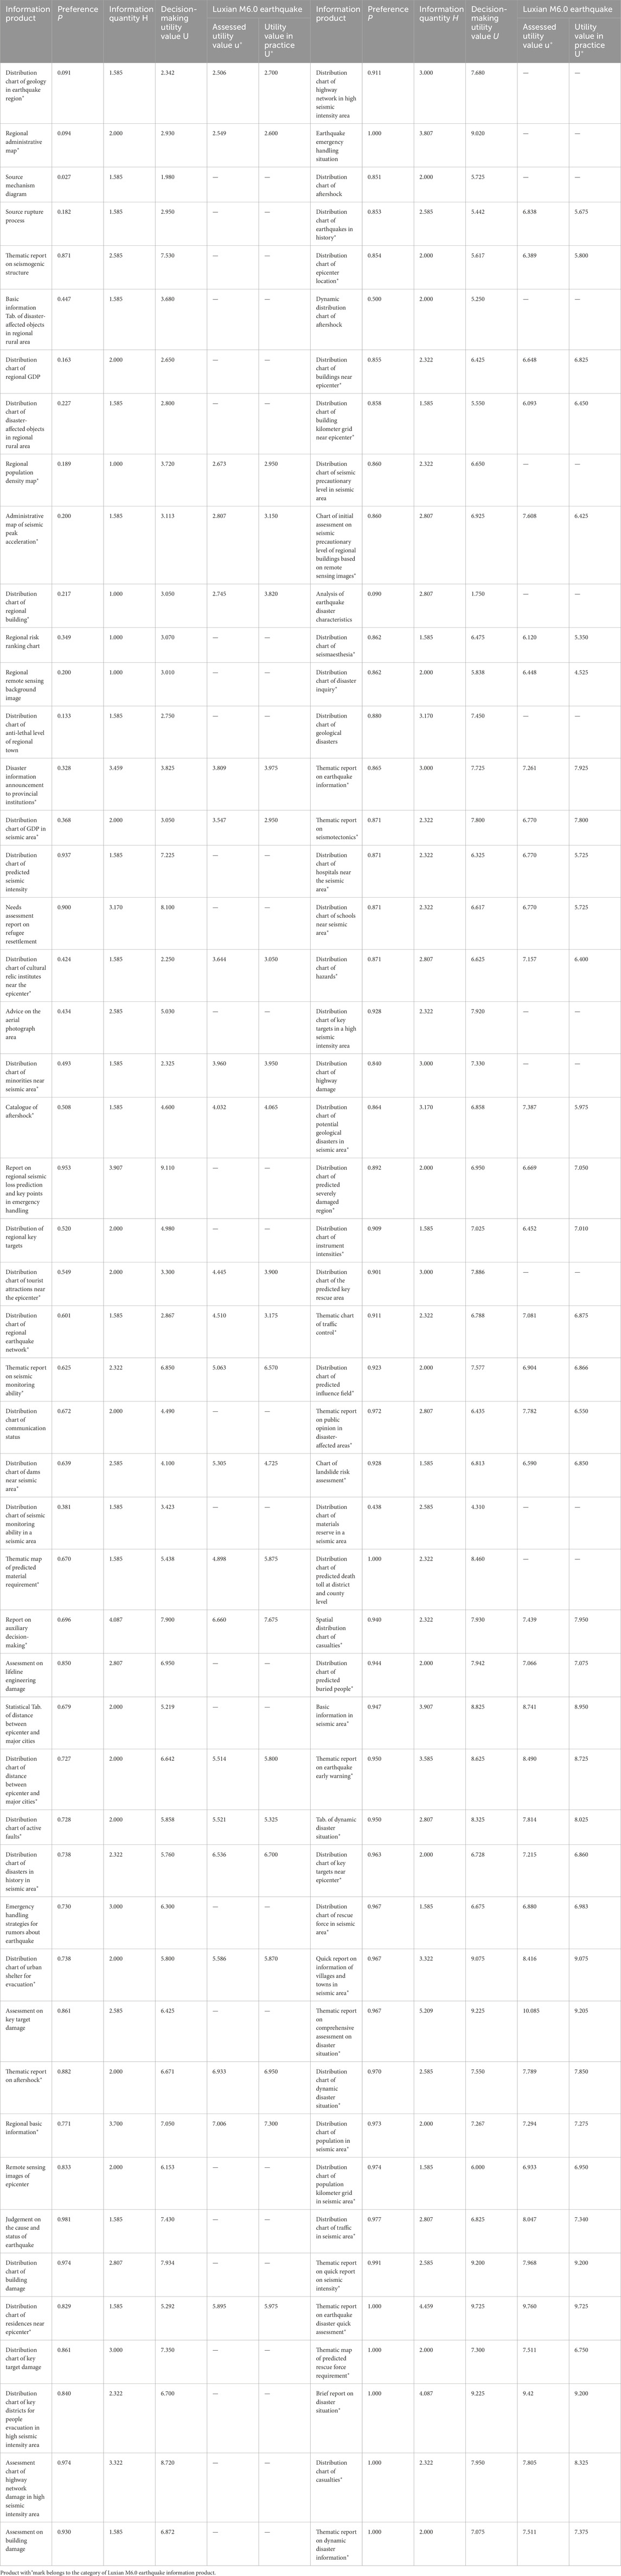
Table 2. Information product list and parameters.
To accurately calculate customer demand preference P, it is necessary to collect user demand preference information and then calculate the corresponding probability based on a Bayesian formula.
Previous studies on the characteristics of earthquake emergency information have been conducted from multiple perspectives, and it is believed that earthquake emergency information products not only possess basic attributes such as nonindependence and sharing of general information but also unique attributes such as content complexity, timeliness, and polymorphic transmission (Wang et al., 2019). Based on the above analysis, in this article, we consider three elements: content, form, and time; we use Bayesian methods to construct a model for calculating user demand preferences.
In the model, the user’s demand for product content is taken as a prior probability, and the formal and temporal probabilities are considered as sample information. The posterior probability of the product is obtained after two rounds of Bayesian inference. The first round of computation is combined with formal probability sample information to produce a posterior probability that then serves as the prior probability for the new round of computation. The second round of computation is combined with the time probability sample information to generate the posterior probability under the product in the earthquake emergency response decision-making scenario.
We collected user preference information through a questionnaire. The valid sample data for this study were provided by 99 member units of the earthquake relief command headquarters in Sichuan and Yunnan provinces. Regarding the 100 information products mentioned earlier, we investigated whether the necessary information and preference for presentation forms such as documents, images, tables, and dynamic images, and preference for obtaining information in the time intervals of 0–2, 2–8, 8–12, and 12–72 h.
Applying the Bayesian formula to obtain the demand probability of products under formal and temporal conditions
Here, i is the sample space of information products, i = 1, 2, 3, … , 100; k indicates various forms of products, including documents, images, tables, and dynamic images. For the demand time, including the 0–2, 2–8, 8–12, and 12–72 h periods; j is taken as the 0–2 h period in the scenario studied in this article.
The specific preference values of users for the product in earthquake emergency response decision-making scenarios are shown in Table 2.
3 Obtaining the decision utility value U
To obtain the decision utility values of the 100 earthquake emergency information products mentioned above, we adopted the indirect evaluation method (Yan, 2000). Twelve experts evaluated the comprehensive decision utility of the information products in the given historical earthquake disaster response decision-making scenarios based on their own experience. The experts gave the products a value of 0–10 points, and the average value was calculated. An expert product utility rating table was then formed after integrating the scenarios of 16 earthquake events in Sichuan and Yunnan. The formula for calculating utility value is as follows (Equation 5):
where l is the set of scoring experts, l = 1, 2, 3, … , M = 12; i is an index of the sample space of information products, i = 1, 2, 3, … , N = 100. The decision utility value
2.3.2 Polynomial model fitting
This study prioritizes parametric simplicity and high interpretability. Similar to the empirical calibration approach employed by Haroon et al. (2017) for model frictional losses and turbulent dissipation in pipelines, our polynomial model enables scenario-driven utility estimation and optimization without requiring the construction of a fully mechanistic framework.
Polynomial-fitting model was adopted to capture the statistical relationships between decision utility and influencing factors. It is a commonly used method for building models of the relationship between independent and dependent variables. According to the number of independent variables, the fitting process can be divided into univariate and multivariate fitting. This process can be further classified as linear and nonlinear fitting (Wang and Ruan, 2004; Huang and Liu, 2021). Here, we construct a univariate polynomial model by analyzing the correlation between product decision utility and user preference, and then add information to conduct a bivariate polynomial model analysis, aiming to obtain a more accurate model that simulates the statistical relationships between decision utility (U), user preference (P), and information (H). Therefore, in this study, the following general formulas for univariate and bivariate polynomials are as follows (Equations 6, 7):
where i is the order of the polynomial. When the order of a univariate polynomial is 1, the function is linear.
To quantitatively evaluate the effectiveness of the model, this study used three statistical factors: the correlation coefficient (R2), the root mean square error (RMSE), and bias to evaluate the relationship between actual utility and assessed utility. The formulas are as follows (Equations 8–10):
where i = 1, 2, 3,. ., N is the quantity of products; ui is the simulated utility value estimated using the model, and Ui is the decision utility value of the product. The closer R2 is to 1, and the closer the absolute values of RMSE and bias are to 0, the better the evaluation performance of the model.
In the model, the dependent variables are the user’s preference for the product (P) and the information content of the product (H), and the independent variable is the decision utility of the product (U). The model was evaluated using the software MATLAB, and the descriptive statistics of each variable are shown in Table 3.
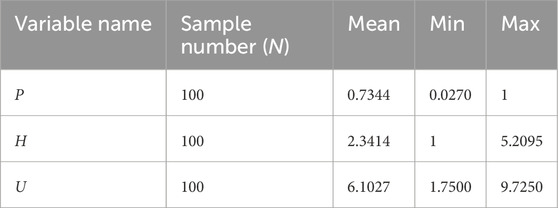
Table 3. Descriptive statistics of the variables.
The maximum, minimum, and average values of P are 1, 0.7344, and 0.0270, respectively; The maximum, minimum, and average values of H are 5.2095, 2.3414, and 1, respectively; The maximum, minimum, and average values of U are 9.7230, 1.7500, and 6.1027, respectively.
1 The U-P Model
To find the relationship between U and P, we use scatter plot data for polynomial regression fitting and establish a U-P model. The scatter plot (Figure 2a) of product decision utility U and user preference P shows that there was a significant positive correlation between product decision utility and user preference. Therefore, in this study, we attempted to establish a model using a univariate polynomial fitting method, and selected the first-order polynomial (linear) model and the second-order polynomial (nonlinear) model with relatively good performance.
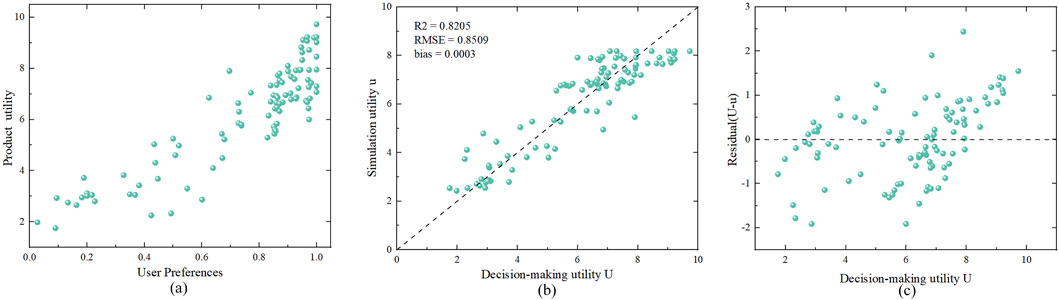
Figure 2. (a) Scatter plot of customer preference P and decision-making utility U; (b,c) Scatter plots for residuals of simulation utility u and decision-making utility U evaluated by a second-order polynomial model U-P.
Further analysis shows that the residual distribution of the second-order polynomial model was between −2.44 and 1.92, with 45% of the residuals distributed between −0.5 and 0.5 (Figures 2b,c), which can better reflect the relationship between product utility and user preferences. Therefore, the
In the formula, c1 and c2 are constant coefficients, and c3 is a constant.
When fitting with a polynomial, the model and statistical factor are as follows (Equation 12):
Meanwhile, when fitting with a second-order polynomial, the model and statistical factors are as follows (Equation 13):
Comparing two models, the second model has a smaller RMSE, it was concluded that expressing the
2 The U-P-H Model
Based on the U-P model, with the addition of information content H, due to the scattered distribution of information content and product decision utility U not being concentrated, the correlation between the two is not as strong (Figure 3a). Therefore, the information content H was taken as the joint action term of user preferences P, forming the following model relationship (Equation 14):
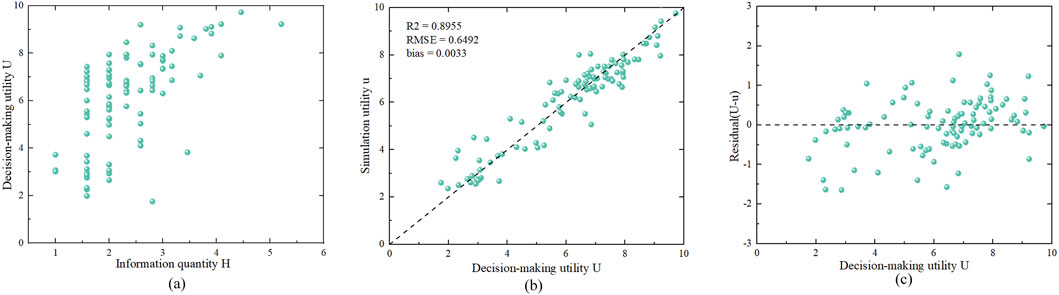
Figure 3. (a) Scatter plot of information quantity H and product decision-making utility U; (b,c) Scatter plot and residual plot of simulation utility u and decision-making utility U fitted with a second-order polynomial model U-P-H.
In the formula, c1, c2, and c3 are constant coefficients, and c4 is a constant.
When constructing the utility evaluation model with added information, the model and statistical factor are as follows (Equation 15):
The coefficient of determination of the model was 0.8955, the root mean square error RMSE was 0.6492, and the bias was 0.0033, indicating that it exhibited better performance than the U-P model. The evaluation of the U-P-H model indicated that the simulated utility and decision utility of the evaluation were evenly distributed around a straight line with a slope of 1 (Figures 3b,c), with residuals ranging from −1.7868 to 1.6434, and more than 60% of the residuals were distributed between −0.5 and 0.5. The evaluation model results showed no significant overestimation or underestimation, indicating that the model was effective.
3 The Applicability of Polynomial Regression
The objective of this study is to support product prioritization by estimating decision utility. Compared to models like logistic regression that require binarization and incorporate scenario-specific thresholds during training, our method preserves the full resolution of utility scores, enhancing adaptability. Due to the limited sample size and low-dimensional feature space, complex models such as Random Forests or Support Vector Machines carry a higher risk of overfitting and tend to obscure the contributions and monotonic relationships of individual factors, thereby reducing interpretability in time-critical decision-making. In contrast, polynomial regression provides an explicit and interpretable mapping. Empirical results show a clear curvature in the U–P–H relationship, with decision utility (U) increasing as information (H) rises, and the effect becoming more sensitive with higher preference (P), reflecting a monotonic trend rather than absolute magnitude.
2.3.3 K-fold cross validation for databases
To verify that the utility prediction model does not suffer from overfitting and possesses robust generalization capability, a 5-fold cross-validation (CV) procedure was employed. Compared with conventional train–test splitting, k-fold cross-validation effectively reduces data selection bias and makes more efficient use of limited datasets. In this study, the entire dataset was randomly partitioned into ten equally sized subsets. In each fold, one subset was used as the validation set while the remaining nine served as the training set. Importantly, the fixed-structure polynomial regression model was directly applied without re-fitting or parameter tuning; the coefficients used were those previously derived from the empirical fitting process. Three key performance metrics—coefficient of determination (R2), root mean square error (RMSE), and bias—were calculated in each fold to evaluate both the fitting accuracy and generalization ability. The results demonstrate consistent performance across folds, confirming that the proposed model maintains stability and avoids overfitting.
The detailed evaluation results are illustrated in Figure 4, which consists of three subplots:

Figure 4. Cross-validation results of the model (a) R2 (b) RMSE (c) bias.
Figure 4a presents the R2 values of both training and validation sets across the five folds. It is observed that the model maintains a consistently high degree of explanatory power, with all training folds yielding R2 values between 0.88 and 0.91, and validation folds remaining above 0.88 in most cases. Although slight fluctuations are visible, particularly in fold two and fold four for the validation set, the overall trend suggests that the model does not rely excessively on any specific data subset and performs robustly across different data partitions.
Figure 4b shows the RMSE for each fold, reflecting the prediction error magnitude. The training RMSE ranges mostly from 0.62 to 0.66 while the validation RMSE shows a similar but slightly wider distribution, from approximately 0.42–0.73. Notably, folds one and two demonstrate relatively higher validation RMSE, which might be attributed to local data variability. However, no fold displays extreme deviation, and most errors stay within a reasonable range, suggesting adequate model precision on unseen samples.
Figure 4c analyzes the bias—i.e., the mean signed error—between predicted and actual utility values. The training bias fluctuates narrowly around zero (mostly within ±0.05), while the validation bias exhibits more pronounced deviations in certain folds, such as fold 2 (approx. −0.10) and fold 5 (approx. +0.08). These variations reflect some degree of asymmetry in prediction, yet the overall magnitude remains small, indicating no systematic overestimation or underestimation across folds.
Together, the cross-validation results demonstrate that the model maintains high generalization capability with minimal overfitting. The use of K-fold cross-validation provides an objective and rigorous measure of model robustness. These findings further confirm that the model’s performance is not confined to specific sample partitions.
3 Results: application of the earthquake emergency information decision-making utility evaluation model based on perception of user demand: the 2021 6.0 Luxian earthquake in Sichuan Province
The model for evaluating the decision-making utility of earthquake emergency information products was verified based on the 2021 magnitude 6.0 Luxian earthquake in Sichuan Province. The evaluation model was based on user demand perception, with dynamically optimizing iterations; we used the models to evaluate information products, effectively connecting the supply and demand sides of earthquake emergency information products, and promoting continuous product optimization.
3.1 Information decision products and utility calculations for the magnitude 6.0 2021 Luxian earthquake in Sichuan Province
According to the data from the China Earthquake Networks Center, a magnitude 6.0 earthquake occurred in Luxian County, Luzhou City, Sichuan Province at 04:33:31 on 16 September 2021. After the earthquake, the government received 61 information products (indicated by the * products in Table 2) during the response and decision-making process. We used the model to calculate the corresponding estimated utility values (Table 2). We adopted the same strategy as in the modeling to obtain the actual utility value of information products (Table 2), the process that assigns utility values to the products through expert ratings.
Comparing the actual utility value U* with the estimated utility value u* of the
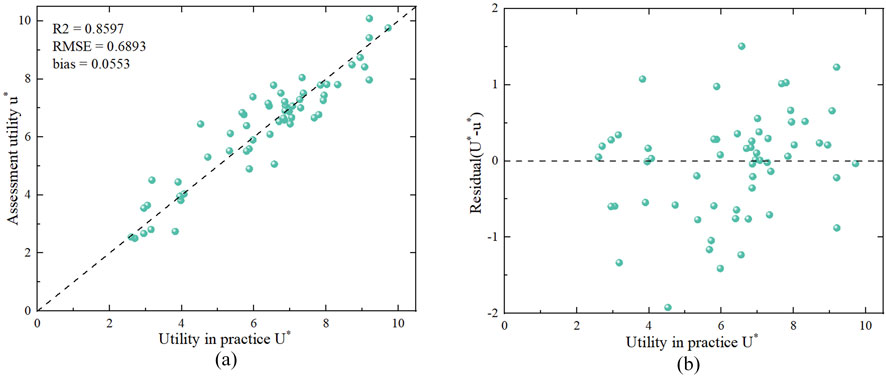
Figure 5. Scatter plot (a) and residual scatter plot (b) of assessment utility u* and utility in practice U* for the Sichuan Luxian M 6.0 earthquake.
3.2 Application of the decision utility evaluation model to the magnitude 6.0 2021 Luxian earthquake and evaluation of the information product
To verify the rationality of the utility evaluation process, the threshold values for the estimated utility u* and the actual utility U* of 61 products were selected using the median principle method, being 6.770 and 6.700, respectively. Two sets of effective product lists were obtained, consisting of 32 and 31 items. After comparison, there were 25 overlapping products in both lists (Figure 6), with a coincidence rate of 66%. Among these, the products with higher utility values and higher rankings were mostly comprehensive special reports or thematic maps related to personnel and disaster situations. The results suggest that the evaluation process can quickly screen out effective information products and that the method is feasible.
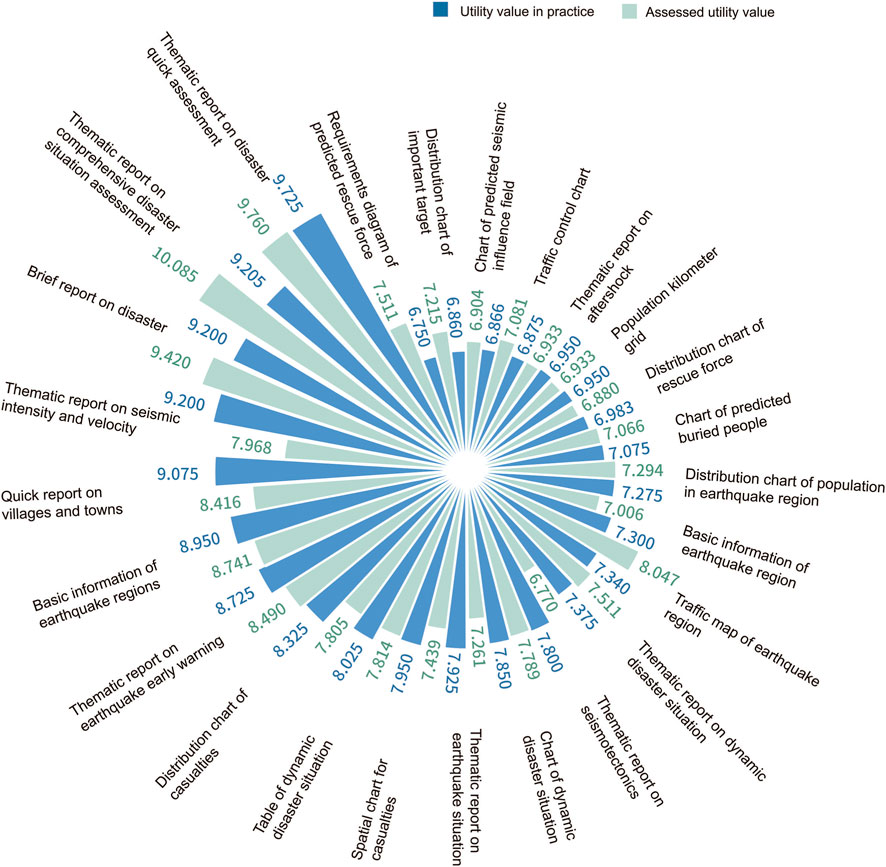
Figure 6. Assessment of utility u* and utility in practice U* of effective products from the Sichuan Luxian M6.0 earthquake.
The earthquake emergency information decision-making utility evaluation model based on user demand perception can effectively bridge the gap between the earthquake emergency information product supply side (i.e., developers) and the demand side (i.e., the earthquake relief command center) and effectively screen out information products that meet the demand side. While the current evaluation model relies on expert-rated utility and Bayesian-derived preference scores, future iterations could incorporate data-driven learning algorithms to identify patterns in effective product use during emergency responses. Similar artificial intelligence-based predictive frameworks have proven effective under uncertain conditions (Ahmad et al., 2025). Thus, the method has strong application and promotion value.
4 Conclusion
Starting from the theory of user demand perception, this study developed an innovative earthquake emergency information development process and decision utility evaluation model based on user demand perception. In particular, The proposed model demonstrates strong applicability under small-sample and low-dimensional feature conditions. It organically links the demand and supply ends, which can effectively evaluate and screen the developed earthquake emergency information products, promote the optimization and iteration of earthquake response information products, enhance the decision-making ability of earthquake relief, and reduce the post-disaster losses caused by earthquakes. The application of earthquake emergency information products in the 6.0 magnitude earthquake in Luxian County shows that the model is effective and has promotional value. Based on the above research results, the following conclusions are drawn.
1. The evaluation model effectively supports earthquake relief decision-making. The present study provides a new risk transfer method and an information decision-making utility evaluation process for dynamically recognizing user needs and calculating utility. The earthquake emergency information product developed from this approach has played an effective decision-making support role in the evaluation of decision-making utility for earthquakes of medium to strong intensity and above. The case of the 6.0 magnitude earthquake in Tonglu County has verified hypothesis one.
2. The earthquake emergency information decision-making utility evaluation model established in the present study has application and promotional value. There was a significant positive correlation between product decision utility and user preference. Evaluation of the relationship between user preference P, information content H, and product utility U showed that the simulated utility and decision utility of the evaluation model were evenly distributed, and the overall goodness of fit of the model was high. The model results verify hypothesis two.
3. The practical application demonstrates that the earthquake emergency information decision-making utility evaluation model is reliable, and knowledge-intensive and human-related products in information products have higher user perception. Taking the 2021 6.0-magnitude earthquake in Luxian County, Sichuan Province as an example, the present study has shown that the utility values estimated by user preferences and product information have a good match with the true utility values of the product, and the evaluation model results are reliable. In addition, knowledge-intensive products and two types of products related to people had higher user demand and decision value, verifying hypotheses two and three.
Although the current model provides good interpretability and practical value, it still has limitations due to its fixed polynomial structure, regional data coverage, and static thresholding strategy. In the future, research in this field will focus on expanding the sample size of earthquake emergency information, building a more comprehensive database, optimizing model structures and parameters, and improving the relevance of product development based on user demand perception. At the same time, more expressive models will be explored to improve applicability across different disaster types, and multimodal data and adaptive strategies (such as graph neural networks and reinforcement learning) will be integrated to enhance the model’s generalization and decision-making flexibility under dynamic constraints.
Data availability statement
The original contributions presented in the study are included in the article/supplementary material, further inquiries can be directed to the corresponding author.
Author contributions
YZa: Conceptualization, Formal Analysis, Investigation, Methodology, Writing – original draft. YZo: Conceptualization, Resources, Supervision, Writing – review and editing. QZ: Data curation, Writing – original draft. YZe: Investigation, Visualization, Writing – review and editing. ST: Resources, Supervision, Writing – review and editing. JY: Visualization, Writing – review and editing.
Funding
The author(s) declare that financial support was received for the research and/or publication of this article. The authors declare that financial support was received for the research and/or publication of this article. This study was funded by the National Key R&D Program for “Comprehensive assessment on the demonstration of devices for communication and perception” (Grant No. 2020YFC1511705-02).
Conflict of interest
The authors declare that the research was conducted in the absence of any commercial or financial relationships that could be construed as a potential conflict of interest.
Generative AI statement
The author(s) declare that no Generative AI was used in the creation of this manuscript.
Any alternative text (alt text) provided alongside figures in this article has been generated by Frontiers with the support of artificial intelligence and reasonable efforts have been made to ensure accuracy, including review by the authors wherever possible. If you identify any issues, please contact us.
Publisher’s note
All claims expressed in this article are solely those of the authors and do not necessarily represent those of their affiliated organizations, or those of the publisher, the editors and the reviewers. Any product that may be evaluated in this article, or claim that may be made by its manufacturer, is not guaranteed or endorsed by the publisher.
References
Ahmad, S., Ahmad, S., Akhtar, S., Ahmad, F., and Ansari, M. A. (2025). Data-driven assessment of corrosion in reinforced concrete structures embedded in clay dominated soils. Sci. Rep. 15, 22744. doi:10.1038/s41598-025-08526-w
Alexander, D. E. (2002). Principles of emergency planning and management. New York: Oxford University Press. doi:10.1108/09653560010326969
Boin, A., t Hart, P., Stern, E., and Sundelius, B. (2005). The politics of crisis management: public leadership under pressure. New York: Cambridge University Press. doi:10.1017/cbo9780511490880
Cheng, A., and Liu, X. (2010). Discussion on the measurement of knowledge value of customer asset. J. Intell. 29 (10), 103–106. doi:10.3969/j.issn.1002-1965.2010.10.023
Cheng, S., Xie, R., and Wu, J. (1994). The past and the present of utility theory. Syst. Engineering-Theory and Pract. 14 (12), 16–21.
Dong, M., and Yang, T. (2014). Discussion of earthquake emergency disaster information classification, technology for Earthquake Disaster Prevention. 9 No. 4 pp. 937–943. doi:10.11899/zzfy20140423
Fu, Z. (2015). Information theory principles and applications. 4th ed. Beijing: Publishing House of Electronics Industry.
Gong, Y., Shen, W., and Zhang, S. (2018). Evaluation of earthquake emergency information effectiveness. North China Earthq. Sci. 36 (4), 55–62. doi:10.3969/j.issn.1003-1375.2018.04.008
Haroon, A., Ahmad, S., and Hussain, A. (2017). “CFD prediction of loss coefficient in straight pipes,” in Development of water resources in India. Water science and technology Library. Editors V. Garg, V. Singh, and V. Raj (Cham: Springer), 75, 477–485. doi:10.1007/978-3-319-55125-8_41
Hu, L. (2011). Determination method of index threshold in risk early warning. Financ. Comput. 9, 43–45.
Huang, J., and Liu, L. (2021). Prediction of Tianjin Port land subsidence based on polynomial regression model. Shanxi Archit. 47 (2), 67–69. doi:10.3969/j.issn.1009-6825.2021.02.025
Su, G., Nie, G., and Gao, J. (2003). The characteristics, classifications and the functions of the information for earthquake emergency response. Earthquake 23 (3), 27–35. doi:10.3969/j.issn.1000-3274.2003.03.004
Wang, Y., and Ruan, Q. (2004). Research on intelligent fitting method for multivariate nonlinear polynomials and its application.Comput. Appl. Chem. 21 No. 1 pp. 157–162. doi:10.3969/j.issn.1001-4160.2004.01.037
Wang, L., Jiang, L., Yang, T., and Zhang, W. (2019). Research on the method of automatic classification in earthquake emergency information. Technol. Earthq. Disaster Prev. 14 (4), 907–916. doi:10.11899/zzfy20190422
Zhang, Y., Tang, S., and Wang, Y. (2016).Classification and coding of earthquake emergency information products.Technol. Earthq. Disaster Prev.,Vol.11 No. 1 pp. 132–143. doi:10.11899/zzfy20160115
Zhang, Y., Zhou, Y., Xu, J., and Yan, J. (2021a).Study on the characteristics of the earthquake emergency InformationService based on user demands.Technol. Earthq. Disaster Prev. 16 No. 1 pp. 211–219. doi:10.11899/zzfy20210122
Keywords: earthquake emergency information, user demand perception, utility evaluation model, decision-making, effective information products, earthquake disaster relief
Citation: Zhang Y, Zhou Y, Zhou Q, Zheng Y, Tang S and Yan J (2025) An evaluation model for the dissemination of earthquake emergency information and decision-making based on user demand. Front. Earth Sci. 13:1664477. doi: 10.3389/feart.2025.1664477
Received: 12 July 2025; Accepted: 11 August 2025;
Published: 10 September 2025.
Edited by:
Hans-Balder Havenith, University of Liège, BelgiumReviewed by:
Zarghaam Rizvi, GeoAnalysis Engineering GmbH, GermanyGang Cheng, North China Institute of Science and Technology, China
Copyright © 2025 Zhang, Zhou, Zhou, Zheng, Tang and Yan. This is an open-access article distributed under the terms of the Creative Commons Attribution License (CC BY). The use, distribution or reproduction in other forums is permitted, provided the original author(s) and the copyright owner(s) are credited and that the original publication in this journal is cited, in accordance with accepted academic practice. No use, distribution or reproduction is permitted which does not comply with these terms.
*Correspondence: Yan Zhou, NTc4MTY1MDQ0QHFxLmNvbQ==
†ORCID: Yi Zhang, orcid.org/0000-0002-0795-4451