 Tao Deng
 Jingrong He
 Jiwei Sun2
- 1Faculty of Land Resources Engineering, Kunming University of Science and Technology Kunming, Kunming, China
- 2Pangang Group Mining Company Limited Panzhihua, Panzhihua, Sichuan, China
The stability of open-pit slopes with weak interlayers is a critical issue in mining, as the design of bench parameters affects both slope safely and economic outcomes. Traditional optimization methods are often time-consuming and may not find global optimal solutions. This study presents an intelligent optimization approach combining machine learning (ML) and multi-objective optimization techniques. A numerical model simulating slopes with weak interlayers was developed and a dataset linking bench control parameters with slope stability and economic performance was created. Machine learning algorithms, including Support Vector Machines (SVM), were used to build predictive models to assess the impact of various parameter combinations on stability and economic performance. Optimization was carried out using the SVM-NSGAII and SVM-O algorithms. Results showed that SVM-NSGAII out performed SVM-BO, predicting a safety factor of 1.258 with a 3.8% error compared to 5.69%6 for SVM-BO, and achieving a relative economic error of 1.296, significantly lower than the 9.0%6 error of SVM-BO. A software system for bench parameter optimization was developed on the Python platform with an intuitive graphical user interface (GUI), significantly improving slope stability and mining profitability, offering scientific support for mine design in complex environments, and demonstrating both theoretical and practical applications.
1 Introduction
The concept of weak interlayers was introduced early in geological and geotechnical research. Scholars both in China and abroad generally define weak interlayers as rock strata of a certain thickness composed of relatively soft materials (Furuya et al., 1999; Ma et al., 2018). These interlayers exhibit low mechanical strength and are highly susceptible to softening upon water exposure, making them one of the most challenging issues in geotechnical engineering. Weak interlayers are a commonly encountered unfavorable geological feature, especially in regions with abundant soft rock formations. In the southwestern regions of China, such as Sichuan and Yunnan, iron ore resources are abundant, and weak interlayer-bearing (soft rock) formations are widely distributed (Lei and Sha, 2016; Li Y et al., 2019). These weak interlayers are primarily composed of chlorite mineral layers, in which mineral fragments are broken into flaky structures. Although weak interlayers constitute only a small portion of the rock mass, they often represent its most vulnerable sections, posing significant engineering hazards. The presence of weak interlayers plays a critical role in slope stability and is a major controlling factor in slope failure. Despite extensive research on the impact of weak interlayers on slope stability, significant bottlenecks remain in the optimization of slope bench parameters. Current studies mainly focus on optimizing overall slope angles, with limited attention given to detailed optimization of specific bench parameters. This results in optimization outcomes that are difficult to directly apply in practical engineering. Traditional optimization methods often aim for local rather than global optimal solutions, making it challenging to balance safety and economic efficiency. The Limit Equilibrium Method (LEM), commonly used for slope stability analysis, has limitations in global optimization, particularly in complex geological conditions involving weak interlayers, where it fails to accurately account for interactions between multiple potential sliding surfaces (Nanehkaran et al., 2023).
In recent years, with the continuous exploitation of open-pit mines, deep concave open-pit mining (Zhu et al., 2022; Xu et al., 2018; Cheng et al., 2011) has become a prevailing trend. The economic benefits of open-pit mining are primarily reflected in resource extraction volume, while the safety factor is directly related to production safety, personnel safety, and environmental protection, serving as a crucial guarantee for the sustainable development of mining operations. However, these two objectives often conflict in practical applications—pursuing higher economic benefits may increase safety risks, whereas overemphasizing safety could limit economic gains. In summary, during the excavation design of high and steep slopes in mines containing gently dipping weak interlayers, it is essential to determine bench parameters rationally to achieve a balance between economic benefits and safe production. The optimization of bench parameters is not only a safety issue but also an economic concern, making it a multi-objective decision-making and optimization problem (Zeng, 2020; Guan et al., 2018; Li et al., 2018). This process involves finding the optimal trade-off between multiple conflicting objectives, namely, economic benefits and safety. Slope stability analysis is a crucial step in the optimization of slope bench parameters and is key to establishing a training dataset for the safety factor and bench parameters. To ensure the accuracy of the slope safety factor, it is essential to guarantee the objectivity and accuracy of the rock mass mechanical parameters. Therefore, conducting a thorough investigation of the slope rock mass structure is of paramount importance (Lin et al., 2021; Lin et al., 2025).
Currently, the optimization of mine slopes is primarily conducted using two major categories of methods: deterministic analysis methods and uncertainty analysis methods. (1) Current Research on Deterministic Analysis Methods: Traditional deterministic approaches include empirical formula methods, limit equilibrium methods (Yan, 2023; Zhou et al., 2023; Liao, 2023), and numerical simulation methods (Shen et al., 2021; Li, 2023; Wang, 2021). These methods rely on predefined parameters and assumptions to evaluate slope stability and optimize bench parameters. (2) Current Research on Uncertainty Analysis Methods: certainty-based approaches introduce random variables into bench design, combining probabilistic analysis with numerical simulation. This enables a more comprehensive assessment of how variations in geological parameters affect slope stability and bench optimization, providing a more realistic representation of natural variability (Tiwari et al., 2025).
The application of machine learning in slope stability analysis emerged alongside the second wave of machine learning research. In the 1990s, Chinese scholar (Feng et al., 1995) applied neural network theory to train models using collected slope case studies, enabling the prediction of safety factors for newly designed slopes. (Li et al., 2024). comprehensively considered both economic efficiency and stability in slope optimization and proposed an intelligent slope morphology optimization method (LM-LSO) based on the Levenberg-Marquardt (LM) algorithm and Least-Squares Optimization (LSO) to achieve rapid and efficient optimization of slope morphology parameters (Karir et al., 2022). explored the use of various machine learning algorithms to predict slope stability based on physical and geometric parameters. Their results indicated that tree-based algorithms, such as Random Forest and Gradient Boosting, outperformed Support Vector Regression and gradient descent-based neural networks in predictive accuracy (Qiao, 2023) conducted a sensitivity analysis on the influence factors of bench control parameters in open-pit mine slope design. Using the limit equilibrium method, he calculated the stability coefficients of 108 different slope control parameter sets and defined a comprehensive benefit weight. This approach enabled a quantitative analysis of the impact of various slope control parameters on both slope stability and economic efficiency (Fang et al., 2021) applied the strength reduction method to compute slope stability coefficients for different slope control parameter schemes, generating sample data to construct an SR-BP neural network-based optimization model for slope control parameters. This model was used to predict slope stability under various optimized parameter schemes, providing valuable guidance for the preliminary design and optimization of mine slope control parameters (He et al., 2025). A new method is proposed that utilizes energy dissipation theory and the Bayesian Gaussian Mixture Model (BGMM) to intelligently interpret dissipated energy data. By incorporating the concept of “reference slope,” the method calculates the safety factor, avoiding the nonlinear limitations of traditional reduction methods, and provides a more accurate and reliable slope stability assessment (Foong and Moayedi, 2022). A combination of Equilibrium Optimization (EO) and Vortex Search Algorithm (VSA) with Multi-Layer Perceptron Neural Network (MLPNN) is proposed for optimizing the safety factor prediction of single-layer soil slopes. The results show that the hybrid model effectively reduces the root mean square error (RMSE) for both training and testing, with EO outperforming VSA, demonstrating higher accuracy and generalization ability (Yang et al., 2023). Based on 117 slope data points, the study optimizes machine learning model hyperparameters using a genetic algorithm and predicts slope stability with five algorithms, including Support Vector Machine and Random Forest. The results show that the Random Forest algorithm performs the best, with cohesion being the key factor influencing slope stability. The AUC values range from 0.824 to 0.964, confirming the effectiveness of the integrated technology in slope stability analysis and providing valuable references for future industrial engineering applications.
Although significant progress has been made in the optimization of open-pit slope bench parameters, current research still faces several key challenges: (1) Limitations of Quantitative Analysis: Existing studies primarily focus on optimizing the overall slope angle of open-pit mines based on elastoplastic theory and numerical analysis software. However, these studies often fail to provide specific bench parameters, such as bench width, bench height, and bench face angle, making it difficult to directly apply the optimization results to practical mining operations. (2) Lack of a Global Optimal Solution: Traditional research methods tend to seek a relatively optimal solution by comparing different design schemes rather than employing systematic scientific methods to achieve a truly global optimum. As a result, these approaches struggle to simultaneously balance both safety and economic efficiency in open-pit slope design, creating a bottleneck in the optimization of bench parameters.
With the rapid development of artificial intelligence, many researchers have introduced AI technologies into the field of geotechnical engineering (Ragam et al., 2024; Kurnaz et al., 2024; Erzin and Cetin, 2013; Lin et al., 2022) proposing slope stability prediction methods based on machine learning (ML) and optimization algorithms (Xia et al., 2024; Ali and Reza, 2021; Ghasemi et al., 2024; Yang et al., 2023; Lin et al., 2022). Leveraging its powerful data processing and pattern recognition capabilities, machine learning offers new approaches for the intelligent optimization of slope bench parameters in geological disaster prevention. This study constructs a training dataset linking safety factors, economic benefits, and bench parameters, and applies data analysis and machine learning techniques to conduct intelligent collaborative optimization based on a multi-objective optimization strategy. The research deeply investigates the conflict between geological hazard risk control and economic benefit maximization in open-pit mine slopes, providing significant practical value for disaster prevention and mitigation (Pham et al., 2021). Furthermore, the study supplements and improves intelligent optimization schemes for slope bench parameters in open-pit slopes containing weak interlayers, offering strong theoretical support and engineering guidance to enhance geological disaster prevention capabilities and ensure safe mining operations.
2 Slope engineering geological survey and rock mass mechanical parameter calculation
2.1 Overview of engineering geological conditions
Field investigations reveal that the slope is defined by primary and tectonic structural surfaces, weak interlayers, and fault fracture zones, as illustrated in Figure 1, which provides an overview of the study area’s geology. Primary structural surfaces result from magma intrusion and cooling, with diabase occurring in clusters within the slope’s rock mass. The weak interlayers are composed of chlorite mineral layers, where the minerals have fragmented into flaky formations. Some weak interlayers show significant openings, with minerals eroded by external forces, resulting in fractures of varying widths. Table 1 displays the distribution of these weak interlayers. Joint parameters are provided in Table 2, which shows considerable geometric variation, reflecting the area’s complex geological structure. Most joints are tight and filled with chlorite or calcareous minerals, contributing to their stability, while some rough, slightly open joints may exhibit higher permeability.
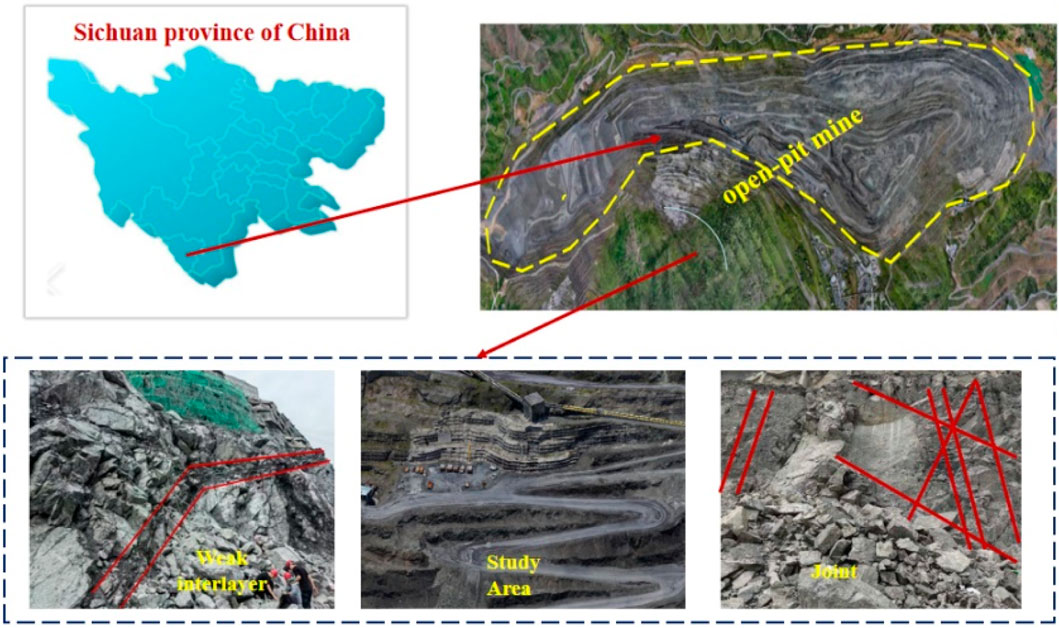
Figure 1. Schematic diagram of study area and geology condition.

Table 1. Distribution of weak interlayers.
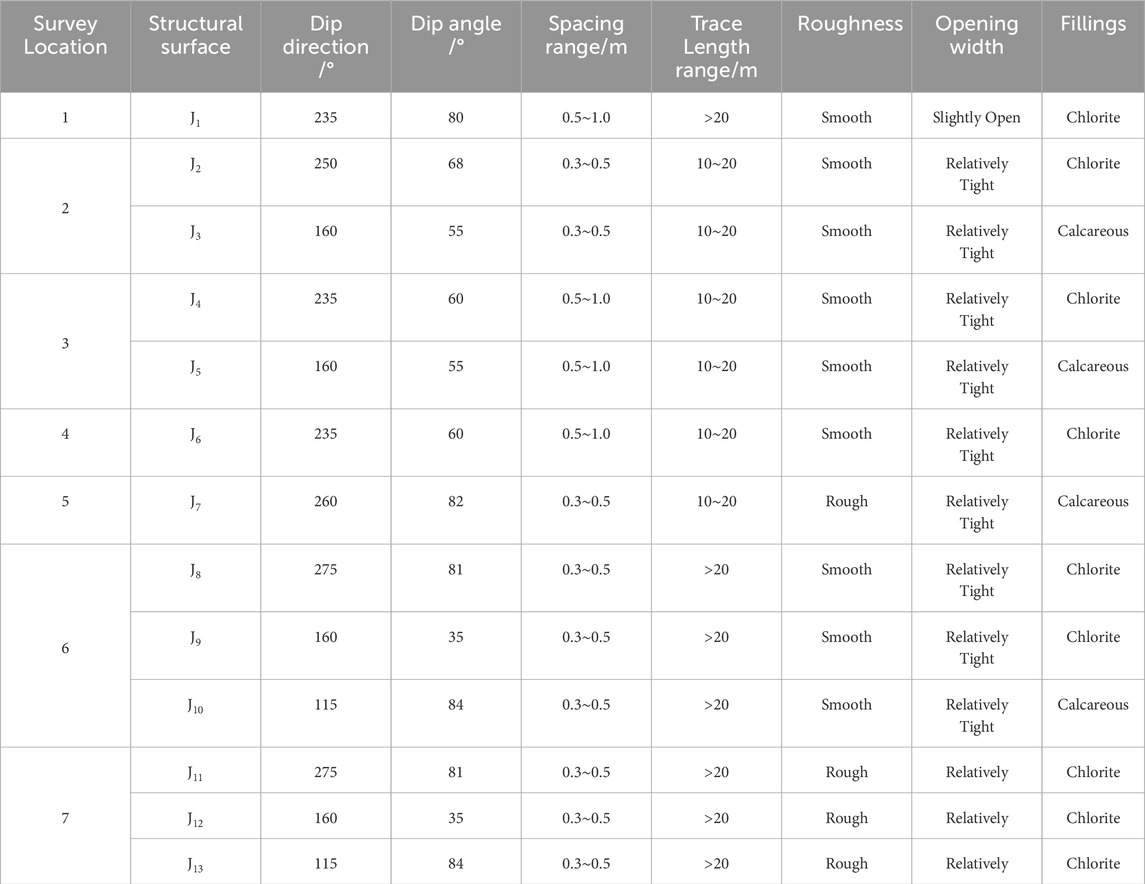
Table 2. Statistical table of Dominant structural surfaces in the study area.
2.2 Radar detection
2.2.1 Detection principle
Ground-penetrating radar (GPR) is a subsurface exploration method that uses high-frequency to microwave electromagnetic waves to detect reflections. The system works by emitting electromagnetic waves from a transmitter antenna directed towards the surrounding rock. The antenna is positioned on the rock’s surface, and as the waves propagate through the subsurface, they are reflected when encountering interfaces with varying electrical properties. The reflected waves are captured by the receiver antenna. The initial signal received from the transmitter to the receiver serves as the system’s time zero reference point. After processing the reflected signal, the depth of the reflection target is determined by halving the round-trip time and multiplying by the radar wave velocity in the corresponding medium. The characteristics of the reflection target, such as fractured rock masses, cavities, loose zones, weak interlayers, and cracks in unfavorable geological formations, are identified based on the intensity, shape, and variations of the reflected wave in both horizontal and vertical directions. The detection principle of geological radar is illustrated in Figure 2.
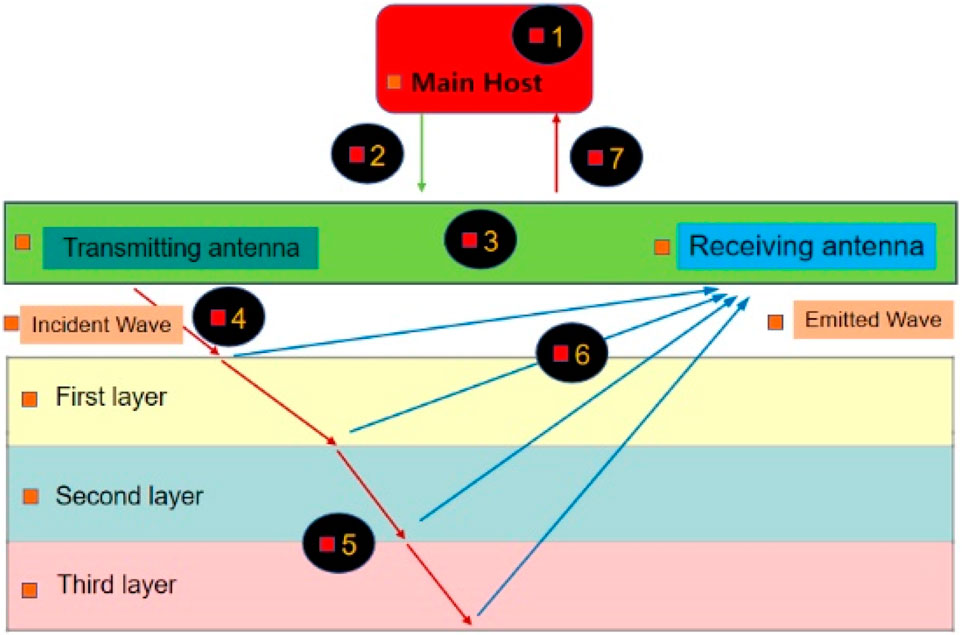
Figure 2. Flowchart of rock mechanics testing process.
2.2.2 Image interpretation
The Ground Penetrating Radar (GPR) provides critical input data for the 3DEC model, facilitating accurate simulation of slope stability. Through radar detection, structural information of the rock mass, such as fractures, joints, weak interlayers, and fault zones, can be obtained, which is essential for defining the mechanical properties in the 3DEC model. Additionally, GPR offers depth-related data, enabling precise determination of layer thickness, distribution, and the strength and stiffness of rock masses at different depths. Variations in the intensity and frequency of the reflected radar waves reveal the characteristics of weak interlayers and fracture zones, thereby aiding in the accurate representation of the rock mass heterogeneity in the 3DEC model. The collected data, along with field conditions, surrounding geological survey reports, and geological investigation data, are analyzed to provide a comprehensive interpretation of the geological conditions in the detected area, with particular focus on axial direction, amplitude, and frequency.
In this study, radar lines 1# and 2# were positioned on the safety platform of the open-pit slope. The combined results of the field geological survey and radar detection indicate the following: (1) The surrounding rock joints and fractures are generally well to moderately developed, and the rock mass exhibits a blocky structure; (2) At a depth of 30–35 m below the surface, significant variations in the frequency and amplitude of the reflected waves suggest poor rock integrity, well-developed joint fractures, and the presence of weak interlayers and fault zones. The field survey shows that these weak interlayers consist of chlorite mineral layers, where the minerals have fragmented into flaky structures. Some of these weak interlayers exhibit wide openings, and the minerals have been eroded by external forces, leading to the formation of fractures of varying widths. These observations are consistent with the findings from the geological radar survey. The detection results are presented in Figures 3a,b.
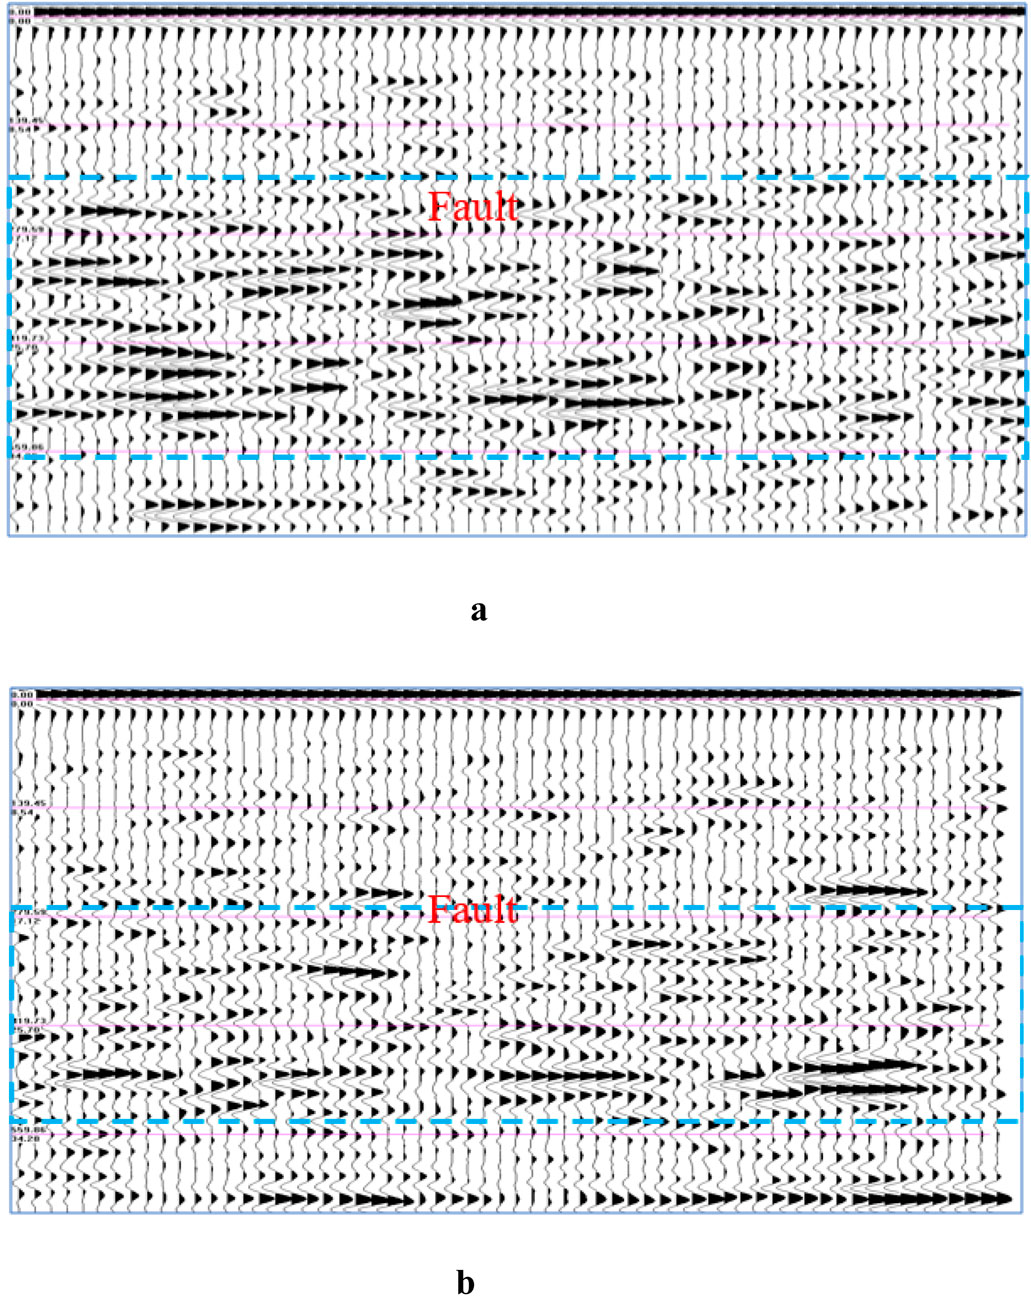
Figure 3. Slope radar detection Image. (a) Detection results of line 1#. (b) Detection results of line 2#.
2.3 Rock mass mechanical parameters
Field sampling of the mine slope was conducted, and rock mechanics tests were performed. The physical and mechanical parameters of the rock were obtained through laboratory tests. Based on the structural characteristics of the slope rock mass, the modified BQ value was determined. The rock mass mechanical parameters for each subdivision were then calculated based on the GSI and Hoek-Brown strength criteria. Figure 4 shows the flowchart for the laboratory rock. Similar to the effects of cyclic thermal loading on the stability of underground backfill, slope stability under varying step geometries also involves complex interactions between mechanical and environmental factors. For example, factors such as the slope geometry, bench height, and angle directly influence the mechanical response of the rock mass, while environmental factors such as temperature changes and precipitation may also affect the physical properties of the rock mass, further influencing the stability of the slope (Ahmad et al., 2025; Ahmad et al., 2021; Ahmad et al., 2019).
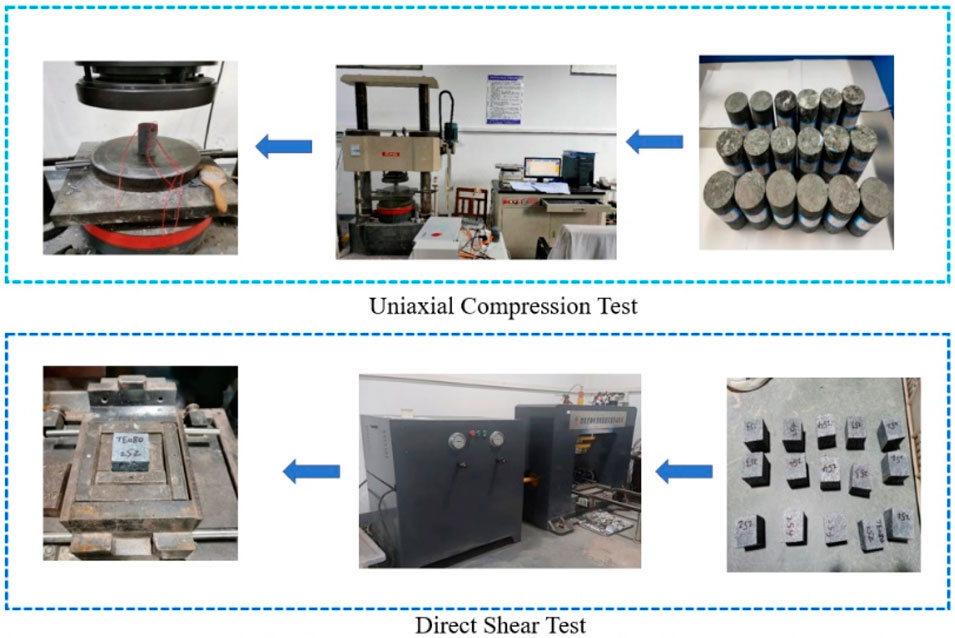
Figure 4. Flowchart of rock mechanics testing process.
2.3.1 Uniaxial compression test and test results
After determining the Geological Strength Index (GSI) value, rock mass mechanical parameters were analyzed based on the Hoek-Brown strength criterion. The final rock mass mechanical parameters for each zone are shown in Table 3. In the 3DEC calculation process, the rock mechanics parameters from Table 3 are selected as input variables for numerical calculations. These parameters, such as compressive strength and shear strength of the rock mass, are chosen based on field geological surveys and laboratory test data, accurately reflecting the physical and mechanical properties of the rock mass. This provides a reliable basis for subsequent slope stability analysis.
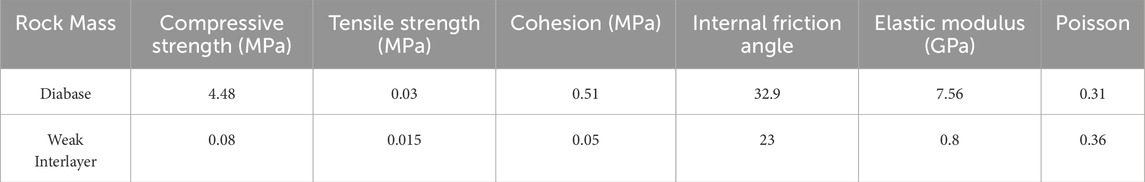
Table 3. Summary of slope rock mass mechanical parameters.
3 Intelligent optimization of slope bench parameters based on machine learning algorithms and multi-objective optimization methods
In open-pit mining, both economic benefits and slope safety are closely tied to the parameters of the slope benches. Any changes to these parameters directly impact both economic returns and safety. Although economic benefits are the primary objective, they must be balanced with safety considerations. Both goals must be achieved under certain conditions. To address this, a multi-objective optimization problem is formulated to maximize economic benefits while meeting safety constraints. This is solved through a combination of multi-objective optimization and machine learning methods for intelligent optimization of open-pit slope bench parameters.
3.1 Scheme design
In this study, the data preparation stage follows the principles of systematization and reproducibility, and a database system based on the collaborative optimization of numerical simulation and machine learning is constructed. Firstly, based on the open-pit mining engineering geological conditions and design specifications, key control parameters such as bench height (15–23 m), slope face angle (60°–75°), platform width (3–5 m), and cleaning platform (fixed value of 8 m) are selected. Using orthogonal experimental design, 100 sets of parameter combinations are generated, and the safety factor and economic benefits (calculated based on the ore quantity as the economic measure) of the slope under different bench parameter combinations are determined. This study uses the mined ore quantity and slope safety factor as supervisory indicators, i.e., target variables, and bench parameters (including bench width L, bench height H, and bench profile angle α) as feature variables. The bench parameter design scheme is shown in Table 4. The step parameters listed in Table 4 (including bench height, slope angle, and platform width) are selected as input variables for the 3DEC model. These parameters are chosen based on mining design requirements and geological conditions to ensure that the model can accurately simulate various scenarios encountered in actual mining operations. The results from the 3DEC calculations are subsequently used as input for a machine learning dataset in Python, facilitating further optimization of slope design and enhancing prediction accuracy. During the data processing phase, all input variables are standardized and normalized to ensure consistency and suitability for model training.
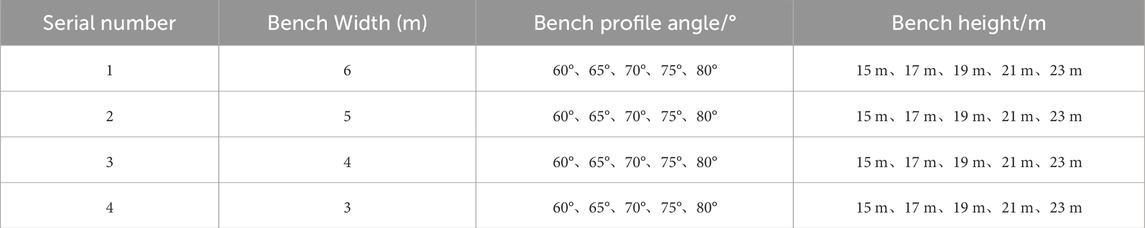
Table 4. Scheme design table.
3.2 Technical approach
1. Data Preparation–Constructing the Training Dataset
Based on the strength reduction method, numerical calculation models were developed using 3DEC software. According to the above step parameter schemes, a total of 100 numerical models were established. Each model calculates the slope safety factor under different step parameter combinations. For each of the 100 parameter combinations, the corresponding recoverable ore quantity under open-pit mining conditions was calculated, serving as the economic benefit value for each combination.
2. Developing Prediction Models Using Machine Learning
Two predictive models were constructed using machine learning algorithms:
Economic Benefit Prediction Model: Inputs the step parameters and outputs the corresponding economic benefit.
Safety Factor Prediction Model: Inputs the step parameters and outputs the corresponding safety factor.
3. Intelligent Optimization of Bench Parameters for Open-Pit Slopes Based on Machine Learning
1. Environment Construction
In machine learning algorithms, the environment defines how the agent interacts with the external world. In multi-objective optimization, environment construction is especially critical, requiring clear definitions of state, action, and reward functions:
State: Represents the current combination of bench parameters, e.g., [L, a, H]
Action: Refers to the agent’s adjustment to the bench parameters, such as increasing or decreasing L, a, or H; Reward Function: The reward should consider both economic benefit and safety factor. This can be achieved by integrating the two objectives into a single weighted reward function or designing separate reward functions for individual optimization.
2. Multi-Objective Optimization Implementation
Based on the trained economic benefit and safety factor prediction models, a combined approach of multi-objective optimization and machine learning algorithms is adopted to determine the optimal bench parameter combinations that maximize economic benefit while satisfying safety factor constraints.
3. Validation and Optimization
The optimization results from the machine learning algorithm are applied to practical engineering cases. To ensure the accuracy of the dual-objective optimization results for “economic benefit–safety,” the following evaluation procedure is adopted: “numerical simulation verification → economic validation → correlation analysis.” Feedback from real-world applications is continuously incorporated to refine algorithms and parameters, improving the accuracy and reliability of the optimization results.
a. Numerical Simulation Verification
A three-dimensional slope stability model is constructed in 3DEC using the optimized bench parameters (bench height H, slope angle a and platform width L) to calculate the safety factor.
b. Economic Validation
The economic benefit is recalculated based on the optimized bench parameters (H, a, L) to validate the predicted economic performance.
The technical roadmap of this study is illustrated in Figure 5.
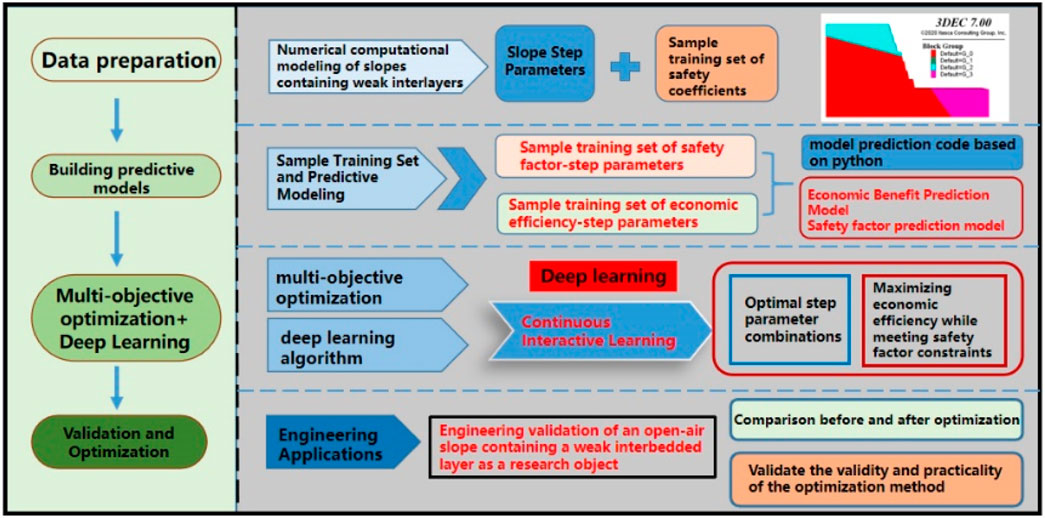
Figure 5. Technical Route of the research.
3.3 Construction of the economic benefit training dataset–Ore quantity calculation under different bench configurations
In practical engineering applications, the economic benefit of a mine primarily depends on the quantity of ore extracted. Therefore, in the mathematical model that links economic benefit to bench control parameters, it is assumed that, as long as the stability factor is greater than or equal to the design safety factor, the economic benefit is maximized when the ore extraction quantity is maximized. Given that mining depth is defined by mining rights, the maximum recoverable ore quantity within a cross-section can be easily determined. Figure 6a: Schematic of recoverable ore volume with a bench slope angle of 60°, bench height (H) of 15 m, and platform width (L) of 5 m. Figure 6b: Schematic of recoverable ore volume with a bench slope angle of 60°, bench height (H) of 15 m, and platform width (L) of 4 m Figure 6c: Schematic of recoverable ore volume with a bench slope angle of 60°, bench height (H) of 15 m, and platform width (L) of 3 m.
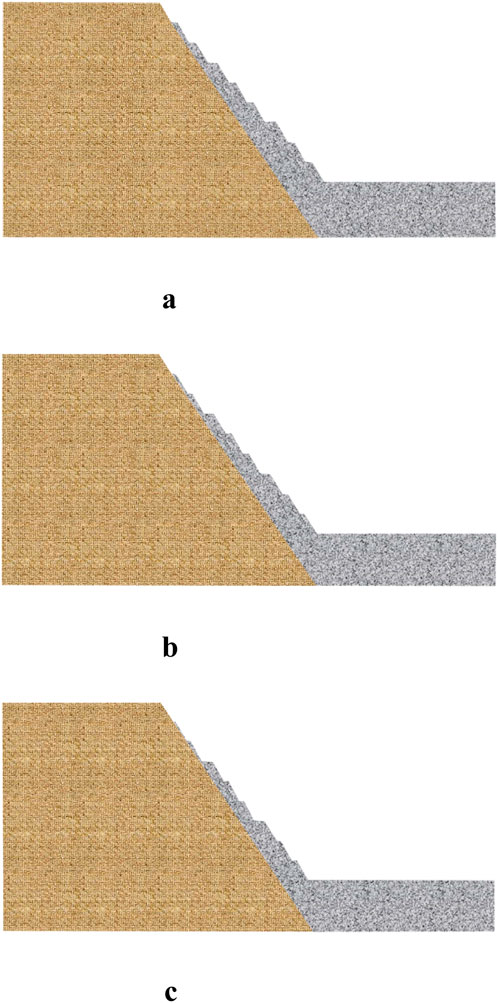
Figure 6. Schematic diagram of recoverable ore volume under different bench parameter combinations in open-pit mining. (a) a = 60°、H = 15 m、L = 5 m, Schematic Diagram of Recoverable Ore Volume. (b) a = 60°、H = 15 m、L = 4 m, Schematic Diagram of Recoverable Ore Volume. (c) a = 60°、H = 15 m、L = 3 m, Schematic Diagram of Recoverable Ore Volume.
3.4 Construction of the safety factor training dataset
Based on the bench design schemes presented in Table 4 and with reference to the geological cross-section of the mining area, bench cross-sectional diagrams of the open-pit mine were drawn. Figure 7 illustrates several examples of these bench con-figurations. Subsequently, numerical models were developed under different bench parameter combinations using the drawn cross-sections. A 3D mesh model was constructed in Rhino and imported into 3DEC for safety factor calculation.
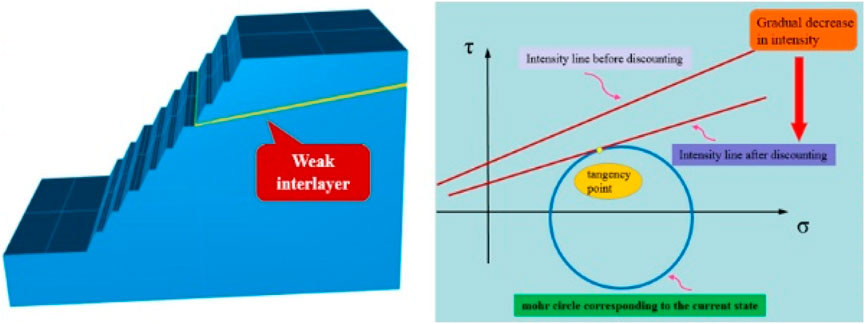
Figure 7. Diagram of the strength reduction method.
The calculated safety factor values under various bench parameter combinations were then compiled to form the training dataset for machine learning. This dataset was fed into the pre-defined machine learning model to train and develop a predictive model for the safety factor.
3.4.1 Introduction to 3DEC software
3DEC (3-Dimensional Distinct Element Code), developed by Itasca Consulting Group, Inc., is a three-dimensional numerical analysis software based on the Distinct Element Method (DEM). This program is specifically designed to simulate the mechanical behavior of discontinuous media and is equipped with an extensive library of material models.
During the model process, 3DEC can realistically represent the geometric characteristics of rock masses with structural planes in three-dimensional space. It offers distinct advantages in analysing rock mass deformation and failure that are governed by structural features. As a result, it has been widely applied in studies of the mechanical behavior of slopes, surrounding rock of underground excavations, and other jointed rock masses.
3DEC provides powerful and comprehensive pre-processing capabilities, including slope model construction, rock mass structural division, and structural plane net-work simulation. These features allow for a more accurate representation of the geo-metric characteristics of engineering slopes, making 3DEC an excellent tool for de-tailed investigations of three-dimensional stress responses in rock slopes. Lattice element-based modeling of cemented geomaterials provides further validation for using discontinuum-based tools, such as 3DEC, in simulating slope failure mechanisms with weak interlayers (Rizvi et al., 2020).
3.4.2 Principle of strength reduction method
The basic principle of the strength reduction method is to divide the strength parameters of the slope soil-rock mass, namely, cohesion c and internal friction angle φ, by a reduction factor F simultaneously, obtaining a new set of values. These reduced values are then used as the new parameters for the calculation. The reduced shear strength parameters are as follows Equations 1, 2:
As shown in Figure 7, the value of F when Intensity line after discounting is tangent to the Mohr’s stress circle is the slope safety factor required for the calculation.
3.4.3 Establishment of the 3DEC numerical calculation model
This calculation only presents a portion of the results. As shown in Figure 8, the schematic diagrams of the models with a slope angle of 60°, bench heights of 15 m and 17 m, and safety platform widths of 5 m, 4 m, and 3 m, respectively.
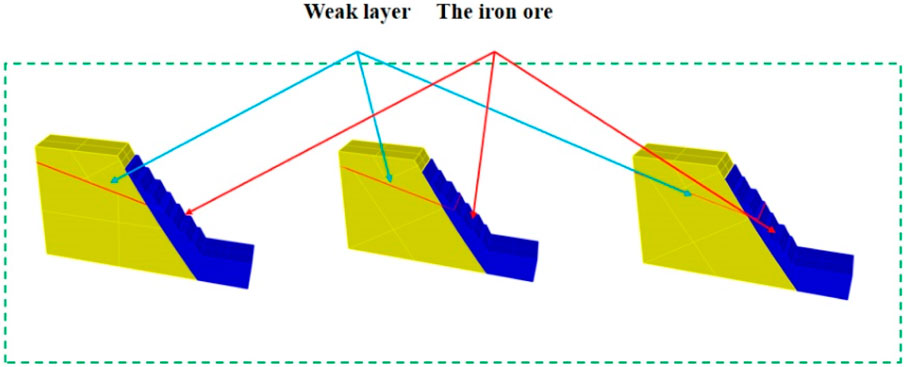
Figure 8. 3D mesh model.
3.4.4 Calculation of safety factor
As shown in Figure 9a, the slope safety factor varies with different bench widths and heights. Specifically, Figure 9a presents the safety factor for a slope with a 60° angle, a bench height of 15 m, and a bench width of 5 m. Figure 9b shows the safety factor for the same slope angle and height but with a bench width of 4 m, while Figure 9c illustrates the safety factor for a bench width of 3 m. Figures 9d–f correspond to a slope with a height of 17 m and bench widths of 5 m, 4 m, and 3 m, respectively. According to the safety factor results in Table 5, as the bench width decreases, the safety factor gradually declines. Although increasing the bench height slightly reduces the safety factor, the change is minimal, suggesting that higher benches still maintain relatively good stability.
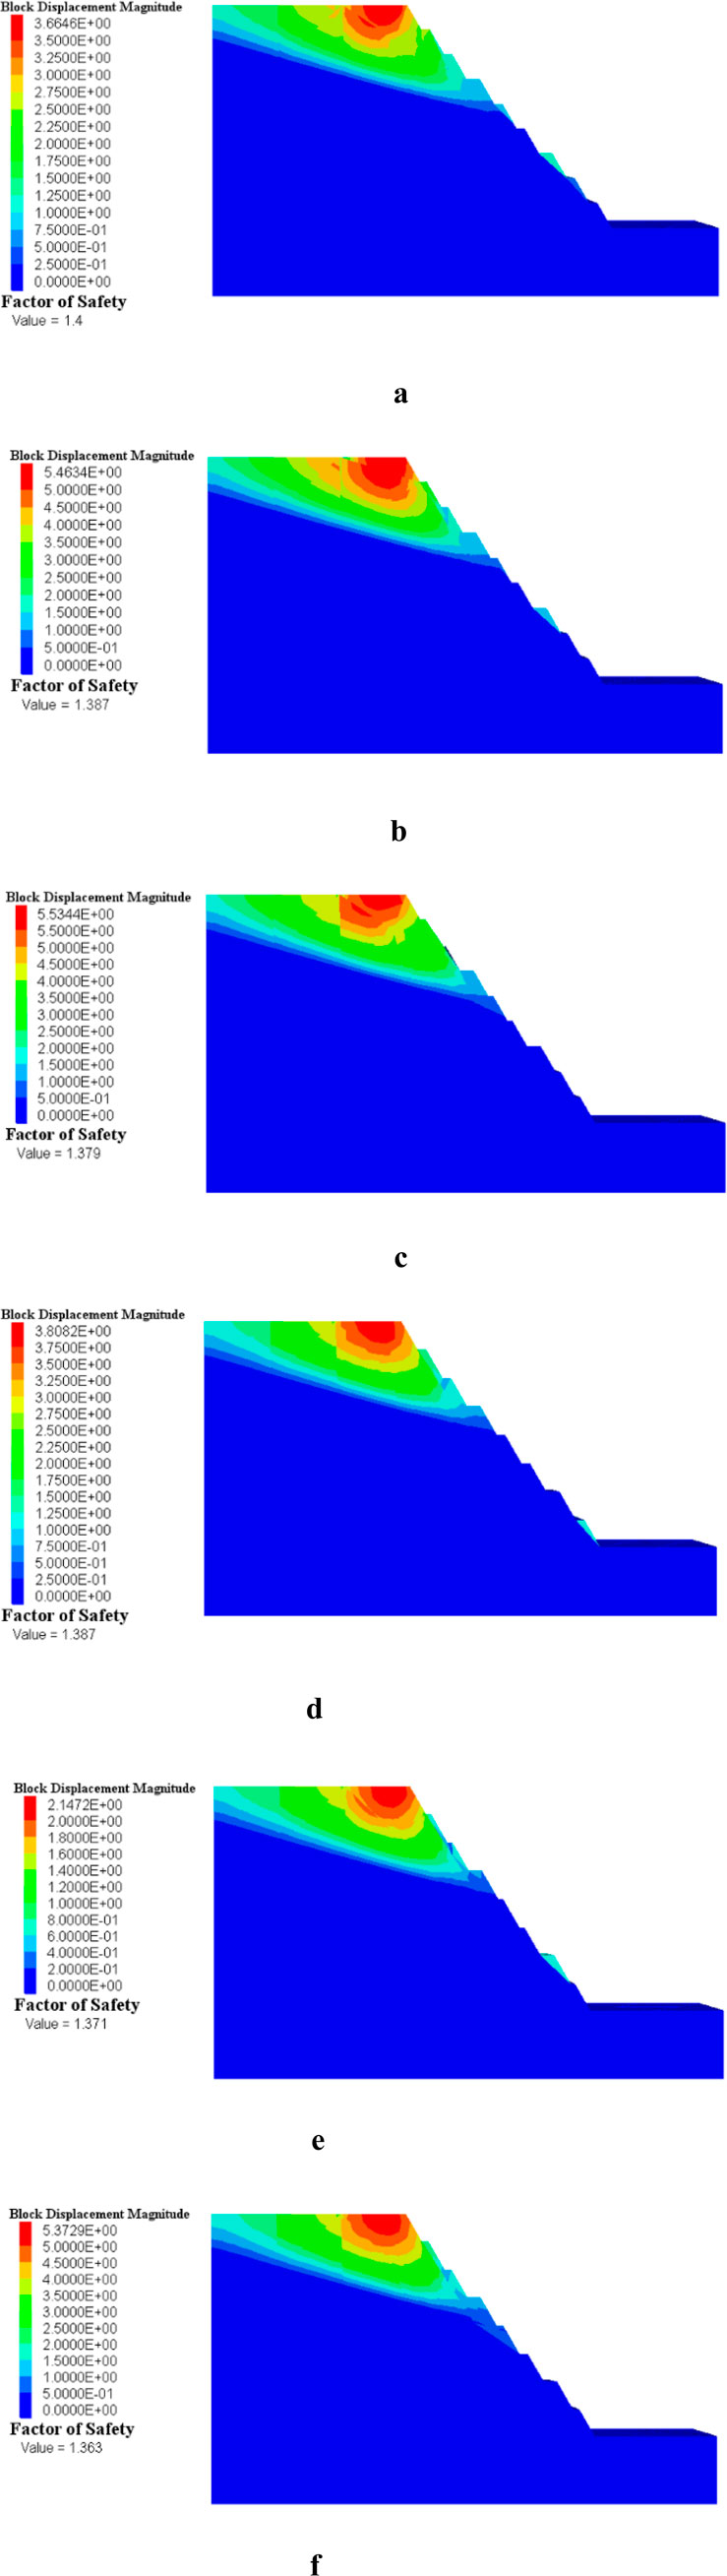
Figure 9. Safety Factor and Maximum Shear Strain Contour Map for Scheme 1. (a) The safety factor of the slope with a = 60°,H = 15 m,L = 5 m. (b) The safety factor of the slope with a = 60°,H = 15 m,L = 4 m. (c) The safety factor of the slope with a = 60°,H = 15 m,L = 3 m. (d) The safety factor of the slope with a = 60°,H = 17 m,L = 5 m. (e) The safety factor of the slope with a = 60°、H = 17 m,L = 4 m. (f) The safety factor of the slope with a = 60°,H = 17 m,L = 3 m.
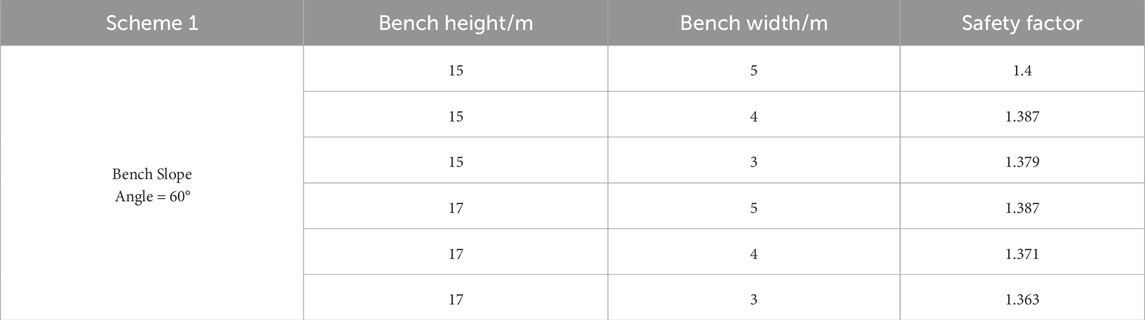
Table 5. Safety factor calculation results for scheme 1.
3.5 Sample training set for slope safety factor, economic benefits, and bench parameters
Once all the schemes have been calculated, they are organized into a table to serve as input for model training data. A portion of the data is presented in Table 6.
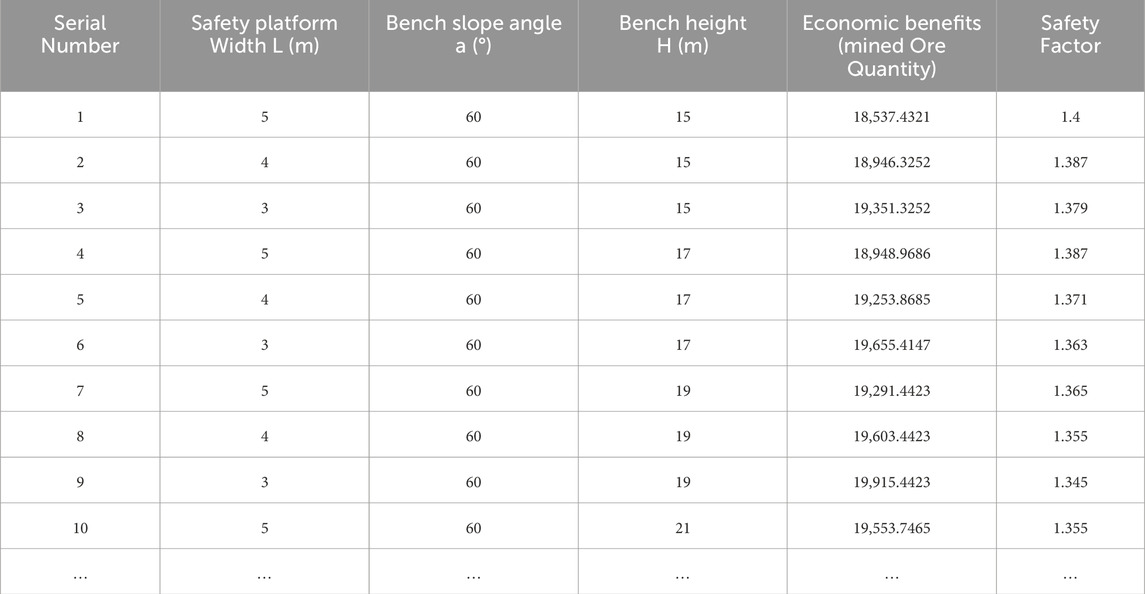
Table 6. Sample training set for economic benefits, safety factor, and bench parameters.
4 Intelligent optimization of open-pit mine bench parameters based on multi-objective optimization and machine learning methods
4.1 Algorithm introduction
4.1.1 SVM algorithm
Support Vector Machine (SVM) is a widely used machine learning algorithm. Its main principle is to construct a decision surface—a classification hyperplane—that maximizes the separation boundary between positive and negative examples. There-fore, the SVM algorithm exhibits excellent generalization performance in classification problems. The algorithm’s principles and system structure are shown in Figures 10, 11.
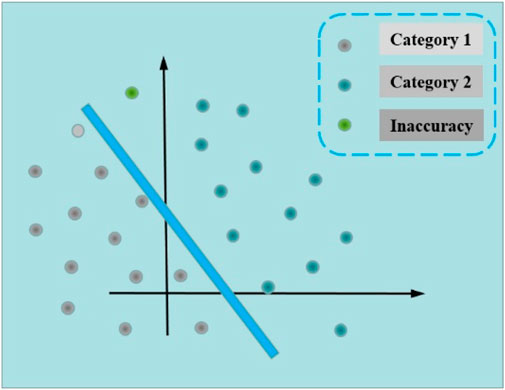
Figure 10. Svm algorithm principle.
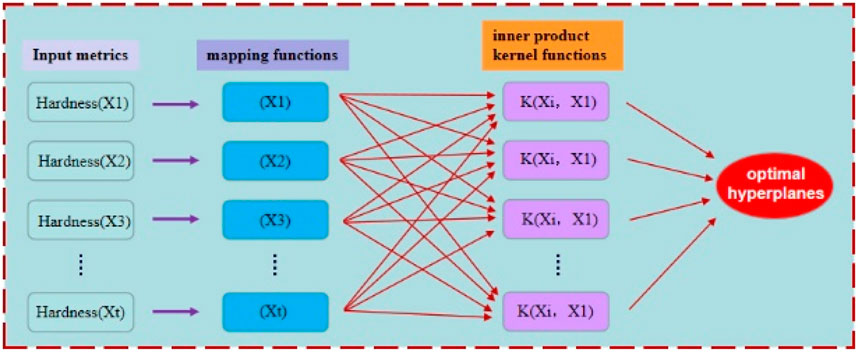
Figure 11. System structure of the SVM algorithm.
If the training set T of the SVM is given in the following form are as follows Equations 3–6:
In the equation:
Select an appropriate kernel function K (without loss of generality, we choose the Radial Basis Function (RBF) as the kernel) and parameter C to construct the optimization problem, as shown below.
In the equation, α represents the Lagrange multiplier.
Thus, the optimal solution α=(α1,α2,…,αl)T can be obtained. Select a positive component 0<αl < C to calculate the threshold are as follows Equations 7, 8.
The final decision function can be constructed as follows:
Overall, the SVM algorithm has the following advantages: it is well-structured according to the framework of Vapnik-Chervonenkis generalization theory; it possesses good robustness; and it can be applied to a wide range of functions.
When using the machine learning SVM algorithm for model training, the penalty coefficient ccc and the kernel function parameter g have a significant impact on the model’s accuracy. The penalty coefficient c represents the tolerance for errors. A larger c indicates a smaller tolerance for errors, which may lead to overfitting, while a smaller c may lead to underfitting. On the other hand, both excessively large and small values of c can weaken the model’s generalization ability. The kernel function parameter g affects the number of support vectors: as g increases, the number of support vectors decreases, and as g decreases, the number of support vectors increases. However, in practical applications of the SVM algorithm, the parameters c and g are often set based on empirical experience or system default values, lacking theoretical foundation, and are not necessarily the optimal solution for a specific problem.
4.1.2 Bayesian optimization
Bayesian Optimization is a global optimization method based on Bayes' theorem and Gaussian Processes (GP), primarily used to optimize black-box functions, i.e., functions that do not have an analytical form, are computationally expensive, and are noisy. In general, Bayesian Optimization allows us to find the best solution with fewer trials in a smarter way, making it particularly suitable for problems where the “trial-and-error cost” is high.
Problem Definition:
Suppose we need to optimize an unknown objective function is as follows Equation 9:
Here,
The goal is to find the optimal solution are as follows Equations 10, 11:
or
Since
Bayes Theorem.
The core idea of Bayesian Optimization is to use existing observational data, combined with Bayes' Theorem, to update the estimation of the objective function is as follows Equation 12:
Where:
The core idea of Bayesian Optimization is to continuously update the posterior distribution of the objective function after each sampling, and then use the posterior distribution to select the next optimal sampling point.
Gaussian Process (GP) for Modeling the Objective Function.
Since the objective function
Definition of Gaussian Process.
The Gaussian process is a distribution over functions, meaning that for any set of input points
Commonly used kernel functions include the RBF kernel (Radial Basis Function kernel), Matern kernel, polynomial kernel, and so on. The definition of the RBF kernel is as follows Equation 16:
Where:
Prediction with Gaussian Processes
Given
For the new point
The predicted distribution at
the new point
This gives the posterior distribution of
Acquisition function.
The acquisition function (AF) is used to determine the next sampling point, aiming to efficiently explore the optimal solution while minimizing the number of trials.
Common acquisition functions include:
Expected Improvement (EI) is as follows Equation 22.
Probability of Improvement, PI is as follows Equation 23
Where
Upper Confidence Bound, UCB is as follows Equation 24.
Where
The next step selects the point that maximizes the acquisition function is as follows Equation 25.
4.1.3 NSGA-II algorithm
NSGA-II is a genetic algorithm-based multi-objective optimization method introduced by Deb et al., in 2002. It is designed to solve multi-objective optimization problems (MOPs) and can simultaneously optimize multiple conflicting objectives, generating a set of uniformly distributed Pareto optimal solutions. The NSGA-II algorithm mainly involves steps such as nondominated sorting, crowding distance calculation, selection, crossover, and mutation.
1. Definition of Multi-Objective Optimization Problem is as follows Equation 26
where
2. Non-dominated Sorting
In NSGA-II, individuals are ranked in layers based on the non-dominance relationship. For a given solution a and b, the dominance relationship is defined as follows Equation 27:
and there exists at least 1 m such that
In the non-dominated sorting process, all individuals that are not dominated by any other solution form the first front
After removing
This process is iteratively repeated until all individuals are assigned to a specific level or front.
3. Crowding Distance Calculation
To improve the uniformity of the Pareto solutions' distribution, NSGA-II introduces the crowding distance (Crowding Distance) metrics CCC and DDD to evaluate the sparsity of an individual’s neighborhood.
For the sorted individual iii, its crowding distance in the m objective direction is calculated is as follows Equation 30:
The total crowding distance calculation is as follows Equation 31:
The crowding distance of boundary solutions is set to infinity is as follows Equation 32.
4. Selection mechanism
NSGA-II uses a tournament selection based on non-domination rank and crowding distance is as follows Equation 33.
The individual with the lower level is given priority; if the levels are the same, the individual with higher congestion is chosen.
5. Crossover and Mutation Operations
Simulated Binary Crossover:
Crossover between parent individuals
Where,
Polynomial Mutation are as follows Equations 36, 37
6. Population Update Mechanism
1. Merging Parent
2. Perform Non-Dominated Sorting
Perform fast non-dominated sorting on
Perform non-dominated sorting on
3. Select the top N individuals is as follows Equation 40
If a certain front Fk cannot fully fill
4.2 Model training and testing
1. Convergence Analysis
As shown in Figure 12a, the Bayesian optimization convergence plot for SVM-BOA illustrates the sampling points. In an ideal Bayesian optimization plot, the average test score should initially increase or decrease quickly, followed by a gradual reduction in variation, eventually stabilizing in the later stages. Simultaneously, the confidence interval of the surrogate model should narrow significantly in the optimal region, indicating that the optimizer has thoroughly explored the high-potential parameter space and identified the optimal solution. If the score stagnates or fluctuates for an extended period, it may suggest entrapment in a local optimum or high noise in the objective function, requiring an increase in the number of iterations. As shown in the figure, SVM-BO stabilizes at the 23rd iteration.
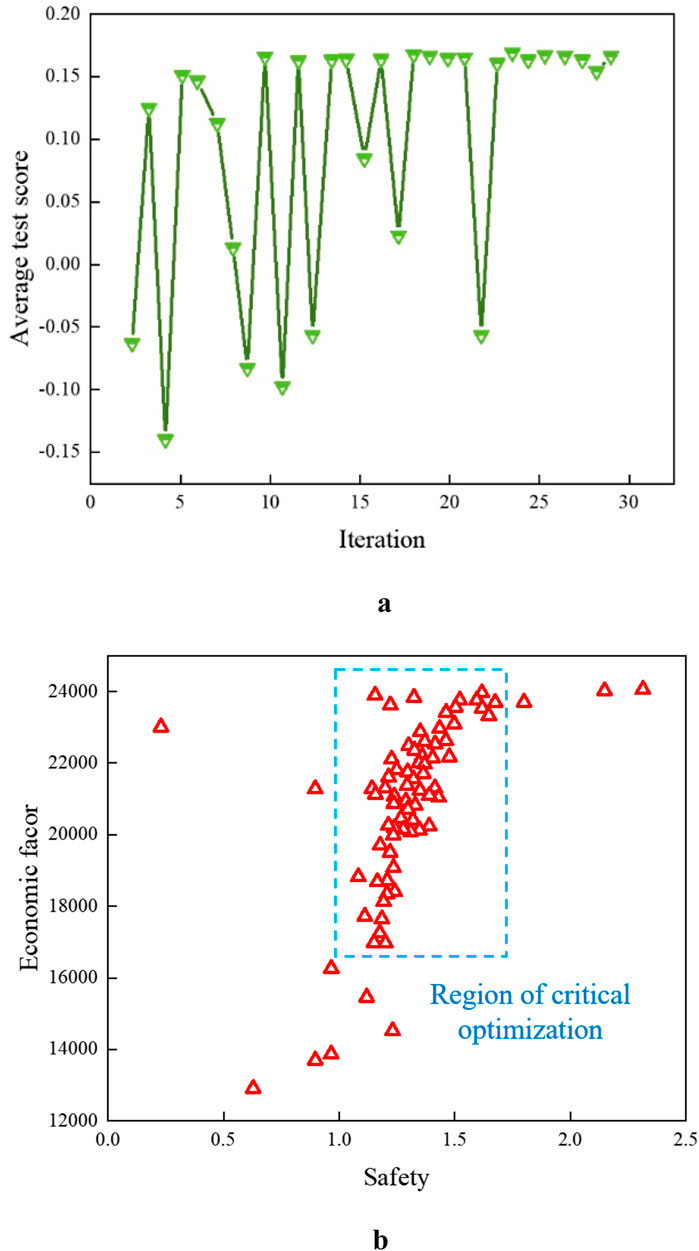
Figure 12. Convergence diagram of the algorithm. (a) Bayesian optimization sampling point convergence plot (b).
Additionally, analysis based on the NSGA-II algorithm shows that the data points in Figure 12b represent the corresponding values of the safety factor and economic efficiency under different parameter combinations. Most of the points are concentrated in the range of safety factors from 0.5 to 1.5 and economic efficiency from 20,000 to 22,500, indicating that economic efficiency fluctuates significantly when the safety factor is relatively low. As the safety factor approaches 1.3, economic efficiency tends to increase, while a safety factor below one results in a decline in economic efficiency. This reflects the diminishing marginal return effect when the safety factor is too low. These data points form the Pareto front of the bi-objective optimization involving safety and economic efficiency, highlighting the trade-off: improving one objective often comes at the expense of the other. The figure clearly illustrates the balance between the two objectives and provides essential guidance for selecting optimal parameters during the optimization process.
2. Algorithm Validation
The training was conducted using sample datasets with SVM-NSGAⅡ and SVM-BO. Common evaluation metrics include Mean Squared Error (MSE), the coefficient of determination (R2), and Mean Absolute Percentage Error (MAPE). Root Mean Squared Error (RMSE) reflects the expected value of the squared model error. The R2 value ranges from [0, 1], with values closer to one indicating better alignment between predicted and observed values, thereby reflecting superior model fitting performance. Conversely, a lower R2 value suggests poorer prediction accuracy. A smaller MAPE indicates higher prediction accuracy, while a lower Mean Absolute Error (MAE) implies smaller prediction errors, indicating that the predicted results are closer to the true values.
Figures 13a,b display the R2 plots for SVM-NSGAⅡ, while Figures 13c,d show the R2 plots for SVM-BO. Combining these with the data presented in Table 7, it can be concluded that the SVM-NSGAⅡ algorithm demonstrates superior performance.
The formulas for calculating the error are given in Equations 41–44.
3. Sensitivity Analysis
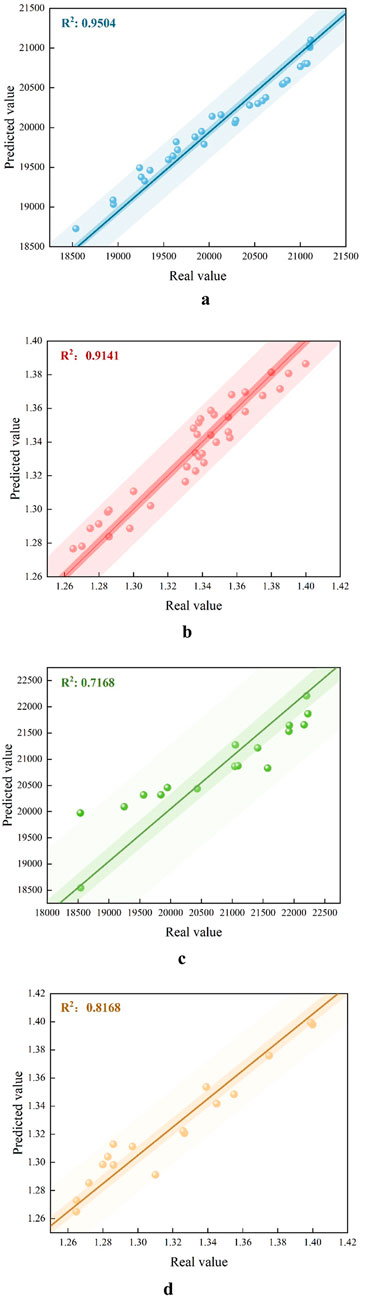
Figure 13. Algorithm Fitting Degree Diagram. (a) Schematic diagram of the SVM-NSGAⅡ algorithm for economic indicator R2. (b) Schematic diagram of the SVM-NSGAⅡ algorithm for safety indicator R2. (c) Schematic diagram of the SVM-BO algorithm for economic indicator R2. (d) Schematic diagram of the SVM-BO algorithm for safety indicator R2.
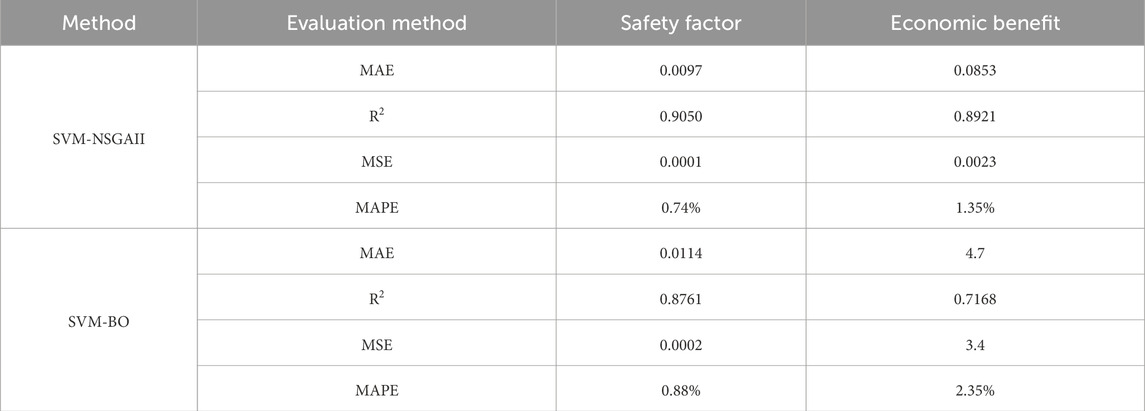
Table 7. Algorithm accuracy evaluation table.
Figure 14a: Heatmap of Economic Efficiency (fixed l-h, varying a), Figure 14b: heatmap of Safety Factor (fixed l-h, varying a), Figure 14c: heatmap of Economic Efficiency (fixed a-h, varying l), Figure 14d: heatmap of Safety Factor (fixed a-h, varying l), Figure 14e: heatmap of Economic Efficiency (fixed a-l, varying h), Figure 14f: heatmap of Safety Factor (fixed a-l, varying h).The six heatmaps clearly illustrate the trade-off between economic efficiency and safety factor, influenced by the combined effects of production scale (h), resource allocation (l), and input cost (a). Economic efficiency generally increases at the expense of safety. Among the three parameters, resource allocation (l) has the most significant impact: when l = 5, efficiency peaks at 22,856, but the safety factor drops sharply to 1.253, indicating a substantial risk. Input cost (a) follows as the second most influential factor: at a = 80, efficiency reaches 22,403, while the safety factor decreases by approximately 6%. Production scale (h) exerts the weakest influence: when h = 23, efficiency increases by only 4%, and the safety factor decreases by about 3%.
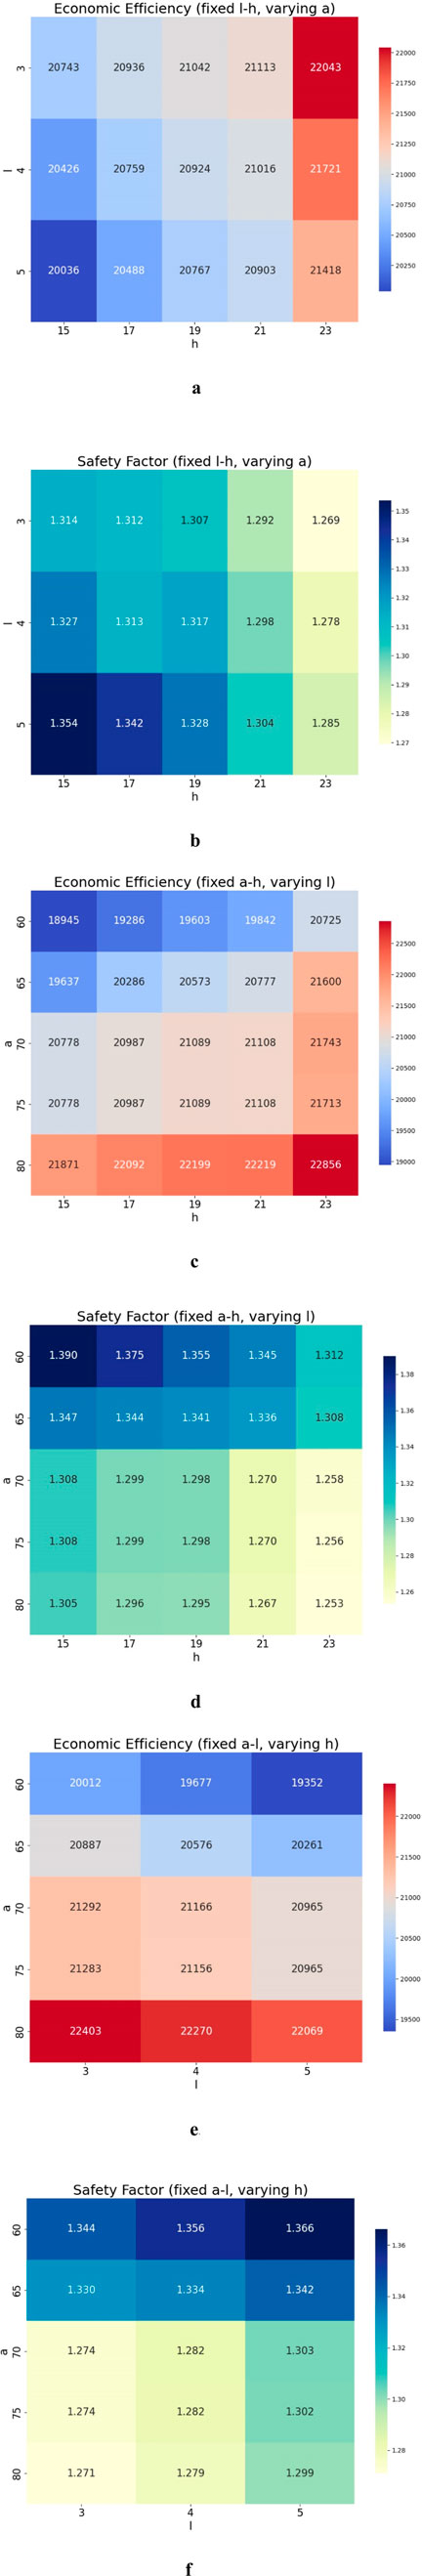
Figure 14. Sensitivity Analysis Plot of Economic Benefits, Safety Factor, and Step Parameters for Open-Pit Slopes. (a) Economic Efficiency (fixed l-h, varying a). (b) Safety Factor (fixed I-h, varying a). (c) Economic Efficiency (fixed a-h, varying l). (d) Safety Factor (fixed a-h, varying l). (e) Economic Efficiency (fixed a-l, varying h). (f) Safety Factor (fixed a-l, varying h).
In general, high-efficiency combinations (e.g., l = 5, a = 80, h = 23) deliver optimal performance but fall short of meeting safety requirements, whereas high-safety configurations (e.g., l = 3, a = 60, h = 15) maintain safety factors above 1.34, but efficiency drops to around 19,000. Thus, parameter selection should be aligned with project priorities: for safety-first scenarios, it is recommended that l ≤ 4, a ≤70, and h ≤ 19; for maximum efficiency, l = 5, a ≥75, and h ≥ 21 are preferred; and for a balanced approach, a = 70, h = 19, and l = 4 offer a reasonable trade-off (efficiency: 21,000; safety factor: 1.298). Geometrical configurations have a significant impact on failure behavior, particularly in sensitivity to interfacial shear zones, as observed in both tunnel stability and bench design (Alsabhan et al., 2021).
4. Comparison and Analysis of Actual and Predicted Values
In the above prediction analysis, this study trains the data using the SVM-NSGAII and SVM-BO algorithms and compares the actual and predicted values through curve plots. As shown in Figure 15a, the comparison of real and predicted safety factor values using SVM-NSGAII is presented; Figure 15b displays the comparison of real and predicted economic benefit values using SVM-NSGAII; Figure 15c shows the comparison of real and predicted safety factor values using SVM-BO; and Figure 15d illustrates the comparison of real and predicted economic benefit values using SVM-BO. The comparison of the actual and predicted values for each algorithm reveals that SVM-NSGAII exhibits lower dispersion, whereas SVM-BO demonstrates higher dispersion. The analysis indicates that the SVM-NSGAII algorithm achieves higher accuracy in multi-objective optimization compared to the SVM-BO algorithm, showcasing its superior predictive performance.
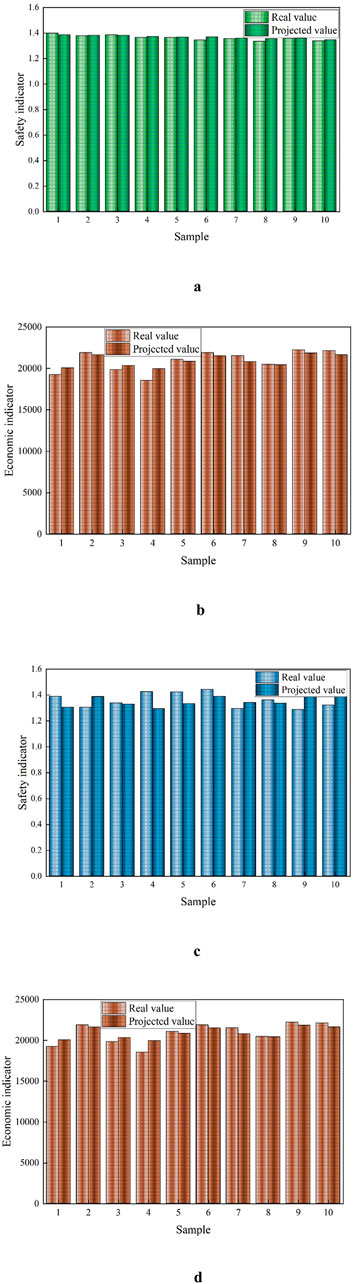
Figure 15. Comparison of Actual Value Labels and Predicted Values for Slope Step Parameter Optimization under Two Algorithms. (a) Comparison of real and predicted safety factor values using SVM-NSGAII. (b) Comparison of real and predicted economic benefit values using SVM-NSGAII. (c) Comparison of real and predicted safety factor values using SVM-BO. (d) Comparison of real and predicted economic benefit values using SVM-BO.
AI frameworks have proven effective in subsurface degradation analysis, and these methods can be extended to predict slope damage evolution in high-risk mining environments (Ahmad et al., 2025).
4.3 Optimization results
As shown in Table 8, the optimization objective is to maximize economic benefits while ensuring that the safety factor is greater than 1.25. The final optimized step parameters are: step width of 3 m, step face angle of 80°, and step height of 17.7 m. Under these conditions, the economic benefit is 20,850.78, and the safety factor is 1.288.
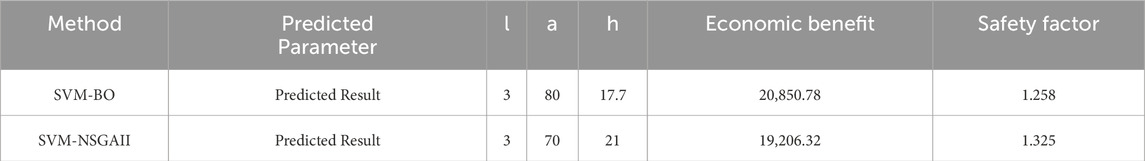
Table 8. Algorithm optimization results.
4.4 Result validation
To validate the algorithm’s predicted values against the actual values, the relative error is used to calculate the error rate. In the calculation process, if the error is less than 5%, the result is considered reasonable; otherwise, if the error exceeds 5%, the result is considered to have a significant error are as follows Equations 45, 46.
4.4.1 Safety factor validation
The safety factor obtained by model the predicted slope step parameters using 3DEC is shown in the As shown in Figure 16a the result calculated by SVM-NSGAII is 1.211, Figure 16b, the result obtained from the SVM-BO predicted parameters is 1.254. In Table 9 The error for SVM-NSGAII is 4.0%, and the error for SVM-BO is 6.0%. By comparing the results with machine learning metrics such as MAE, MSE, MAPE, and R2, it is evident that the optimization result obtained using SVM-NSGAII is more accurate.
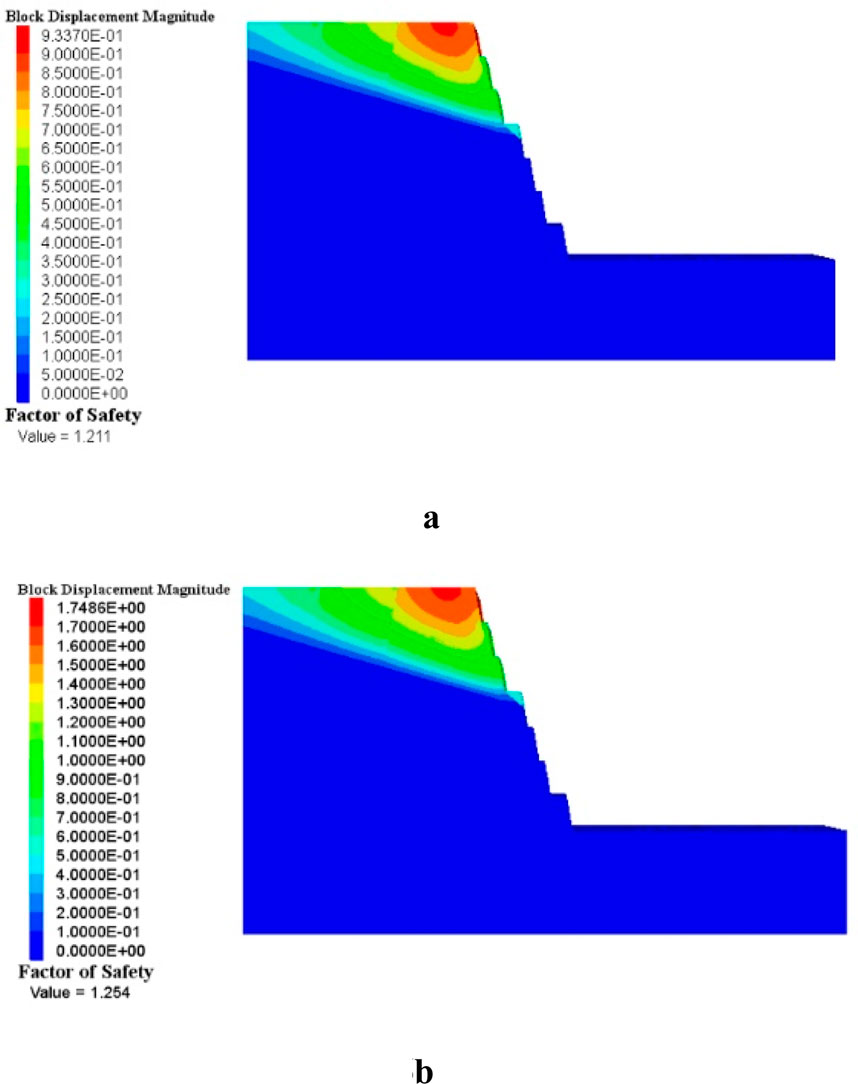
Figure 16. Safety factor Contour map. (a) Safety factor of slope step parameters based on SVM-NSGAII algorithm. (b) Safety factor of slope step parameters based on SVM-BO algorithm.

Table 9. Error between actual and predicted safety indicator values.
4.4.2 Economic benefit validation
Based on the relative error verification calculation shown in Table 10, the error rate for the SVM-NSGAII algorithm is 3.8%, while the error rate for the SVM-BO algorithm is 5.6%. From the analysis, it can be concluded that using SVM-NSGAII is more accurate.

Table 10. Error between actual and predicted economic benefit values.
4.5 Optimiation system for slope step parameters in open pit mines
As shown in Figure 17, the Slope Step Parameter Prediction System is an intelligent system based on multi-objective optimization algorithms and machine learning technologies, aimed at optimizing key parameters in slope design, such as step width, slope angle, and step height, to achieve the optimal balance between safety and economic efficiency. The system utilizes Support Vector Regression (SVR) models, trained with actual engineering data, to predict safety factors and economic benefits under various design parameters.
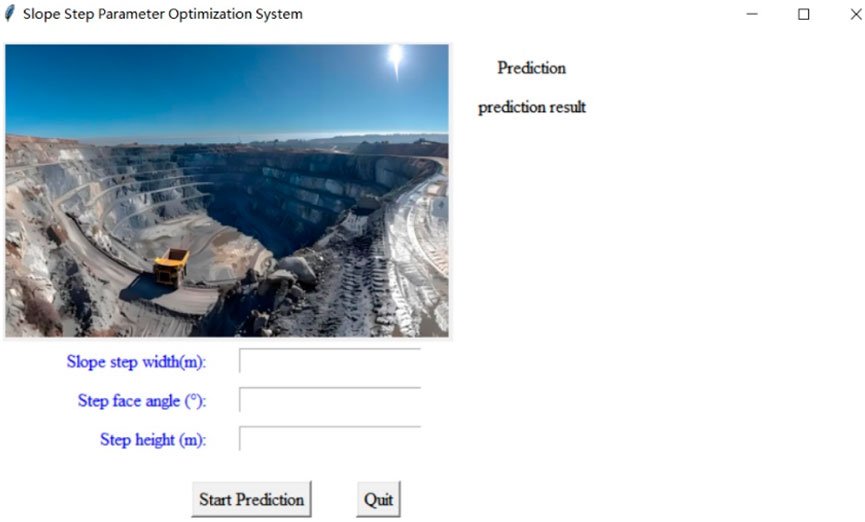
Figure 17. Open-pit mine step parameter optimization system.
By inputting different slope design parameters (such as step width, slope angle, and step height), the system can intelligently predict the corresponding safety and economic values. Advanced optimization algorithms, such as NSGA-II, are employed to automatically adjust the slope design parameters while ensuring safety constraints (e.g., safety factor >1.2), thereby maximizing economic benefits. This system not only enhances the scientific and rational nature of slope design but also provides decision support for engineers, enabling them to optimize resource utilization while ensuring safety and reducing project costs. Through visual analysis and optimized result displays, users can gain a more intuitive understanding of how adjustments to design parameters impact safety and economy, facilitating more accurate decision-making.
5 Conclusion
This study integrates radar and high-density electrical methods to conduct detailed surveys of surrounding rocks on slopes. By leveraging advanced equipment and techniques, the research analyzes the relationship between slope stability and economic benefits under various step parameter combinations. The novel contributions of the study are as follows:
1. Surveying Methods and Equipment: The use of radar and high-density electrical surveys enabled a comprehensive mapping of weak interlayers, fracture zones, and broken zones on the slope. These methods provided high-precision geological data, which significantly enhanced the accuracy of numerical simulations and slope stability analysis.
2. Impact of Weak Interlayers on Slope Stability: The study highlights the critical role of weak interlayers, particularly gently inclined ones, in controlling slope stability. It was found that weak interlayers are more likely to form potential sliding surfaces, which has a significant impact on high slope stability in complex geological conditions.
3. Prediction Model for Safety Factor and Economic Benefit: A novel prediction model using the Support Vector Machine (SVM) algorithm was developed to link safety factors and economic benefits with step parameters. This model accurately predicted safety and economic performance under various design conditions, offering a reliable tool for optimization.
4. Optimization of Step Parameter Combinations: The combination of machine learning and multi-objective optimization allowed for the intelligent optimization of slope step parameters. The SVM-NSGA-II algorithm was particularly effective in addressing high-dimensional, nonlinear optimization problems, achieving a balance between slope stability and economic benefits. The optimized step parameters not only met safety requirements but also enhanced economic performance in open-pit mining operations.
5. Engineering Application and Validation: Numerical simulations validated the optimized step parameter combinations, confirming that the design effectively balanced slope stability and economic benefits. This provides a scientifically rigorous and practical method for slope design, particularly in complex geological settings.
6. Innovation and Practical Significance: This research introduces a novel approach by combining machine learning and multi-objective optimization, filling a gap in existing slope optimization methods, especially under complex geological conditions. The findings offer significant support for improving the safety and economic performance of open-pit mining operations, providing new insights and technical references for slope design in challenging geological environments.
Data availability statement
The raw data supporting the conclusions of this article will be made available by the authors, without undue reservation.
Author contributions
TD: Conceptualization, Formal Analysis, Methodology, Writing – original draft, Writing – review and editing. JH: Conceptualization, Data curation, Writing – review and editing, Investigation, Supervision. JS: Data curation, Formal Analysis, Investigation, Supervision, Writing – review and editing. SP: Data curation, Investigation, Project administration, Writing – review and editing. XP: Data curation, Investigation, Project administration, Writing – review and editing. TC: Data curation, Investigation, Writing – review and editing. XZ: Data curation, Funding acquisition, Writing – review and editing.
Funding
The author(s) declare that financial support was received for the research and/or publication of this article. The author(s) declare that this research and/or publication was supported by the National Natural Science Foundation of China, grant number 52304131.
Conflict of interest
Authors JS, SP, XP, and TC were employed by Pangang Group Mining Company Limited Panzhihua.
The remaining authors declare that the research was conducted in the absence of any commercial or financial relationships that could be construed as a potential conflict of interest.
Generative AI statement
The author(s) declare that no Generative AI was used in the creation of this manuscript.
Any alternative text (alt text) provided alongside figures in this article has been generated by Frontiers with the support of artificial intelligence and reasonable efforts have been made to ensure accuracy, including review by the authors wherever possible. If you identify any issues, please contact us.
Publisher’s note
All claims expressed in this article are solely those of the authors and do not necessarily represent those of their affiliated organizations, or those of the publisher, the editors and the reviewers. Any product that may be evaluated in this article, or claim that may be made by its manufacturer, is not guaranteed or endorsed by the publisher.
References
Ahmad, S., Rizvi, Z., Khan, M. A., Ahmad, J., and Wuttke, F. (2019). Experimental study of thermal performance of the backfill material around underground power cable under steady and cyclic thermal loading. Mater. today Proc. 17, 85–95. doi:10.1016/j.matpr.2019.06.404
Ahmad, S., Rizvi, Z. H., Arp, J. C. C., Wuttke, F., Tirth, V., and Islam, S. (2021). Evolution of temperature field around underground power cable for static and cyclic heating. Energies 14, 8191. doi:10.3390/en14238191
Ahmad, S., Rizvi, Z. H., and Wuttke, F. (2025). Unveiling soil thermal behavior under ultra-high voltage power cable operations. Sci. Rep. 15, 7315. doi:10.1038/s41598-025-91831-1
Ahmad, S., Ahmad, S., and Akhtar, S. (2025). Data-driven assessment of corrosion in reinforced concrete structures embedded in clay dominated soils. Sci. Rep. 15, 22744. doi:10.1038/s41598-025-08526-w
Ali, K., and Reza, M. S. (2021). Optimization of slope critical surfaces considering seepage and seismic effects using finite element method and five meta-heuristic algorithms. Period. Polytech. Civ. Eng. 65 (2), 425–436. doi:10.3311/ppci.17098
Alsabhan, A. H., Sadique, M. R., Ahmad, S., Alam, S., and Binyahya, A. S. (2021). The effect of opening shapes on the stability of underground tunnels: a finite element analysis. GEOMATE J. 21 (87), 19–27. doi:10.21660/2021.87.j2267
Cheng, W. W., Song, W. D., and Zhang, X. C. (2011). The influence of landslide stability on mining hanging wall ore under the high and steep slope. J. China Coal Soc. 36 (3), 377–382. doi:10.1007/s12583-011-0163-z
Erzin, Y., and Cetin, T. (2013). The prediction of the critical factor of safety of homogeneous finite slopes using neural networks and multi-ple regressions. Comput. Geosciences 51, 305–313. doi:10.1016/j.cageo.2012.09.003
Fang, Q. H., Hu, B., and Li, J. (2021). Optimization model of slope control parameters based on SR-BP neural network fusion. Chi-nese J. Nonferrous Metals 31 (9), 2573–2582.
Feng, X. T., Wang, Y. J., and Lu, S. Z. (1995). Neural network estimation of slope stability. J. Eng. Geol. (4), 54–61.
Foong, L. K., and Moayedi, H. (2022). Slope stability evaluation using neural network optimized by equilibrium optimization and vortex search algorithm. Eng. Comput. 38 (Suppl. 2), 1269–1283. doi:10.1007/s00366-021-01282-1
Furuya, G., Sassa, K., and Hiura, H. (1999). Mechanism of creep movement caused by landslide activity and underground erosion in crystalline schist, shikoku island, Southwestern Japan. Eng. Geol. 53, 311–325. doi:10.1016/s0013-7952(98)00084-2
Ghasemi, M., Zare, M., Trojovsky, P., Rao, R. V., and Trojovská, E. (2024). Optimization based on the smart behavior of plants with its engineering applications: ivy algorithm. Knowledge-Based Syst. 295, 111850. doi:10.2139/ssrn.4671156
Guan, X. M., Wang, X. C., and Nie, Q. K. (2018). Stability analysis and parameters optimization of an open-pit slope. Saf. Coal Mines 49 (5), 71–74. doi:10.13347/j.cnki.mkaq.2018.05.018
He, J., Deng, T., Peng, S., Pang, X., Wan, D., Zhang, S., et al. (2025). Research on slope stability based on bayesian gaussian mixture model and random reduction method. Appl. Sci. 15, 7926. doi:10.3390/app15147926
Karir, D., Ray, A., Bharati, A. K., Chaturvedi, U., Rai, R., and Khandelwal, M. (2022). Stability prediction of a natural and man-made slope using various machine learning algorithms. Transp. Geotech. 34, 100745. doi:10.1016/j.trgeo.2022.100745
Kurnaz, T. F., Erden, C., Dagdeviren, U., Demir, A. S., and Kökçam, A. H. (2024). Comparison of machine learning algorithms for slope stability prediction using an automated machine learning approach. Nat. Hazards 120 (8), 6991–7014. doi:10.1007/s11069-024-06490-8
Lei, Z., and Sha, S. (2016). “Numerical simulation of rock slope toppling based on rheological model,” in International conference on smart city and systems engineering. IEEE, 386–389. doi:10.1109/icscse.2016.0108
Li, H. Q. (2023). Study on slope stability and final slope angle optimization of a kaolin open-pit. Guangxi University. doi:10.27034/d.cnki.ggxiu.2023.001634
Li, Y. N., Hou, K. P., and Cheng, Y. (2018). Stability of an open-pit slope and optimization of slope structure parameters. Nonferrous Met-als Min. Sect. 70 (6), 95–100.
Li, Y., Yu, L., Song, W. D., and Yang, T. (2019). Three-dimensional analysis of complex rock slope stability affected by fault and weak layer based on FESRM. Adv. Civ. Eng. 2019 (3), 6380815–14. doi:10.1155/2019/6380815
Li, Y. Y., Chen, G. Q., and Shi, M. H. (2024). Intelligent optimization method for slope morphology and stability of phosphogypsum stockpiles based on LM-LSO algorithm. Gold Sci. Technol. 32 (5), 882–893.
Liao, Z. (2023). Analysis of the stability of high slope of a hydropower station based on limit equilibrium method and discrete element method. Yellow River 45 (10), 146–150.
Lin, Q., Cao, P., Wen, G., Meng, J., Cao, R., and Zhao, Z. (2021). Crack coalescence in rock-like specimens with two dissimilar layers and pre-existing double parallel joints under uniaxial compression. Int. J. Rock Mech. Min. Sci. 139, 104621. doi:10.1016/j.ijrmms.2021.104621
Lin, S., Zheng, H., Han, B., Li, Y., Han, C., and Li, W. (2022). Comparative performance of eight ensemble learning approaches for the development of mod-els of slope stability prediction. Acta Geotech. 17 (4), 1477–1502. doi:10.1007/s11440-021-01440-1
Lin, Q., Zhang, S., Lin, H., Zhang, K., Fan, W., Huang, C., et al. (2025). Failure behavior of jointed rock masses containing a circular hole under compressive-shear load: insights from DIC technique. Theor. Appl. Fract. Mech. 139, 105089. doi:10.1016/j.tafmec.2025.105089
Ma, C., Zhan, H. B., Yao, W. M., and Li, H. z. (2018). A new shear rheological model for a soft interlayer with varying water content. Water Sci. Eng. 11 (2), 131–138. doi:10.1016/j.wse.2018.07.003
Nanehkaran, Y. A., Licai, Z., Chengyong, J., Chen, J., Anwar, S., Azarafza, M., et al. (2023). Comparative analysis for slope stability by using machine learning methods. Appl. Sci. 13 (3), 1555. doi:10.3390/app13031555
Pham, K., Kim, D., Park, S., and Choi, H. (2021). Ensemble learning-based classification models for slope stability analysis. Catena 196, 104886. doi:10.1016/j.catena.2020.104886
Qiao, M. (2023). Study on intelligent optimization of slope state control parameters of high slope in mine with gently inclined weak interlayer. Wuhan University of Science and Technology.
Ragam, P., Kushal Kumar, N., Ajith, J. E., Karthik, G., Himanshu, V. K., Sree Machupalli, D., et al. (2024). Estimation of slope stability using ensemble-based hybrid machine learning approaches. Front. Mater. 11, 1330609. doi:10.3389/fmats.2024.1330609
Rizvi, Z. H., Mustafa, S. H., Sattari, A. S., Ahmad, S., Furtner, P., and Wuttke, F. (2020). “Dynamic lattice element modelling of cemented geomaterials,”. Advances in computer methods and geomechanics. Lecture notes in civil engineering. Editors A. Prashant, A. Sachan, and C. Desai (Singapore: Springer), 55, 655–665. doi:10.1007/978-981-15-0886-8_53
Shen, Y. Z., Hao, Z. H., and Chen, Y. (2021). Optimization study of slope angle for an open-pit uranium mine based on shear strength reduction method. Uranium Min. Metallurgy 40 (2), 102–107. doi:10.13426/j.cnki.yky.2021.02.003
Tiwari, S., Das, S. K., and Mohanty, M. (2025). A critical performance assessment of the machine learning algorithms for slope stability analysis. Neural Comput. Appl. 37 (16), 9735–9757. doi:10.1007/s00521-024-10471-0
Wang, S. (2021). Structural parameter optimization and instability risk assessment of dump slope. Coal Eng. 53 (5), 35–39.
Xia, D., Tang, H. M., Thomas, G., Tang, C., and Wang, Q. (2024). KNN-GCN: a deep learning approach for slope-unit-based landslide susceptibility map-ping incorporating spatial correlations. Math. Geosci. 56 (5), 1011–1039. doi:10.1007/s11004-023-10132-3
Xu, S., An, L., and Liu, D. (2018). Panel extraction and safety analysis of hanging wall orebody under high-steep slope. J. Min. Saf. Eng. 35 (3), 582–588. doi:10.13545/j.cnki.jmse.2018.03.019
Yan, M. Y. (2023). Application of slope angle optimization study for an open-pit mine based on slide. Metallurgy Mater. 43 (9), 168–171.
Yang, Y., Zhou, W., Jiskani, I. M., Lu, X., Wang, Z., and Luan, B. (2023). Slope stability prediction method based on intelligent optimization and machine learning algorithms. Sustainability 15, 1169. doi:10.3390/su15021169
Zeng, L. F. (2020). Optimization and application of 3D boundary parameters in open-pit mine. Min. Metallurgical Eng. 40 (4), 14–17.
Zhou, F. X., Zhu, S. W., and Liang, Y. W. (2023). Exact analysis of soil slope stability by using variational limit equilibrium method. Chin. J. Geotechnical Eng. 45 (7), 1341–1346.
Keywords: open-pit mine, weak interlayer, bench parameters, multi-objective optimization, machine learning, graphical user interface
Citation: Deng T, He J, Sun J, Peng S, Pang X, Chen T and Zhang X (2025) Intelligent optimization of slope step parameters in open pit mines containing weak interbedded layers based on machine learning and multi-objective optimization methods. Front. Earth Sci. 13:1666375. doi: 10.3389/feart.2025.1666375
Received: 15 July 2025; Accepted: 15 September 2025;
Published: 14 October 2025.
Edited by:
Haijun Qiu, Northwest University, ChinaReviewed by:
Qibin Lin, University of South China, ChinaZarghaam Rizvi, GeoAnalysis Engineering GmbH, Germany
Copyright © 2025 Deng, He, Sun, Peng, Pang, Chen and Zhang. This is an open-access article distributed under the terms of the Creative Commons Attribution License (CC BY). The use, distribution or reproduction in other forums is permitted, provided the original author(s) and the copyright owner(s) are credited and that the original publication in this journal is cited, in accordance with accepted academic practice. No use, distribution or reproduction is permitted which does not comply with these terms.
*Correspondence: Tao Deng, MjAxMjAxNjVAa3VzdC5lZHUuY24=