 Jiatao Kang1
 Zhiwen Xu
 Suhua Zhou
- 1Department of Architectural Engineering, Henan College of Transportation, Zhengzhou, China
- 2College of Civil Engineering, Hunan University, Changsha, China
- 3Guizhou Quality and Safety Traffic Engineering Monitoring and Testing Center Co. Ltd, Guiyang, China
- 4National Key Laboratory of Bridge Safety and Resilience, Changsha, China
Horizontal runout distance prediction of potential landslides is of great significance in hazard mitigation.In this study, predictive charts of landslide horizontal runout distance were developed based on the support vector regression (SVR) algorithm and Monte Carlo (MC) modeling. An SVR-based prediction model was constructed using a dataset of 424 historical landslides, which included six parameters: triggers, mass materials, volume, slope gradient, vertical drop, and horizontal runout distance. The first five parameters were employed as predictive indicators to estimate horizontal runout distance. To investigate the optimization of the penalty factor (c) and influence parameter in the kernel function (g) and their effects on prediction accuracy, 21 conditions were tested with 7 training/testing ratios (7/1, 6/2, 5/3, 4/4, 3/5, 2/6, and 1/7) in combination with three kernel functions: linear, radial basis function (RBF), and sigmoid. Predictive charts were then created by adopting the MC method to account for uncertainties in slope volume and slope gradient parameters. The results show that (1) the coefficient of determination in each condition was greater than 0.825, with the highest value of 0.854 obtained under the condition of a 7/1 training/testing ratio in combination with the RBF kernel function; (2) increasing the training/testing ratio improved prediction accuracy; (3) the model with the RBF kernel function performed better than those with other kernel functions; and (4) the optimization of c and g parameters significantly improved prediction accuracy. The feasibility and efficiency of the proposed model were demonstrated using a practical case of the Zhonghai Village landslide, highlighting the potential of SVR combined with MC modeling for landslide runout prediction and hazard mitigation.
1 Introduction
Landslides are one of the most frequently occurring types of geological disasters globally. China, being a mountainous country, experiences thousands of landslide-related geological disasters annually, resulting in billions of dollars in property damage and hundreds of casualties (Dai et al., 2002; Gao et al., 2007; Valagussa et al., 2019). Notable examples include the “2017.6.25” Diexi landslide in Sichuan (Fan et al., 2017) and the “2021.1.27” Yongjing County landslide in Gansu (Chang et al., 2021), both of which caused significant loss of life and property. Therefore, risk prevention and control of landslide disasters have been a major research focus in geotechnical engineering. Two key issues are involved in landslide disaster risk prevention and control: first, the stability analysis of potential landslides and, second, the prediction of the impact range after the landslide occurs (Corominas et al., 2014).
At present, research on predicting the impact range of landslides has primarily focused on predicting the horizontal runout distance of landslides, leading to the development of numerous models. Among them, empirical statistical models are used to estimate the horizontal runout distance of landslides by establishing regression formulas based on landslide runout mechanisms (Fan et al., 2012; Chen et al., 2015; Zheng et al., 2019; Lu et al., 2020). However, due to differences in the collected landslide cases, research parameters, and other factors, the forms of empirical statistical models vary greatly, making them difficult to apply universally and posing significant limitations. Additionally, some researchers use numerical simulation software to predict landslide horizontal runout distances, such as MassFlow (Ouyang et al., 2015), the material point method (Sun and Song, 2018), and DAN3D (Wu et al., 2018). Zhang et al. (2024) developed a coupled SPH model to simulate landslide impacts on multiple barriers, validated using flume tests. Numerical simulation methods require detailed physical and mechanical parameters to model and analyze landslides, which can be time-consuming and lack general applicability.
In recent years, scholars at home and abroad have applied machine learning models (Huang and Zhao, 2018; Pham et al., 2020; Balogun et al., 2021; Guzzetti et al., 2024) to landslide disaster early warning and prevention research, achieving good results. Zhao et al. (2024) evaluated landslide susceptibility models at varying resolutions, finding that integrated models and high-resolution data greatly improve accuracy, with Random Subspace and Alternating Decision Tree (RS-ADT) at 12.5 m performing best. Zhao et al. (2025) compared three models for landslide susceptibility and found that the weights-of-evidence (WoE) model performed best, offering valuable insights for disaster risk reduction. The above studies have yielded some results in terms of slope analysis. In addition, the support vector regression (SVR) model has performed well in regression prediction problems due to its robustness, reliable prediction results, and high prediction accuracy (Peethambaran et al., 2020; Balogun et al., 2021). Nevertheless, the effectiveness of machine learning-based predictions is greatly influenced by the model parameter settings and optimization (Huang and Zhao, 2018; Peethambaran et al., 2020; Balogun et al., 2021; Guzzetti et al., 2024). Furthermore, many studies based on the SVR model show a certain degree of subjectivity in optimizing model parameters such as the training set sampling rate, kernel function type selection, and parameter c and g values.
Moreover, due to the complex mechanism of landslide runout and significant uncertainty in parameters, existing machine learning-based prediction models, although capable of making preliminary inferences about the horizontal runout distance of landslides, have all overlooked the uncertainty of influencing factors. For instance, a formula for calculating the horizontal runout distance of rock landslide-debris flows based on potential energy was proposed and experimentally validated (Zheng et al., 2019). Du et al. (2020) discussed the causes of translational landslides and built a corresponding model, finding that higher water levels increase total stress, thereby leading to stepped settlement of the bedrock. Similarly, Fan et al. (2009) discussed the genetic mechanism and limit equilibrium criterion of single and multi-translational landslides based on physical model tests and numerical analysis. Although these studies provide valuable guidance for disaster early warning and prevention, they all overlook the uncertainties associated with landslide parameters. Monte Carlo (MC) simulation is an effective method for considering parameter randomness and uncertainty as it generates independent sets of research parameters based on probability distributions. It has been widely used to address research involving high parameter uncertainty in geotechnical engineering (Li et al., 2019; Marin and Mattos, 2020).
Based on the above analysis, this paper establishes a probabilistic prediction model for landslide horizontal runout distance based on MC simulation and SVR, taking earthquake- and rainfall-induced landslides as the research object and addressing the uncertainty of landslide parameters and the deficiencies of existing models. To optimize the model, the effects of the ratio of the training set to the prediction set, the kernel function type, and the parameter c and g values on the prediction performance of the SVR model are discussed. To account for the uncertainty of landslide parameters, the MC simulation method is introduced to predict the probability distribution of landslide horizontal runout distances, and a prediction diagram that can quickly determine the range of landslide horizontal runout distances is provided. Finally, methods for enhancing the applicability of the diagram are proposed, and the effectiveness and reliability of the prediction diagram constructed in this paper are verified through engineering case studies.
2 Landslide database and analysis
The essential characteristics of landslide runout are shown in Figure 1. Landslides occur when external factors such as heavy rainfall or earthquakes induce runout along a slope, resulting in a slip. The horizontal distance from the front of the landslide accumulation body to the rear edge of the landslide is called the horizontal runout distance L, the vertical distance is called the vertical drop H, the volume of the landslide accumulation body is denoted as V, and the slope gradient of the landslide is denoted as α. Horizontal runout distance (L) and vertical drop (H) are the key indices that determine the influence range of landslide disasters, and they are of great significance in preventing and controlling landslide disasters. Among them, vertical drop H has a greater relationship with the topographic structure of the slope, making the prediction difficulty relatively lower than the horizontal runout distance. Therefore, this paper focuses on predicting the horizontal runout distance L and develops a prediction chart that enables the rapid estimation of the potential runout range of landslides.
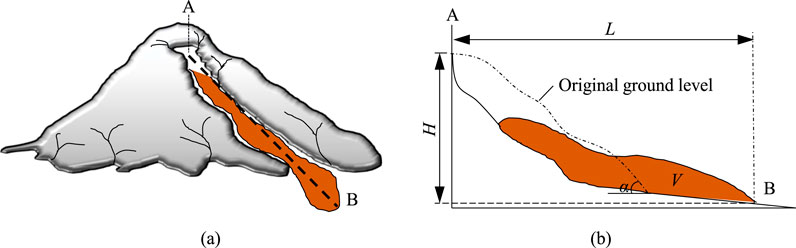
Figure 1. Schematic diagram of landslide movement. Diagram featuring two parts: (a) a side view of a volcano with a lava flow from point A on top to point B at the base, and (b) a cross-sectional view showing the original ground level, height (H), and runout length (L) of the lava flow, labeled with volume (V) and angle (α).
In predictive research using the machine learning model and empirical regression model, the established database and the selection of predictor variables directly affect predictive performance. Table 1 lists several typical empirical regression prediction models for the horizontal runout distance. These models are based on a certain number of documented landslide cases. Due to the limited number of collected landslide cases, their applicability is restricted to specific situations and is difficult to popularize. To establish a prediction model with stronger applicability and reliability, this paper collected data from 424 landslide cases with six typical variables, namely, triggers, mass materials, landslide volume V, landslide slope gradient α, vertical drop H, and horizontal runout distance L, referring to the relevant literature and combining with the movement mechanism of landslide movement. An overview of the database is presented in Table 2.
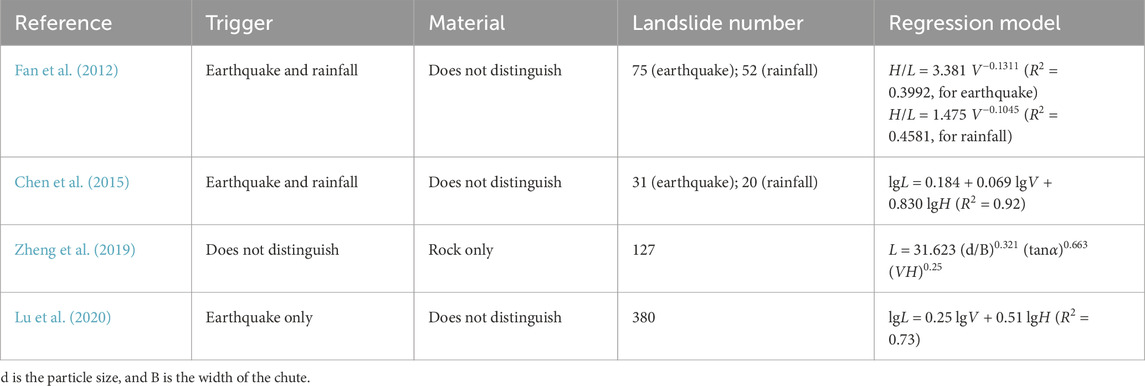
Table 1. Typical empirical regression prediction models.

Table 2. Overview of the landslide database.
Generally, according to different landslide volumes (Qi et al., 2011), landslides can be divided into small landslides (V ≤ 105 m3), medium landslides (105 m3 < V ≤ 106 m3), large landslides (106 m3 < V ≤ 107 m3), and giant landslides (107 m3 < V). Figure 2 shows the distribution of variables in the dataset of 424 collected landslides.

Figure 2. Distribution of each variable. Four charts analyze landslide characteristics: (a) Bar chart categorizing landslides as Small, Medium, Large, and Giant with counts and a pie chart of triggering factors: soil, rock, earthquake, and rainfall. (b) Histogram showing landslide counts by slope angle with cumulative percent. (c) Histogram showing landslide counts by vertical drop with cumulative percent. (d) Histogram showing landslide counts by horizontal runout distance with cumulative percent.
Figure 2 shows the detailed distribution of six variables in the landslide database: triggers, mass materials, landslide volume V, landslide slope gradient α, vertical drop H, and horizontal runout distance L. The numbers of small, medium, large, and giant landslides are 133, 104, 114, and 73, respectively, among which the numbers of soil and rock landslides are 130 and 294 and the numbers of landslides induced by earthquake and rainfall are 251 and 173, respectively. The data on slope gradient, vertical drop, and horizontal runout distance have good continuity. It shows that the landslide data collected in this paper are representative to some extent.
In previous studies, due to the wide data span of landslide volume V, landslide slope gradient α, vertical drop H, and horizontal runout distance L, V, H, and L are usually taken as logarithms, and α is taken as the tangent value. To analyze the relationships between the parameters, a scatterplot matrix of the parameters is presented, as shown in Figure 3.
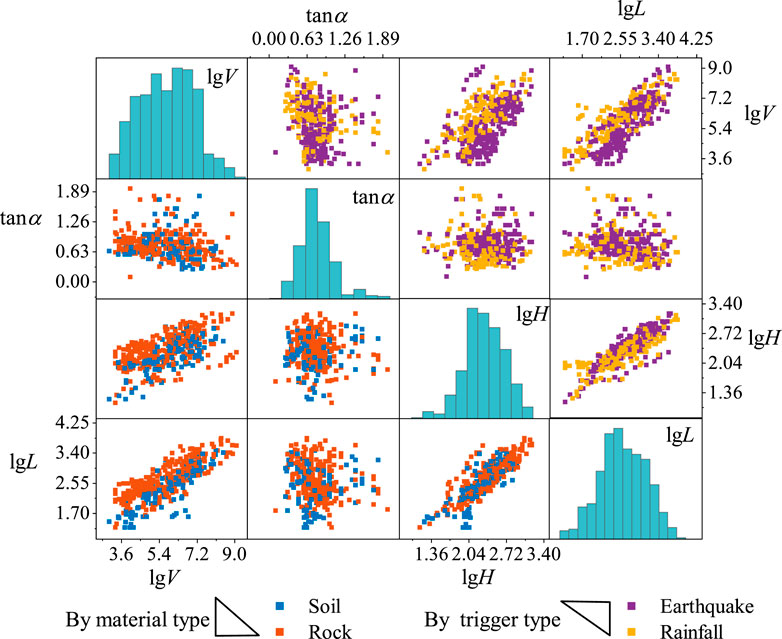
Figure 3. Matrix scatter plot of each parameter.
The upper-right section of Figure 3 depicts the scatter distribution between the two factors classified by triggers, while the lower-left section represents the scatter distribution between the two factors classified by mass materials. It can be observed that there is a notable linear correlation between lgH and lgL, lgV and lgL, and lgH and lgV. Conversely, the scatter distribution between tanα and lgL, along with lgH and lgV, is relatively discrete. In addition, under the distinction of different triggers and mass materials, the data are also clearly differentiated, indicating that triggers and mass materials are also among the influential factors that cannot be ignored. Additionally, it validates the rationale for the parameters selected in this study for analysis and calculation.
3 Experimental program design
The objective of this paper is to evaluate the performance of the prediction model for the horizontal runout distance of landslides based on MC–SVR and provide a prediction chart that can rapidly ascertain the horizontal runout distance of landslides. The specific test scheme design is presented below.
For the MC–SVR model, the trained SVR model’s reliability is paramount as it directly affects the reliability of the landslide horizontal runout distance prediction chart. Therefore, this paper first studies the reliability of the SVR model, selecting R2 as the characteristic parameter of the evaluation model, and its calculation formula is presented in Equation 1:
where l is the number of samples, yi is the true value of the ith sample, and
1. Ratio of the training set to the prediction set. A total of 424 landslide data groups collected were randomly shuffled and then divided into eight parts according to different training-to-prediction set ratios, which were set at 1/7, 2/6, 3/5, 4/4, 5/3, 6/2, and 7/1. As an illustration, the ratio of 1/7 comprises seven sample combinations; all results in these seven cases are calculated, and the average coefficient of determination R2 is then obtained. The methodology is consistent for all ratios.
2. Kernel function type. The type of kernel function used in the SVR model affects its performance. This paper examines the influence of three kernel functions, namely, the linear function, the Gaussian radial basis function (RBF), and the S-shape function (sigmoid), on the resulting outcomes.
3. Additional instructions. In terms of data preprocessing, the variables lgV, tanα, lgH, and lgL are standardized. Triggers and mass materials are processed using one-hot coding, in which categorical variables are represented using binary vectors (e.g., rainfall is represented as [0, 1], and earthquake is represented as [1, 0]).
After studying the reliability of the SVR model, the MC simulation method was introduced to obtain the probability distribution of the horizontal runout distance of the landslide. Finally, the vertical drop was entered as a sequence, thereby generating the prediction chart of the horizontal runout distance of the landslide. The overall test process is shown in Figure 4.
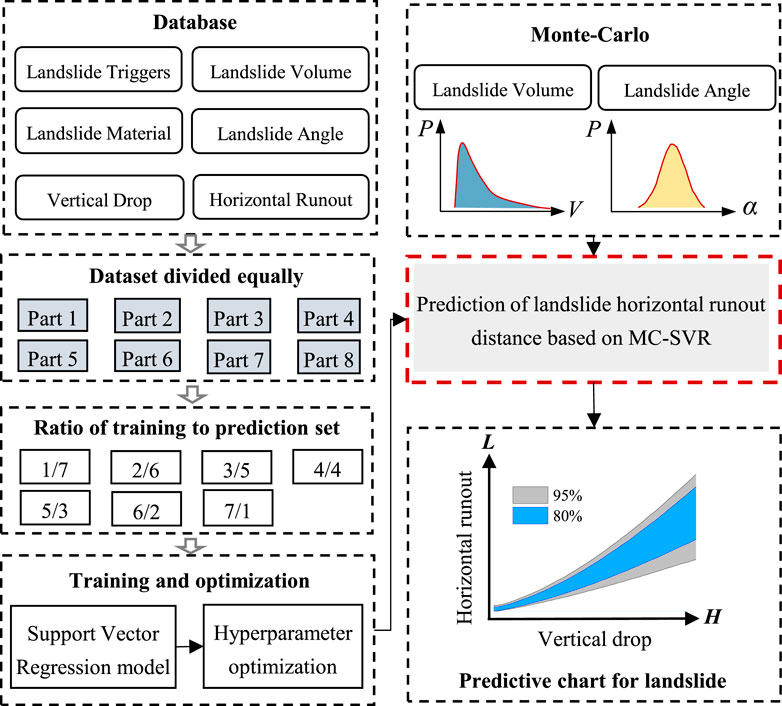
Figure 4. Test procedure.
4 MC–SVR-based model for predicting the horizontal runout distance of landslides
4.1 Support vector regression
SVR is an application of support vectors in functional regression, using a support vector machine (SVM) to solve regression fitting problems.
Furthermore, in this paper, triggers, mass materials, landslide volume, landslide slope gradient, and vertical drop are selected as inputs to the SVR model, with horizontal runout distance as the output, to establish a predictive model for landslide horizontal runout distance. The specific building process is as follows:
Assuming that the number of training samples is l, the training set is {(xi, yi), i = 1, 2,… , l}, where xi is the input vector for the ith training sample. xi = [x1i, x2i,…, x5i]T represents the five training parameters of the ith training sample (triggers, mass materials, landslide volume, landslide slope gradient, and vertical drop), while yi is the horizontal runout distance of the ith training sample.
The linear regression function established in the high-dimensional feature space is presented in Equation 2:
where w is the weight vector of high-dimensional feature space, Φ(x) is mapping function, and b is the threshold value.
Then, to represent the quality of the regression effect, a loss function is introduced in Equation 3:
where f(x) is the predicted value of the landslide horizontal runout distance returned by the regression function and y is the corresponding true value. If the difference between f(x) and y is less than ε, the loss value is 0.
Next, relaxation variables ξi and ξ*i are introduced to set up a minimization objective function to determine the weight vector w and threshold value b:
where C is the penalty factor (parameter c) and ε specifies the error requirement of the regression function.
To solve Equation 4, Lagrange function is introduced and converted into dual form, as shown in Equation 5:
where K (xi, xj) is the kernel function, with different kernel functions exerting varying influences on model performance, and g is the influence parameter of the kernel function.
The weight vector w and threshold b are determined according to αi and α*I obtained using Equation 5, as shown in Equation 6:
Finally, the final regression function can be obtained according to Equation 2.
Equation 7 represents the expression of the Gaussian kernel function, where σ is the bandwidth of the Gaussian kernel and is greater than 0. The parameter g is the influence parameter of the Gaussian kernel, which is inversely proportional to twice the square of the Gaussian kernel bandwidth, and is usually adjusted during model training to improve training effectiveness.
4.2 MC–SVR model
In this paper, triggers, mass materials, landslide volume, landslide slope gradient, and vertical drop are taken as inputs to the SVR model. There are uncertainties in triggers, mass materials, landslide volume, landslide slope gradient, and vertical drop for landslides that have not yet occurred. The triggers of landslides can be inferred from the disaster situation in the landslide area, the vertical drop can be roughly inferred from the landform structure of the landslides, and the landslide volume and slope gradient are highly uncertain. Based on the above considerations, this paper adopts the Monte Carlo simulation combined with the SVR model to develop a landslide horizontal runout distance prediction model that accounts for parameter uncertainty, thereby better meeting the practical needs of engineering.
First, the corresponding distribution form and parameters are determined by analyzing the statistical characteristics of the slope gradient and landslide volume in the landslide database. The slope gradient is normally distributed, and the landslide volumes of small, medium, large, and giant landslides are log-normally distributed. The specific distribution parameters are shown in Table 3.
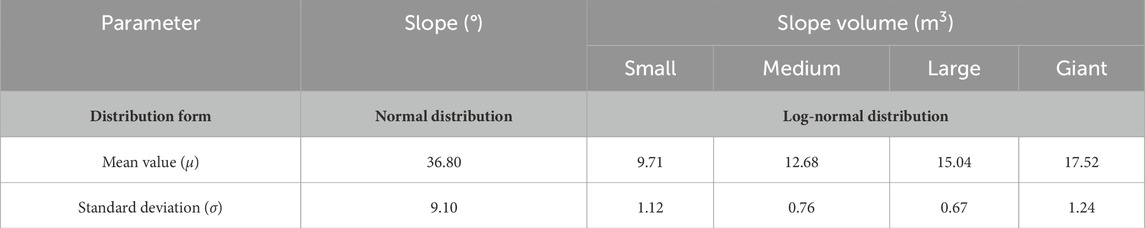
Table 3. Distribution parameter.
Next, according to the determined distribution form and corresponding parameters, a sequence of 10,000 length is randomly generated using a computer, which meets the requirements, as shown in Figure 5 (the slope gradient). By inputting the generated sequences (slope gradient and landslide volume are distribution sequences, while triggers, mass materials, and vertical drop are determined values) into the trained SVR model, a prediction sequence of landslide horizontal runout distance with a length of 10,000 can be obtained.
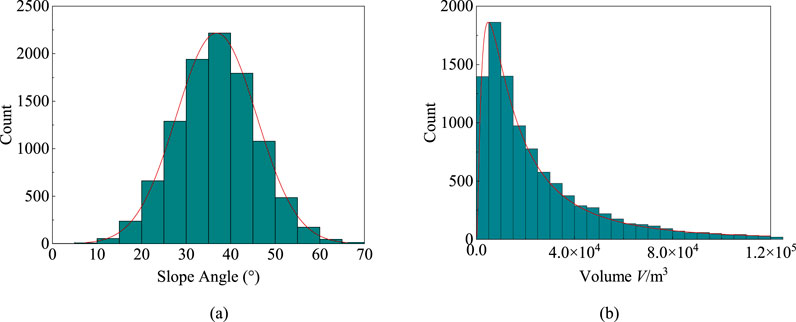
Figure 5. Simulated distribution: (a) slope gradient; (b) volume.
Finally, the probability density function f(x) can be obtained according to the prediction sequence of the horizontal runout distance of the landslide to determine the value of P{L1 ≤ x ≤ L2} (the probability value of the predicted value in the range of L1–L2). The above section describes the process of building the MC–SVR model.
5 Prediction of the horizontal runout distance
Four hundred twenty-four landslide data groups were used to predict the horizontal runout distance of landslides when the ratios of the training set and prediction set were 1/7, 2/6, 3/5, 4/4, 5/3, 6/2, and 7/1, and the kernel function types were linear, RBF, and sigmoid. In the SVR model, c and g are important parameters that affect the model’s performance. This paper uses the currently more common grid search method to determine the parameters c and g, with their research scope defined as [2–10, 2–9.5, … , 29.5, 210]; the grid search steps are Log2c and Log2g = 0.5. Figure 6 shows the coefficient of determination (R2) of the prediction results of the prediction set when the ratio of the training set to the prediction set is 7/1 and the kernel function is RBF with different parameters c and g.
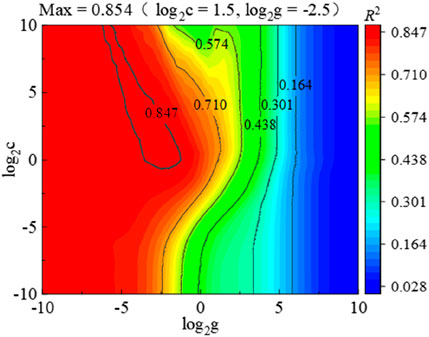
Figure 6. R2 distribution of forecast results (7/1, RBF).
Figure 6 reflects the distribution of the coefficient of determination (R2) of the prediction results when the ratio of the training set to the prediction set is 7/1 with RBF as the kernel function. Since there are seven combination cases when the ratio is 7/1, the coefficient of determination R2 at each point is the average of the calculated results for the seven cases. Figure 6 shows that when parameters c and g are (21.5, 2–2, 5), the absolute value of the coefficient of determination (R2) reaches its maximum of 0.854. In particular, this value is smaller than the coefficient of determination R2 for some of the models in Table 1 because of the different objects. The coefficient of determination (R2) in Table 1 is the regression fitting of all data (equivalent to the training set in this paper), and the maximum value of the determination coefficient R2 of the training set predicted using the model in this paper is more than 0.95. In addition, Figure 7 shows that the R2 of the prediction result of the prediction set changes with the change in the ratio between the training and prediction sets when the linear function, the RBF function, and the sigmoid function are selected as kernel functions.

Figure 7. R2 change in the predicted result.
It can be observed from Figure 7 that the coefficient of determination (R2) surpasses 0.825 in all cases. Notably, the ratio of the training set to the prediction set, along with the kernel function type, exerts substantial influence on the predictive outcomes. In particular, with an increase in the proportion of the training set, R2 of the same kernel function model also increases. When the training-to-prediction set ratios are 1/7 and 2/6, the R2 values of the results of the three kernel function models are close. Subsequently, with the continuous increase in the training set proportion, the RBF kernel function performs better than the linear kernel function and the sigmoid kernel function. In general, the linear and sigmoid kernel models yield similar results, but the sigmoid kernel model performs slightly better.
Having validated the commendable predictive prowess of the SVR model, we proceed to incorporate the Monte Carlo simulation for the purpose of forecasting the horizontal runout distance of landslides using the MC–SVR framework. Taking 424 cases of landslide data as the training set, the horizontal runout distance of the Weiba landslide is predicted (the Weiba landslide is a large-scale soil landslide triggered by an earthquake in Pingwu County, with a horizontal runout distance of 550 m and a vertical drop of 345 m) (Guo et al., 2014). For this case, the RBF function is selected as the kernel function, and slope gradient and landslide volume are randomly generated following the distribution forms and parameters outlined in Table 3. The probability density distribution of the predicted results is shown in Figure 8 (this paper studies the range of 95% and 80% probabilities, with similar analyses applicable to other probability thresholds).

Figure 8. Probability distribution of the landslide horizontal runout distanceprediction distribution range. Probability density graph showing horizontal runout distance in meters for landslides. The curve peaks near 600 meters with shaded areas under the curve indicating probability ranges: gray for 95% (431 m to 951 m) and blue for 80% (487 m to 818 m). The line at 550 meters marks the expected true runout distance.
Figure 8 shows the prediction of the horizontal runout distance of the Weiba landslide using the MC–SVR model, the true value of which is L = 550 m. According to the results of the model, the model’s forecast not only falls within the 95% confidence interval (431 m–951 m) but also comfortably resides within the narrower 80% probability range (487 m–818 m), indicating a significant safety margin. It proves that the prediction model of the landslide horizontal runout distance based on MC–SVR has good performance.
Considering that the number and variety of landslides in actual projects are substantial, to obtain a more applicable landslide horizontal runout distance prediction chart, the MC–SVR model was used to calculate the distribution range of the horizontal runout distance of rock and soil landslides (a total of four categories) caused by rainfall or earthquake, varying with the vertical drop, as shown in Figure 9. It shows the prediction chart of the horizontal runout distance of the landslide. A suitable prediction chart can be selected according to the type of landslide (volume, triggers, and materials). The corresponding range of the horizontal runout distance can be determined using the vertical drop. To test the accuracy of the prediction chart, the distribution of landslide data in the chart was calculated, among which the distribution of earthquake-induced small rock landslides is shown in Figure 10.

Figure 9. Prediction scheme of the horizontal runout distance of various landslides: (a) small-rainfall-rock; (b) small-rainfall-soil; (c) small-earthquake-rock; (d) small-earthquake-soil; (e) medium-rainfall-rock; (f) medium-rainfall-soil; (g) medium-earthquake-rock; (h) medium-earthquake-soil; (i) large-rainfall-rock; (j) large-rainfall-soil; (k) large-earthquake-rock; (l) large-earthquake-soil; (m) giant-rainfall-rock; (n) giant-rainfall-soil; (o) giant-earthquake-rock; and (p) giant-earthquake-soil.
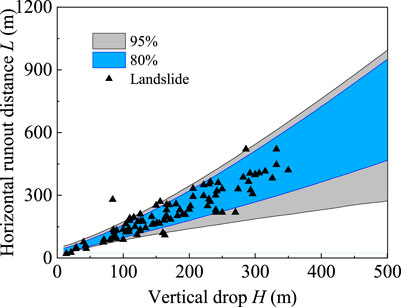
Figure 10. Distribution of landslide data in the chart (small, earthquake, and rock quality).
Among the 424 landslide cases, 94 small rock landslides were triggered by earthquakes. As illustrated in Figure 10, 87 of these landslides (93%) fall within the 95% probability range of horizontal runout distance predicted using the MC–SVR model, while 77 cases (82%) were within the 80% probability range. In addition, the statistical distribution of other landslides in the prediction chart is shown in Table 4.
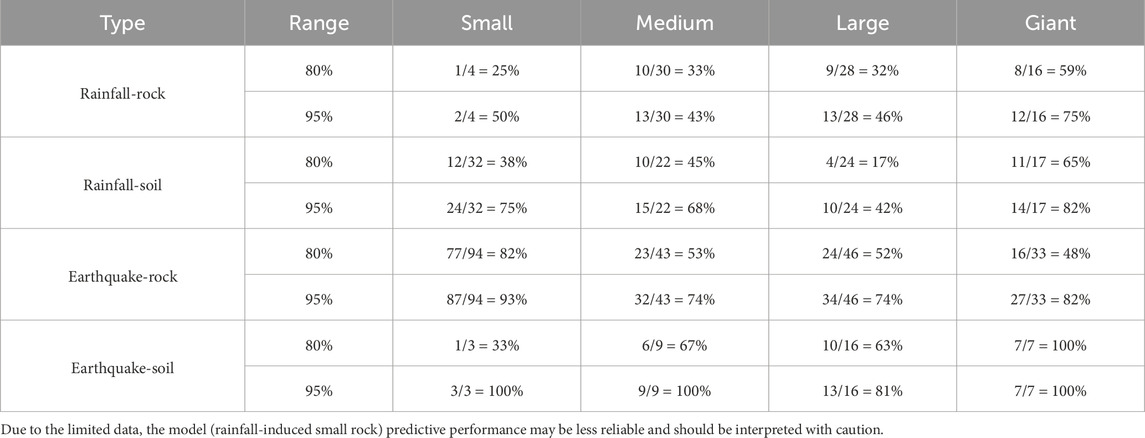
Table 4. Statistics of the model performance.
Table 4 presents the statistical distribution of landslide data within the predictive chart, demonstrating that the accuracy of the horizontal runout distance prediction chart based on the MC–SVR model is significantly influenced by the training data samples. Overall, the prediction chart for landslide horizontal runout distance exhibits good accuracy and ease of use, allowing for the determination of horizontal runout distance based on the vertical drop of the landslide. This is of great significance for early warning and disaster prevention of landslides. However, due to insufficient cases of certain types of landslides in the database (e.g., small-scale rainfall-induced rock landslides and medium-scale rainfall-induced rock landslides), the accuracy of the distribution of some landslides within the corresponding chart is relatively poor.
Furthermore, considering the unknown triggers and complex material compositions (mix of rock and soil) of non-moving landslides in real engineering scenarios, to enhance the applicability of the horizontal runout distance prediction chart in practical projects, the prediction chart (Figure 9) should be processed. Assuming that an area is subject to both earthquake hazards and heavy rainfall, and the landslide material comprises both soil and rock in non-negligible proportions, the range of the horizontal runout distance with a given probability p can be denoted as Lmin to Lmax, as shown in Equation 8:
where Lmin represents the minimum value of all L lower limits corresponding to rock or soil landslides triggered by rainfall or earthquakes, with a probability p, and Lmax represents the maximum value of all L upper limits under the same conditions. Taking small-scale landslides as an example, the processed horizontal runout distance prediction chart (derived from Figures 9a–d) is presented in Figure 11.
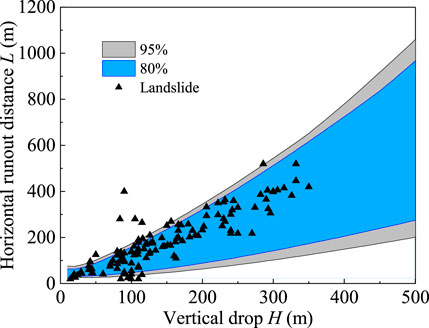
Figure 11. Distribution of small-scale landslide data in the chart.
Figure 11 shows that 119 cases of landslides (89%) fall within the 95% probability range and 110 cases (83%) within the 80% probability range in the processed horizontal runout distance prediction chart for landslides. This processed chart exhibits good reliability and enhanced applicability compared to that shown in Figure 9, making it suitable for small-scale rock or soil landslides triggered by rainfall or earthquakes.
The above discussion focuses on small-scale landslides with unknown triggers and mixed rock–soil compositions. For other landslide scenarios, Figure 9 and Equation 7 can be flexibly applied, but further elaboration is omitted here. For example, it applies to small-scale soil landslides triggered by rainfall or earthquakes (from Figures 9b,d) and medium-scale mixed soil–rock landslides triggered by earthquakes (from Figures 9g,h).
6 Engineering application
6.1 Large landslide cases
To validate the applicability and reliability of the MC–SVR-based horizontal runout distance prediction chart in practical engineering and illustrate its usage, the Zhonghaicun landslide is used as a case study to demonstrate early warning and disaster prevention measures (Ye et al., 2021).
On 21 August 2020, a rainfall-induced landslide occurred in Zhonghaicun, Fuquan Town, Hanyuan County, Sichuan Province, with a maximum horizontal runout distance of approximately 600 m, as shown in Figure 12. Located at 102°41′40″E, 29°20′30″N in China, Zhonghaicun features abundant rainfall and active seismic activity. The Zhonghaicun landslide primarily consists of silty clay, breccia, and block stones. Based on geological structures, its vertical drop is estimated at approximately 210 m, classifying it as a large-scale landslide. Considering the potential triggers of rainfall and earthquakes and the mixed rock–soil composition, the horizontal runout distance prediction chart for large-scale landslides derived from Figures 9i–l indicates a 95% probability range of 439 m–893 m and an 80% probability range of 491 m–721 m, which are set as the early warning ranges for this landslide disaster.
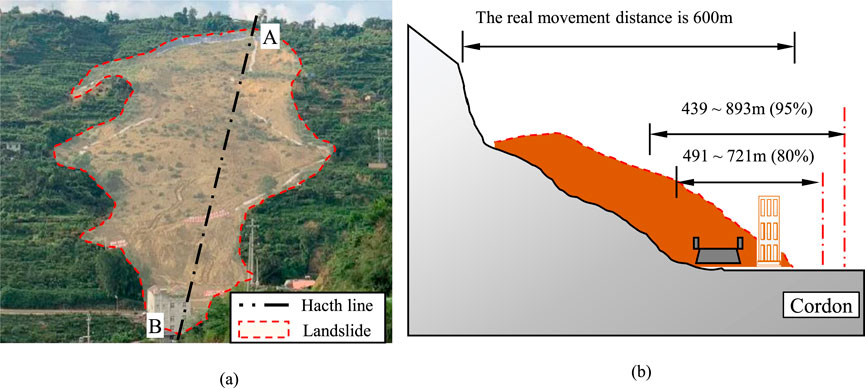
Figure 12. Landslide area and section map: (a) landslide area; (b) landslide profile.
Figure 12a illustrates the extensive impact area and significant hazard of the Zhonghaicun landslide. Figure 12b presents the cross-sectional view of the landslide, where the actual horizontal runout distance falls within both the 95% and 80% probability prediction ranges, with additional safety margins. It could have significantly reduced casualties and losses if early warning and disaster prevention measures had been implemented based on the 80% or 95% probability prediction ranges. Based on the above analysis, the horizontal runout distance probability range chart presented in this study demonstrates simplicity, high accuracy, and strong applicability, providing valuable support for early warning and disaster prevention of landslide hazards.
6.2 Small landslide cases
In June 2019, Longchuan County in Guangdong Province experienced sustained heavy rainfall, affecting 352 villages across 24 towns. Mibei Village was one of the hardest-hit areas, suffering extensive landslides that damaged houses, roads, bridges, and utilities. The landslides in Mibei Village had a large distribution range, affecting multiple landslide bodies and posing significant threats to many people. The landslides occurred in a hilly terrain characterized by steep, conical peaks and numerous “V”-shaped valleys. The terrain is highly dissected, with elevation differences of 100–200 m and slopes of 40°–45°. The slope area primarily consists of residual slope deposits of silty clay, sandy clay, and fully weathered granite, which are moderately weakly permeable with poor water retention.
Figure 13 shows the 3D geological model of Mibei Village, with red markers indicating the landslide locations. Based on the estimated volume, most of the slope failures in this area are small-scale. The internal slopes here are small landslides triggered by rainfall, composed of a mix of soil and rock materials. The vertical drop of the slopes obtained from the 3D model is used in Figure 11 to generate the results shown in Table 5. In the table, the actual sliding distances for L1, L2, and L4 exceed the 80% confidence interval for landslide distances but are within the 95% confidence interval.
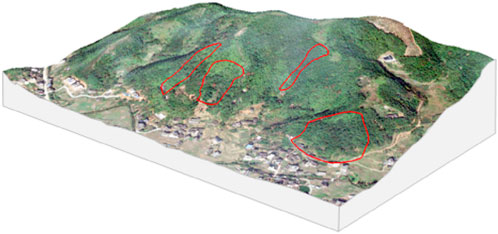
Figure 13. Three-dimensional geologic model map of Mibei village. A 3D topographic model of a hilly, forested area with three regions outlined in red. The foreground shows a scattered settlement with houses and roads at the base of the hills.

Table 5. Comparison of predicted and true horizontal runout distances of the landslide.
Figure 14 shows a comparison of satellite images before and after the landslide. Figure 14a shows the satellite image before the landslide, while Figure 14b shows the image after the landslide. By combining the data from Table 5 with the pre-landslide satellite image, the landslide location and actual length were determined. In the image, the yellow dashed line represents the 80% horizontal sliding distance and the red dashed line represents the 95% horizontal sliding distance. As shown in Figure 14a, some buildings in the L4 area fall within the 95% confidence interval, indicating that they were affected by the landslide. Figure 14b shows the satellite image of the village after the post-disaster repairs. It is evident that some landslides have been reinforced, and buildings within the 95% landslide probability area have been relocated. This demonstrates that the method proposed in this study can quickly determine the horizontal runout distance of potential landslides, estimate the potential threat, and facilitate the selection of building sites in hazardous areas.
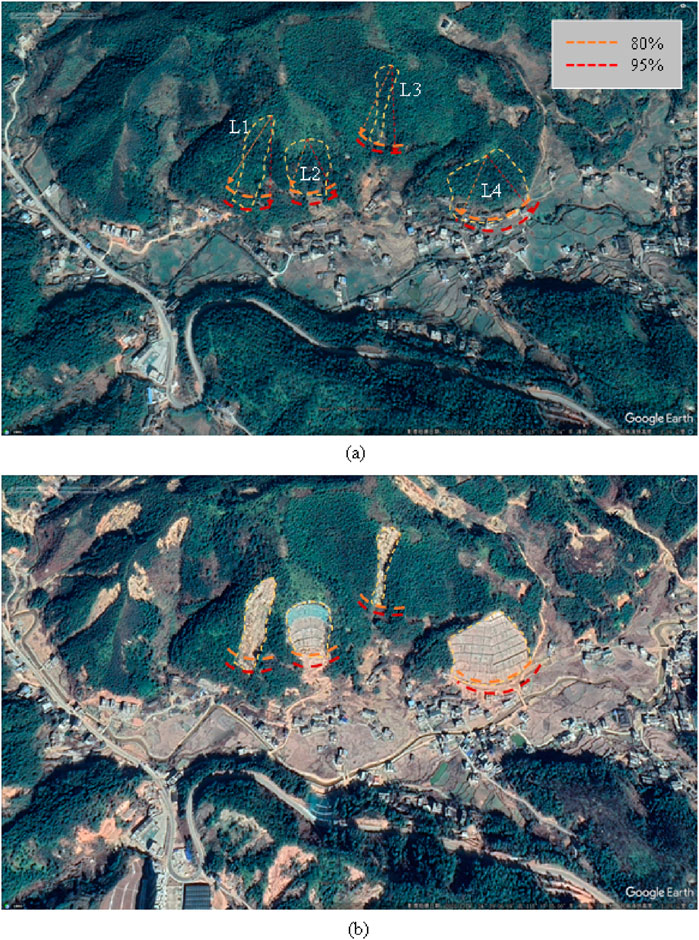
Figure 14. Comparison of satellite images before and after the landslide in Mibei village. (a) Before landslides; (b) After landslides. Two satellite images depicting landslide risk zones in a hilly area. In image (a), areas L1, L2, L3, and L4 are marked with dashed lines, highlighting 80% (orange) and 95% (red) risk levels. In image (b), similar risk indicators highlight the same geographic location from a slightly different angle. Surrounding the marked zones are vegetation, a road, and clustered buildings.
7 Discussion and challenges
This study presents a method for predicting the horizontal distance of slope landslides based on SVMs and MC simulation. A total of 424 landslide cases of various types were collected and analyzed, and predictive charts for the horizontal landslide distance under different landslide volume categories were developed to facilitate easy reference and use by engineers. However, several challenges were encountered during the research process. For instance, most existing studies categorize slopes into soil slopes and rock slopes, with limited attention given to mixed soil–rock slopes. Additionally, the dataset used in this study was imbalanced in terms of landslide types—for example, there were only a few cases of small-scale rainfall-induced rock landslides—leading to insufficient samples under certain conditions during model training. This, in turn, negatively affected the prediction performance. Therefore, future research should focus on constructing a more comprehensive and balanced slope landslide database to avoid overfitting or underfitting in specific landslide categories. Despite these challenges, this study represents an exploratory effort toward developing a simple and efficient landslide reference chart. Future work will focus on further expanding the database and developing more practical tools based on this foundation.
8 Conclusion
Based on the parameter analysis of the established landslide data, this paper investigates the effects of the training set-to-prediction set ratio, kernel function type, and parameter c and g values on the predictive performance of the SVR model. Subsequently, a landslide horizontal runout distance prediction model based on MC–SVR is proposed, and a prediction diagram for landslide horizontal runout distance is developed. The accuracy of the model and the convenience and applicability of the diagram are validated through engineering case studies. The main conclusions are as follows:
1. The parameter analysis indicates that there is a certain correlation between landslide triggers, landslide material, landslide volume, landslide slope angle, vertical runout distance, and horizontal runout distance.
2. In the SVR model, the ratio of the training set to the prediction set, the type of kernel function, and the values of parameters c and g have a significant impact on the prediction results. In particular, the larger the proportion of the training set, the better the prediction results. The RBF kernel function performs better than the linear and sigmoid kernel functions; parameters c and g are crucial factors influencing model performance.
3. Considering parameter uncertainty, it is found through the established landslide database that the slope angle conforms relatively well to a normal distribution, and the landslide volumes of small, medium, large, and giant landslides generally follow a log-normal distribution.
4. The MC–SVR model can provide the probability density distribution of the landslide horizontal runout distance. Validation demonstrates that the prediction results are highly accurate and reliable.
5. The developed prediction diagram for the landslide horizontal runout distance can quickly determine the probability range of the horizontal runout distance for landslides triggered by earthquakes or rainfall in rock or soil. Case studies demonstrate that the prediction diagram can provide strong support for landslide early warning and disaster prevention.
Data availability statement
The original contributions presented in the study are included in the article/supplementary material; further inquiries can be directed to the corresponding authors.
Author contributions
JK: Writing – original draft, Conceptualization, Data curation, Resources. ZX: Software, Validation, Visualization, Writing – original draft, Writing – review and editing. ShZ: Formal Analysis, Investigation, Methodology, Software, Writing – original draft. LS: Conceptualization, Data curation, Formal Analysis, Writing – review and editing. SuZ: Funding acquisition, Methodology, Supervision, Validation, Writing – original draft.
Funding
The author(s) declare that financial support was received for the research and/or publication of this article. The work presented in this paper was financially supported by the Science and Technology Infrastructure Program of Guizhou Province (2020-4Y047), the Science and Technology Program of Guizhou Provincial Department of Transportation (2025-112-018; 2023-312-030), and the Postgraduate Scientific Research Innovation Project of Hunan Province (CX20240432).
Conflict of interest
Author LS was employed by Guizhou Quality and Safety Traffic Engineering Monitoring and Testing Center Co. Ltd.
The remaining authors declare that the research was conducted in the absence of any commercial or financial relationships that could be construed as a potential conflict of interest.
Generative AI statement
The author(s) declare that no Generative AI was used in the creation of this manuscript.
Any alternative text (alt text) provided alongside figures in this article has been generated by Frontiers with the support of artificial intelligence and reasonable efforts have been made to ensure accuracy, including review by the authors wherever possible. If you identify any issues, please contact us.
Publisher’s note
All claims expressed in this article are solely those of the authors and do not necessarily represent those of their affiliated organizations, or those of the publisher, the editors and the reviewers. Any product that may be evaluated in this article, or claim that may be made by its manufacturer, is not guaranteed or endorsed by the publisher.
References
Balogun, A. L., Rezaie, F., Pham, Q. B., Gigović, L., Drobnjak, S., Aina, Y. A., et al. (2021). Spatial prediction of landslide susceptibility in western Serbia using hybrid support vector regression (SVR) with GWO, BAT and COA algorithms. Geosci. Front. 12 (3), 101104. doi:10.1016/j.gsf.2020.10.009
Chang, W., Xing, A., Wang, P., Zhuang, Y., Jin, K., He, J., et al. (2021). Analysis of dangchuan 5# landslide on january 27, 2021, in yongjing county, Gansu Province, China. Landslides 18 (11), 3615–3628. doi:10.1007/s10346-021-01743-0
Chen, H. X., Zhang, L., Gao, L., Zhu, H., and Zhang, S. (2015). Presenting regional shallow landslide movement on three-dimensional digital terrain. Eng. Geol. 195, 122–134. doi:10.1016/j.enggeo.2015.05.027
Corominas, J., van Westen, C., Frattini, P., Cascini, L., Malet, J. P., Fotopoulou, S., et al. (2014). Recommendations for the quantitative analysis of landslide risk. Bull. Eng. Geol. Environ. 73 (2), 209–263. doi:10.1007/s10064-013-0538-8
Dai, F. C., Lee, C. F., and Ngai, Y. Y. (2002). Landslide risk assessment and management: an overview. Eng. Geol. 64 (1), 65–87. doi:10.1016/S0013-7952(01)00093-X
Du, Y., Xie, M., and Jia, J. (2020). Stepped settlement: a possible mechanism for translational landslides. Catena 187 (November 2019), 104365. doi:10.1016/j.catena.2019.104365
Fan, X. M., Xu, Q., Zhang, Z. Y., Meng, D. S., and Tang, R. (2009). The genetic mechanism of a translational landslide. Bull. Eng. Geol. Environ. 68 (2), 231–244. doi:10.1007/s10064-009-0194-1
Fan, X. Y., Qiao, J. P., Han, M., and Zeng, Y. X. (2012). Volumes and movement distances of earthquake and rainfall-induced catastrophic landslides. Rock Soil Mech. 7598 (41272297). doi:10.16285/j.rsm.2012.10.016
Fan, X., Xu, Q., Scaringi, G., Dai, L., Li, W., Dong, X., et al. (2017). Failure mechanism and kinematics of the deadly June 24th 2017 xinmo landslide, maoxian, sichuan, China. Landslides 14 (6), 2129–2146. doi:10.1007/s10346-017-0907-7
Gao, Z. N., Yao, L. K., Xu, G. X., and Wang, G. J. (2007). Researches on evolution of sliding surface with pattern dynamics. Chin. J. Geotechnical Eng. 29 (6), 866–871.
Guo, C. B., Zhang, Y. S., Zhou, N. J., and Zhang, R. D. (2014). Operating state assessment of the geohazard prevention and control projects in wenchuan earthquake regiong A case study of Weiba landslide in Pingwu county. Geoscience 28 (2).
Guzzetti, F., Melillo, M., Calvello, M., Pecoraro, G., and Mondini, A. C. (2024). Independent demonstration of a deep-learning system for rainfall-induced landslide forecasting in Italy. Landslides 21 (9), 2171–2178. doi:10.1007/s10346-024-02294-w
Huang, Y., and Zhao, L. (2018). Review on landslide susceptibility mapping using support vector machines. Catena 165 (March), 520–529. doi:10.1016/j.catena.2018.03.003
Li, D., Miao, F., Xie, Y., and Leo, C. (2019). Hazard prediction for baishuihe landslide in the three gorges reservoir during the extreme rainfall return period. KSCE J. Civ. Eng. 23 (12), 5021–5031. doi:10.1007/s12205-019-1025-y
Lu, M., Zhang, J., and Wen, S. C. (2020). Probabilistic model for prediction of seismic landslide travel distance. J. Disaster Prev. Mitig. Eng. 40 (1).
Marin, R. J., and Mattos, Á. J. (2020). Physically-based landslide susceptibility analysis using Monte Carlo simulation in a tropical mountain basin. Georisk 14 (3), 192–205. doi:10.1080/17499518.2019.1633582
Ouyang, C., He, S., and Tang, C. (2015). Numerical analysis of dynamics of debris flow over erodible beds in Wenchuan earthquake-induced area. Eng. Geol. 194, 62–72. doi:10.1016/j.enggeo.2014.07.012
Peethambaran, B., Anbalagan, R., Kanungo, D. P., Goswami, A., and Shihabudheen, K. V. (2020). A comparative evaluation of supervised machine learning algorithms for township level landslide susceptibility zonation in parts of Indian Himalayas. Catena 195 (January), 104751. doi:10.1016/j.catena.2020.104751
Pham, B. T., Nguyen-Thoi, T., Qi, C., Phong, T. V., Dou, J., Ho, L. S., et al. (2020). Coupling RBF neural network with ensemble learning techniques for landslide susceptibility mapping. Catena 195 (March), 104805. doi:10.1016/j.catena.2020.104805
Qi, S., Xu, Q., Zhang, B., Zhou, Y., Lan, H., and Li, L. (2011). Source characteristics of long runout rock avalanches triggered by the 2008 Wenchuan earthquake, China. J. Asian Earth Sci. 40 (4), 896–906. doi:10.1016/j.jseaes.2010.05.010
Sun, Y. J., and Song, E. X. (2018). Dynamic simulation of “12·20”Shenzhen landslide. Chin. J. Geotechnical Eng. 40 (3), 441–448. doi:10.11779/CJGE201803007
Valagussa, A., Marc, O., Frattini, P., and Crosta, G. B. (2019). Seismic and geological controls on earthquake-induced landslide size. Earth Planet. Sci. Lett. 506, 268–281. doi:10.1016/j.epsl.2018.11.005
Wu, R. A., Zhang, Y. S., Guo, C. B., Yang, Z. H., Ren, S. S., and Chen, P. (2018). Reactivation characteristics and hazard prediction of shangyaogou ancient landslide in songpan county of sichuan Province. Chin. J. Geotechnical Eng. 40 (9), 1659–1667. doi:10.11779/CJGE201809012
Ye, F., Fu, W. X., Zhou, H. F., Liu, Y., Ba, R. J., and Zheng, S. (2021). The “8·21” rainfall-induced Zhonghaicun landslide in Hanyuan County of China: surface features and genetic mechanisms. Landslides 18 (10), 3421–3434. doi:10.1007/s10346-021-01722-5
Zhang, W., Wang, X., Hong, X., Chen, S., Ji, J., and Gao, Y. (2024). Run-out distance analysis and impact force estimation for an actual landslide with multiple-barrier system based on a coupled SPH model. Comput. Geotechnics 170, 106330. doi:10.1016/j.compgeo.2024.106330
Zhao, X., Chen, W., Tsangaratos, P., and Ilia, I. (2024). Evaluating landslide susceptibility: the impact of resolution and hybrid integration approaches. Geomatics, Nat. Hazards Risk 15 (1), 2409198. doi:10.1080/19475705.2024.2409198
Zhao, X., Chen, W., Tsangaratos, P., Ilia, I., and He, Q. (2025). Landslide spatial prediction using data-driven based statistical and hybrid computational intelligence algorithms. Geocarto Int. 40 (1), 2507919. doi:10.1080/10106049.2025.2507919
Keywords: landslide runout distance, support vector regression for landslide, Monte Carlo, predictive charts, slope
Citation: Kang J, Xu Z, Zhou S, Sha L and Zhou S (2025) Development of predictive charts for landslide runout based on Monte Carlo simulation and support vector regression. Front. Earth Sci. 13:1666554. doi: 10.3389/feart.2025.1666554
Received: 15 July 2025; Accepted: 28 August 2025;
Published: 24 September 2025.
Edited by:
Wentao Yang, Beijing Forestry University, ChinaReviewed by:
Liu Yang, Kunming University of Science and Technology, ChinaXia Zhao, Xi’an University of Science and Technology, China
Zhenqi Song, Central South University, China
Copyright © 2025 Kang, Xu, Zhou, Sha and Zhou. This is an open-access article distributed under the terms of the Creative Commons Attribution License (CC BY). The use, distribution or reproduction in other forums is permitted, provided the original author(s) and the copyright owner(s) are credited and that the original publication in this journal is cited, in accordance with accepted academic practice. No use, distribution or reproduction is permitted which does not comply with these terms.
*Correspondence: Zhiwen Xu, eHV6aGl3ZW5AaG51LmVkdS5jbg==; Suhua Zhou, emhvdXN1aHVhQGhudS5lZHUuY24=