 Ryan Bailey
 Nick Varley
 Matthew Blackett2
- 1Department of Earth Sciences, Durham University, Durham, United Kingdom
- 2School of Engineering and Environment, Coventry University, Coventry, United Kingdom
- 3Colima Intercambio e Investigación en Vulcanología (CIIV), Facultad de Ciencias, Universidad de Colima, Colima, Mexico
Scoria cones represent the most abundant volcanic landforms on Earth, commonly formed by mafic eruptions that produce scoria and lava during short-lived, low-volume events. Their morphology exhibits considerable variability, influenced by eruption style, tectonic setting, and post-emplacement modification. Morphometric analysis of scoria cones is critical for understanding magmatic system evolution, eruptive processes, tectonic controls, age estimation, erosional history, climate influences, hazard assessment, and paleo-reconstruction. Early studies relied on manual topographic measurements and formula-based methods to reconstruct cone geometry, but these approaches are highly sensitive to irregular morphologies and subjective parameter selection. The advent of satellite imagery, high-resolution Digital Elevation Models (DEMs), and semi-automated algorithms has revolutionised scoria cone analysis, enabling more precise and reproducible morphometric characterisations. Despite these advancements, persistent inconsistencies arise from differences in DEM resolution, cone boundary identification, and methodological choice, each contributing to uncertainty in results. The lack of a standardised methodological framework hampers direct comparison between studies and limits the reliability of derived parameters. This review synthesises current methodologies and datasets for scoria cone morphometry across diverse geomorphological, tectonic, and volcanic environments, aiming to clarify the strengths and limitations of each approach and to guide future research toward best practices in scoria cone analysis.
1 Introduction
Scoria (cinder) cones are the most common volcanic landform, typically forming conical landforms through the accumulation of scoriaceous ash, lapilli, and blocks during Strombolian, Hawaiian, phreatomagmatic, or sub-Plinian eruptions (Houghton et al., 2004; Kereszturi and Németh, 2012b) (Figure 1). Scoria cones may occur as isolated features, as spatially clustered vents within volcanic fields, such as the Michoacan-Guanajuato Volcanic Field, Mexico (Hasenaka and Carmichael, 1985), (often aligned along tectonic structures), or as parasitic cones on the flanks of larger stratovolcanoes or shield volcanoes, such as Mt. Etna, Italy (Favalli et al., 2009), Figure 2. They are often characterised by brief eruptions (days to years) and small volumes (typically <1 km3), and are globally widespread (Wood, 1980b; Kereszturi and Németh, 2012a; Németh and Kereszturi, 2015; Zhang et al., 2023). While most scoria cones are monogenetic, such as Paricutín, Mexico (Inbar et al., 1994), which erupted over 9 years, some exhibit polygenetic behaviour, with repeated eruptions over centuries (e.g., Hill et al., 1998). Scoria cones exhibit a wide range of morphologies and are often classified by shape types, which have been extensively defined by Dóniz-Páez (2015) and Bemis and Ferencz (2017), such as ring-shaped or ideal, gully, horseshoe, tilted, crater row or multiple volcanoes, parasitic, as well as amorphous or without crater. The diversity of scoria cone morphologies reflects a complex interplay of eruptive dynamics, magma composition, and post-emplacement modification, as highlighted by Németh and Kereszturi (2015).
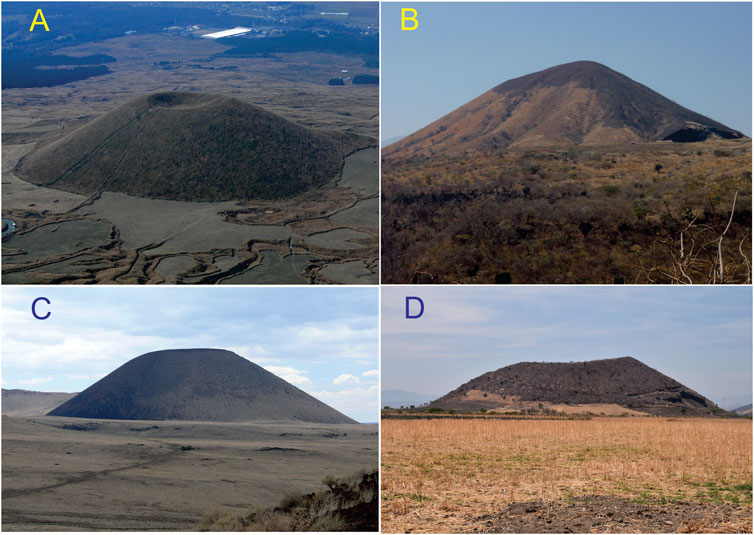
Figure 1. Examples of scoria cones. (A) Komezuka cone, Aso Japan. (B) El Molcajete, Nayarit, Mexico. (C) SP Crater, Arizona, USA. (D) Telcampana, Colima Volcanic Complex, Mexico.
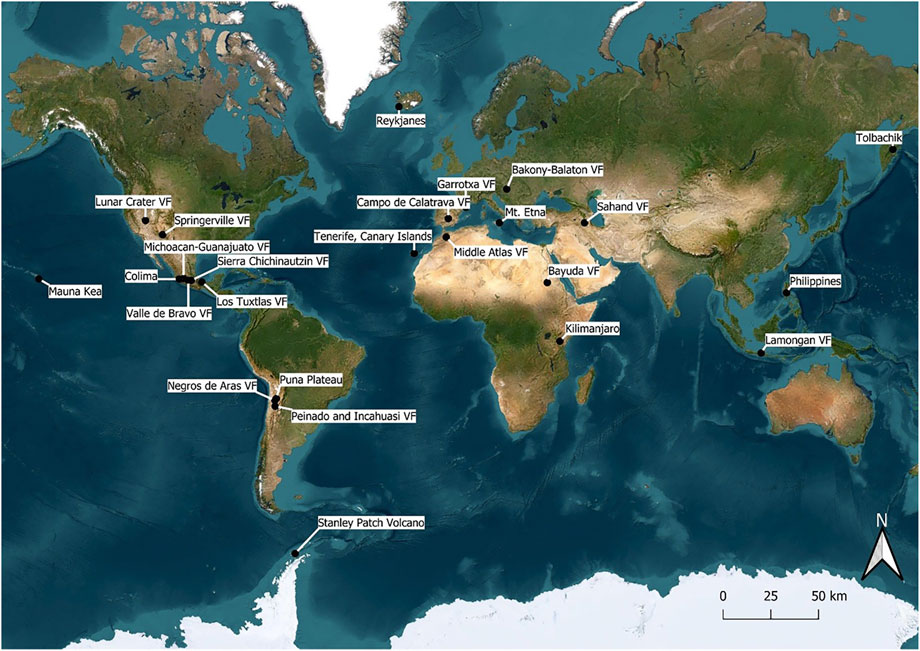
Figure 2. Overview map of volcanic regions mentioned within the text.
Given their abundance and global distribution, scoria cones can be a significant hazard to human life, particularly because the timing and location of future eruptions remain unpredictable, e.g. Cumbre Vieja, La Palma, Canary Islands in 2021, where the associated eruption occurred just a short distance from nearby towns destroying 2,800 buildings (Carracedo et al., 2022); or the eruption of Volcan de Paricutin, Michoacan from 1943 to 1952, which occurred on a farmers field near the village of San Juan Parangaricutiro (Inbar et al., 1994) The study of scoria cones is therefore not only of academic interest but also of practical importance for hazard assessment and risk mitigation.
Morphometric analysis of scoria cones provides valuable insights into volcanic growth and degradation, erosional processes, tectonic stress fields, eruption characteristics, and the accuracy of Digital Elevation Models (DEMs) while also facilitating statistical forecasting of future eruptions and reconstruction of volcanic histories (e.g. Zhang et al., 2023; Pedrazzi et al., 2024; Kereszturi et al., 2025, and references therein). However, the proliferation of global DEM datasets has led to increased methodological variability, with morphometric parameters now derived through both traditional formula-based (manual) approaches and modern DEM-based (automated or semi-automated) techniques. While formula-based methods remain in use (e.g., Haag et al., 2019; Beccerra-Ramirez et al., 2022; Sieron et al., 2023), DEM-based approaches offer greater objectivity and reproducibility (Grosse et al., 2012; Euillades et al., 2013; Zarazúa-Carbajal and De la Cruz-Reyna, 2020). Nonetheless, significant discrepancies persist, particularly for small cones (<30 × 106 m3) when using coarse-resolution DEMs (>30 m; Fornaciai et al., 2012; Kereszturi et al., 2012; Zhang et al., 2022) due to differences in boundary definition, data accuracy, and methodological choice.
Given these challenges, there is a pressing need to review current methods and datasets for scoria cone morphometry, to identify sources of variability, and to establish best practices for future research. This review aims to synthesise existing knowledge, highlight methodological advances, and provide recommendations for the most appropriate approaches to scoria cone morphometric analysis in varied geological and environmental settings.
2 Digital elevation model resolution effects on scoria cone morphometric analysis
The choice of data collection is the first determining factor for scoria cone morphometric analysis. Early morphometric studies relied primarily on topographic maps with varying scales and contour intervals, ranging from detailed 1:24,000 maps with 40-foot (12.2 m) elevation contour intervals at Mauna Kea, Hawaii to broader-scale 1:125,000 maps with 500-foot (152 m) intervals at Kilimanjaro, Tanzania, where cone dimensions were manually extracted from profile measurements (Scott and Trask, 1971; Settle, 1979; Wood, 1980a). This traditional approach was constrained by limited spatial resolution and subjective interpretation of topographic features.
The introduction of DEMs fundamentally transformed morphological analysis capabilities, allowing for more comprehensive and quantitative techniques for scoria cone characterisation, these include:
- Global satellite-derived DEMs: ASTER Global Digital Elevation Model (GDEM) (30 m spatial resolution), Advanced Land Observing Satellite (ALOS) PALSAR (30 m spatial resolution), Shuttle Radar Topography Mission (SRTM) (30-90 m spatial resolution), and TanDEM-X (12 m and 30 m spatial resolution)
- Regional high-resolution DEMs: TINITALY, Italy (10 m spatial resolution) and USGS National Elevation Dataset (NED), USA (10 m spatial resolution)
- LiDAR-derived DEMs: High-resolution topographic data (<2 m spatial resolution)
- Digitised topographic data: Historic topographic maps converted to digital format
2.1 Spatial resolution impact on morphometric parameter accuracy
The spatial resolution of DEMs significantly influences the precision and accuracy of calculated morphometric parameters. Kervyn et al. (2008) compared SRTM to ASTER DEM, analysing the variability of resolution on morphometric parameters, using both modelled theoretical cones and global scoria cone fields. They found, for a regularly shaped cone on a flat surface, that error in height increases from 1 m using 10 m spatial resolution, to between a 4%-8% underestimate using 90 m spatial resolution. Width similarly increases in error from 10 m, to a 4.1% overestimate, and a 12.8% overestimate, using 10 m, 30m, and 90 m spatial resolutions respectively. These errors are further amplified with the introduction of a 7° underlying slope. Height increases in error from <5 m to an 8.2% underestimate and up to a 40% underestimate using 10 m, 30 m, and 90 m spatial resolutions respectively.
The study emphasized that over- and underestimation correlates directly with DEM resolution, slope steepness, and the sharpness of topographic breaks. This was tested on a sample of 40 Mauna Kea scoria cones for cone height, revealing that 90 m SRTM DEM products are inadequate for analysing smaller-scale features (<100 m in height), with identification challenges arising when DEM resolution exceeds one-third of the feature size (Table 1).
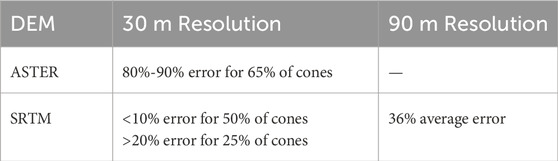
Table 1. Error in height with varying DEMs on Mauna Kea scoria cones (Kervyn et al., 2008).
Subsequent investigations by Fornaciai et al. (2012) expanded these analyses by comparing 2 m LiDAR data with 10 m TINITALY DEM, 10 m USGS National Elevation Dataset (NED), and 30-m ASTER DEMs. Their results demonstrated that ASTER DEM exhibits a Root Mean Square Error (RMSE) for height of 21.1 m, translating to approximately 21% average error for 100 m high scoria cones. This analysis established that 30 m ASTER DEM should only be employed for cones with volumes exceeding 30 × 106 m3, where relative error decreases below 20%.
Zarazúa-Carbajal and De la Cruz-Reyna (2021) further investigated DEM resolution impacts on morphological analysis, specifically targeting their Average Erosion Index (AEI) model for scoria cone degradation chronology. Their research confirmed that smaller-volume cones (<0.01 km3) cannot be accurately analysed using 12 m resolution DEMs, particularly for edifices situated on inclined terrain where vertical precision is most critically affected.
Zhang et al. (2022) assessed free global DEM accuracy (SRTM 30 m; ALOS AW3D30 30 m) across multiple volcanic fields, using a 12 m spatial resolution DEM as reference. Their analysis revealed average volume errors of 4.5%–7.4% for the SRTM DEM products, with cones smaller than 5 × 10⁶ m3 exhibiting volume errors ranging from 5.4% to 20.5%. The AW3D30 DEM demonstrated improved performance with average errors of 2.8%–4.5% for volume, 3.1%–8.3% for height, and 2.5%–6.2% for slope angle measurements. Additionally, pre-eruption surface flatness significantly affects accuracy, with SRTM-based pre-eruptive surface modelling yielding volume errors of 16.3% using average height methods or 30.6% using Triangulated Irregular Network (TIN) interpolation approaches. However, Zhang et al. (2022) did not consider the TanDEM-X 30 m global DEM, which can be used for morphometric studies. Van Wees et al. (2024) compared the TanDEM-X 30 m DEM to ALOS, ASTER, and SRTM 30 m DEMs for 16 stratovolcanoes, with relative standard deviations (RSD) between 0.13% and 2.03% for morphometric parameters. However, it is uncertain how the errors scale to smaller volume scoria cones.
2.2 DEM selection guidelines and methodological considerations
Despite potential accuracy limitations for resolutions exceeding 30 m, diverse DEM products continue to be employed in cone morphology studies, Figure 3 (Supplementary Data 1).
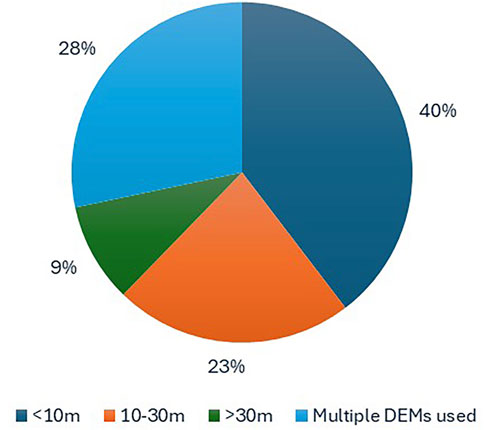
Figure 3. Proportion of studies that used the various resolution DEMs (Total studies: 53).
The freely available, near-global AW3D30 DEM proves suitable for basic morphometric analysis of larger scoria cones (>100 m height) where high precision is not required, such as cone shape or size categorisations or analysing elongation for tectonic-based studies. However, detailed investigations on a cone-by-cone analysis, such as volcanic processes or age inference from morphometric parameters, necessitate DEMs with spatial resolutions better than 30 m to minimise error propagation and preserve critical topographic details such as crater rims, crater depths and abrupt slope transitions, such as the 12 m TanDEM-X DEM.
A critical limitation in existing accuracy assessments concerns the lack of quantification of methodological errors in width, height, and boundary delineation calculations. The comparative impact of these methodological differences on overall accuracy remains poorly constrained. Furthermore, studies have yet to adequately quantify external factors influencing DEM error, including cone morphological irregularity, pre-eruptive topography, and vegetation cover effects. Extreme differences between DEM products may partially result from dense vegetation coverage affecting surface detection capabilities. It is worth noting that the DEM vertical resolution, data source, and the possible artifacts should be considered during the selection process of DEMs.
3 Base delimitation in scoria cone morphometry
Accurate identification of scoria cone boundaries represents a critical methodological step in morphometric analysis, as most parameters (height, slope, volume) depend fundamentally on precise base delineation. Boundary delimitation errors can cascade through subsequent analyses, affecting volume calculations, slope angle determinations, and age estimates based on morphometric degradation models. Two primary approaches dominate the literature: manual delineation (e.g. Wood, 1980a; Favalli et al., 2009; Zhang et al., 2023) and semi-automatic to automatic algorithms (e.g. Howell et al., 2012; Grosse et al., 2012; Euillades et al., 2013; Di Traglia et al., 2014).
3.1 Manual delineation methods
The manual approach represents the most widely employed method for identifying scoria cone boundaries, involving analysis of slope breaks and topographic discontinuities that distinguish volcanic edifices from surrounding terrain (e.g. Scott and Trask, 1971; Favalli et al., 2009; Haag et al., 2019). This user-dependent method analyses slope breaks using:
• Linear topographic profiles extracted from DEMs or topographic maps
• Slope and aspect derivative maps highlighting topographic breaks
• Contour line analysis identifying morphological discontinuities
Early morphometric studies frequently included debris aprons within cone boundaries (Hasenaka and Carmichael, 1985; Sucipta et al., 2006), however Grosse et al. (2012) suggested that delimitation should not include debris aprons due to a lack of clear morphometric signature. To reduce subjectivity, researchers have implemented:
• Field validation (Sucipta et al., 2006; Inbar et al., 2011; Kereszturi et al., 2013a)
• Slope thresholds (3.5°: Fornaciai et al., 2012; 5°; Gilichinsky et al., 2010; Inbar et al., 2011)
Van Wees et al. (2024) conducted a comprehensive assessment of delimitation uncertainty by having seven volcano geomorphology experts manually outline 16 composite volcanic edifices using 30-m SRTM DEMs. Initial delineations were performed using only topographic data, followed by a second round 6 months later incorporating slope thresholds ranging from 1° to 6°. Results demonstrated that a 3° slope threshold achieved >50% inter-analyst consensus, significantly improving boundary consistency and reducing subjective variation. It is key that such studies are expanded to include smaller-volume scoria cones across various volcanic settings, where the impact of DEM resolution may pose as an additional challenge to identifying cone boundaries.
The manual topographic method for base delimitation remains highly subjective and is largely dependent on the resolution of the DEM, satellite imagery accuracy, surrounding vegetation, surrounding topography and the irregularity of the scoria cones morphology from flank collapse or lava flow burial. It can become unclear where the edifice of a scoria cone starts and ends, and deviations in boundaries can cause outlier values of morphometric parameters. The extent to which the user-defined identification of scoria cone bases influences derived morphometric parameters remains unresolved in the literature, particularly for cones whose bases are difficult to delineate within complex surrounding topography. However, it is safe to assume that care has been taken during base delimitation, and future studies should continue to apply multiple methods (e.g. field confirmation, satellite imagery, orthophotos, slope thresholds) to identify the base of a scoria cone, particularly when using courser DEM resolutions. Furthermore, following Van Wees et al. (2024) using a slope threshold of 3° can support delimitation and progress to an agreed consensus on methodology.
3.1.1 Complex cone and crater outlines
Scoria cones can exhibit complex shapes where the circumference of the crater or the cone is not ‘closed’ leading to horseshoe or gully shaped cones. The outlines of the crater/cone could be drawn in a variety of ways, such as following the break-of-slope of the cone to generate a horseshoe shape with open crater (see Dóniz-Páez, 2015) or cutting across the open crater to generate an ellipse (see Kereszturi et al., 2013a). Cones with multiple craters or coalesced cones may be interpreted as one large cone, or as separate cones with different outlines. These different interpretations would lead to significant variations in morphometric parameters, yet the approach taken is often undocumented throughout the literature. In some cases, breached cones were disregarded from datasets entirely (Fornaciai et al., 2012; Uslular et al., 2021; Sieron et al., 2023) or considered separately in the results (Kervyn et al., 2012; Benamrane et al., 2022).
3.2 Semi-automatic and automatic detection algorithms
Recognition of the subjectivity inherent in manual boundary identification has driven development of computational approaches designed to improve objectivity and consistency while reducing time requirements for large-scale morphometric studies.
3.2.1 Curvature maps
Grosse et al. (2012) developed an algorithm which combines normalized profile curvature and slope values to generate a boundary probability layer ranging from 0–1. This algorithm identifies transitions between volcanic edifices and background topography by highlighting areas where profile curvature and slope characteristics indicate topographic breaks. The algorithm is then used to manually trace around volcanic edifices, however reducing a significant amount of subjectivity, and has been applied to recent studies (e.g. Grosse et al., 2020; Paguican et al., 2021). The algorithm was originally applied to stratovolcanoes, however Di Traglia et al. (2014) applied this semi-automatic algorithm to identify scoria cone boundaries. The algorithm identified 44.3% of 309 scoria cones, while struggling to detect cones <500 m in diameter or surrounded by complex topography.
Melis et al. (2014) developed three algorithms for identifying volcanic edifices on Sardinia, Italy: Slope-Total Curvature (STC), Grosse Method (GM), Modified Grosse Method (GMod). The STC algorithm identifies breaks in slope and curvature, separating areas from strongly sloping and concave to strongly sloping and convex. The GM algorithm combines normalised profile curvature and slope values, identifying boundaries between volcanic edifices and basement topography. The GMod algorithm multiplies normalised profile curvature and slope values rather than adding them. When applied to a simple, well-preserved cone and a complex, partially eroded cone, the GMod algorithm performed effectively in constraining volcanic edifices. However, for the complex cones, geological controls (e.g. erosion and tectonics) were major constraints to delimitation.
3.2.2 Modified basal outlining algorithm (MBOA)
Howell et al. (2012) tested the performance of a Modified Basal Outlining Algorithm (Bohnensteihl et al., 2012), using 5 m and 10 m contour intervals on 30 m and 10 m DEMs in the Springerville Volcanic Field, USA. The MBOA analyses multiple radial profiles from volcanic peaks, adjusting boundary positions until shapes become more compact or slopes flatten to <25% of average slope values. Comparative analysis revealed MBOA differences of +10%, +80%, and +100% for height, area, and volume respectively compared to closed-contour algorithms, but only −4%, −4%, and +13% when compared to manually drawn outlines. Performance degraded with increasing contour intervals and coarser DEM resolution, with MBOA identifying fewer scoria cones and showing differences up to 28% compared to manual outlines. The MBOA method was used by O’Hara et al. (2020) to identify volcanic edifices in the Cascades Arc, USA, generating boundaries for 2,105 of 2,835 analysed vents, generally struggling with morphologies that cannot be distinguished from the surrounding topography and likely associated with old age.
3.2.3 NETVOLC algorithm
Euillades et al. (2013) developed the NETVOLC program for automatic volcano landform delimitation based on the premise that edifices are bounded by concave breaks in slope. The algorithm applies minimum cost flow (MCF) networks to compute optimal edifice outlines using DEMs and their first- and second-order derivatives. NETVOLC performance was evaluated using the Mauna Kea pyroclastic cone field, where results using the main cost function (considering only profile convexity and aspect) compared favourably to manually delineated outlines (from Kervyn et al., 2012) in approximately 67% of cases, with average differences in width and height parameters of 6%. For the remaining 33% of cases, alternative cost functions incorporating slope, elevation, and/or radial distance were required, introducing some degree of subjectivity.
Van Wees et al. (2024) conducted comparative analysis between manual delimitation and two NETVOLC variants: NETVOLCMAIN (utilizing profile convexity and aspect) and NETVOLCSLP (additionally incorporating slope values). Although NETVOLCSLP boundaries yielded 20% larger mean volumes than NETVOLCMAIN with highly variable results, manual and NETVOLC boundaries demonstrated agreement for numerous volcanic edifices, supporting NETVOLC as a viable option for large datasets, while requiring caution for volume and slope analyses. It is worth noting that this study was performed on larger composite volcanoes, rather than scoria cones, and results may vary.
3.2.4 Machine learning object-based methods
Recent developments have incorporated machine learning approaches to improve volcanic edifice detection accuracy. Kazemi Garajeh et al. (2022) developed a method combining Convolutional Neural Networks (CNN) and Geographical Object-Based Image Analysis (GEOBIA), utilizing slope, aspect, curvature, and flow accumulation alongside 19 object-based image segmentation parameters from Sentinel-2 imagery and a 12.5 m DEM derived from topographic maps in Sahand Volcano, Iran. The CNN and GEOBIA results were compared to geomorphological maps, ground control points, and Google Earth to validate the findings. Each landform is given a Fuzzy Synthetic Evaluation (FSE), which assigns a confidence level to the landform compared to validation sources, generating an accuracy score. This approach achieved 97.7% accuracy in the Sahand Volcano region, Iran, representing significant advancement in automated detection capabilities.
3.2.5 Advanced geometric transformation methods
Székely and Karátson (2004) introduced using Polar Coordinate Transformation (PCT) maps in volcano morphology. This method The PCT method remaps every elevation point from Cartesian coordinates (x,y) to polar coordinates (θ, r), where r represents the distance from a hypothesized volcanic centre and θ represents the angular orientation. This approach was used by Vörös et al. (2022) to aid identifying the boundary of cones and identify small-scale features of cones, such as crater breaches or multiple craters. However, the method requires careful selection of the projection centre and would likely struggle with complex shapes and multiple eruptive centres.
Semi-automatic to automatic identification of volcanic edifices can reduce subjectivity and increase both speed and efficiency compared to manual identification, particularly for global studies on scoria cone morphology. The literature reveals several persistent challenges in automated scoria cone identification. Small, degraded cones, and cones with either complex morphologies or topographic settings continue to pose difficulties for semi-/automatic algorithms. DEM resolution constraints affect detection accuracy, with trade-offs between computational efficiency and feature resolution. The need for geological context integration remains important, as purely automated methods may not distinguish between constructional volcanic features and other landforms. Hybrid approaches combining multiple data sources and analytical methods, such as the CNN-GEOBIA integration improve accuracy significantly; however, the model requires extensive training and robust data sources, which can be time-consuming and generate a heavy workload.
Future research should continue to develop automatic algorithms that combine multiple data sources and analytical methods, particularly for improve detection of small and heavily eroded cones. Semi-automatic algorithms, where volcanic centres are detected with additional manual interpretation and improvements for complex cones (e.g. fieldwork, satellite imagery, orthophotos), are likely to provide the most accurate data for calculating the morphology of scoria cones. A helpful addition would be to continue comparing the results of automatic and manual boundaries for scoria cones across multiple volcanic fields.
4 Width measurement methods in scoria cone morphometry
The width of a scoria cone is another standardised measurement in morphometric studies and can be a key parameter in understanding scoria cone degradation through height to width ratios. As all morphometric parameters, the method to calculate width has changed throughout literature, with three main methods: maximum and minimum diameters, area-derived, and averages of multiple profiles–with a few variations of these main methods.
4.1 Traditional diameter-based approaches
Early studies calculated the scoria cone width as the maximum diameter of the cone based on a simple, circular based cone (Scott and Trask, 1971; Wood, 1980a; b). Settle (1979) defined cone width (Wco) as the average of the maximum (Wmax) and minimum (Wmin) base diameters, Equation 1 and Figure 4. Clear descriptions regarding how the maximum and minimum diameters are measured is limited, particularly for an irregular shape. Some studies generate a best-fit ellipse of a cone outline, measuring the diameters as the perpendicular maximum and minimum diameters (e.g. Kereszturi et al., 2013a; Becerra-Ramírez et al., 2022). It is likely that many studies applied this method but did not provide adequate descriptions. It is worth noting that measurements of crater diameters are calculated in a similar way to the diameter of the cone, however, are more sensitive to the effects of DEM resolution and crater outlines due to the smaller size.
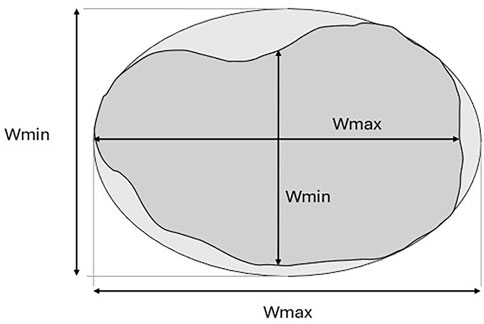
Figure 4. Diagram of calculating the width of a cone. The inner dark grey shape represents an ‘actual’ shape of a cone, measuring the max/min widths of the basal outline, and the outer light grey shape is the best-fit ellipse of the cone outline.
This methodology, representing the arithmetic mean of the major and minor axes of the cone base, continues to be employed in contemporary studies, demonstrating its enduring utility for morphometric characterisations (e.g. Pedrazzi et al., 2020; Vörös et al., 2022; Sieron et al., 2023; Azizah, 2025).
4.2 Multi-profile width calculation methods
Bemis et al. (2011) and Bemis and Farencz (2017) adapted the traditional diameter approach to accommodate irregularly shaped cones by incorporating multiple elevation profiles across the cone structure, Equation 2:
where Wco1, 2, 3, 4… Represent the widths measured along individual profiles passing through the centre of the cone and n represents the total number of profiles analysed. This approach provides enhanced characterisation of cone dimensions by sampling multiple orientations, thereby accounting for morphological irregularities that may not be captured by simple diameter measurements.
Zarazúa-Carbajal and De la Cruz-Reyna (2021) implemented a similar multi-profile methodology, calculating width across four cone and four crater profiles using the distance formula, Equation 3:
where x1, y1 and x2, y2 represent coordinates at which slope breaks occur along linear profiles. This geometric approach enables precise measurement of cone dimensions, while accounting for terrain inclination effects.
4.3 Area-derived width calculation
Favalli et al. (2009) introduced an area-based methodology that defines width from the basal area of the cone, addressing limitations of diameter-based methods when applied to irregular cone shapes, Equation 4:
This approach, which has been extensively implemented in DEM-based analyses (Grosse et al., 2012; Kervyn et al., 2012; Euillades et al., 2013; Kereszturi et al., 2013a; Grosse et al., 2020; Hunt et al., 2020; Zhang et al., 2023), reduces subjectivity in the characterisation of irregular cones by estimating width from the total basal area. The method assumes circular area equivalence, providing a standardised approach to width calculation that remains independent of cone orientation and shape complexity.
Although the area-based method reduces measurement subjectivity for irregular cones, it remains dependent on the accuracy of base delimitation procedures. The precision of this approach is fundamentally constrained by the quality of cone boundary identification, emphasising the importance of robust boundary delineation protocols.
4.4 Comparative analysis of width measurement methods
Kereszturi et al. (2013a) used both traditional and area-based methods for widths when calculating the morphometric parameters for 61 scoria cones on Tenerife, Canary Islands. Their study revealed that the Settle (1979) method, overestimates width by an average of 1.5% compared to the Favalli et al. (2009) planimetric area method, with only 10 cones registering greater than 3% difference between methods. These findings suggest that the traditional Settle (1979) method remains acceptable for width calculation, particularly for approximately circular cone shapes.
The impact of base delimitation accuracy on width measurements, calculated using area-derived methodologies, was demonstrated by Euillades et al. (2013), who documented width differences up to 33% (average difference of 6%) between manually drawn and algorithm-derived cone outlines. This substantial variation emphasizes the critical importance of accurate cone boundary identification when deriving width measurements, particularly when employing area-based methodologies.
DEM resolution effects on width calculations were quantified by Fornaciai et al. (2012), who calculated width errors ranging from 3% to 16% for 30 m resolution ASTER DEMs across multiple volcanic fields when compared to 10 m resolution datasets. These resolution-dependent errors are likely due to the differences in determined cone basal outlines and highlight the importance of appropriate DEM selection for accurate width characterisation.
Di Traglia et al. (2014) attempted to combine both the methods of Settle (1979) and Favalli et al. (2009) to calculate a ‘mean’ width, alongside calculating width related to the circumference of the cone, Equation 5, although neither method has been used by any subsequent study:
where crf is the diameter of a circumference equivalent to the perimeter of the cone.
So long as the outline of the cone base is correctly and accurately identified, and an appropriate DEM or topographic map is chosen, the method chosen to calculate width is unlikely to cause significant errors. However, future studies should attempt to properly quantify the differences between each method and the impact they may have on height to width ratios, similar to Favalli et al. (2009). However, a key aspect to consider when comparing recently estimated widths to those from older studies is that they often included the debris apron of volcanic material in calculated widths (Hooper, 1995; Hooper and Sheridan, 1998; Sucipta et al., 2006). It was recommended by Grosse et al. (2012) that far reaching debris aprons should not be included in measurements.
5 Height measurement methods in scoria cone morphometry
The quantification of scoria cone height represents a fundamental parameter in morphometric analysis, yet significant methodological variations exist in how researchers calculate this critical dimension. These differences in measurement approaches have substantial implications for the accuracy, reproducibility, and interpretability of morphometric studies, particularly those aimed at understanding volcanic processes and estimating cone ages. Height calculation methodologies can be categorised into two main approaches: formula-based methods and DEM interpolation-based techniques.
5.1 Formula-based height calculation methods
Early morphometric studies employed relatively straightforward measurement techniques constrained by available data sources. The classical approach, first systematized by Settle (1979), defined cone height (Hco) as the elevation difference between the summit of the scoria cone and its base, where the basal elevation was calculated as the mean of the highest and lowest basal values (Equation 6; Figure 5)
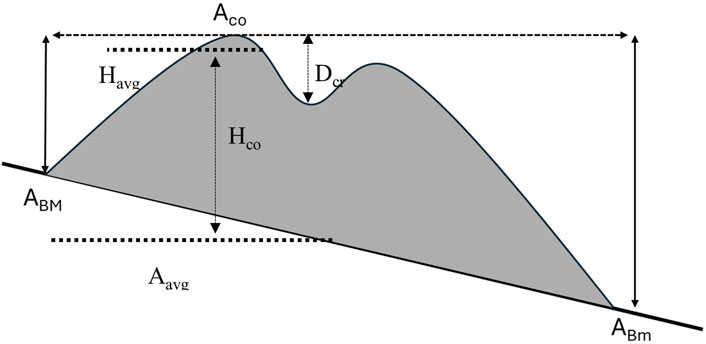
Figure 5. A schematic diagram of calculating height using the Settle (1979) method and Kervyn et al. (2008), Kervyn et al. (2012) (modified from Becerra-Ramirez et al. (2022)).
Aco represents the maximum altitude of the cone, ABM the maximum altitude of the base, and ABm the minimum altitude of the base; this has been extensively adopted throughout the literature (Hooper, 1995; Hooper and Sheridan, 1998; Riedel et al., 2003; Aguirre-Diaz et al., 2006; Sucipta et al., 2006; Sutawidjaja and Sukhyar, 2009; Gilichinsky et al., 2010; Inbar et al., 2011; Dóniz-Páez et al., 2012; Kereszturi and Németh, 2012b; Pedrazzi et al., 2020; Vörös et al., 2021; Becerra-Ramírez et al., 2022; Vörös et al., 2022).
This classical method has been implemented with various modifications across numerous studies. Kervyn et al. (2008), Kervyn et al. (2012) measures height by subtracting the average cone base elevation from the average crater rim elevation (Equation 7).
Havg represents the average height of the crater rim and Aavg the average altitude of the base. Alternative formulations have defined height simply as the difference between the lowest altitude of the base of the cone and its summit (Equation 8) (Rodriguez et al., 2010; Guilbaud et al., 2012; Haag et al., 2019).
Some researchers have adopted profile-based methodologies that sample multiple elevation profiles across individual cones to obtain representative height measurements. Zarazúa-Carbajal and De la Cruz-Reyna (2021) developed approaches that analyse elevation profiles from eight different directions, four crossing the centre of the crater and four crossing the centre of the cone base, with profiles generated at 45-degree azimuthal separations. The resulting cone height is the average height along each profile, Equation 9. This method is similar to the four-profile method used by Bemis et al. (2011) and was implemented by Sieron et al. (2023). This methodology allows for correction of terrain inclination effects and provides more comprehensive characterisations of cone dimensions, particularly important for breached or irregularly shaped cones.
Where Hp1 is the height of the cone along profile 1 and n is the number of profiles.
5.1.1 Crater depths
Crater depth (Dcr) is a measurement that is often overlooked in scoria cone morphology studies. There is a widespread variation in how it is defined. Hooper and Sheridan (1998) defined crater depth simply as the difference between the maximum summit elevation and minimum elevation inside the crater, Figure 5, which remains used in contemporary studies (Vörös et al., 2021; Becerra-Ramírez et al., 2022; Pedrazzi et al., 2024). Rodriguez-Gonzalez et al. (2010) altered this definition to the difference between the maximum summit elevation and the average elevation of inside the crater. On the other hand, Kervyn et al. (2012) used the mean crater rim elevation and the minimum elevation inside the crater to define crater depth. In a more complex approach, Bemis and Ferencz (2017) identified the minimum elevation across four elevation profiles crossing the crater as the crater depth, which was later used by Hunt et al. (2020) and Uslular et al. (2021). It is widely understood that error of measurement increases for smaller features, with increased error for cones <100 m in height (Section 2.1); this is valid for crater measurements due to their small size. The error of measurements when analysing crater depth has yet to be quantified effectively for both formula and DEM-based methods.
5.2 DEM-based interpolation methods
The recognition that formula-based methods introduce significant errors when applied to cones situated on steep underlying slopes (>5°) led to the development of DEM-based interpolation techniques.
Favalli et al. (2009) demonstrated that traditional formula methods average approximately 22% error on dipping basal planes, prompting the development of three-dimensional basal plane interpolation methods.
The interpolation-based approach calculates maximum height as Equation 10:
where Δzmax is the maximum elevation difference between the crater rim and the pre-eruption surface.
Mean height is calculated as the mean elevation of the 3D crater rim above the 3D base surface, Figure 6.
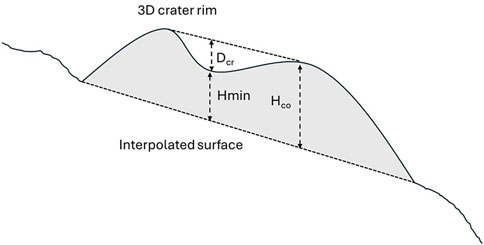
Figure 6. Average cone height using a 3D interpolated basal surface (modified from Favalli et al. (2009)).
Contemporary studies increasingly employ diverse interpolation algorithms to establish pre-eruptive basal surfaces, including natural neighbour, inverse distance weighting, and kriging techniques (Fornaciai et al., 2010; Fornaciai et al., 2012; Grosse et al., 2012; Cimarelli et al., 2013; Euillades et al., 2013; Kereszturi et al., 2013a; Di Traglia et al., 2014; Mukhopadhyay et al., 2019; Hunt et al., 2020; Grosse et al., 2020; Aguilera et al., 2022; Zhang et al., 2022; 2023; Kereszturi et al., 2025). The Triangulated Irregular Network (TIN) interpolation method has been particularly widely adopted, though it can introduce significant errors, in the case of volume calculations showing discrepancies of up to 30.6% when compared to average height methods (Zhang et al., 2023). Ideally, different methods should be tested with the error calculated for each interpolation technique to establish which method provides greater accuracy.
5.2.1 Crater depth
Crater depth has also been considered in DEM-based studies using a 3D interpolated crater rim surface, similarly generated using the same interpolation method to define the cone base. Favalli et al. (2009) defined crater depth as the difference between the average cone height and minimum height inside the crater polygon (Hmin), Figure 6. Grosse et al. (2012) defines crater depth as the difference between the minimum elevation inside the crater and the elevation of the 3D crater rim at the same point.
5.3 Comparisons
Few studies have compared the results of using both methods to calculate height. Favalli et al. (2009) found an average 64% difference between the Settle (1979) method and mean height using interpolation and a 27% difference when compared to maximum height (Equation 10). Hopfenblatt et al. (2021) compared the Settle (1979) and Favalli et al. (2009) methods for Stanley Patch Volcano, Antarctica, identifying a 3.8% difference, likely attributable to the shallow 3° basal plane inclination. This exemplifies the impact steep base inclinations can have on height measurement variability.
The morphometric parameters derived from different height measurement methods can vary significantly, with implications potentially cascading through subsequent analyses including volume calculations, slope angle determinations, height/width ratios, and age estimates based on morphometric degradation models.
Despite the multiple ways crater depth has been measured, no study has yet to quantify the differences between methods, therefore it is uncertain which method yields the most accurate results. As expected, a small feature such as the crater will be highly dependent on the resolution of the DEM used.
6 Volume measurement methods in scoria cone morphometry
Although lava flows constitute much of the total eruptive volume in most cases, understanding scoria cone volume and volumetric relationships within volcanic fields provides essential insights into regional tectonic evolution, chemical and physical property relationships, as well as magma supply characteristics (Kereszturi et al., 2013b; Zhang et al., 2023). Calculating cone volume remains challenging due to diverse methodological approaches that can be categorized as formula-based and DEM-based techniques. Here, we will only focus on the methods used to calculate the volume of the scoria cone, this does not include the volume of magma supply, or lava flows.
6.1 Formula-based volume calculation methods
A formula-based method includes calculating volume from the height, width, crater width, and crater depth parameters. Hasenaka and Carmichael, 1985 calculated the volume of a scoria cone as a symmetrical truncated cone, Equation 11:
where Wcr represents crater width, Wco represents cone width, and Hco represents cone height. This approach assumes complete crater infilling, which may not accurately represent young cones with open craters.
Riedel et al. (2003) therefore defined volume by subtracting the volumes of the inverse crater cone from the volume of the whole-cone, Equation 12:
Subsequent analysis led to simplified height-dependent volume relationships, Equations 13, 14; (Riedel et al., 2003; Kervyn et al., 2012):
These empirical relationships suggest that cone volume scales with the cube of height, providing simplified estimation methods for morphometric studies.
For breached or open cones, Dóniz-Páez et al. (2012) applied volume corrections by reducing calculated volumes by 50% when structural collapse was evident. For cones lacking distinct craters, volume was calculated using oblique cone geometry, Equation 15; (Becerra-Ramírez et al., 2022):
Where Rco is the radius of the cone base or Wco/2.
6.2 DEM-based volume calculation techniques
The advent of DEMs enabled direct volume calculations through surface interpolation and integration techniques. Carmichael et al. (2006) calculated the volume of a scoria cone by the difference of the surface topography and an interpolated base determined by the surrounding topography for scoria cones in Colima, Mexico. Favalli et al. (2009) formalised this approach as the volume enclosed between DEM surfaces and three-dimensional basal surfaces derived from Delaunay triangulation (also known as Triangulated Irregular Network (TIN)) of cone base coordinates. Studies have also calculated volume from the present-day surface (Inbar et al., 2011; Fornaciai et al., 2012), inverse distance weighting (IDW) (Grosse et al., 2014), or continuous curvature splines (Hunt et al., 2020). The impact of the various interpolation techniques on cone volume has yet to be examined, however it is likely that the choice of interpolation method will have a significant impact on the resulting volume.
The pre-eruptive surface can also be approximated from modification of contour lines, slope angles of the surroundings, or interpolations of surrounding elevations, where volume can be calculated for every grid feature of a DEM, Equation 16 (Kereszturi et al., 2013b).
Where ΔZi is the height difference between the DEM and basal surface, and x, y represent pixel dimensions.
Rodriguez-Gonzalez et al. (2010), Rodriguez-Gonzalez et al. (2011) developed comprehensive geomorphological reconstruction techniques for volcanic units, incorporating field investigations to develop pre-eruptive, post-eruptive, and current Digital Terrain Models (DTMs). Total original volume (VO) was calculated from differences between post-eruption and pre-eruption DTMs, while the actual volume (VR) represented differences between present-day and pre-eruption DTMs. Eroded volume (VD) was expressed as Equation 17:
6.3 Volume calculation accuracy and limitations
DEM-based volume calculations are fundamentally dependent on base delimitation accuracy, interpolation methods, and DEM resolution. Fornaciai et al. (2012) demonstrated that the ASTER 30 m DEM results in volume errors decreasing from approximately 60% for volumes ∼10 × 106 m3 to <30% for volumes ∼30 × 106 m3, while TINITALY 10 m DEM errors decrease from 40% to 10% for similar volume ranges. Zhang et al. (2022) documented average volume errors of 2.8%–4.5% for cones <5 × 10⁶ m3, emphasizing the importance of edifice size considerations in comparative analyses. Furthermore, the method does not consider positive or negative topography beneath the edifice (Grosse et al., 2012). However, extensive fieldwork to reconstruct the pre-eruptive terrain could improve this, such as the method of Rodriguez-Gonzalez et al. (2010), Rodriguez-Gonzalez et al. (2011). Overlapping edifice complications require subjective methodological decisions, with Grosse et al. (2012) employing enlarged outlines to encompass multiple edifices, while Hunt et al. (2020) applied formula-based methods for individual overlapping cones. It is subjective as to what method should be used when cones are overlapping, however, the formula-based method based on an ellipsoidal shape for each of the cones can be calculated, where the volume of each overlapping cone can be subtracted from the bottom cone to produce a volume estimate.
6.4 Comparisons
Formula-based volume methods struggle to capture morphological diversity and obtain precise volumetric measurements. Volume calculations are subject to 'scaling' issues where successive errors in height, width, and crater measurements propagate to produce substantial over- or underestimates (Bemis and Farencz, 2017). Sieron et al. (2023) documented anomalous volumes for approximately 50% of scoria cones in the Los Tuxtlas Volcanic Field, Mexico, likely due to dense vegetation coverage affecting LiDAR data corrections, necessitating reversion to formula-based methodologies.
O’Hara et al. (2020) compared volumes of composite volcanoes between their work with that of Hildreth (2007) and Grosse et al. (2014), reporting a mean absolute difference of 183% and 342% respectively, reduced to 32.1% and 92.3% respectively when outliers are removed. These differences are likely caused by a combination of differences in basal outlines and methods to obtain volume, with O’Hara et al. (2020) opting for the MBOA method compared to MORVOLC of Grosse et al. (2014). These substantial discrepancies highlight the need for systematic methodological comparisons and standardisation protocols, extending the study to consider scoria cones across different volcanic and environmental settings, and attempting to identify the main cause of the discrepancies, something we have tried to address in this review.
Comprehensive comparative studies between formula-based and DEM-based volume calculation methods remain limited, representing a critical research gap in morphometric methodology. The identification of primary sources of discrepancies between methodological approaches requires systematic investigation across diverse volcanic settings and cone morphologies. Additionally, investigation of environmental factors affecting measurement accuracy, including vegetation effects, surface roughness influences, and terrain complexity impacts, would enhance understanding of error sources and improve interpretation of morphometric analyses.
7 Slope angles
Flank slope angle represents a critical morphometric parameter in scoria cone analysis, serving as a fundamental indicator of cone growth processes and temporal degradation patterns. It is widely recognized that during initial formation, scoria cones typically achieve maximum angles of repose ranging from 30° to 36°, with values reported consistently across various volcanic fields worldwide, Table 2 (McGetchin et al., 1974; Wood, 1980a; Zarazúa-Carbajal and De la Cruz-Reyna, 2021, and references therein). These initial steep angles subsequently undergo gradual decline over time due to erosional processes, making slope measurements essential for understanding both syn-eruptive construction mechanisms and post-eruptive modification processes (Bemis et al., 2011; Vörös et al., 2021). The variation in angle of repose occurs due to several factors including the grain-size distribution of eruptive material, steepness of underlying slopes, agglutination of particles, and premature cessation of eruptions. Consequently, the observed range of flank slope angles reflects both scoria cone growth dynamics and degradational evolution (Bemis et al., 2011). This dual significance makes accurate slope measurement crucial for morphometric dating applications and volcanic process interpretation.
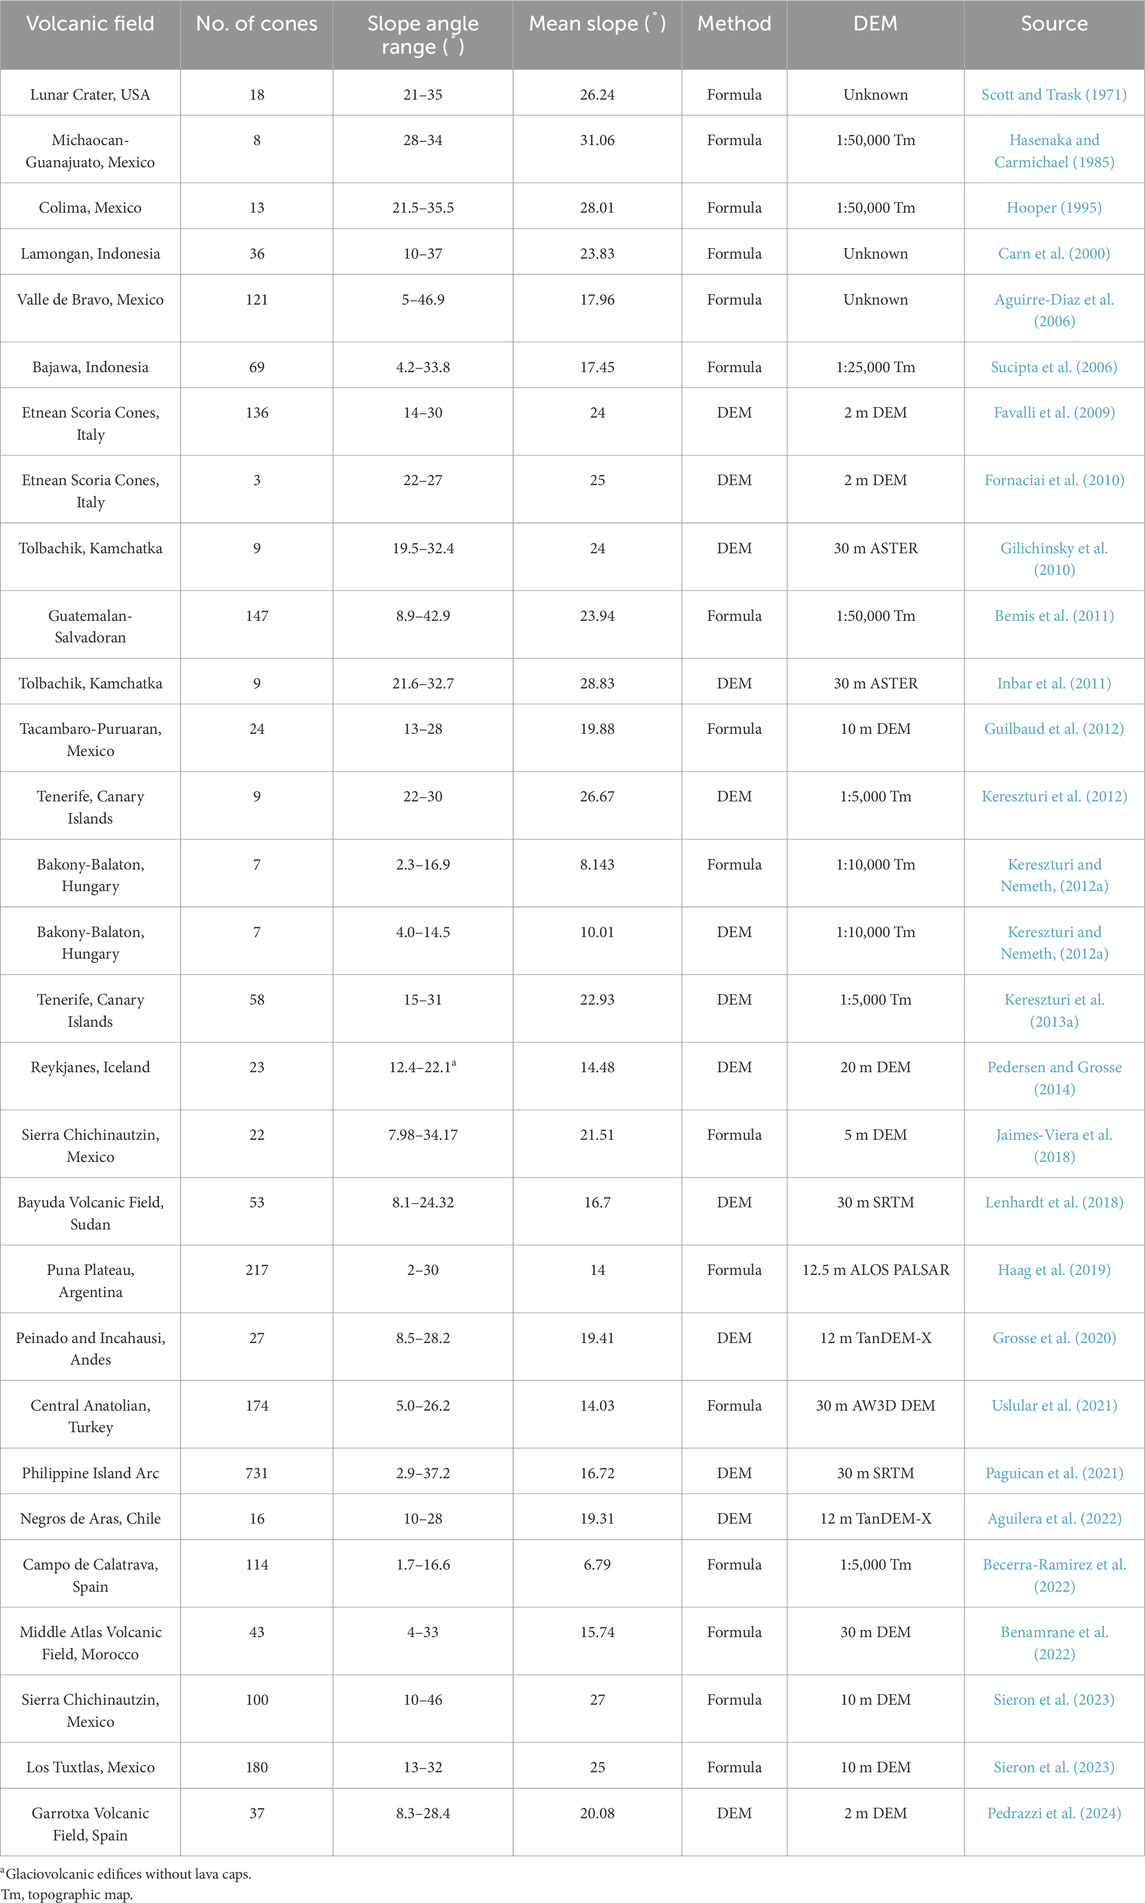
Table 2. Range of flank slope angles of scoria cones.
7.1 Formula-based slope calculation methods
Throughout the literature, slope calculation methodologies have evolved significantly, paralleling developments in height measurement techniques with the advent of high-resolution DEMs. Hasenaka and Carmichael, 1985 developed a method to obtain average flank slope angles through trigonometric modelling of the cone’s basal widths, crater widths, and height, Equation 18, which has been widely used (e.g. Hooper and Sheridan et al., 1998; Riedel et al., 2003; Aguirre-Diaz et al., 2006; Sucipta et al., 2006; Guilbaud et al., 2012).
And simplified to Equation 19 for cones without a crater.
This trigonometric method continues to be implemented in contemporary studies due to its computational simplicity and applicability to topographic map-based measurements (e.g. Bemis and Farencz, 2017; Jaimes-Viera et al., 2018; Haag et al., 2019; Benamrane et al., 2022; Sieron et al., 2023).
A similar method can be used to calculate the inner crater slope assuming a vent or conduit width, Equation 20 (Kervyn et al., 2012; Bemis and Ferencz, 2017).
Where Wv is width of the vent, often assumed to be 0 m (Bemis and Ferencz, 2017).
7.2 DEM-based slope calculation techniques
Parrot (2007) advocated for the utilisation of high-resolution DEMs to enable automated parameterisation of volcanic cones, including direct slope calculations from elevation data. This approach represents a significant advancement over formula-based methods, as mean dipping angles can be calculated directly from DEM surface derivatives. Contemporary software implementations, such as ENVI 4.6 topographic modelling procedures and ArcGIS/QGIS Spatial Analyst tools, provide standardised approaches for slope calculations. This approach is frequently applied in contemporary literature (e.g. Pedersen et al., 2020; Uslular et al., 2021; O’Hara and Karlstrom, 2023; Pedrazzi et al., 2024). Average and median slope angles can be derived from a DEM on the flanks and within the inner crater, including at different height intervals within the crater (Grosse et al., 2012).
The accuracy of DEM-based slope calculations is directly proportional to DEM resolution/type and base/crater delimitation precision. Coarser resolution DEMs systematically smooth steep slope angles, with Root Mean Square Error values more than doubling for slope angles exceeding 10° compared to gentler slopes (Kervyn et al., 2006; Gilichinsky et al., 2010; Zhang et al., 2022). The relationship between DEM resolution and slope measurement accuracy has been extensively documented, with Gilichinsky et al. (2010) demonstrating that scoria cone YZN in Tolbachik, Kamchatka, was underestimated by 9.8° when using the SRTM 90 m DEM compared to a 5 m contour digitised map-based DEM. The base and crater delimitations are crucial as they determine the slope values that are included within the slope histogram; inclusion of a flat-lying base or crater rims may skew average slope angles or generate high standard deviations (Kereszturi and Nemeth, 2012a). As suggested for height measurements, lower edifice sizes also lead to higher errors in slope angles (Bemis et al., 2011; Zhang et al., 2022).
Due to the potential formation of complex internal architectures of scoria cones, significantly reshaping the morphology, the slope angles of scoria cones can be misinterpreted and more complicated than generally assumed (Kereszturi et al., 2012). Therefore, Kereszturi et al. (2012) developed a method that splits the outer flanks of scoria cones into three types, ‘uphill’, ‘downhill’, and ‘other’, allowing for a more robust estimate of flank slope angles in the presence of complex cone architecture and steep underlying surfaces, with differences in slope up to 12° on a flat basal slope and 30° on steep basal slopes.
A similar approach was taken by Vörös et al. (2021) who implemented a ‘sectorisation’ of scoria cones to reflect asymmetry. A scoria cone is split into sectors of ∼15° (depending on cone size), omitting the crater, resulting in ∼24 ‘cut outs’ of the cone, each with their own calculation of average slope angle. This methodology enables quantification of cone asymmetry and accounts for directional variations in slope characteristics that may result from wind effects during the eruption or preferential erosional processes.
7.3 Comparative accuracy studies
Inbar et al. (2011) compared slope angles calculated using the 30 m ASTER DEM, where slope angles represented averages of pixel slope values situated along the steepest profile with greatest elevation difference, to map-based methods using spacing between contours. The largest discrepancy of slope angles between the two methods, for cones in Tolbachik, Kamchatka, was an overestimation of the map-based method by 3.2° (10.5% difference). The study noted uncertainty regarding whether variations resulted from DEM resolution differences compared to topographic maps, or from methodological differences in slope angle calculation procedures (through either error in the formula or subjectivity of the analyst), and it was recommended that only a single source of elevation data should be used in future studies (Inbar et al., 2011).
Kereszturi and Nemeth (2012a) calculated slope angles using both manual and DEM-based methods employing identical input data from a 1:10,000 topographic map with 5 m contour intervals (rasterised for the DEM-based methods using linear interpolation). Formula-based slope angles were calculated using trigonometric relationships, while average, median, mode, and maximum slope angles were directly derived from pixels within delimited areas (not the method of Kereszturi et al., 2012). The largest difference in mean slope angle between the methods was 9.5° (132% difference), likely attributable to cone morphological complexity, with formula-based methods consistently underestimating average slope angles for each measured cone.
The method of Vörös et al. (2021) documented similar results with strong overestimations of slope angle (exceeding 10° in some cases) using the formula-based methods compared to DEM-derived sectorization approaches. These studies collectively emphasise the limitations of formula-based methods and the potential inaccuracies they introduce when interpreting scoria cone morphology, particularly for morphometric-based dating applications. It is worth noting that in Vörös et al. (2021) formula-based methods overestimated slope angle compared to DEM-based methods, however Kereszturi and Nemeth (2012a) found underestimations of the formula-based method. The discrepancies between the two findings outline the complexities in measuring flank slope angles.
The accuracy of slope measurements can be influenced by various environmental factors beyond DEM resolution, including vegetation cover effects and surface roughness variations. Dense vegetation can affect DEM surface detection capabilities, potentially introducing systematic errors that vary between different slope calculation methodologies. These effects remain poorly quantified in existing literature but may contribute significantly to measurement uncertainties in heavily vegetated volcanic fields. Furthermore, the impact of boundary delineation also remains a present challenge in slope calculations, with Van Wees et al. (2024) finding an RSD of 6.12% between NETVOLC and manually drawn boundaries for stratovolcanoes when calculating average slope using the DEM-based method.
8 Variations in results
This review discusses significant variability in morphometric parameter measurements when comparing formula-based, DEM methodologies, and differences within each respective method, for analysing scoria cones, highlighting critical challenges in standardising volcanic geomorphological research. This variability represents a key limitation in comparative studies across different volcanic fields and emphasises the need for methodological consistency.
Kereszturi and Németh (2012a) and Vörös et al. (2021) compared formula-based and DEM-based methods specifically for slope calculations, revealing systematic differences between the two approaches. Favalli et al. (2009) developed innovative methods to calculate height and width parameters, with Kereszturi et al. (2013a) subsequently comparing different width calculation methodologies. During a global study, Fornaciai et al. (2012) found discrepancies in results between their work and previous studies on the same volcanic fields, which was interpreted as different data sources and selection criteria, or to a different method for calculating some parameters.
8.1 Quantified parameter variations
Here, we attempt to analyse some of the variations that can exist between different studies that use contrasting methods for morphometric analysis, showing the variations in results that can appear. It is uncertain which results are closest to the ‘actual’ morphology of a scoria cone, however this outlines the challenge that can exist interpreting morphometric data.
8.1.1 Variations in morphometric parameters
Analysis of 141 cones across 25 volcanic fields analysed by 2 or more different authors reveals variation between different methodological approaches, with an average 9.1%, 11.8%, 13.4%, 18.3%, and 37% difference in results for cone width, crater width, cone height, flank slope angle, and volume respectively, Figure 7 (Supplementary Material 2). Data where Kereszturi et al. (2025) analysed USA scoria cones with the 12 m spatial resolution WorldDEM and the 30 m SRTM DEM are also included.
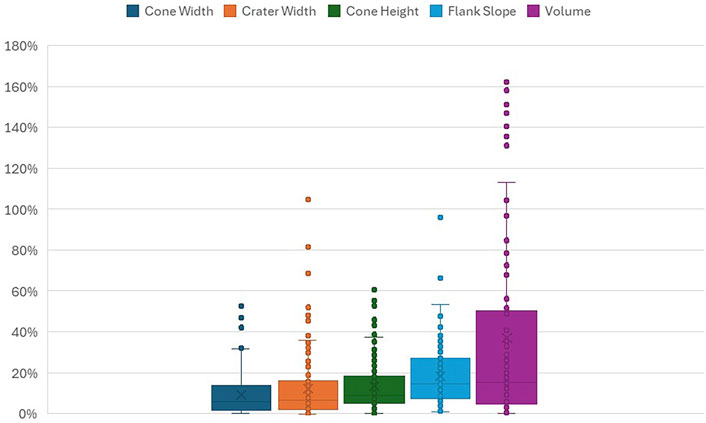
Figure 7. Variations in morphometric parameters when comparing results from different studies for the same cone (Supplementary Material 2).
These differences in results could be caused by difference DEM resolutions, base delimitation, and/or the method used to calculate morphometric parameters methods, with volume showing the largest discrepancy in results. The substantial 37% variation in volume calculations represents the most problematic discrepancy, as volume estimates are crucial for understanding eruption magnitude, hazard assessment, and volcanic field evolution.
To identify the effect of each causation of error, a multi-factor analysis is required to separate each independent variable, including complex cone shapes, vegetation index, and surrounding topography to understand which variable has the most impact on the differences in results. Among studies that calculate cone width using area-based methods, reported values vary by ∼5%, likely reflecting differences in DEM resolution and the delineation of basal outlines. However, the variation between area-based methods and the max/min diameters for the same cone increases to 12%. This demonstrates that standardisation of methodologies could significantly reduce variations of results.
8.1.2 Differences in volume calculations
Using the database of Kereszturi et al. (2025), we recalculated the volumes of 589 scoria cones across 75 volcanic fields using the formula-based methods of Hasenaka and Carmichael, 1985, Equation 11, and Kervyn et al. (2012), Equation 14. Kereszturi et al. (2025) uses contemporary DEM-based methods to calculate volume; Equation 16, the 12 m TanDEM-X DEM, 12 m WorldDEM, or regional <5 m DEMs. Given the morphometric data is sourced from Kereszturi et al. (2025), variations in volume only capture differences in the method, not the DEM resolution or drawn outlines (Supplementary Material 2). We obtain an average volume of each volcanic field using each method, which can then be compared.
The Hasenaka and Carmichael, 1985 formula overestimates volumes by an average of 36% compared to DEM-based calculations, with an average variability of 49% (irrespective of over/underestimations). The Kervyn et al. (2012) formula underestimates volumes by 1%, with an average variability of 45%, Figure 8. These substantial discrepancies highlight fundamental differences in how formula-based and DEM-based approaches handle the complex three-dimensional geometry of scoria cones. A key observation is that scoria cones that exhibit volumes >100 × 106 m3 cannot be accurately captured by formula-based methods, with Equations 11 and 14 underestimating volumes by >100%.
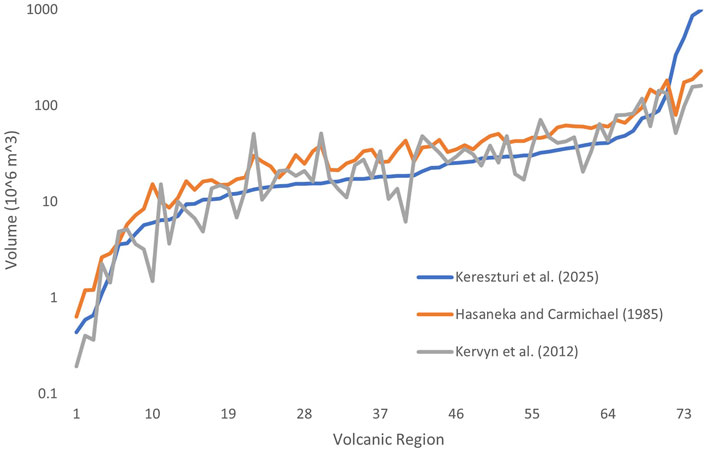
Figure 8. Variations in volume between the three methods, results were sorted in ascending order of volume. The names of volcanic regions 1–75 can be found in Supplementary Material 2.
The relationship between cone morphology and measurement accuracy reveals important patterns. Variations exceeding 100% typically occur for shallow, wide cones (width >1000 m, height <200 m). This dependency on cone shape reflects the sensitivity of formula-based methods to the height parameter, as these methods often assume idealised geometric relationships that break down for non-typical cone morphologies. The vulnerability of shallow, wide cones to measurement errors has significant implications for volcanic field studies, as such cones may represent either highly degraded older features or specific eruptive styles that produce low-profile edifices.
Future studies should further address the uncertainty related to vegetation, surrounding topography, and complex cone shapes on the method chosen and, alongside DEM resolution and base delimitation, quantifying the relative impact of each variable on measurement accuracy.
9 Future challenges
Morphometric analysis of scoria cones faces challenges that compromise the reliability and comparability of results across studies. The diverse eruptive and post-eruptive processes captured within simple morphometric parameters (height, width, slope) create inherent complexity in interpretation, as pre-eruptive (basal slope), syn-eruptive (cone growth), and post-eruptive (degradation) factors are all embedded within these measurements. This complexity is compounded by the inability of formula-based methods and low-resolution DEMs to detect morphometric variability, particularly large slope angle variations within individual edifices. Furthermore, the temporal evolution of controlling processes means that studying datasets with varying cone ages may lead to misinterpretation of primary controlling factors.
9.1 Recommendations for future research
Due to the complexities of scoria cone morphology, which are largely dependent on the context of the study, it may not yet be appropriate to suggest a complete standardised protocol. Instead, a series of recommendations can be made to improve accuracy and comparability going forward.
DEM Selection and Use:
• AW3D30 DEM offers the best overall trade-off between accuracy, coverage, and accessibility for global comparative studies, particularly at large regional scales. The TanDEM-X DEMs are also viable options for such analysis
• For detailed, local (cone-by-cone) analysis, use high-resolution DEMs with spatial resolutions <30 m, ideally <10 m, to reduce errors and preserve distinct volcanic features. The TanDEM-X 12 m DEM is likely to be the most suitable given its resolution and global coverage
• Ensure consistency in DEM selection across all study areas to support analytical accuracy and comparability
Scoria Cone Boundary Delimitation:
• Hybrid approaches (automated detection + manual refinement) yield the most robust results.
• Recommended protocol:
• Begin with automated detection using volcanic setting-appropriate algorithms
• Refine boundaries manually using field validation, satellite imagery, and orthophotos
• Apply a 3° slope threshold (Van Wees et al., 2024) for consistency
• Use multi-analyst validation in studies where high accuracy is essential
Estimation of Pre-eruptive Surface, Cone Heights, and Cone Volumes:
• Favalli et al. (2009) interpolation-based method is universally recommended for future studies, due to its robust error assessment linked to DEM vertical accuracy. Formula-based methods can result in errors exceeding 20%, particularly for irregular or complex scoria cones
• For studies using global 30 m DEMs, average heights should be used to calculate pre-eruptive surfaces, potentially reducing uncertainty by up to 100% (Zhang et al., 2022)
• TIN interpolation is suitable for tilted pre-eruptive surfaces, however more testing is needed to determine the optimal interpolation method
• For irregular or breached cones, consider multiple profile sampling to acquire representative heights; however, the comparative accuracy of methods such as Bemis et al. (2011) versus Favalli et al. (2009) is still uncertain and requires further testing
• Errors in Volume can be significant with variability exceeding 100% in cases between the various calculation methods
• Volumes should be calculated using DEM-based parameterisation, with added care in using robust delimitation methods and the highest-resolution DEMs available to ensure greater accuracy
Slope Analysis:
• Prefer DEM-based slope calculations over formula-based methods, especially for detailed morphological studies
• Use sectorisation approaches (Kereszturi et al., 2013a; Vörös et al., 2021) to account for cone asymmetry and variations in slope
• For irregular or breached cones, multiple profile sampling may yield more accurate measurements, though systematic comparative studies are needed to determine best practices
9.2 Future research priorities
The volcanological community requires coordinated efforts to develop standardised delimitation protocols and comprehensive methodological frameworks. Priority should be given to large-scale comparative studies that systematically evaluate different measurement approaches using identical high-resolution datasets (preferably <10 m resolution DEMs) across diverse volcanic settings. Such studies should compare morphometric parameters under varying conditions including DEM resolutions, manual versus automatic base delimitations, and formula-based versus DEM-based methods, while grouping cones by shape, underlying slope angle, age, and composition, expanding on the initial results presented within this study. Research should extend to further volcanic regions, such as the Ethiopian Rift Valley or Indonesian volcanic fields, where research appears to be limited yet represent diverse tectonic, environmental, and volcanic settings.
Critical research gaps include systematic evaluation of environmental factors affecting boundary detection accuracy (vegetation effects, surface roughness variations, climatic influences) and comprehensive quantification of methodological uncertainties across various environmental, geomorphological, and volcanic settings. The development of criteria-based selection frameworks is essential to support identification of the most appropriate methods for specific applications, thereby limiting errors in results and interpretation.
Following this review, it is crucial to evaluate the application of morphometric measurements, such as morphometric dating, shape classification, and inferring process from shape. Given the errors and inaccuracies that can appear with morphometric measurements, as outlined in this study, it is possible unknown errors have appeared within the applications of the measurements. Therefore, it is crucial to analyse how the different methods to obtain morphometric parameters may impact the results of morphometric dating (e.g. height/width ratios).
The development of standardised protocols for calculation methods, boundary delineation procedures, and comprehensive error quantification remains crucial for advancing the field of volcanic morphometry. Only through such methodological standardisation can the volcanological community develop reliable, reproducible approaches to morphometric analysis that can support robust volcanic hazard assessment and process understanding across diverse volcanic fields worldwide.
Author contributions
RB: Writing – original draft, Methodology, Data curation, Writing – review and editing, Conceptualization. NV: Supervision, Writing – review and editing, Validation, Conceptualization. MB: Supervision, Writing – review and editing.
Funding
The author(s) declare that no financial support was received for the research and/or publication of this article.
Conflict of interest
The authors declare that the research was conducted in the absence of any commercial or financial relationships that could be construed as a potential conflict of interest.
The author(s) declared that they were an editorial board member of Frontiers, at the time of submission. This had no impact on the peer review process and the final decision.
Generative AI statement
The author(s) declare that no Generative AI was used in the creation of this manuscript.
Any alternative text (alt text) provided alongside figures in this article has been generated by Frontiers with the support of artificial intelligence and reasonable efforts have been made to ensure accuracy, including review by the authors wherever possible. If you identify any issues, please contact us.
Publisher’s note
All claims expressed in this article are solely those of the authors and do not necessarily represent those of their affiliated organizations, or those of the publisher, the editors and the reviewers. Any product that may be evaluated in this article, or claim that may be made by its manufacturer, is not guaranteed or endorsed by the publisher.
Supplementary material
The Supplementary Material for this article can be found online at: https://www.frontiersin.org/articles/10.3389/feart.2025.1667680/full#supplementary-material
References
Aguilera, M., Ureta, G., Grosse, P., Németh, K., Aguilera, F., and Vilches, M. (2022). Geomorphological, Morphometric, and Spatial Distribution Analysis of the Scoria Cones in the Negros de Aras Monogenetic Volcanic Field, Northern Chile. J. Volcanol. Geotherm. Res. 422, 107458. doi:10.1016/j.jvolgeores.2021.107458
Aguirre-Díaz, G., Jaimes-Viera, C., and Lozano-Santacruz, R. (2006). “The Valle de Bravo Volcanic Field,” in A monogenetic field in the central front of the Mexican volcanic belt.
Azizah, A.Al S. (2025). Volcanic geomorphology and morphometry classification of cinder cone in Harrat lunayyir Saudi Arabia by using GIS and remote sensing. J. Environ. and Earth Sci. 7 (5), 304–318. doi:10.30564/jees.v7i5.8859
Becerra-Ramírez, R., Dóniz-Páez, J., and González, E. (2022). Morphometric Analysis of Scoria Cones to Define the “Volcano-Type” of the Campo de Calatrava Volcanic Region (Central Spain). Land 11 (6), 917. doi:10.3390/land11060917
Bemis, K. G., and Ferencz, M. (2017). “Morphometric analysis of scoria cones: the potential for inferring process from shape,”, 446. London: Special Publications, 61–100. doi:10.1144/sp446.9
Bemis, K., Walker, J., Borgia, A., Turrin, B., Neri, M., and Swisher, C. (2011). The growth and erosion of cinder cones in Guatemala and El Salvador: models and statistics. J. Volcanol. Geotherm. Res. 201 (1), 39–52. doi:10.1016/j.jvolgeores.2010.11.007
Benamrane, M., Németh, K., Jadid, M., and Talbi, E. H. (2022). Geomorphological classification of monogenetic volcanoes and its implication to tectonic stress orientation in the middle atlas volcanic field (morocco). Land 11 (11), 1893. doi:10.3390/land11111893
Bohnenstiehl, D. R., Howell, J. K., White, S. M., and Hey, R. N. (2012). A modified basal outlining algorithm for identifying topographic highs from gridded elevation data, part 1: motivation and methods. Comput. and Geosciences 49, 308–314. doi:10.1016/j.cageo.2012.04.023
Carmichael, I. S. E., Frey, H. M., Lange, R. A., and Hall, C. M. (2006). The Pleistocene cinder cones surrounding volcán Colima, Mexico re-visited: eruption ages and volumes, oxidation states, and sulfur content. Bull. Volcanol. 68 (5), 407–419. doi:10.1007/s00445-005-0015-8
Carn, S. A. (2000). The lamongan volcanic field, East java, Indonesia: physical volcanology, historic activity and hazards. J. Volcanol. Geotherm. Res. 95 (1–4), 81–108. doi:10.1016/s0377-0273(99)00114-6
Carracedo, J. C., Troll, V. R., Day, J. M. D., Geiger, H., Aulinas, M., Soler, V., et al. (2022). The 2021 Eruption of the Cumbre Vieja Volcanic Ridge on La Palma, Canary Islands. Geol. Today 38 (3), 94–107. doi:10.1111/gto.12388
Cimarelli, C., Di Traglia, F., De Rita, D., Gimeno Torrente, D., and Fernandez Turiel, J.-L. (2013). Space–time evolution of monogenetic volcanism in the mafic garrotxa volcanic field (NE iberian peninsula). Bull. Volcanol. 75 (11), 758. doi:10.1007/s00445-013-0758-6
Di Traglia, F., Morelli, S., Casagli, N., and Garduño Monroy, V. H. (2014). Semi-automatic delimitation of volcanic edifice boundaries: validation and application to the cinder cones of the tancitaro–nueva Italia region (Michoacán–Guanajuato volcanic field, Mexico). Geomorphology 219, 152–160. doi:10.1016/j.geomorph.2014.05.002
Dóniz-Páez, J. (2015). Volcanic geomorphological classification of the cinder cones of tenerife (Canary islands, Spain). Geomorphology 228, 432–447. doi:10.1016/j.geomorph.2014.10.004
Dóniz-Páez, J., Romero-Ruiz, C., and Sánchez, N. (2012). Quantitative size classification of scoria cones: the case of tenerife (Canary islands, Spain). Phys. Geogr. 33 (6), 514–535. doi:10.2747/0272-3646.33.6.514
Euillades, L. D., Grosse, P., and Euillades, P. A. (2013). NETVOLC: an algorithm for automatic delimitation of volcano edifice boundaries using DEMs. Comput. and Geosciences 56, 151–160. doi:10.1016/j.cageo.2013.03.011
Favalli, M., Karátson, D., Mazzarini, F., Pareschi, M. T., and Boschi, E. (2009). Morphometry of scoria cones located on a volcano flank: a case study from mt. Etna (italy), based on high-resolution LiDAR data. J. Volcanol. Geotherm. Res. 186 (3), 320–330. doi:10.1016/j.jvolgeores.2009.07.011
Fornaciai, A., Behncke, B., Favalli, M., Neri, M., Tarquini, S., and Boschi, E. (2010). Detecting short-term evolution of etnean scoria cones: a LIDAR-based approach. Bull. Volcanol. 72 (10), 1209–1222. doi:10.1007/s00445-010-0394-3
Fornaciai, A., Favalli, M., Karátson, D., Tarquini, S., and Boschi, E. (2012). Morphometry of Scoria cones, and their relation to geodynamic setting: a DEM-Based analysis. J. Volcanol. Geotherm. Res. 217–218, 56–72. doi:10.1016/j.jvolgeores.2011.12.012
Gilichinsky, M., Melnikov, D., Melekestsev, I., Zaretskaya, N., and Inbar, M. (2010). Morphometric measurements of cinder cones from digital elevation models of tolbachik volcanic field, central Kamchatka. Can. J. Remote Sens. 36 (4), 287–300. doi:10.5589/m10-049
Grosse, P., Van Wyk De Vries, B., Euillades, P. A., Kervyn, M., and Petrinovic, I. A. (2012). Systematic morphometric characterization of volcanic edifices using digital elevation models. Geomorphology 136 (1), 114–131. doi:10.1016/j.geomorph.2011.06.001
Grosse, P., Euillades, P. A., Euillades, L. D., and Van Wyk De Vries, B. (2014). A global database of composite Volcano morphometry. Bull. Volcanol. 76 (1), 784. doi:10.1007/s00445-013-0784-4
Grosse, P., Ochi Ramacciotti, M. L., Escalante Fochi, F., Guzmán, S., Orihashi, Y., and Sumino, H. (2020). Geomorphology, morphometry, spatial distribution and ages of mafic monogenetic volcanoes of the peinado and Incahuasi fields, southernmost central volcanic zone of the andes. J. Volcanol. Geotherm. Res. 401, 106966. doi:10.1016/j.jvolgeores.2020.106966
Guilbaud, M.-N., Siebe, C., Layer, P., and Salinas, S. (2012). Reconstruction of the volcanic history of the tacámbaro-puruarán area (michoacán, México) reveals high frequency of Holocene monogenetic eruptions. Bull. Volcanol. 74 (5), 1187–1211. doi:10.1007/s00445-012-0594-0
Haag, M. B., Baez, W. A., Sommer, C. A., Arnosio, J. M., and Filipovich, R. E. (2019). Geomorphology and spatial distribution of monogenetic volcanoes in the southern puna Plateau (NW Argentina). Geomorphology 342, 196–209. doi:10.1016/j.geomorph.2019.06.008
Hasenaka, T., and Carmichael, I. S. E. (1985). The cinder cones of michoacan-guanajuato, central Mexico: their age, volume and distribution, and magma discharge rate.
Hildreth, W. (2007). Quaternary magmatism in the cascades: geologic perspectives. U.S. Geol. Surv. Prof. Pap. 1744. Available online at: https://play.google.com/books/reader?id=JNkmbfw0y_0C&pg=GBS.PR1&hl=en.
Hill, B. E., Connor, C. B., Jarzemba, M. S., La Femina, P. C., Navarro, M., and Strauch, W. (1998). 1995 eruptions of cerro negro volcano, Nicaragua, and risk assessment for future eruptions. Geol. Soc. Am. Bull. 110 (10), 1231–1241. doi:10.1130/0016-7606(1998)110<1231:eocnvn>2.3.co;2
Hooper, D. M. (1995). Computer-simulation models of scoria cone degradation in the Colima and Michoacan-Guanajuato volcanic fields, Mexico. Geofísica Int. 34 (3), 321–340. doi:10.22201/igeof.00167169p.1995.34.3.727
Hooper, D. M., and Sheridan, M. F. (1998). Computer-simulation models of scoria cone degradation. J. Volcanol. Geotherm. Res. 83 (3–4), 241–267. doi:10.1016/s0377-0273(98)00031-6
Hopfenblatt, J., Geyer, A., Aulinas, M., Álvarez-Valero, A. M., Gisbert, G., Kereszturi, G., et al. (2021). Formation of stanley patch volcanic cone: new insights into the evolution of deception island caldera (antarctica). J. Volcanol. Geotherm. Res. 415, 107249. doi:10.1016/j.jvolgeores.2021.107249
Houghton, B. F., Wilson, C. J. N., Del Carlo, P., Coltelli, M., Sable, J. E., and Carey, R. (2004). The influence of conduit processes on changes in style of basaltic plinian eruptions: Tarawera 1886 and etna 122 BC. J. Volcanol. Geotherm. Res. 137 (1–3), 1–14. doi:10.1016/j.jvolgeores.2004.05.009
Howell, J. K., White, S. M., and Bohnenstiehl, D. R. (2012). A modified basal outlining algorithm for identifying topographic highs in gridded elevation data, part 2: application to springerville volcanic field. Comput. and Geosciences 49, 315–322. doi:10.1016/j.cageo.2012.04.024
Hunt, J. A., Mather, T. A., and Pyle, D. M. (2020). Morphological comparison of distributed volcanic fields in the main Ethiopian rift using high-resolution digital elevation models. J. Volcanol. Geotherm. Res. 393, 106732. doi:10.1016/j.jvolgeores.2019.106732
Inbar, M., Hubp, J. L., and Ruiz, L. V. (1994). The geomorphological evolution of the Paricutin cone and lava flows, Mexico, 1943–1990. Geomorphology 9 (1), 57–76. doi:10.1016/0169-555x(94)90031-0
Inbar, M., Gilichinsky, M., Melekestsev, I., Melnikov, D., and Zaretskaya, N. (2011). Morphometric and morphological development of Holocene cinder cones: a field and remote sensing study in the tolbachik volcanic field, Kamchatka. J. Volcanol. Geotherm. Res. 201 (1–4), 301–311. doi:10.1016/j.jvolgeores.2010.07.013
Jaimes-Viera, M. C., Martin Del Pozzo, A. L., Layer, P. W., Benowitz, J. A., and Nieto-Torres, A. (2018). Timing the evolution of a monogenetic volcanic field: Sierra chichinautzin, central Mexico. J. Volcanol. Geotherm. Res. 356, 225–242. doi:10.1016/j.jvolgeores.2018.03.013
Kazemi Garajeh, M., Li, Z., Hasanlu, S., Zare Naghadehi, S., and Hossein Haghi, V. (2022). Developing an integrated approach based on geographic object-based image analysis and convolutional neural network for volcanic and glacial landforms mapping. Sci. Rep. 12 (1), 21396. doi:10.1038/s41598-022-26026-z
Kereszturi, G., and Németh, K. (2012a). Structural and morphometric irregularities of eroded Pliocene scoria cones at the bakony–balaton highland volcanic field, Hungary. Geomorphology 136 (1), 45–58. doi:10.1016/j.geomorph.2011.08.005
Kereszturi, G., and Németh, K. (2012b). “Monogenetic basaltic volcanoes: genetic classification, growth, geomorphology and degradation,” in Updates in volcanology - new advances in understanding volcanic systems.
Kereszturi, G., Jordan, G., Németh, K., and Dóniz-Páez, J. F. (2012). Syn-eruptive morphometric variability of monogenetic scoria cones. Bull. Volcanol. 74 (9), 2171–2185. doi:10.1007/s00445-012-0658-1
Kereszturi, G., Geyer, A., Martí, J., Németh, K., and Dóniz-Páez, F. J. (2013a). Evaluation of Morphometry-Based Dating of Monogenetic Volcanoes—a Case Study from Bandas Del Sur, Tenerife (Canary Islands). Bull. Volcanol. 75 (7), 734. doi:10.1007/s00445-013-0734-1
Kereszturi, G., Németh, K., Cronin, S. J., Agustín-Flores, J., Smith, I. E. M., and Lindsay, J. (2013b). A model for calculating eruptive volumes for monogenetic volcanoes — implication for the Quaternary Auckland volcanic field, New Zealand. J. Volcanol. Geotherm. Res. 266, 16–33. doi:10.1016/j.jvolgeores.2013.09.003
Kereszturi, G., Grosse, P., Whitehead, M., Guilbaud, M.-N., Downs, D. T., Noguchi, R., et al. (2025). Understanding the evolution of scoria cone morphology using multivariate models. Commun. Earth and Environ. 6 (1), 439. doi:10.1038/s43247-025-02425-8
Kervyn, M., Goossens, R., Jacobs, P., and Ernst, G. G. J. (2006). ASTER DEMs for volcano topographic mapping: accuracy and limitations.
Kervyn, M., Ernst, G. G. J., Goossens, R., and Jacobs, P. (2008). Mapping Volcano topography with remote sensing: ASTERvs. SRTM’. Int. J. Remote Sens. 29 (22), 6515–6538. doi:10.1080/01431160802167949
Kervyn, M., Ernst, G. G. J., Carracedo, J.-C., and Jacobs, P. (2012). Geomorphometric variability of “Monogenetic” volcanic cones: evidence from Mauna Kea, lanzarote and experimental cones. Geomorphology 136 (1), 59–75. doi:10.1016/j.geomorph.2011.04.009
Lenhardt, N., Borah, S. B., Lenhardt, S. Z., Bumby, A. J., Ibinoof, M. A., and Salih, S. A. (2018). The monogenetic bayuda volcanic field, Sudan – new insights into geology and volcanic morphology. J. Volcanol. Geotherm. Res. 356, 211–224. doi:10.1016/j.jvolgeores.2018.03.010
McGetchin, T., Settle, M., and Chouet, B. (1974). Cinder cone growth modeled after northeast crater, Mount Etna, sicily. J. Geophys. Res. Solid Earth 79, 3257–3272. doi:10.1029/jb079i023p03257
Melis, M. T., Mundula, F., DessÌ, F., Cioni, R., and Funedda, A. (2014). Tracing the boundaries of Cenozoic volcanic edifices from Sardinia (Italy): a geomorphometric contribution. Earth Surf. Dynam. 2, 481–492.
Mukhopadhyay, B., Mukhopadhyay, M., Elawadi, E., Ghosh, U. K., and Pramanik, K. (2019). Cinder cone morphometry in relation to gravity anomaly zones in the harrat al birk and Asir foreland, SW Saudi Arabia. J. Earth Syst. Sci. 128 (6), 158. doi:10.1007/s12040-019-1188-4
Németh, K., and Kereszturi, G. (2015). Monogenetic volcanism: personal views and discussion. Int. J. Earth Sci. 104 (8), 2131–2146. doi:10.1007/s00531-015-1243-6
O’Hara, D., and Karlstrom, L. (2023). The arc-scale spatial distribution of volcano erosion implies coupled magmatism and regional climate in the cascades arc, United States. Front. Earth Sci. 11, 1150760. doi:10.3389/feart.2023.1150760
O’Hara, D., Karlstrom, L., and Ramsey, D. W. (2020). Time-evolving surface and subsurface signatures of Quaternary volcanism in the cascades arc. Geology 48 (11), 1088–1093. doi:10.1130/g47706.1
Paguican, E. M., Grosse, P., Fabbro, G. N., and Kervyn, M. (2021). Morphometric classification and spatial distribution of Philippine volcanoes. J. Volcanol. Geotherm. Res. 418, 107251. doi:10.1016/j.jvolgeores.2021.107251
Parrot, J.-F. (2007). “Study of volcanic cinder cone evolution by means of high resolution DEMs,” in MODSIM 2007 international congress on modelling and simulation; 2007: modelling and simulation society of Australia and New Zealand.
Pedersen, G. B. M., and Grosse, P. (2014). Morphometry of subaerial shield volcanoes and glaciovolcanoes from Reykjanes peninsula, Iceland: effects of eruption environment. J. Volcanol. Geotherm. Res. 282, 115–133. doi:10.1016/j.jvolgeores.2014.06.008
Pedersen, G. B. M., Grosse, P., and Gudmundsson, M. T. (2020). Morphometry of glaciovolcanic edifices from Iceland: types and evolution. Geomorphology 370, 107334. doi:10.1016/j.geomorph.2020.107334
Pedrazzi, D., Kereszturi, G., Lobo, A., Geyer, A., and Calle, J. (2020). Geomorphology of the post-caldera monogenetic volcanoes at deception Island, Antarctica — implications for landform recognition and volcanic hazard assessment. J. Volcanol. Geotherm. Res. 402, 106986. doi:10.1016/j.jvolgeores.2020.106986
Pedrazzi, D., Kereszturi, G., Geyer, A., Bolós, X., Granell, J., Planagumà, L., et al. (2024). Morphometric analysis of monogenetic volcanoes in the garrotxa volcanic field, iberian peninsula. Geomorphology 465, 109400. doi:10.1016/j.geomorph.2024.109400
Riedel, C., Ernst, G. G. J., and Riley, M. (2003). Controls on the growth and geometry of pyroclastic constructs. J. Volcanol. Geotherm. Res. 127 (1–2), 121–152. doi:10.1016/s0377-0273(03)00196-3
Rodríguez, S. R., Morales-Barrera, W., Layer, P., and González-Mercado, E. (2010). A Quaternary monogenetic volcanic field in the xalapa region, eastern trans-mexican volcanic belt: geology, distribution and morphology of the volcanic vents. J. Volcanol. Geotherm. Res. 197 (1–4), 149–166. doi:10.1016/j.jvolgeores.2009.08.003
Rodriguez-Gonzalez, A., Fernandez-Turiel, J. L., Perez-Torrado, F. J., Gimeno, D., and Aulinas, M. (2010). Geomorphological reconstruction and morphometric modelling applied to past volcanism. Int. J. Earth Sci. 99 (3), 645–660. doi:10.1007/s00531-008-0413-1
Rodriguez-Gonzalez, A., Fernandez-Turiel, J. L., Perez-Torrado, F. J., Aulinas, M., Carracedo, J. C., Gimeno, D., et al. (2011). GIS methods applied to the degradation of monogenetic volcanic fields: a case study of the Holocene volcanism of gran canaria (Canary islands, Spain). Geomorphology 134 (3–4), 249–259. doi:10.1016/j.geomorph.2011.06.033
Scott, D. H., and Trask, N. J. (1971). Geology of the lunar crater volcanic field, Nye County, Nevada. Geological Survey Professional Paper 599-1. Washington: United States Government Printing Office. 1–22.
Settle, M. (1979). The structure and emplacement of cinder cone fields. Am. J. Sci. 279, 1089–1107. doi:10.2475/ajs.279.10.1089
Sieron, K., Guilbaud, M.-N., Zarazúa-Carbajal, M. C., and Juárez Cerrillo, S. F. (2023). Monogenetic volcanism in subduction settings: comparative statistical study of the sierra chichinautzin and los tuxtlas volcanic fields in Mexico. Bull. Volcanol. 85 (2), 14. doi:10.1007/s00445-023-01625-4
Sucipta, I. G. B. E., Takashima, I., and Muraoka, H. (2006). Morphometric age and petrological characteristics of volcanic rocks from the bajawa cinder cone complex, Flores, Indonesia. J. Mineralogical Petrological Sci. 101 (2), 48–68. doi:10.2465/jmps.101.48
Sutawidjaja, I. S., and Sukhyar, R. (2009). Cinder cones of mount slamet, Central java, Indonesia. Indonesian J. Geoscience 4 (1), 57–75. doi:10.17014/ijog.4.1.57-75
Székely, B., and Karátson, D. (2004). DEM-Based morphometry as a tool for reconstructing primary volcanic landforms: examples from the börzsöny Mountains, Hungary. Geomorphology 63, 25–37. doi:10.1016/j.geomorph.2004.03.008
Uslular, G., Le Corvec, N., Mazzarini, F., Legrand, D., and Gençalioğlu-Kuşcu, G. (2021). Morphological and multivariate statistical analysis of Quaternary monogenetic vents in the central anatolian volcanic province (turkey): implications for the volcano-tectonic evolution. J. Volcanol. Geotherm. Res. 416, 107280. doi:10.1016/j.jvolgeores.2021.107280
Van Wees, R. M. J., O’Hara, D., Kereszturi, G., Grosse, P., Lahitte, P., Tournigand, P.-Y., et al. (2024). Towards more consistent volcano morphometry datasets: assessing boundary delineation and DEM impact on geometric and drainage parameters. Geomorphology 465, 109381. doi:10.1016/j.geomorph.2024.109381
Vörös, F., Van Wyk De Vries, B., Karátson, D., and Székely, B. (2021). DTM-Based Morphometric Analysis of Scoria Cones of the Chaîne des Puys (France)—The Classic and a New Approach. Remote Sens. 13 (10), 1983. doi:10.3390/rs13101983
Vörös, F., Van Wyk De Vries, B., Guilbaud, M.-N., Görüm, T., Karátson, D., and Székely, B. (2022). DTM-based comparative geomorphometric analysis of four scoria cone areas—suggestions for additional approaches. Remote Sens. 14 (23), 6152. doi:10.3390/rs14236152
Wood, C. A. (1980a). Morphometric analysis of cinder cone degradation. J. Volcanol. Geotherm. Res. 8 (2–4), 137–160. doi:10.1016/0377-0273(80)90101-8
Wood, C. A. (1980b). Morphometric evolution of cinder cones. J. Volcanol. Geotherm. Res. 7 (3–4), 387–413. doi:10.1016/0377-0273(80)90040-2
Zarazúa-Carbajal, M. C., and De la Cruz-Reyna, S. (2020). Morpho-chronology of monogenetic scoria cones from their level contour curves. Applications to the chichinautzin monogenetic field, central Mexico. J. Volcanol. Geotherm. Res. 407, 107093. doi:10.1016/j.jvolgeores.2020.107093
Zarazúa-Carbajal, M. C., and De la Cruz-Reyna, S. (2021). Digital elevation model resolution: effects on the chronometry-oriented morphological analysis of monogenetic scoria cones in the sierra chichinautzin, central Mexico. Geomorphology 389, 107842. doi:10.1016/j.geomorph.2021.107842
Zhang, R., Kereszturi, G., Brenna, M., and Ahn, U. S. (2022). Sensitivity assessment of morphometric parameters of monogenetic volcanic landforms with global free DEMs. Geomorphology 415, 108408. doi:10.1016/j.geomorph.2022.108408
Keywords: cinder cones, morphology, volcano morphology, digital elevation models (DEMs), volcanology
Citation: Bailey R, Varley N and Blackett M (2025) A review of techniques for characterising scoria cone morphologies. Front. Earth Sci. 13:1667680. doi: 10.3389/feart.2025.1667680
Received: 17 July 2025; Accepted: 23 September 2025;
Published: 16 October 2025.
Edited by:
Adelina Geyer, Spanish National Research Council (CSIC), SpainReviewed by:
Dario Pedrazzi, Spanish National Research Council (CSIC), SpainPablo Grosse, National Scientific and Technical Research Council (CONICET), Argentina
Copyright © 2025 Bailey, Varley and Blackett. This is an open-access article distributed under the terms of the Creative Commons Attribution License (CC BY). The use, distribution or reproduction in other forums is permitted, provided the original author(s) and the copyright owner(s) are credited and that the original publication in this journal is cited, in accordance with accepted academic practice. No use, distribution or reproduction is permitted which does not comply with these terms.
*Correspondence: Ryan Bailey, cnlhbmJhaWxleTEwMTg4QGdtYWlsLmNvbQ==