 Xuefeng Gao
 Hongtao Wang2
 Dan Ma
 Yanjun Zhang
- 1Key Laboratory of Deep Coal Resource Mining of Ministry of Education, School of Mines, China University of Mining and Technology, Xuzhou, China
- 2Shandong Energy Group Xibei Mining Co. Ltd., Xi’an, Shaanxi, China
- 3College of Construction Engineering, Jilin University, Changchun, China
- 4School of Resources and Geosciences, China University of Mining and Technology, Xuzhou, China
- 5School of Water Conservancy and Transportation, Zhengzhou University, Zhengzhou, China
Multi-physics modeling of underground rock mass fractures rarely accounts for contact asperities, thus hindering fracture-related permeability estimation during geofluid migration processes. Here we present a novel method for preparing contact-type fractures, employing a random placement technique to reconstruct a random array of contact asperities in fractures with varying contact ratios. We investigate the hydraulic evolution of fractures with random contact asperities under confining pressure. We reveal that the sensitivity of permeability decay with increasing stress is closely related to the contact ratio, with fractures having lower contact ratios exhibiting a significantly greater reduction in permeability compared to those with higher contact ratios. Traditional hydraulic aperture prediction models based on contact rates, which neglect stress, are not applicable with low contact ratios. Furthermore, we observe for the first time that the permeability of contact-type fractures undergoes an inversion effect with increasing contact ratio, manifested as an anomalous positive correlation between permeability and contact ratio at low contact ratios. We developed an empirical permeability prediction model that incorporates both contact ratio and stress, which accurately captures the permeability evolution in contact-type fractures. These findings open a prospective for characterizing, modeling, and predicting fluid transport in complex underground fracture networks.
1 Introduction
Fractured media in the subsurface arise from both natural geological processes and human-induced engineering disturbances. These fractures span scales from micrometers to hundreds of meters, and even kilometers (Walmann et al., 1996; Bonnet et al., 2001; Davy et al., 2024). These natural structural planes are either interconnected or isolated, creating a complex fracture system within the rock layers (Viswanathan et al., 2022; Hodge et al., 2025). Fractures, due to their high hydraulic conductivity, serve as the primary channels for fluid migration underground. They control the distribution, transport direction, and migration speed of fluids like water, oil, and natural gas (Zhu et al., 2021; Davy et al., 2024). Accurately describing fluid flow in fractured media is a key theoretical foundation for deep engineering applications, including nuclear waste disposal (Follin et al., 2014; Gao et al., 2022b), geothermal engineering (Gao et al., 2022a; Gao et al., 2023), CO2 geosequestration (Kim et al., 2019), and oil and gas engineering (Yaghoubi, 2019), as shown in Figure 1a. This is essential for more refined and transparent management. The absence of accurate quantitative predictions of fluid movement has hindered efforts to optimize critical subsurface energy production activities.
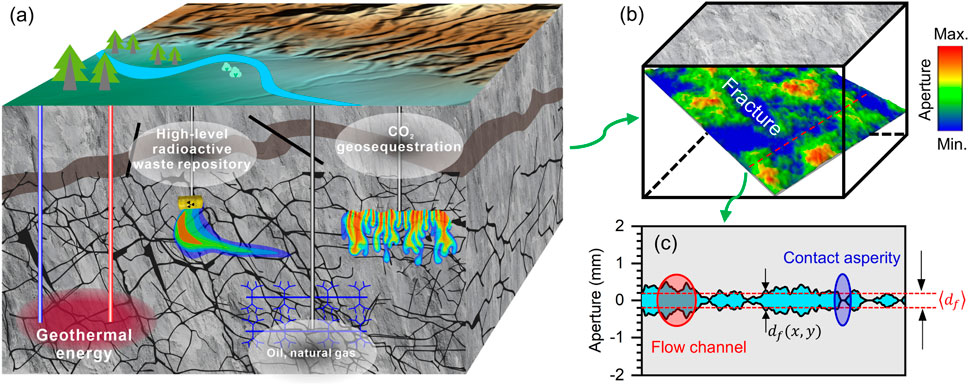
Figure 1. (a) Applications of subsurface fracture systems. A schematic diagram illustrating (b) a fracture with complex heterogeneity and (c) synthesized fracture profiles.
Initially, fractures were modeled as smooth parallel plates, which led to the development of the flow-diffusion equation (Viswanathan et al., 2022) and the cubic law (Witherspoon et al., 1980; Dijk and Berkowitz, 1999), laying the theoretical foundation for addressing seepage problems in engineering rock masses. The parallel plate model remains crucial for addressing seepage issues in rock masses, particularly under low-velocity Darcy flow conditions. However, no rock fracture is perfectly smooth (Sagy et al., 2007). Advances in high-resolution measurement technologies have documented that fractures exhibit multi-scale heterogeneity, including variable aperture (e.g., Figure 1b), roughness, and contact asperities (e.g., Figure 1c) (Nemoto et al., 2009; Kang et al., 2020). These heterogeneous fracture characteristics induce uneven flow patterns, known as flow channelization phenomena (Tsang and Neretnieks, 1998; Ishibashi et al., 2012; Krietsch et al., 2020). Flow channelization does not distribute the flowing fluid throughout the fracture cavity as expected in the parallel plate model. Instead, fluid follows restricted pathways (Xiong et al., 2022; Gao et al., 2023). Fractures consist of two parts: the contact domain (formed by compression and chemical deposition) and the voids. Localized contact asperities, resulting from compressive stress, significantly hinder fluid movement. Tortuous flow patterns due to these asperities have been observed in experiments (Naets et al., 2022), simulations (Hyman et al., 2021; Gao et al., 2022a), and field tests (Tsang et al., 1991; Krietsch et al., 2020). Numerous studies have shown that contact asperities in fractures can lead to significant deviations in estimating hydraulic aperture or permeability, potentially making the parallel plate model inaccurate. Thus, accurately assessing the hydraulic properties of underground heterogeneous fractures remains a key challenge in Earth and Energy Sciences.
Efforts have been made to integrate the heterogeneous characteristics of fractures, especially roughness and contact ratio, into classical flow models to improve the accuracy of seepage representation. For example, Louis and Maini (1970) addressed the estimation bias of the equivalent hydraulic aperture by introducing roughness. Additionally, Barton (1982) corrected the equivalent hydraulic aperture using the joint roughness coefficient (JRC), but neglected fracture surface heterogeneity, leading to an overestimation of fracture flow. The size of the voids determines fracture flow characteristics (Javanmard et al., 2021; Wei et al., 2023), making it difficult to estimate hydraulic parameters using metrics based on the geometric topology of fracture surfaces, such as scaled standard deviation of asperity heights (Barton and Quadros, 1997), JRC, and fractal dimension (Chen et al., 2017). Beyond roughness, contact points within the fracture affect the difference between hydraulic and mechanical apertures (Yang et al., 2021). Under constant normal load (CNL) or constant normal stiffness (CNS) constraints, Li et al. (2008) developed a new shear flow testing device and proposed an empirical relationship to assess the influence of contact area and surface roughness on fluid flow behavior in rock fractures. It was reported that a dispersed distribution of the contact area can significantly lower the threshold for the effectiveness of the cubic law. A key advancement is that Walsh (1981) used the contact ratio to correct the bias in the equivalent hydraulic aperture, and Zimmerman et al. (1992) subsequently provided shape factors for different contact domains. However, any geophysical or geochemical behavior that alters the formation’s stress state can change the range of the contact area (Javanmard et al., 2021). The proposed expressions are generally based on the geometric statistical characteristics of unloaded fractures, which limits their applicability to theoretical studies. An outstanding question in this context is how the contact ratio of a loaded fracture affects its hydraulic properties.
This study aims to quantitatively assess the impact of contact ratio on the permeation performance of fractures. Specifically, we focus on how randomly contacting asperities influence the hydraulic conductivity of fractured media under compressive stress. In the following sections, we first introduce the method for measuring the true granite fracture contact ratio and obtain a basic dataset of contact ratios in Section 2. In Section 3, we describe the methodology for preparing contact-type fractures and conducting seepage testing experiments. Section 4 presents the experimental results and analyzes the mechanism by which the contact ratio affects the fracture permeability properties. Additionally, a bivariate empirical model is provided to address the limitations of traditional models. Section 5 provides a discussion on why permeability exhibits anomalous behavior under different contact ratio scenarios and outlines the limitations of this study.
2 Measuring the contact ratio of granite fractures
2.1 Measuring principle
Firstly, the contact ratio of tight granite fractures was measured to prepare data for test sample preparation. The density of the granite specimen is 2601.67 kg/m3, the porosity is 1.183%, and the matrix permeability is 0.336 mD. Intact granite fractures are created with rough surfaces resembling the natural state using the Brazilian splitting method. Compared to computed tomography (CT) scanning, 3D laser, and reverse mode methods, the pressure-sensitive film offers a more convenient and cost-effective testing solution. The measurement principle relies on the dyeing characteristics of pressure-sensitive film, and its applicability has been validated by Nemoto et al. (2009) and Li et al. (2023).
Figure 2 illustrates the measurement process of the fracture contact ratio. The pressure-sensitive film consists of microcapsules, a color-developing layer (A-film), and a base layer (B-film), and is placed on the fracture surface. Initially, a mechanical device applies a normal load to the fractures, maintaining the target pressure for 2 min. When the pressure on the microcapsules exceeds the rated threshold, they rupture, releasing a color-developing material that reacts with the agent in the color-developing layer, forming red spots of varying brightness. The red image is then converted into grayscale, and the frequency characteristics of the grayscale values are analyzed.
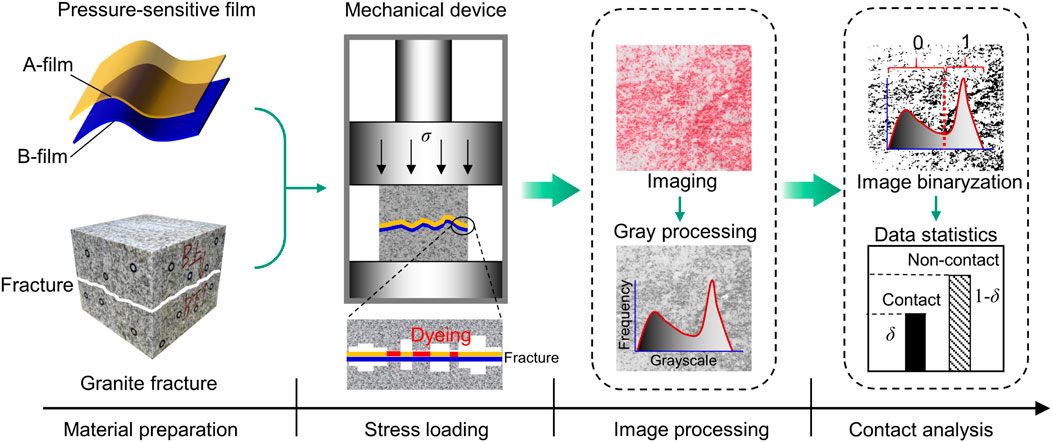
Figure 2. Measurement process of fracture contact ratio.
Finally, a grayscale threshold is defined following the method proposed by Choi et al. (2019) and Nemoto et al. (2009). Grayscale values exceeding the threshold are defined as 1 (non-contact pixels), while values below the threshold are defined as 0 (contact pixels). Consequently, the grayscale image is converted into a binary image. As a result, the fracture contact ratio δ (%) under varying normal stress conditions can be calculated using the following formula:
where
The normal stress (

Table 1. Contact ratio measurement scheme.
2.2 Contact ratio statistics
Figure 3a clearly illustrates the spatial features of the interlaced distribution of contact domains and voids within the fractures. The similar spatial structures observed at different normal pressures confirm the repeatability and reliability of the pressure-sensitive film method. Figure 3b shows the relationship between the contact ratio and normal stress, revealing a positive correlation. The average contact ratios at normal stresses of 5, 10, 15, 20, and 30 MPa are 16.7%, 32.8%, 44.5%, 52.3%, and 66.4%, respectively. These results are similar to those reported by Li et al. (2023), Song et al. (2021), and Watanabe et al. (2009).
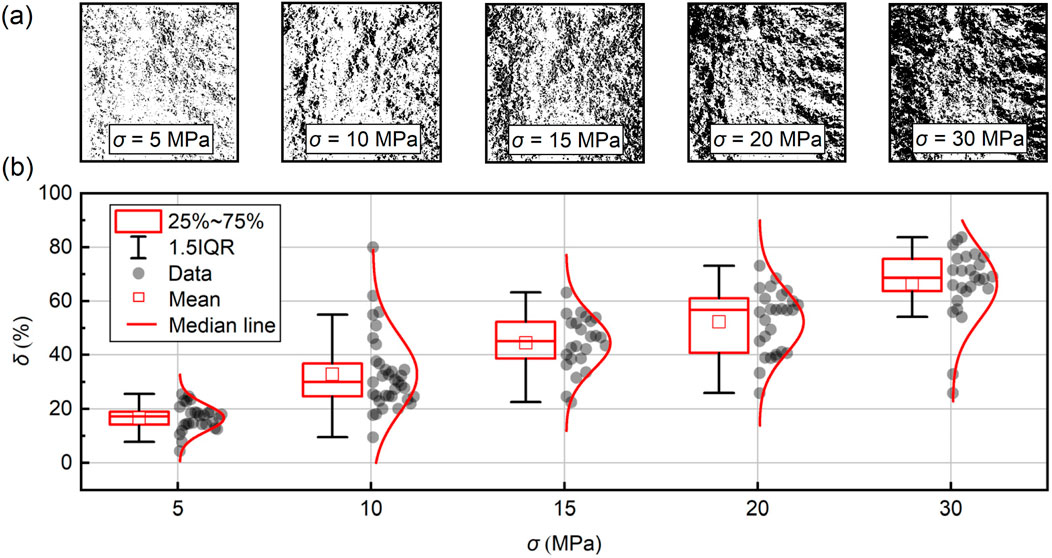
Figure 3. Contact ratio statistics under different normal stresses. (a) The measurement image of a fracture with dimensions of 100 × 100 × 100 mm3. (b) Contact ratio.
It is important to emphasize that the distribution of the contact ratio under the same stress conditions is discrete, reflecting the strong anisotropy of natural fractures. The contact ratio data typically follow a normal distribution. The binary image clearly reveals the presence of contact asperities in rough fractures. These randomly distributed contact protrusions occupy the flow channel space, constraining the fluid flow paths and significantly affecting the hydraulic properties of the fracture.
3 Seepage experimental methodology
3.1 Preparation of fractures with contact asperities
The measurement results in Section 2 provide the data needed to prepare fracture specimens with varying contact ratios. A 304 stainless steel sheet, with a diameter of 6 mm and a thickness of 0.1 mm, is attached to the smooth fracture wall to simulate natural contact asperities. Smooth fractures were created by symmetrically cutting a cylindrical core with a diameter of 50 mm and a length of 100 mm. Note that we focus is solely on the role of contact asperities in seepage; the effects of variable aperture and roughness are excluded for the smooth fracture sample. The distribution of contact asperities on the fracture wall is determined using a random placement method to simulate the heterogeneous nature of natural fractures. The contact ratio (δ) is calculated from the number of discs (
where
Fracture specimens with varying contact ratios are obtained by adjusting the number of discs (N) according to Equation 2. Based on the granite contact ratio measurements (Figure 3), five contact ratio levels were established: 10%, 20%, 30%, 40%, and 50%. To minimize the uncertainty due to random placement, each contact ratio level was repeated 20 times, resulting in a total of 100 contact fracture specimens. Figures 4a–e show the distribution of contact asperities at different contact ratios. As the contact ratio increases, the flow channel narrows, hindering fluid passage through the fractures.

Figure 4. Random contact asperity distribution with contact ratios of (a) 10%, (b) 20%, (c) 30%, (d) 40%, and (e) 50%.
The process for preparing the fracture specimens is illustrated in Figure 5. First, digital geometries are generated using a random placement method. A laser cutter is then used to cut the stainless steel sheets according to the digital geometry. The cut sheets (50 mm × 100 mm) serve as molds to position the contact asperities, while the cut discs simulate the asperities. The stainless steel mold is carefully aligned with the flat fracture surfaces, and the discs are placed accordingly. Once the target contact ratio is achieved, the mold is removed, leaving the discs to form an uneven arrangement of contact asperities. Finally, the two fracture halves are rejoined, aligned, and secured with heat shrink tubing to prevent the discs from shifting. This process is repeated to prepare fracture specimens for all contact ratios.
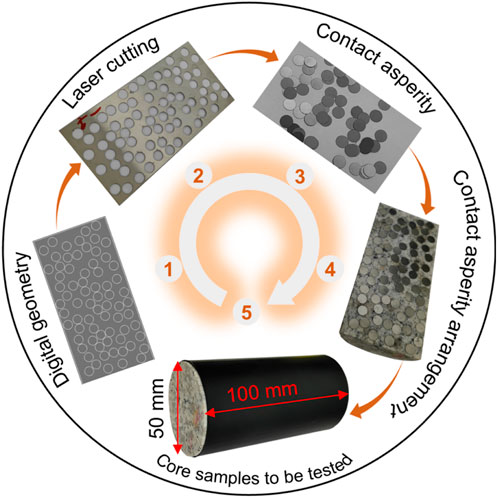
Figure 5. Preparation process for single-fracture rock core samples with random contact asperities.
3.2 Experiment description
Single-phase seepage measurements were conducted on samples S1-S5 using a custom core seepage testing system, as illustrated in Figure 6. The system comprises an injection pump, a core holder, and a data acquisition module. The injection pump is an HXH-100B dual-cylinder model with constant flow and pressure capabilities, providing a maximum flow rate of 29.7 mL/min and an accuracy of 0.3%. In constant pressure mode, the pump applies a specified confining pressure to the core holder, while in constant flow mode, it maintains a consistent flow rate through the sample. Fluid pressure at the inlet is monitored by a PT131 pressure transmitter, which has a range of 0–1 MPa and an accuracy of 0.1%. The core holder accommodates cylindrical rock samples with a diameter of 50 mm and a length ranging from 50 to 200 mm, and is designed to withstand a maximum confining pressure of 30 MPa. The injection pump injects distilled water into horizontally placed, pre-fractured samples, while sensors measure the resulting flow pressure and rate.
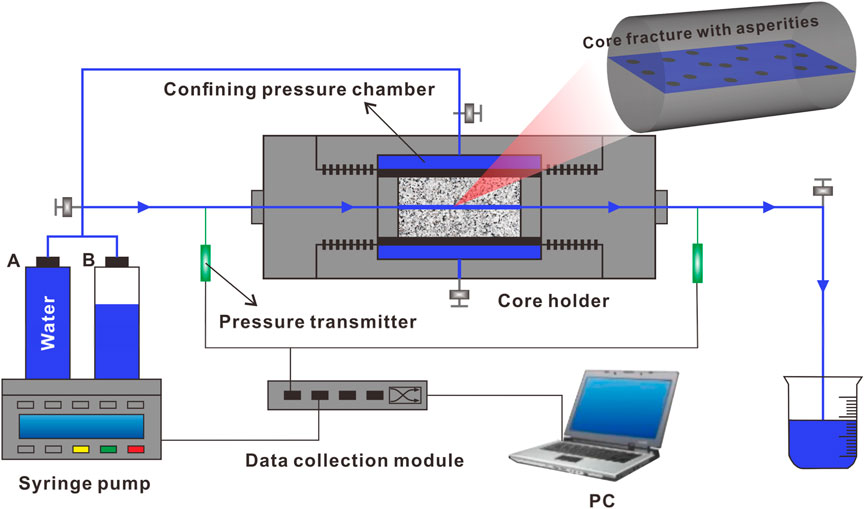
Figure 6. Core seepage testing system.
Based on the capabilities of the injection pump and core holder, five confining pressure levels and six injection flow rates were set for each contact fracture specimen. Table 2 summarizes the experimental scheme. A total of 100 samples were tested. The main steps of the contact fracture seepage experiment are as follows:
1. Attach stainless steel discs to the fractures using contact asperities generated by a random placement method, and encapsulate the core with heat shrink tubing.
2. Position the rock core fractures horizontally in the core holder and apply the target confining pressure.
3. Inject distilled water into the core sample at the pre-set flow rate, and record the injection pressure at each stage after the flow rate stabilizes.
4. Increase the confining pressure level. Repeat step 3 until the seepage experiment for the current contact ratio sample is completed.
5. Replace the core with the next contact ratio level and repeat the above steps until all contact ratio levels have been tested.
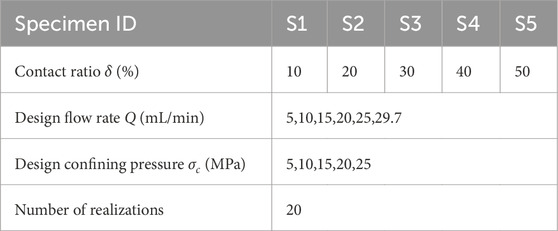
Table 2. Flow test experimental scheme.
3.3 Contact ratio dependence of permeability
Assuming the fluid is viscous and incompressible, and the flow is steady and laminar, the volumetric flow rate
where D is the fracture width;
By measuring the
Then, based on the cubic law, the permeability of a single smooth fracture can be calculated:
Unfortunately, the fracture interface is irregular, with unevenly distributed asperities, which disrupts the permeability estimation theory based on the cubic law. Efforts have been made to correlate the hydraulic aperture
Furthermore, considering the variability in the aperture of the fracture voids, Zimmerman and Bodvarsson (1996) proposed a prediction model based on contact ratio, mechanical aperture
where
Since the experimental samples were designed without considering the rough characteristics of natural fractures, Equations 10, 11 can be simplified as follows:
where
4 Results
4.1 Evolution of fracture flow rate
We recorded the relationship between the volume flow rate and the pressure gradient for fractures with different contact ratios under varying confining pressures, as shown in Figure 7. The gray lines represent 20 samples from the randomly distributed asperity model, where each column corresponds to an increase in confining pressure (left to right), and each row corresponds to an increase in contact ratio (top to bottom). Figure 7 shows that under the experimental conditions, the volume flow rate and the water pressure gradient exhibit a linear positive correlation, indicating that fluid flow within the fractures follows darcy’s law and exhibits laminar flow behavior. The water pressure gradient ranges from 0 to 4 MPa/m, with the majority concentrated between 0 and 2.5 MPa/m. For fractures with a contact ratio above 20%, the water pressure gradient is consistently below 1 MPa/m.
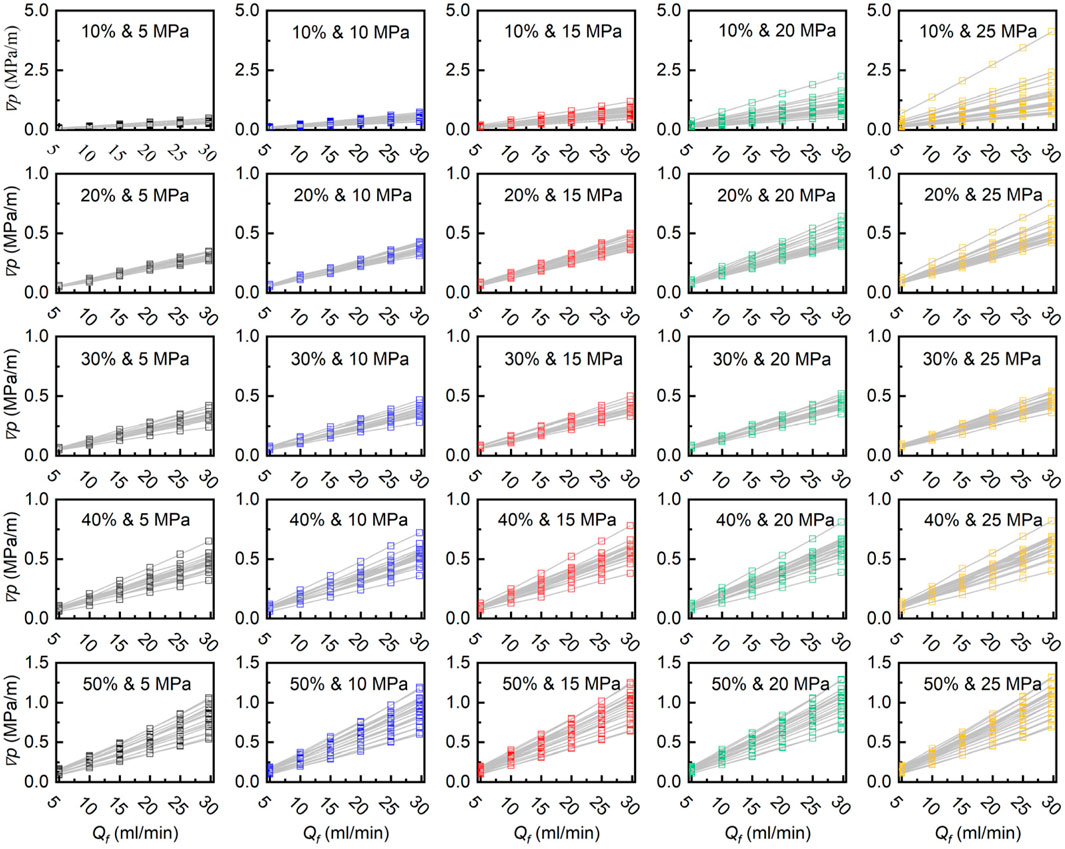
Figure 7. Evolution of the flow rate versus pressure gradient for fractures with differing contact ratios.
When the contact ratio is below 20%, as the confining pressure increases, slight compressive deformation reduces the fracture channels, causing the water pressure gradient to rise and its slope to steepen. Even with a consistent contact ratio, the varying distribution of contact asperities alters the water pressure gradient, reflecting the resistance encountered by the fluid, as shown by the scattered data points in Figure 7. In scenarios with low contact rates (e.g., 10%, 20%), increased confining pressure results in greater dispersion of the measured
The average water pressure gradient from 20 realizations was used to assess the effect of the contact ratio on the water pressure gradient, as shown in Figure 8. As the contact ratio increases, the average water pressure gradient initially decreases and then increases. When the confining pressure increases from 5 MPa to 25 MPa, the decrease in the average water pressure gradient during the declining phase becomes more pronounced, with a marked increase in the slope of the curve. In contrast, the increase during the rising phase is less significant. The relationship between the average water pressure gradient and contact ratio is nonlinear in both phases. Specifically, during the phase where
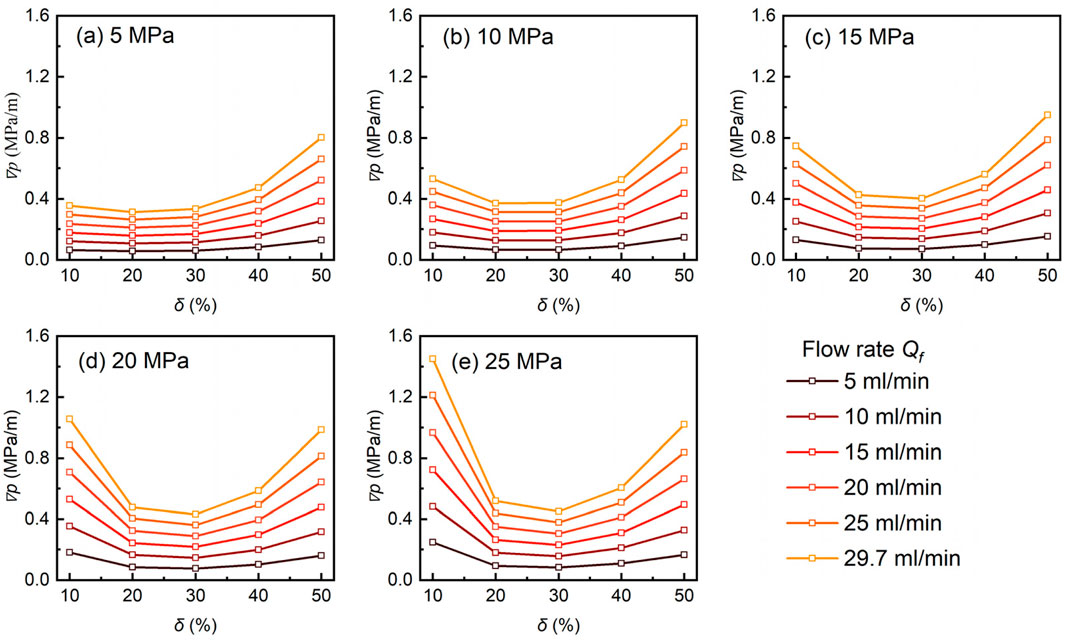
Figure 8. The relationship between pressure gradient and contact ratio under different pressures: (a) 5 MPa, (b) 10 MPa, (c) 15 MPa, (d) 20 MPa, and (e) 25 MPa.
4.2 Hydraulic properties of fractures
Based on flow rate and pressure gradient data, Figure 9 illustrates the evolution of the equivalent hydraulic aperture with contact ratio under different confining pressures. As the contact ratio increases, the equivalent hydraulic aperture initially increases and then decreases, which aligns with the pressure gradient trend shown in Figure 8. Notably, within the contact ratio range of 10%–50%, the equivalent hydraulic aperture of the fractures ranges from 30 to 80 μm. This is significantly larger than the test results for straight fractures without contact asperities. A possible reason for this is that the contact asperities maintain voids in the fracture channels through which fluid can flow, reducing the closure effect of the fractures under confining pressure.
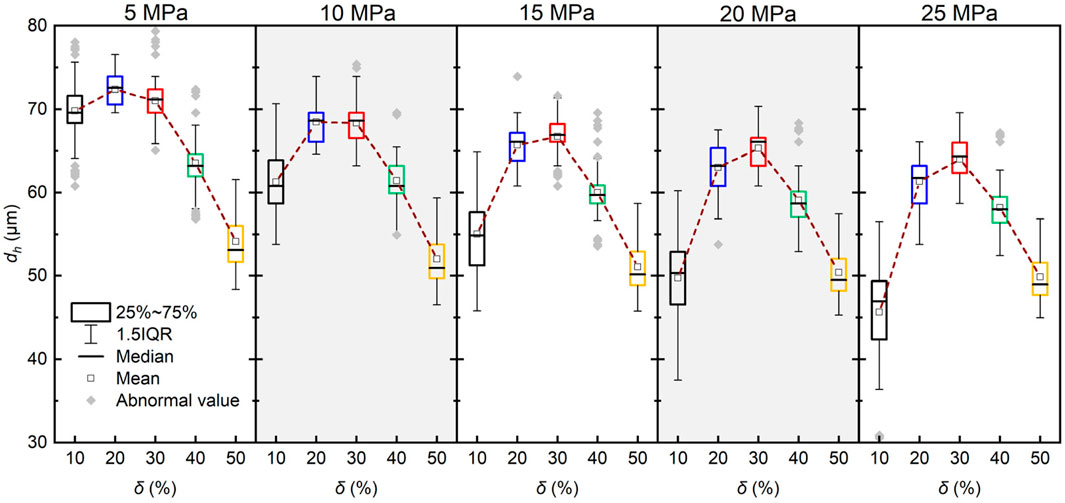
Figure 9. The evolution of the equivalent hydraulic aperture with the contact ratio under different confining pressures.
Figure 10 presents the evolution of the equivalent permeability of fractures with confining pressure under different contact ratios. As confining pressure increases, the equivalent permeability of the fractures gradually decreases and stabilizes, consistent with previous studies (Chen et al., 2017). Notably, at higher contact ratios (e.g., S4, S5), the influence of confining pressure on fracture permeability reduction becomes negligible. According to Tsang and Witherspoon (1981), and Zimmerman et al. (1992), when δ < 25%, the position of the contact body has a negligible effect on the fracture permeability. However, Figure 10 shows that the permeability data for lower contact ratios are more scattered, suggesting that fracture permeability at low contact ratios is more significantly influenced by the contact position than at higher contact ratios.
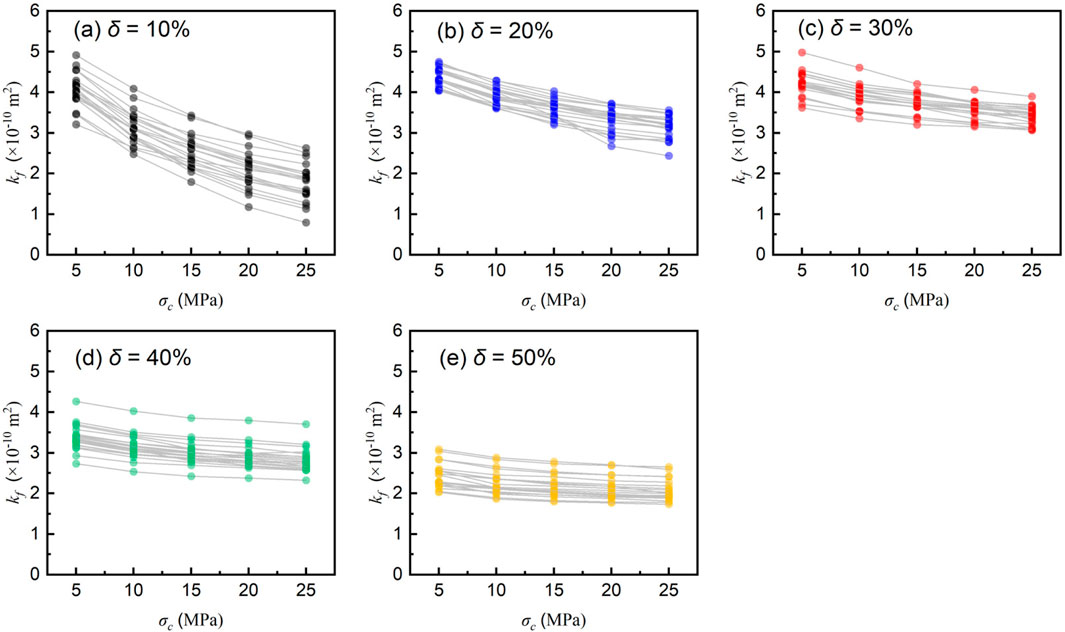
Figure 10. The relationship between permeability and confining pressure under different contact ratios: (a) 10%, (b) 20%, (c) 30%, (d) 40%, and (e) 50%.
To demonstrate the impact of contact ratio on the permeability of fractured pores, Figure 11 shows the trend of the arithmetic mean permeability, calculated from 20 realizations, as it evolves with confining pressure. It is well documented that fractures permeability follows an exponential decay as confining pressure increases. Therefore, the following exponential function was used to model the relationship between permeability and confining pressure (Rutqvist et al., 2002; Lei et al., 2021):
where
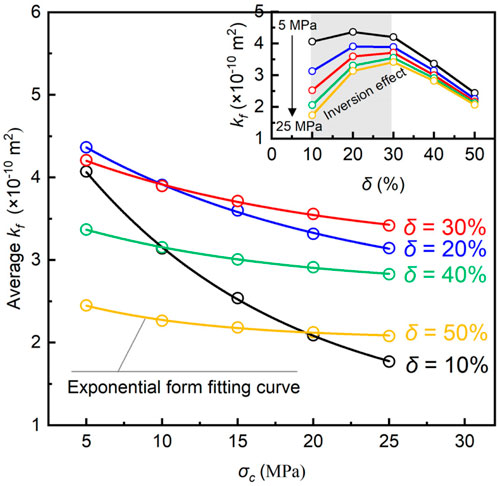
Figure 11. The evolution of the average permeability with confining pressure.
Figure 11 shows that fracture permeability in scenarios with lower contact ratios (e.g., 10%) is more sensitive to changes in confining pressure compared to higher contact ratios (e.g., 40%–50%). Specifically, as the confining pressure increases from 5 MPa to 25 MPa, the average permeability of fractures at a 10% contact ratio decreases from 4.07 × 10⁻¹⁰ m2 to 1.77 × 10⁻¹⁰ m2 (a 56.5% reduction), while the average permeability at a 50% contact ratio case decreases from 2.45 × 10⁻¹⁰ m2 to 2.08 × 10⁻¹⁰ m2 (a 17.7% reduction). Table 3 lists the fitting results of Equation 13, with high R2 values further confirming the exponential relationship between permeability and confining pressure.
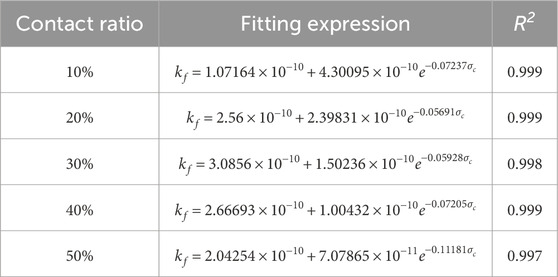
Table 3. Exponential fitting expression of permeability and confining pressure.
4.3 The performance of the estimation model contact ratio-based
Traditional contact-based equivalent hydraulic aperture prediction models have been widely proposed (Kirkpatrick, 1973; Walsh, 1981; Zimmerman and Bodvarsson, 1996; Yeo, 2001). However, their applicability under compression conditions requires further examination. Figure 12a shows the relationship between
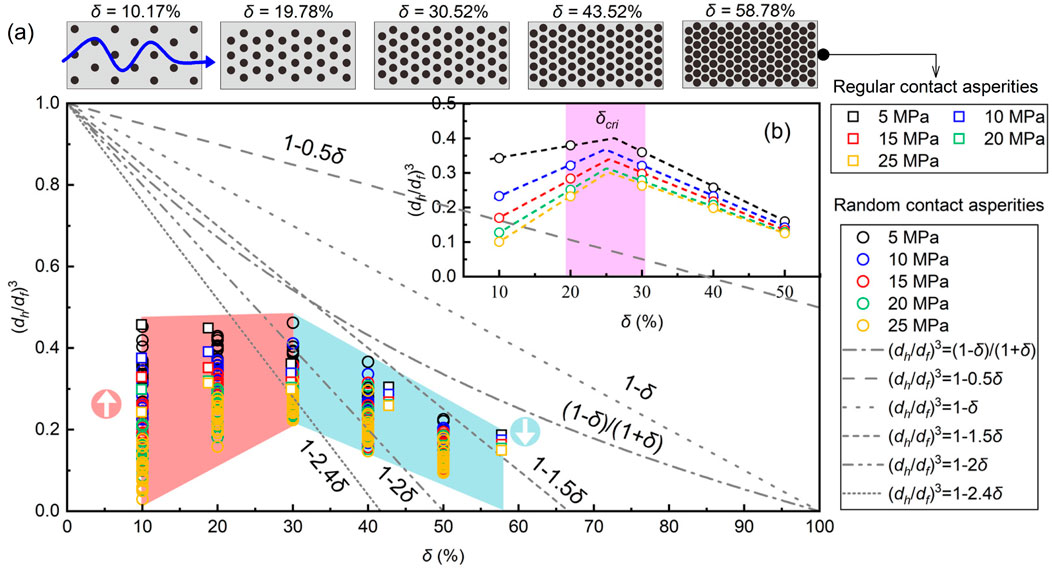
Figure 12. (a) The evolution of
Interestingly, under lower contact ratio scenarios,
4.4 Prediction of permeability considering both contact ratio and confining pressure
Figure 11 confirms that fracture permeability is sensitive to both contact ratio and confining pressure. Typical thermal-hydraulic-mechanical models in fractured rock masses account only for the stress effect, neglecting the uneven compression process caused by contact ratio, including the inversion effect shown in Figure 12. Consequently, a new fracture permeability model that incorporates both contact ratio and stress is needed. Table 4 presents the exponential relationship between permeability and confining pressure, as described by Equation 13. The coefficients
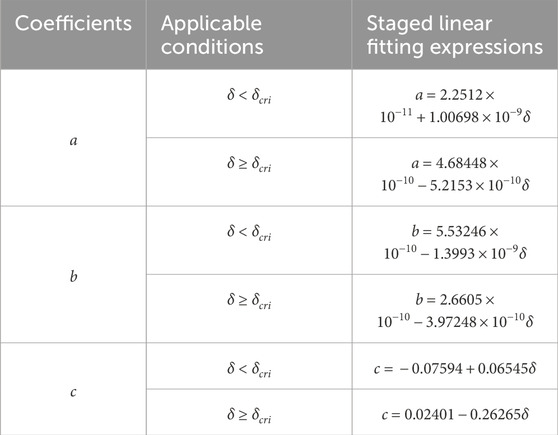
Table 4. Summary of coefficient term fitting results.
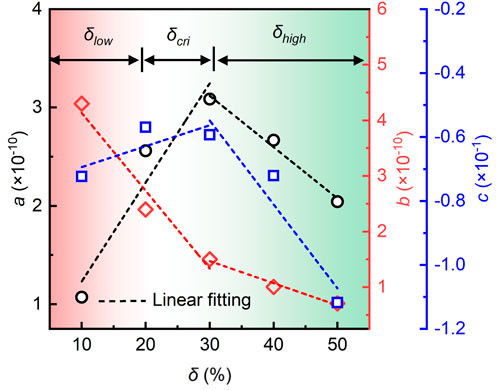
Figure 13. The staged linear fitting relationship between the coefficient terms of the fracture permeability exponential model and the contact ratio.
The fitting results allow us to develop an empirical prediction model for contact-type fracture permeability, which simultaneously considers contact ratio and confining pressure, as follows:
where, Table 4 presents the values of
Using the prediction model, Figure 14 compares the measured permeability with the predicted permeability for all test cases, including those with regular contact asperity fractures. The linear regression fit (red line) for all data is used to evaluate the model’s performance. It is observed that the linear fit closely matches the 1:1 line. The root mean square error (RMSE) between the observed log10(kf) and the predicted log10(kf) is 0.057, indicating that the predictive model performs well. Additionally, nearly all the data points are distributed within the 95% prediction interval. These results suggest that the developed prediction model accurately captures the relationship between permeability, confining pressure, and contact ratio, demonstrating high reliability. However, it can also be observed that some of the discrete data points deviate significantly from the 1:1 line, indicating the complexity of permeability in fractured rock masses. For regular contact asperities, the predicted permeability is generally underestimated. The model performs better for cases with higher contact ratios compared to those with lower contact ratios.
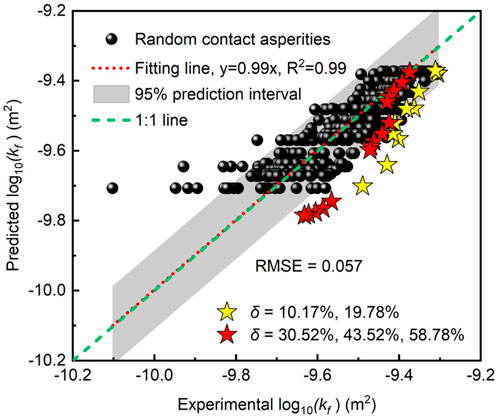
Figure 14. The prediction performance of the permeability model considering both contact ratio and stress.
5 Discussion
The unpredictability of geological rock masses makes it challenging to accurately capture the permeability properties of rock fractures. In this study, fracture specimens with random contact asperities were prepared based on benchmark contact ratios derived from measured rough granite fractures. A custom-made seepage testing system was used to obtain the hydraulic properties of fractures with varying contact ratios. The study examines how the contact ratio influences the evolution of fracture permeability characteristics under confining pressure. A key inversion effect in fracture permeability was identified, and an empirical prediction model was developed to address the knowledge gap in traditional hydraulic coupling, where the contact ratio is often neglected. This work provides a theoretical foundation for future high-precision modeling.
An interesting finding is that fracture permeability, with varying contact ratios, exhibits different sensitivities to confining pressure, as shown in Figure 11. Specifically, fractures with lower contact ratios experience a faster decay in permeability as stress increases, compared to fractures with higher contact ratios. This phenomenon has also been observed in previous studies (Cardona et al., 2021; Fan et al., 2024), but the role of fracture contact ratio in this process remains unclear. Most studies attribute this behavior to roughness, with smooth, flat fractures being more likely to close under confining pressure, while rougher fractures are less likely to close (Fang et al., 2018; Ji et al., 2023). However, the impact of contact ratio has not been sufficiently emphasized or quantified. Notably, the permeability associated with this uneven stress response process could provide deeper insights into channelized flow in subsurface environments. Mechanical aperture is typically considered the primary cause of channelized flow at both the network and individual fracture scales (Hyman et al., 2021; Gao et al., 2022a; Gao et al., 2023). Our research indicates that fractures with higher contact provide preferential pathways for fluid flow, while fractures with lower contact tend to reduce the initial flow channels under compression. The normal compression of these low-contact fractures is highly likely to result in flow blockage. Specifically, the normal compression closure of low-contact fractures is highly likely to cause the loss of their intrinsic permeability, leading to the formation of flow short-circuiting phenomena within the fracture system. Furthermore, although it has been confirmed that fractures exhibit highly uneven contact, the current multi-field coupled modeling of complex fracture networks still treats all sub-fractures equally and does not account for the permeability variation response induced by contact ratio. Therefore, this may be one of the reasons why the results of traditional multi-field coupled modeling are unsatisfactory.
Another important finding is that, to the best of our knowledge, this is the first observation of an inversion effect in the equivalent hydraulic aperture and permeability as the contact ratio increases during fracture flow experiments (Figures 9–12). Specifically, at lower contact ratios, the equivalent hydraulic aperture shows anomalous behavior, increasing as the contact ratio rises. This result contradicts conventional understanding, which suggests that an increase in contact ratio theoretically raises resistance to fluid flow, thus reducing permeability (Walsh, 1981; Zimmerman and Bodvarsson, 1996; Yeo, 2001). Traditional equivalent hydraulic aperture prediction models have often overlooked the impact of confining pressure in the subsurface. Our results indicate that such models, which rely solely on contact ratio, are not applicable in low contact ratio scenarios (Figure 12). To further explain the observed permeability inversion effect in fractures, we employ a simplified contact fracture model, as shown in Figure 15. In this model (Figure 15a), we assume that the fracture consists of cylindrical bodies of uniform size, and fracture cross-sections at different contact ratios can be approximated by a simply supported beam model.
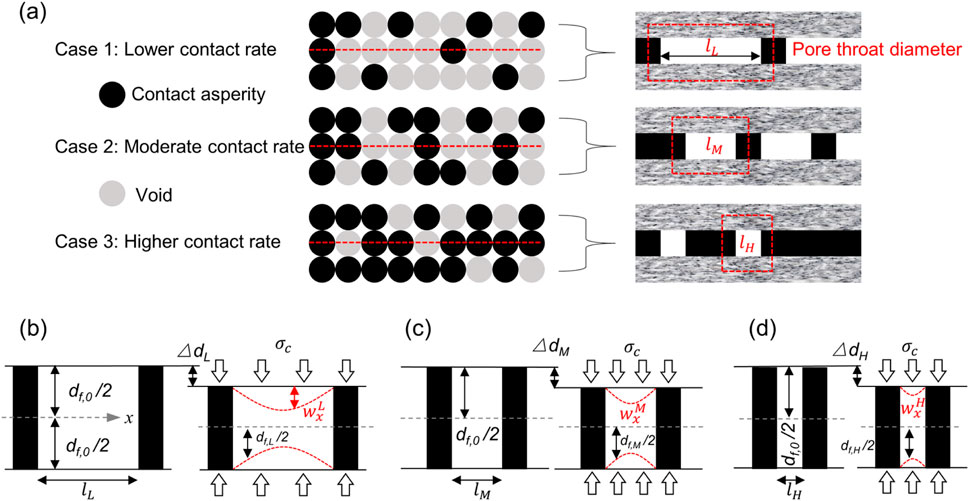
Figure 15. Schematic of fracture deformation model with random contact asperities. (a) Simplified contact-type fracture model; Schematic diagram of compressive deformation for fracture cases with (b) lower contact ratio, (c) moderate contact ratio, and (d) higher contact ratio.
Clearly, the lower the contact ratio, the larger the pore throat diameter (
where
According to Equation 15, the compressive deformation of the contact asperity,
where
Therefore, the fracture aperture within a single pore throat can be expressed as:
where
After simplification, the cross-sectional areas for the three contact ratio ranges can be obtained as follows:
where the first term (
When the contact ratio increases from
where
Correspondingly, the difference in closure under pressure before and after the increase in contact ratio from
According to Equations 19–21, compressed contact-type fractures achieve the permeability inversion effect by adjusting the relative magnitudes of the initial throat cross-sectional area and void closure. Specifically, at low fracture contact ratios, void closure plays a decisive role in fracture permeability. In this range, the reduction in permeability due to fracture closure is much more pronounced than the reduction in the initial throat cross-sectional area caused by the increase in contact ratio. As a result, fracture permeability exhibits an anomalous positive correlation with the contact ratio (Figures 11, 12). However, at high fracture contact ratios, the reduction in throat cross-sectional area due to the increase in contact asperities becomes the dominant factor affecting fracture permeability. In this range, the contribution of fracture closure to permeability is minimal. Consequently, fracture permeability shows a typical negative correlation with the contact ratio, in line with traditional models (Figures 11, 12).
A review of early traditional hydraulic coupling models reveals that equivalent permeability prediction rely either on contact ratio or stress, but not both simultaneously (Zhang and Chai, 2020; Gao M. et al., 2022; Pu et al., 2025). Based on experimental results, we have developed a two-parameter empirical model that links stress and permeability, effectively characterizing the evolution of permeability. A key practical implication is that this model serves as a valuable tool for high-fidelity hydraulic coupling modeling of underground rock mass fractures. By estimating the contact ratio within each fracture unit of the rock mass system, engineers or researchers can apply a dedicated permeability-stress coupling model, thereby improving the modeling accuracy. However, obtaining the true contact ratio of underground fractures remains challenging, which limits the convenience of the empirical model. Fortunately, with the rapid development of deep learning-based agent models, it is now become possible to estimate the contact ratio quickly using data such as flow, breakthrough curves (BTC), and temperature (Wu et al., 2021; Wang et al., 2025).
It is important to note that there are some limitations to this work, primarily including the fact that the prepared contact fractures do not account for the variability and anisotropy of the aperture field. The permeability properties of natural fractures result from the combined influence of various geological factors, and any missing information about fracture characteristics may lead to inaccurate permeability modeling. Furthermore, the stainless steel sheet used to simulate the contact asperities exhibits significant physical property differences compared to the actual rock contact asperities, which is another limitation. For example, the stainless steel sheet is not as easily compressed or damaged as the rock contact asperities. In future work, it is expected that high-precision 3D printing will be used to prepare replicable fracture specimens. The focus will be on studying the role of aperture field variability in the anomalous evolution of permeability, further expanding the application boundaries of the proposed empirical model.
6 Conclusion
In this study, we quantified the roles of contact ratio and stress in the evolution of permeability properties through laboratory-scale seepage tests and developed a predictive model that couples these two factors. The main conclusions of this work are summarized as follows:
•Under normal loadings of 5 MPa–30 MPa, the contact ratio of granite fractures ranges from 14.5% to 76.38%, exhibiting a logarithmic positive correlation with the normal load. In high-stress, high-contact-rate scenarios, fractures maintain linear flow behavior. The sensitivity of hydraulic gradient and equivalent hydraulic aperture to stress is more pronounced in low-contact-rate scenarios. Additionally, traditional prediction models for equivalent hydraulic aperture are not applicable in low-contact-rate scenarios.
•The permeability of contact-type fractures exhibits an inversion effect as the contact ratio increases, particularly showing an anomalous positive correlation at low contact ratios. At lower contact ratios, fracture closure plays a decisive role in the evolution of permeability. As the contact ratio increases, the contact asperities reduce the initial pore throat cross-sectional area, which subsequently dominates permeability. The competitive variations between fracture closure and the initial pore throat cross-sectional area are the underlying causes of the reversal effect.
•The evolution of fracture permeability with stress follows a generalized exponential decay relationship. The permeability-stress relationship exhibits differential responses at varying contact ratios. Specifically, lower contact ratio result in more significant permeability decay. A permeability prediction model that incorporates both stress and contact ratio can more accurately capture the permeability of contact-type fractures.
Data availability statement
The original contributions presented in the study are included in the article/supplementary material, further inquiries can be directed to the corresponding author.
Author contributions
XG: Investigation, Conceptualization, Validation, Funding acquisition, Writing – original draft, Writing – review and editing, Project administration, Visualization, Methodology. HW: Data curation, Validation, Investigation, Writing – review and editing, Visualization, Resources. DM: Supervision, Resources, Investigation, Project administration, Writing – review and editing, Funding acquisition. YZ: Data curation, Resources, Visualization, Writing – review and editing, Validation. HY: Validation, Formal Analysis, Data curation, Visualization, Writing – review and editing, Investigation, Resources. YH: Writing – review and editing, Formal Analysis, Data curation, Investigation, Visualization, Resources.
Funding
The author(s) declare that financial support was received for the research and/or publication of this article. This study was funded by the National Natural Science Foundation of China (Nos. 52404157, U23B2091, U24B2041), the China Postdoctoral Science Foundation (No. 2024M763550), and the Deep Earth Probe and Mineral Resources Exploration–National Science and Technology Major Project (No. 2024ZD1003707).
Conflict of interest
Author HW were employed by Shandong Energy Group Xibei Mining Co. Ltd.
The remaining authors declare that the research was conducted in the absence of any commercial or financial relationships that could be construed as a potential conflict of interest.
Generative AI statement
The author(s) declare that no Generative AI was used in the creation of this manuscript.
Any alternative text (alt text) provided alongside figures in this article has been generated by Frontiers with the support of artificial intelligence and reasonable efforts have been made to ensure accuracy, including review by the authors wherever possible. If you identify any issues, please contact us.
Publisher’s note
All claims expressed in this article are solely those of the authors and do not necessarily represent those of their affiliated organizations, or those of the publisher, the editors and the reviewers. Any product that may be evaluated in this article, or claim that may be made by its manufacturer, is not guaranteed or endorsed by the publisher.
References
Barton, N. (1982). Modelling rock joint behavior from in situ block tests: implications for nuclear waste repository design. Salt Lake City: Terra Tek, inc.
Barton, N., and Quadros, E. F. d. (1997). Joint aperture and roughness in the prediction of flow and groutability of rock masses. Int. J. Rock Mech. Min. 34 (3-4), 252. doi:10.1016/s0148-9062(97)00288-x
Bonnet, E., Bour, O., Odling, N. E., Davy, P., Main, I., Cowie, P., et al. (2001). Scaling of fracture systems in geological media. Rev. Geophys. 39 (3), 347–383. doi:10.1029/1999rg000074
Cardona, A., Finkbeiner, T., and Santamarina, J. C. (2021). Natural rock fractures: from aperture to fluid flow. Rock Mech. Rock. Eng. 54 (11), 5827–5844. doi:10.1007/s00603-021-02565-1
Chen, Y., Liang, W., Lian, H., Yang, J., and Vinh Phu, N. (2017). Experimental study on the effect of fracture geometric characteristics on the permeability in deformable rough-walled fractures. Int. J. Rock Mech. Min. 98, 121–140. doi:10.1016/j.ijrmms.2017.07.003
Choi, S., Jeon, B., Lee, S., and Jeon, S. (2019). Experimental study on hydromechanical behavior of an artificial rock joint with controlled roughness. Sustainability 11 (4), 1014. doi:10.3390/su11041014
Davy, P., Goc, R. L., Darcel, C., Pinier, B., Selroos, J.-O., and Borgne, T. L. (2024). Structural and hydrodynamic controls on fluid travel time distributions across fracture networks. P. Natl. Acad. Sci. U. S. A. 121 (47), e2414901121. doi:10.1073/pnas.2414901121
Dijk, P. E., and Berkowitz, B. (1999). Three-dimensional flow measurements in rock fractures. Water Resour. Res. 35 (12), 3955–3959. doi:10.1029/1999WR900200
Fan, D., Zhang, C., Ji, Y., Zhao, X., Zhao, Z., and He, M. (2024). Permeability evolution of rough fractures in gonghe granite subjected to cyclic normal stress at elevated temperatures: experimental measurements and analytical modeling. Rock Mech. Rock. Eng. 57 (12), 11301–11318. doi:10.1007/s00603-024-04141-9
Fang, Y., Elsworth, D., Ishibashi, T., and Zhang, F. (2018). Permeability evolution and frictional stability of fabricated fractures with specified roughness. J. Geophys. Res-Sol. Ea. 123 (11), 9355–9375. doi:10.1029/2018jb016215
Follin, S., Hartley, L., Rhen, I., Jackson, P., Joyce, S., Roberts, D., et al. (2014). A methodology to constrain the parameters of a hydrogeological discrete fracture network model for sparsely fractured crystalline rock, exemplified by data from the proposed high-level nuclear waste repository site at forsmark, Sweden. Hydrogeol. J. 22 (2), 313–331. doi:10.1007/s10040-013-1080-2
Gao, M., Zhang, C., and Oh, J. (2022). Assessments of the effects of various fracture surface morphology on single fracture flow: a review. Int. J. Min. Sci. Techno. 33 (1), 1–29. doi:10.1016/j.ijmst.2022.07.005
Gao, X., Zhang, Y., Cheng, Y., Yu, Z., and Huang, Y. (2022a). Impact of fractures with multi-scale aperture variability on production observations of geothermal reservoir units. J. Hydrol. 615, 128693. doi:10.1016/j.jhydrol.2022.128693
Gao, X., Zhang, Y., Hu, J., Huang, Y., Liu, Q., and Zhou, J. (2022b). Site-scale bedrock fracture modeling of a spent fuel reprocessing site based on borehole group in northwest, China. Eng. Geol. 304, 106682. doi:10.1016/j.enggeo.2022.106682
Gao, X., Zhang, Y., Cheng, Y., Yu, Z., Hu, Z., and Huang, Y. (2023). Heat extraction performance of fractured geothermal reservoirs considering aperture variability. Energy 269, 126806. doi:10.1016/j.energy.2023.126806
Hodge, M. S., Cottrell, M., Knies, J., and Viola, G. (2025). Discrete fracture network modelling reconstructs fracture array evolution and related petrophysical properties over geological time. Commun. Earth Environ. 6 (1), 183–12. doi:10.1038/s43247-025-02146-y
Hyman, J. D., Sweeney, M. R., Frash, L. P., Carey, J. W., and Viswanathan, H. S. (2021). Scale-bridging in three-dimensional fracture networks: characterizing the effects of variable fracture apertures on network-scale flow channelization. Geophys. Res. Lett. 48 (19), e2021GL094400. doi:10.1029/2021gl094400
Ishibashi, T., Watanabe, N., Hirano, N., Okamoto, A., and Tsuchiya, N. (2012). GeoFlow: a novel model simulator for prediction of the 3-D channeling flow in a rock fracture network. Water Resour. Res. 48, 2011WR011226. doi:10.1029/2011wr011226
Javanmard, H., Ebigbo, A., Walsh, S. D. C., Saar, M. O., and Vogler, D. (2021). No-Flow fraction (NFF) permeability model for rough fractures under normal stress. Water Resour. Res. 57 (3), e2020WR029080. doi:10.1029/2020WR029080
Ji, Y., Zhang, W., Hofmann, H., Cappa, F., and Zhang, S. (2023). Fracture permeability enhancement during fluid injection modulated by pressurization rate and surface asperities. Geophys. Res. Lett. 50 (18), e2023GL104662–13. doi:10.1029/2023gl104662
Kang, P. K., Hyman, J. D., Han, W. S., and Dentz, M. (2020). Anomalous transport in three-dimensional discrete fracture networks: interplay between aperture heterogeneity and injection modes. Water Resour. Res. 56 (11), e2020WR027378. doi:10.1029/2020wr027378
Kim, M., Kim, K.-Y., Han, W. S., Oh, J., and Park, E. (2019). Density-driven convection in a fractured porous media: implications for geological CO2 storage. Water Resour. Res. 55 (7), 5852–5870. doi:10.1029/2019WR024822
Kirkpatrick, S. (1973). Percolation and conduction. Rev. Mod. Phys. 45 (4), 574–588. doi:10.1103/revmodphys.45.574
Krietsch, H., Villiger, L., Doetsch, J., Gischig, V., Evans, K. F., Brixel, B., et al. (2020). Changing flow paths caused by simultaneous shearing and fracturing observed during hydraulic stimulation. Geophys. Res. Lett. 47 (3), e2019GL086135. doi:10.1029/2019gl086135
Lei, Q., Gholizadeh Doonechaly, N., and Tsang, C.-F. (2021). Modelling fluid injection-induced fracture activation, damage growth, seismicity occurrence and connectivity change in naturally fractured rocks. Int. J. Rock Mech. Min. 138, 104598. doi:10.1016/j.ijrmms.2020.104598
Li, B., Jiang, Y., Koyama, T., Jing, L., and Tanabashi, Y. (2008). Experimental study of the hydro-mechanical behavior of rock joints using a parallel-plate model containing contact areas and artificial fractures. Int. J. Rock Mech. Min. 45 (3), 362–375. doi:10.1016/j.ijrmms.2007.06.004
Li, Y., Cui, Y., Gan, Y., and Zhang, Q. (2023). Investigation of the real contact area of tensile fractures with different normal stresses and sizes by using pressure-sensitive films. Eng. Geol. 314, 107010. doi:10.1016/j.enggeo.2023.107010
Louis, C., and Maini, Y. (1970). Determination of in-situ hydraulic parameters in jointed rock. Int. Soc. Rock Mech. Proc.
Naets, I., Ahkami, M., Huang, P.-W., Saar, M. O., and Kong, X.-Z. (2022). Shear induced fluid flow path evolution in rough-wall fractures: a particle image velocimetry examination. J. Hydrol. 610, 127793. doi:10.1016/j.jhydrol.2022.127793
Nemoto, K., Watanabe, N., Hirano, N., and Tsuchiya, N. (2009). Direct measurement of contact area and stress dependence of anisotropic flow through rock fracture with heterogeneous aperture distribution. Earth Planet. Sc. Lett. 281 (1-2), 81–87. doi:10.1016/j.epsl.2009.02.005
Pu, H., Xue, K., Wu, Y., Zhang, S., Liu, D., and Xu, J. (2025). Estimating the permeability of fractal rough rock fractures with variable apertures under normal and shear stresses. Phys. Fluids 37 (3), 036635. doi:10.1063/5.0264267
Rutqvist, J., Wu, Y.-S., Tsang, C.-F., and Bodvarsson, G. (2002). A modeling approach for analysis of coupled multiphase fluid flow, heat transfer, and deformation in fractured porous rock. Int. J. Rock Mech. Min. 39 (4), 429–442. doi:10.1016/S1365-1609(02)00022-9
Sagy, A., Brodsky, E. E., and Axen, G. J. (2007). Evolution of fault-surface roughness with slip. Geology 35 (3), 283. doi:10.1130/g23235a.1
Seybold, H. J., Carmona, H. A., Leandro Filho, F. A., Araujo, A. D., Nepomuceno Filho, F., and Andrade Jr, J. S. (2020). Flow through three-dimensional self-affine fractures. Phys. Rev. Fluids 5 (10), 104101. doi:10.1103/PhysRevFluids.5.104101
Song, C., Nakashima, S., Kido, R., Yasuhara, H., and Kishida, K. (2021). Short- and long-term observations of fracture permeability in granite by flow-through tests and comparative observation by X-Ray CT. Int. J. Geomech. 21 (9), 04021151. doi:10.1061/(ASCE)GM.1943-5622.0002114
Tsang, Y. W. (1984). The effect of tortuosity on fluid flow through a single fracture. Water Resour. Res. 20 (9), 1209–1215. doi:10.1029/WR020i009p01209
Tsang, C.-F., and Neretnieks, I. (1998). Flow channeling in heterogeneous fractured rocks. Rev. Geophys. 36 (2), 275–298. doi:10.1029/97rg03319
Tsang, Y. W., and Witherspoon, P. A. (1981). Hydromechanical behavior of a deformable rock fracture subject to normal stress. J. Geophys. Res-Sol. Ea. 86 (B10), 9287–9298. doi:10.1029/JB086iB10p09287
Tsang, C. F., Tsang, Y. W., and Hale, F. V. (1991). Tracer transport in fractures: analysis of field data basedon a variable-aperture channel model. Water Resour. Res. 27, 3095–3106. doi:10.1029/91WR02270
Viswanathan, H. S., Ajo-Franklin, J., Birkholzer, J. T., Carey, J. W., Guglielmi, Y., Hyman, J. D., et al. (2022). From fluid flow to coupled processes in fractured rock: recent advances and new frontiers. Rev. Geophys. 60 (1), e2021RG000744. doi:10.1029/2021rg000744
Walmann, T., Malthe-Sørenssen, A., Feder, J., Jøssang, T., Meakin, P., and Hardy, H. H. (1996). Scaling relations for the lengths and widths of fractures. Phys. Rev. Lett. 77 (27), 5393–5396. doi:10.1103/PhysRevLett.77.5393
Walsh, J. (1981). Effect of pore pressure and confining pressure on fracture permeability. Int. J. Rock Mech. Min. 18 (5), 429–435. doi:10.1016/0148-9062(81)90006-1
Wang, J., Ren, L., Zhang, K., Zhang, C., Zhang, Y., and Liu, M. (2025). Multi-task neural network combined with multi-source data for inversion of discrete fracture network apertures: aperture-XNET. J. Hydrol. 661 (Part A), 133584. doi:10.1016/j.jhydrol.2025.133584
Watanabe, N., Hirano, N., and Tsuchiya, N. (2009). Diversity of channeling flow in heterogeneous aperture distribution inferred from integrated experimental-numerical analysis on flow through shear fracture in granite. J. Geophys. Res-Sol. Ea. 114 (B4). doi:10.1029/2008jb005959
Wei, X., Ma, H., Qian, J., and Ma, L. (2023). Study on the geometric characteristics effect of contact area on fracture seepage. Phys. Fluids 35 (1), 016603. doi:10.1063/5.0131145
Witherspoon, P. A., Wang, J. S. Y., Iwai, K., and Gale, J. E. (1980). Validity of cubic law for fluid flow in a deformable rock fracture. Water Resour. Res. 16, 1016–1024. doi:10.1029/wr016i006p01016
Wu, H., Fu, P., Morris, J. P., Mattson, E. D., Neupane, G., Smith, M. M., et al. (2021). Characterization of flow and transport in a fracture network at the EGS collab field experiment through stochastic modeling of tracer recovery. J. Hydrol. 593, 125888. doi:10.1016/j.jhydrol.2020.125888
Xiong, F., Sun, H., Zhang, Q., Wang, Y., and Jiang, Q. (2022). Preferential flow in three-dimensional stochastic fracture networks: the effect of topological structure. Eng. Geol. 309 (Suppl. C), 106856. doi:10.1016/j.enggeo.2022.106856
Yaghoubi, A. (2019). Hydraulic fracturing modeling using a discrete fracture network in the barnett shale. Int. J. Rock Mech. Min. 119, 98–108. doi:10.1016/j.ijrmms.2019.01.015
Yang, H., Wang, X., Yu, L., and Liu, R. (2021). Effects of contact area and contact shape on nonlinear fluid flow properties of fractures by solving navier-stokes equations. Lithosphere 2021 (3), 8684428–12. doi:10.2113/2021/8684428
Yeo, I. W. (2001). Effect of contact obstacles on fluid flow in rock fractures. J. Geosci-czech 5 (2), 139–143. doi:10.1007/BF02910418
Zhang, Y., and Chai, J. (2020). Effect of surface morphology on fluid flow in rough fractures: a review. J. Nat. Gas. Sci. Eng. 79, 103343. doi:10.1016/j.jngse.2020.103343
Zheng, J., Jin, Y., Dong, J., Liu, S., Zhang, Q., Song, H., et al. (2022). Reexamination of the permeability-aperture relationship for rough fractures with mismatched self-affine surfaces. J. Hydrol. 609, 127727. doi:10.1016/j.jhydrol.2022.127727
Zhu, W., Khirevich, S., and Patzek, T. W. (2021). Impact of fracture geometry and topology on the connectivity and flow properties of stochastic fracture networks. Water Resour. Res. 57 (7), e2020WR028652. doi:10.1029/2020wr028652
Zimmerman, R. W., and Bodvarsson, G. S. (1996). Hydraulic conductivity of rock fractures. Transp. Porous Med. 23 (1), 1–30. doi:10.1007/BF00145263
Keywords: contact-type fractures, contact asperity, fracture permeability, hydraulicaperture, fluid flow
Citation: Gao X, Wang H, Ma D, Zhang Y, Yang H and Huang Y (2025) Anomalous inversion effect of hydraulic properties in contacted asperity fractures: insights from laboratory flow experiments. Front. Earth Sci. 13:1668850. doi: 10.3389/feart.2025.1668850
Received: 18 July 2025; Accepted: 30 September 2025;
Published: 20 October 2025.
Edited by:
Giovanni Martinelli, National Institute of Geophysics and Volcanology, ItalyReviewed by:
Felipe De Freitas Munarin, Federal University of Ceara, BrazilTai-Sheng Liou, National Chung Cheng University, Taiwan
Copyright © 2025 Gao, Wang, Ma, Zhang, Yang and Huang. This is an open-access article distributed under the terms of the Creative Commons Attribution License (CC BY). The use, distribution or reproduction in other forums is permitted, provided the original author(s) and the copyright owner(s) are credited and that the original publication in this journal is cited, in accordance with accepted academic practice. No use, distribution or reproduction is permitted which does not comply with these terms.
*Correspondence: Dan Ma, ZGFuLm1hQGN1bXQuZWR1LmNu