 Zhangdi Xie1,2*
- 1Beijing Gangzhen Technology Co., Ltd., Beijing, China
- 2Key Laboratory of Optoelectronic Technology and Systems (Ministry of Education of China), College of Optoelectronic Engineering, Chongqing University, Chongqing, China
Seismic activity frequently occurs in the North China Plain seismic belt. Historical earthquake records for the fault southwest of Beijing are sparse, with only one significant event: the 1057 M 6 earthquake. This study focuses on the southern extension of the Nanyuan-Tongxian Fault. Using dynamic numerical methods, we simulate the rupture process of this earthquake to investigate its impact on strong ground motions in Beijing and surrounding areas. First, on the basis of the fault geometry and hydraulic fracturing stress data, we set the dynamic parameters of the fault plane and construct a curved fault model. Numerical simulation of the dynamic rupture process yielded the following results: a maximum slip of 0.75 m, an average slip of 0.49 m, a rupture duration of approximately 10 s, and a moment magnitude (Mw) of 6.5. The rupture propagated bilaterally; influenced by fault geometric bending, the peak slip rate reached 0.7 m/s on the SW side, whereas the slip rate on the NE side was smoother. The strong ground motion distribution showed a maximum intensity of VIII, which was concentrated along the fault trace with a significant hanging wall effect. Notably, owing to the combined effects of rupture directivity and fault bending, anomalously high-intensity zones appeared in areas distant from the epicenter, such as Shunyi and Tongzhou. This pattern differs significantly from the historical seismic impact pattern of the Sanhe-Pinggu Fault on the northeastern side. Further simulations of the epicenter within the fault indicate that if a future earthquake’s epicenter is located west of the fault center, Tongzhou would still face high-intensity ground motion risks. The results from both planar-fault and 3-D velocity-model simulations further demonstrate that strong ground-motion characteristics are influenced by multiple factors. This study reveals the unique seismogenic mechanism of the Nanyuan-Tongxian Fault, providing a key basis for seismic hazard assessment southwest of Beijing.
Plain language summary
This study investigates the 1057M 6 earthquake in the Beijing region via dynamic numerical simulations to understand its rupture process and potential seismic hazards. This research focused on the southern extension of the Nanyuan–Tongxian Fault and constructed a curved fault model on the basis of fault geometry and stress data. The simulation results reveal a maximum slip of 0.75 m, an average slip of 0.49 m, and a rupture duration of approximately 10 s, with a moment magnitude (Mw) of 6.5. The rupture propagated bilaterally, with significant slip rate peaks on the southwest side due to geometric bending. The strong ground motion distribution indicates a maximum intensity of VIII along the fault trace, influenced by rupture directivity and fault geometry. It is noteworthy that areas far from the epicenter, including Shunyi and Tongzhou, recorded unusually high ground-motion intensities as a result of the combined effects of rupture directivity and fault bending, and fault geometry and velocity model significantly controls rupture propagation and ground motion distribution. This study highlights the importance of fault geometry in controlling rupture propagation and ground motion distribution, providing critical insights for seismic hazard assessment in the Beijing area.
Keypoints
The 1057M 6 earthquake rupture process was simulated via dynamic numerical methods, revealing significant slip and rupture characteristics.
Strong ground motion results in high intensity in areas far from the epicenter due to rupture directivity and fault geometry.
Fault geometry and velocity model significantly controls rupture propagation and ground motion distribution, highlighting the need for detailed fault studies in seismic hazard assessments.
1 Introduction
The North China Plain seismic belt has experienced multiple earthquakes above magnitude 6, particularly in the Beijing area, where active faults are densely distributed and where seismic activities are frequent. Historical seismic records exist for most active faults. For example, the Nankou–Sunhe Fault, with a dip angle of 70°–80° (Che, 1994; Liang, 2019), has paleoearthquake records dating back 4,000 years (Jiang et al., 2001). Since the 294 AD Yanqing M 6.0 earthquake, M ≥ 6.0 earthquakes have successively occurred in Daxing, Yanqing, Tongxian, and western Beijing (Gu, 1984), with the most recent being the 1730 western Beijing M6.5 earthquake (Gu, 1984; Xie and Cai, 1983). Subsequently, no M ≥ 6.0 earthquakes have been recorded in the Beijing area (Jiang and Yin, 2021). Related seismic and geophysical research (He et al., 2020; Jiao et al., 2005; Li et al., 2021; Qin et al., 2014; Wu et al., 2013; Zhang et al., 2017a; Zhang et al., 2017b; Zhang and Zhu, 2019) has revealed the seismic geological conditions of the Beijing area, providing a solid foundation for analyzing its historical earthquakes and potential future large earthquakes.
To investigate the seismogenic mechanisms and rupture processes of historical earthquakes in Beijing and its surrounding areas, some studies have employed numerical methods to simulate the rupture process and the resulting strong ground motions, such as the 1,679 Sanhe–Pinggu M8.0 earthquake (Ba et al., 2022; Fu et al., 2015; Gao et al., 2002; Liu et al., 2007; Pan et al., 2006; Wang et al., 2022). They have also studied the effects of ground motions generated by different strata, topographies, and surrounding earthquakes in the Beijing area (Ding et al., 2004; Liao, 2017; Yang et al., 2008). The results of these studies indicate that areas in and around Beijing, such as the Babaoshan–Huangzhuang–Gaoliying Fault and the Yanhuai Basin, still possess the potential for significant seismic activity (Jiao et al., 2005; Qin et al., 2014; Wu et al., 2013; Yang et al., 2008; Zhang and Zhu, 2019). The above research focused primarily on faults in the northeastern part of Beijing, which have frequent historical earthquake records. In contrast, the southwestern part of Beijing has fewer historical earthquake records and is characterized mainly by the development of the eastern margin fault of the Daxing Uplift (Daxing Fault), the Nanyuan-Tongxian Fault, and the Yongdinghe Fault. The eastern margin fault of the Daxing Uplift (Daxing Fault), located in the intermediate zone between Beijing’s Daxing District and Langfang city, Hebei Province, is also known as the northern margin fault of the Gu’an Basin (Gao and Ma, 1993). It formed under the Paleogene SE‒NW extensional stress regime of the North China Plain (Zhao and Liu, 2002) and has been notably active since the Quaternary (Li et al., 1985). This fault is approximately 90 km long and 20–40 km wide, trending NE and dipping SE. Its northern section connects to the Xiadian Fault, which generated the 1,679 Pinggu M 8.0 earthquake, and the junction area experienced the 1536 M 6.0 earthquake (Li et al., 2021). Simultaneously, this fault separates the Daxing Uplift from the Langgu Depression, controlling and influencing the tectonic evolution of the Langgu Depression (Gui et al., 2012).
North of the eastern margin fault of the Daxing Uplift lies the Nanyuan–Tongxian Fault, which is approximately 110 km long. This fault serves as the boundary between the Daxing Uplift and the Beijing Depression (Zhao and Zhu, 2003). It is S shaped, dips NW at angles of 50°–70° (Jiao and Qiu, 2006; Xu et al., 2015), and is divided from north to south into three segments: the northeastern segment, central segment, and southwestern segment (Lei et al., 2021; Zhao et al., 2021). Its southern segment extends to the Nankou–Sunhe Fault. Because the historical earthquakes on the series of parallel faults northeast of Beijing (Huangzhuang--Gaoliying Fault, Shunyi-Liangxiang Fault, Nanyuan-Tongxian Fault, and Xiadian Fault) occurred less than 400 years ago, whereas the faults southwest of Beijing (Yongdinghe Fault, southern extension of the Nanyuan-Tongxian Fault, and eastern margin fault of the Daxing Uplift) had only one recorded M 6.0 earthquake in 1,057, the accumulated regional stress in this area may have been released less than that in the northeast. Moreover, the specific location and seismogenic structure of this earthquake remain undetermined (Li et al., 2021). To investigate the rupture process of the 1057 M 6.0 earthquake on the Nanyuan–Tongxian Fault and its potential impact on strong ground motions in the Beijing area, a curved fault model is constructed here, referencing the southern extension of the Nanyuan–Tongxian Fault (Figure 1). Spectral-element methods are employed to simulate the rupture process under different scenarios and calculate the resulting ground motions and their effects on Beijing and surrounding areas.
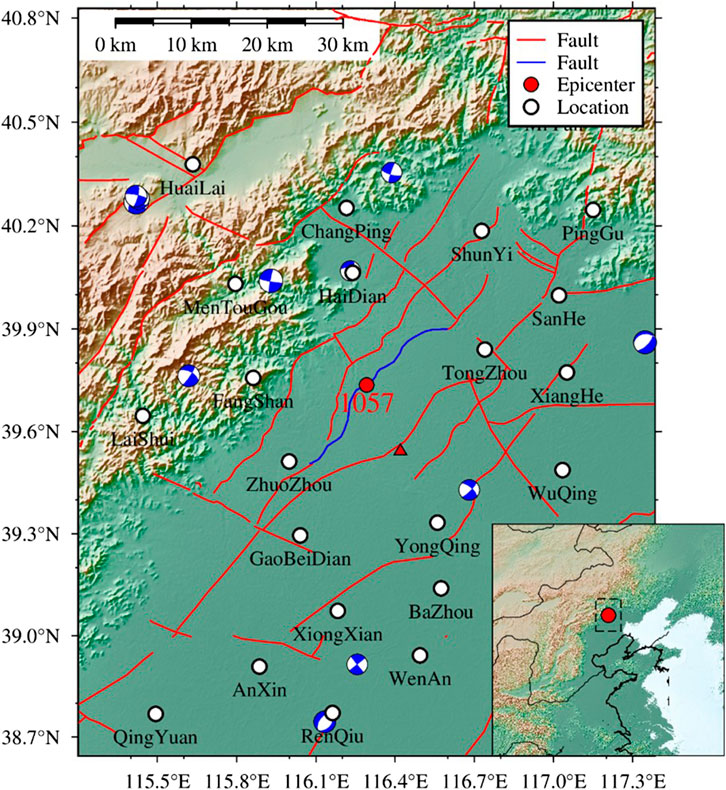
Figure 1. Active faults and focal mechanisms of historical earthquakes in Beijing and surrounding areas. The blue line indicates the southern extension of the Nan Yuan–Tongxian fault, which has a NE strike, SE dip, and dip angle of 70°. The red circle represents the reference epicenter location of the 1057M6 earthquake. The active fault data are from (Xu et al., 2016); The focal mechanism solutions are taken from the 2009–2021 dataset for mainland China and adjacent regions (Guo et al., 2022).
2 Data and methods
2.1 Fault geometry
During the Eocene–Oligocene extensional rifting in the Cenozoic Neogene, a series of NE-trending normal faults developed in the Beijing region (Huang et al., 1991). Among them, the Nanyuan-Tongxian fault strikes NE, dips NW, and has a dip angle of 50°–75°. It extends from the vicinity of Nan’gao village in the south, passes through Nanyuan, Nanmofang, east of Dingfuzhuang, and reaches Ping’an Tong in the north, with a total length of 110 km. In the Tertiary, this fault served as the boundary between the Beijing downfault basin and the Daxing uplift (Jiao and Qiu, 2006). Since the Quaternary, its roughly EW-trending normal-fault pattern has been consistent with the regional tectonic stress field (Bai et al., 2018; Feng, 2014; Zhang et al., 2014). The central segment of the Nanyuan-Tongxian fault was active in the Holocene, potentially offsetting Quaternary strata to the surface and/or providing stress transfer and accumulation for the formation of ground fissures (Fang et al., 2016; Zhao et al., 2018). Niu et al. (2023) integrated geophysical profiling, multi-borehole cross-sections, and geochronology to determine a fault dip of 56°–75° for the Nanyuan-Tongxian fault. According to the relationship between magnitude and fault dimensions, and statistical data on the source-rupture lengths of earthquakes in North China since 1965 (Cheng et al., 2019; Long et al., 2006; Ran, 2011), the rupture length for M 6 events is generally less than 70 km. Because the SW segment of the Nanyuan-Tongxian fault (between the Nankou-Sunhe fault and Zhuozhou) is a bedrock fault that shows no Quaternary activity (Huang et al., 2012; Jiang et al., 2001), we exclude this inactive SW segment. Referring to previous surface traces of central and NE segments and earlier fault-attribute studies (Jiao and Qiu, 2006; Niu et al., 2023; Xu et al., 2016), the fault model is configured as a 70°-dipping, 20-km-deep normal fault with a curved surface length of approximately 68 km (Figure 2).
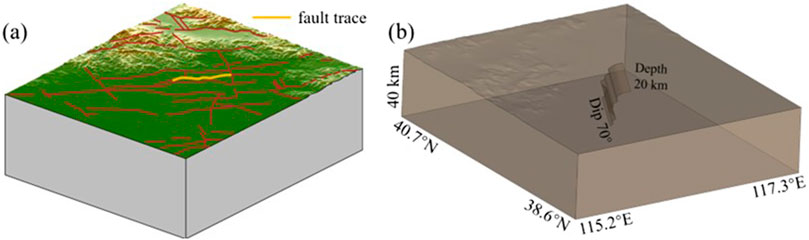
Figure 2. Numerical simulation region and fault-plane geometry. (a) Simulation domain incorporating real topography; (b) spatial position of the fault geometry with a 70° dip, a curved surface length of ∼68 km, and a width of ∼20 km.
2.2 Dynamic parameters
Investigating the constitutive relationships that pervasively govern rupture processes is the physical basis for understanding complex rupture behavior; these relationships define how stress, slip, slip rate, and other relevant physical parameters are linked on the fault plane. Friction laws are crucial because they control how earthquakes are triggered, how rupture propagates after initiation, and how it ultimately arrests. To date, most friction laws have been derived from laboratory rock-fracture experiments (Dieterich, 1972; Dieterich, 1978; Dieterich, 1979; Ruina, 1983). Numerous low-velocity rock-friction measurements (Dieterich, 1978; Weeks and Tullis, 1985) can be explained by rate- and state-dependent friction laws (Dieterich, 1979; Dieterich, 1981; Ruina, 1983), whereas high-velocity slip experiments (Okubo and Dieterich, 1986) reveal that material strength weakens with slip (Dieterich, 1981; Ohnaka et al., 1987; Okubo and Dieterich, 1984). Many researchers have proposed various slip-weakening friction laws on the basis of theoretical considerations or laboratory tests (Campillo et al., 2001; Ida, 1972; Matsu’ura et al., 1992; Ohnaka and Yamashita, 1989). Ida (1972) assumed several types of stress evolution and first introduced the slip-weakening friction law into dynamic rupture models; as an approximation of rate- and state-dependent friction, the simple slip-weakening law can explain the mechanism of dynamic strike-slip rupture propagation (Okubo and Dieterich, 1984; Okubo and Dieterich, 1986). The results from studies of actual earthquakes (Ide and Takeo, 1997; Xie et al., 2024; Zhang et al., 2003) indicate that stress decreases with increasing slip, broadly satisfying the slip-weakening friction law (Ida, 1972); hence, the slip-weakening friction law is adopted in this study (Figure 3).
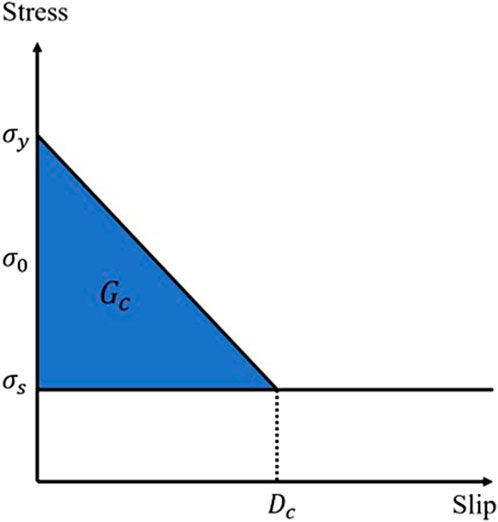
Figure 3. Slip-weakening friction law (Ida, 1972)
In the slip-weakening friction law, the slip-weakening distance Dc is also a critical parameter. First proposed theoretically by Ida (1972) as a key parameter of the slip-weakening friction law (Palmer and Rice, 1973), Dc is defined as the slip required for the local stress to drop to the residual static value. It reflects the physical state of the fault and primarily governs the fracture energy (Abercrombie and Rice, 2005; Cocco et al., 2006; Tinti et al., 2004). Research by Peyrat et al. (2001) demonstrated that similar dynamic rupture processes and numerical results that are consistent with observations (Guatteri and Spudich, 2000) can be obtained via different yield stresses and slip-weakening distances. While studying the dynamic rupture process of the 2018 Hokkaido–Japan earthquake, Xie et al. (2024) reported that the slip-weakening distance controls both the rupture propagation speed and the slip rate on the fault plane. Furthermore, the rupture duration for M6.0 earthquakes typically ranges between 10 and 15 s (Xie et al., 2024; 2025; Xu et al., 2023). To constrain the slip rate and rupture speed on the fault plane, a slip-weakening distance is constructed, as shown in Figure 4.
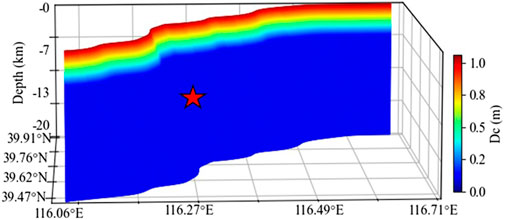
Figure 4. Spatial distribution of slip-weakening distances on the fault plane The red star marks the epicenter.
In dynamic simulation processes, stress on the fault plane is difficult to measure directly and is typically determined via methods such as borehole measurements or hydraulic fracturing (Chen et al., 2012; Hast, 1969; Li and Wang, 1979; Zoback et al., 1980). These methods can establish the background stress state on the fault plane and are therefore widely applied in studies of paleoearthquakes (Sunilkumar et al., 2024; Wang et al., 2022). Alternatively, another approach to determine stress on the fault plane involves calculations based on slip amounts on the fault surface (Ide and Takeo, 1997; Xie et al., 2024; Zhang et al., 2003). This method more readily yields dynamic rupture processes that are consistent with observations but requires first performing a kinematic rupture process inversion. The shear stress time history is subsequently determined by solving the equations of elastodynamics (Zhang et al., 2003) or using frequency-domain methods (Andrews, 1980; Xie et al., 2024), from which the dynamic parameters on the fault plane are derived. Given the lack of seismic observation data for paleoearthquakes, a suitable approach is to set the fault plane stress on the basis of existing hydraulic fracturing or borehole data. Wang et al. (2012) investigated the stress state in the upper crust via 1,780 hydrofracturing and stress-measurement datasets from mainland China:
where
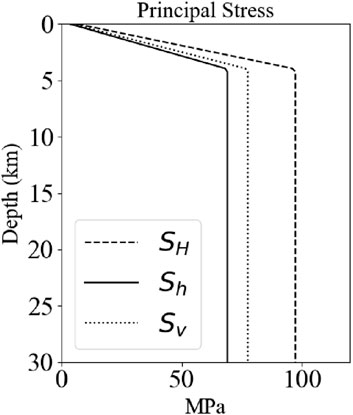
Figure 5. Variation in the principal stresses with depth. The maximum horizontal principal stress SH, the minimum horizontal principal stress Sh, and the vertical principal stress Sv increase linearly with depth and then remain constant; modified from Wang et al. (2012).
For the numerical simulations, the layered velocity model (Figure 6) at the central longitude and latitude was extracted from the USTClitho 1.0 (Unified Seismic Tomography models for continental China lithosphere) lithospheric velocity model for mainland China (Xin et al., 2018) and used as the input velocity structure.
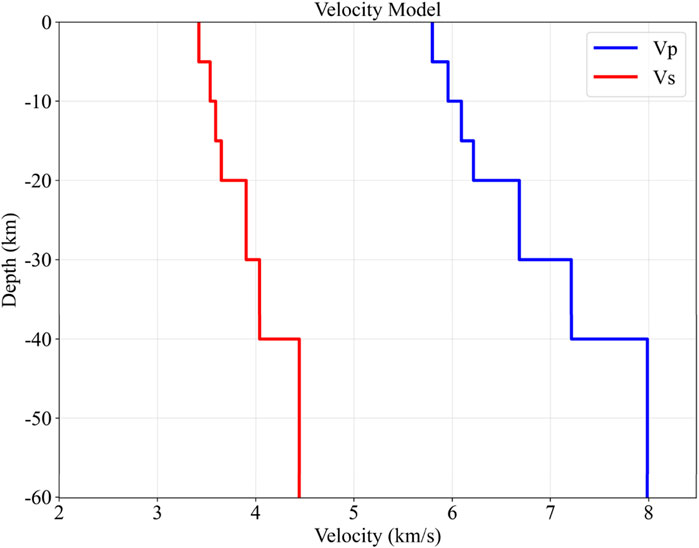
Figure 6. One-dimensional layered velocity model. Derived from the USTClitho 1.0 velocity model at the epicenter’s central longitude and latitude.
2.3 Numerical method
The simulation of seismic source rupture processes can employ various methods. For earthquakes recorded at densely distributed stations, kinematic methods can be used to invert the slip distribution on the fault plane from observational data (Guo et al., 2024; Liu et al., 2013). Such kinematic source methods cannot reveal the physical mechanisms of rupture propagation. Consequently, dynamic numerical methods based on rock physics experiments are increasingly being used to simulate seismic source rupture processes (Wang et al., 2022; Weng and Ampuero, 2019; Xie et al., 2024). Unlike kinematic source methods, this approach requires setting stress parameters on the fault plane and constructing a physically consistent dynamic rupture process of the seismic source on the basis of the equations of elastodynamics.
Because the dynamic rupture process is influenced by many factors, analytical solutions are generally unattainable; numerical methods are therefore routinely employed. A variety of numerical techniques capable of simulating seismic wave propagation have been successfully applied to dynamic rupture modeling, such as the finite-difference (FD) method introduced by Madariaga (1976) and Andrews (1976) for earthquake rupture studies (Day, 1982a; 1982b; Miyatake, 1992); the boundary‒integral equation method, first applied to dynamic rupture by (Das and Aki, 1977; Andrews, 1985; Das and Aki, 1977); and the spectral‒element method (a high-order finite‒element‒spectral method). The spectral-element method combines the accuracy of spectral techniques with the flexibility of finite-element methods (Patera, 1984; Seriani and Priolo, 1991) and is therefore a high-order numerical scheme (Komatitsch et al., 2005). Initially, proposed by Patera (1984) for solving the Navier–Stokes equations, this method incorporates domain decomposition and Gauss–Lobatto–Legendre (GLL) nodes on spectral elements, enhancing numerical precision while allowing unstructured meshes outside the rupture zone to reduce computational cost (Festa and Vilotte, 2005; Galvez et al., 2020).
In this study, the spectral-element code Specfem3D (Komatitsch and Tromp, 1999; Komatitsch and Tromp, 2002a; Komatitsch and Tromp, 2002b) is employed to simulate the dynamic rupture process. Following previous work (Huang et al., 2012; Jiang et al., 2001; Jiao and Qiu, 2006; Niu et al., 2023), the upper edge of the fault plane extended to the surface. The computational domain measures 2.1 ° × 2.1 ° × 40 km; the fault plane is discretized into 38,077 (377 columns × 101 rows) subfaults, each 200 m × 200 m. Absorbing boundary conditions (Clayton and Engquist, 1977) are applied on all outer boundaries except the free surface to suppress reflections that would otherwise contaminate the rupture process. Each element uses 5 GLL nodes; the time step is 0.0001 s and the total simulation duration is 20.0 s.
3 Results
On the basis of the above dynamic parameters, the dynamic rupture process of the 1057M6 earthquake in the Beijing area can be obtained. The dynamic simulation yields a maximum slip of approximately 0.75 m on the fault plane (Figure 7), an average slip of approximately 0.49 m, a rupture duration of ∼10 s, and a moment magnitude of Mw 6.5 (Figure 8), which aligns closely with M6¾ reported in earlier studies (Li et al., 2021). The maximum slip on the fault plane is located northeast of the epicenter. Owing to fault geometry, slip gradually increases to ∼0.75 m in this area. At the epicenter location, slip is not distributed uniformly in regions with significant geometric deformation (Figure 7). Simultaneously, influenced by fault geometry, the rupture propagation process on the fault plane undergoes changes (Figure 9): rupture propagates bilaterally from the epicenter; at ∼2 s, it bends on the SW side of the fault plane; at 3 s, it propagates to the upper and lower boundaries of the fault plane and reaches the maximum slip rate (∼0.7 m/s); at 4 s, rupture crosses the bend on the SW side of the fault plane, with its slip rate exceeding that of the smoother propagation process on the NE side; especially at 5.5 s, an arcuate rupture front propagating at the maximum slip rate is distinctly observable on the SW side. Moreover, affected by the greater slip-weakening distance at the upper boundary (Figure 4), the slip rate at the upper boundary during rupture is significantly lower than that at the lower section of the fault plane, and the rupture timing is delayed; at 6.5 s, the rupture propagates to the SW boundary of the fault plane, whereas the NE side achieves the maximum slip rate; at ∼8 s, it also propagates to the NE boundary of the fault plane; at ∼9 s, the rupture fully traverses the entire fault plane, with energy essentially released, with only minor slip velocities exhibited in partial areas owing to surface reflections.
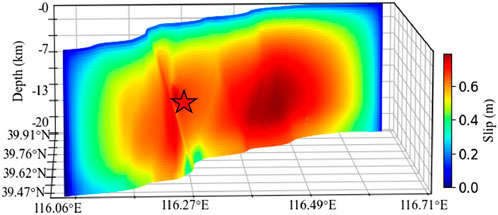
Figure 7. Spatial distribution of fault slip obtained from dynamic simulation. The maximum slip of 0.75 m is located on the NE side of the epicenter, with an average slip of approximately 0.49 m, and it has a nonuniform distribution due to the geometric curvature of the fault; The red star marks the epicenter.
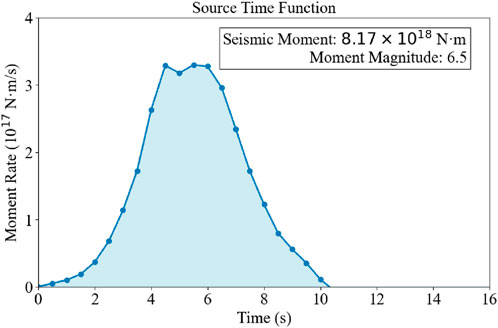
Figure 8. Moment magnitude function and rupture time. The curve of the seismic moment release with time shows a moment magnitude of Mw6.5, with a rupture duration of approximately 10 s. The main energy release is completed in the first 8 s, and only residual slip remains after 9 s.
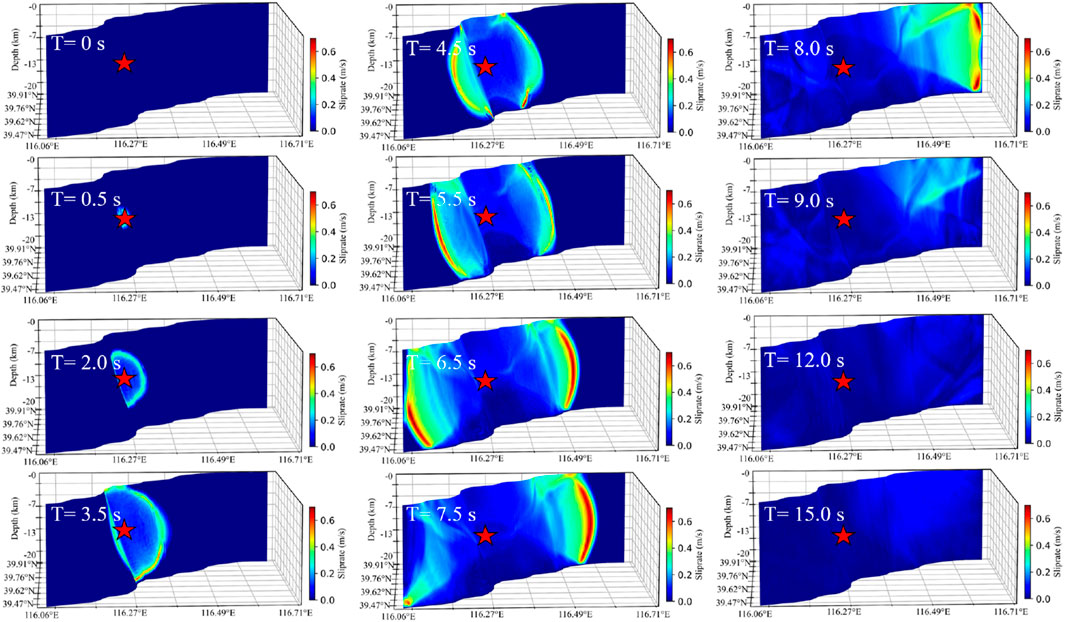
Figure 9. Dynamic rupture propagation process. The spatiotemporal evolution of the fault slip rate; the rupture propagates bilaterally: owing to geometric bending, the SW side has a higher slip velocity peak and propagates faster than the NE side does; the upper boundary rupture is inhibited by high Dc; The red star marks the epicenter.
As a historically earthquake-prone region, Beijing has been extensively studied with respect to the impacts of historical or scenario earthquakes on strong ground motions in Beijing and surrounding areas. The peak ground acceleration in the North China Plain indicates greater seismic hazards in Tangshan, Taiyuan, and Beijing than in other regions (Yang et al., 2008). For example, the 1,679 Sanhe-Pinggu M8 earthquake occurred on the nearby Sanhe-Pinggu Fault. Various strong ground motion simulations (Ba et al., 2022; Fu et al., 2015; Gao et al., 2002; Liu et al., 2007; Pan et al., 2006) have shown that strong ground motions from M8 earthquakes on the Sanhe-Pinggu Fault are influenced by basin amplification effects and surface sedimentary layers in the Beijing area; simulations of the 1998 Zhangbei earthquake revealed greater amplification effects in Quaternary sedimentary layers than in Tertiary caprocks (Zhou and Chen, 2008). Additionally, strong ground motions are simultaneously affected by rupture processes (Xie et al., 2025) and topography (Wang et al., 2018). Owing to significant geometric bending and kinks in this earthquake fault, its generated strong ground motions (Figure 10) have a maximum intensity of VIII, with the VIII-degree zone primarily distributed along the fault trace and exhibiting a strong hanging wall effect (Xie et al., 2025; Zhang et al., 2003). However, influenced by the rupture process (Figure 9), higher slip velocities occur in the NE-trending rupture, combined with SE-ward fault bending, creating rupture front effects. Consequently, areas distant from the epicenter (Shunyi, Tongzhou, Sanhe) along the rupture front experience substantial strong ground motions; Wang et al. (2022) simulated another fault in this area (Sanhe‒Pinggu Fault Zone), which did not generate VIII-degree strong ground motions in Shunyi and Tongzhou.
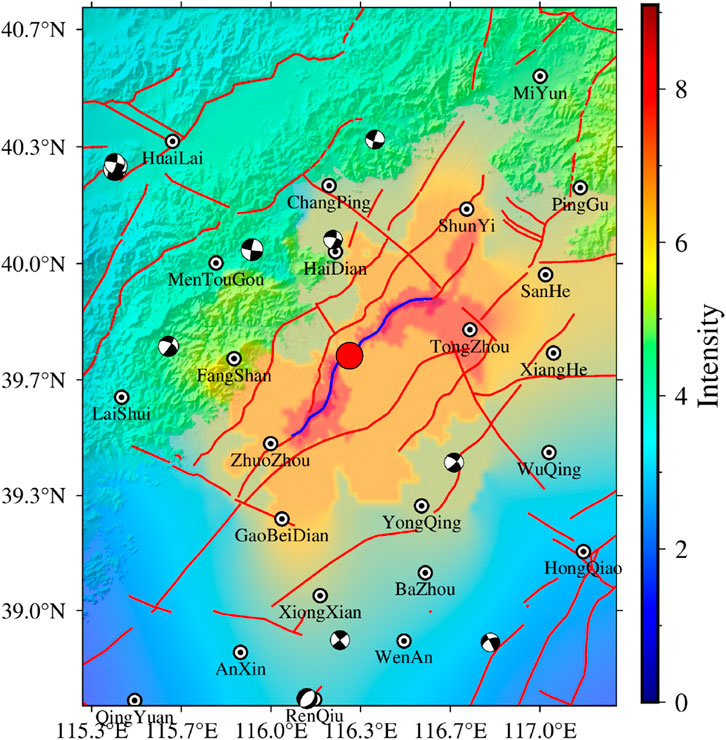
Figure 10. Intensity distribution of strong ground motion. The intensity distribution map converted from the peak ground acceleration (PGA) of the simulated seismic motion. The Ⅷ intensity zone is concentrated along the fault trace, with a significant hanging wall effect. Owing to the influence of rupture directivity and fault bending, abnormally high intensities appear in far-field areas such as Shunyi and Tongzhou; The focal mechanism solutions are taken from the 2009–2021 dataset for mainland China and adjacent regions (Guo et al., 2022).
4 Discussion
4.1 The impact of the epicenter location on strong ground motion
This earthquake (the 1057 M6 earthquake) occurred nearly a thousand years ago, and the accumulated stress was relatively high. Determining the location of the next earthquake is difficult. To improve the seismic fortification requirements, two earthquakes are set on this fault to simulate the dynamic rupture process. Figure 11 shows the strong ground motions simulated at different epicentral locations. The results indicate that there is a significant directivity effect in the strong ground motions generated whether the initial rupture point is on the left side of the fault plane (Figure 11a) or the right side of the fault plane (Figure 11b) (Wang et al., 2018; Yang and Zhao, 2010). When the epicenter is on the left side of the fault plane (Figure 11a), the slip rate reaches the maximum value when the rupture propagates to the right side of the fault plane, and strong ground motions are generated in the Tongzhou area following the bending direction of the fault plane. When the epicenter is on the right side of the fault plane, the slip rate reaches the maximum value when the rupture propagates to the left side, and larger intensity areas are generated in the Gaobeidian and Zhuozhou areas. Combined with Figure 10, owing to the influence of the fault geometry and the rupture propagation process, strong ground motions are generated in the Tongzhou area if the epicenter is on the left side of the center of the entire fault.
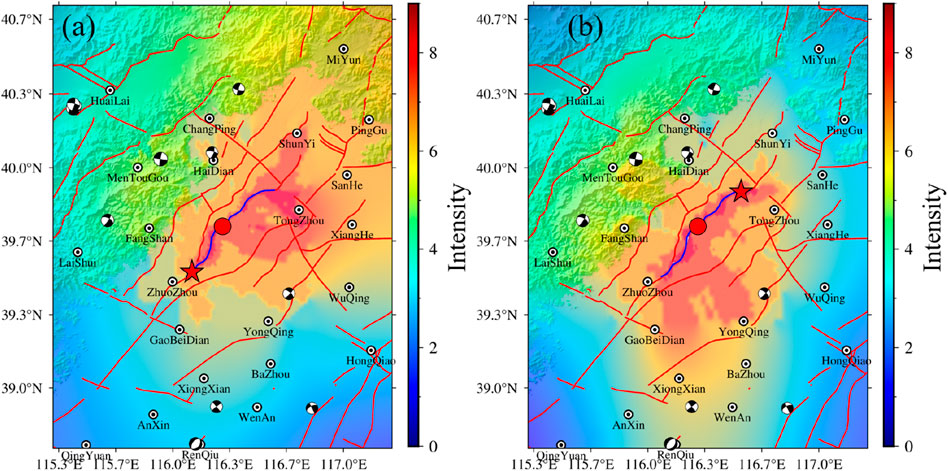
Figure 11. Comparison of seismic motion scenarios at different epicentral locations. The red star indicates the set epicenter location, and the red circle represents the original epicenter location. (a) When the epicenter is on the left side of the southern segment of the fault, Tongzhou experiences high-intensity shaking. (b) When the epicenter is on the right side, the intensity increases in Gaobeidian and Zhuozhou; The focal mechanism solutions are taken from the 2009–2021 dataset for mainland China and adjacent regions (Guo et al., 2022).
4.2 Influence of the fault geometry
Dynamic rupture is also governed by fault geometry (Dong and Zhang, 2019; Ma et al., 2021; Ma et al., 1996; Zhang et al., 2016); for large earthquakes, irregular fault geometry can even lead to supershear rupture (Bhat et al., 2007). To investigate how fault geometry influences the strong ground motion of the 1057 M 6 earthquake, a planar fault with the same dip (70°) (yellow line in Figure 12) was constructed across the epicenter for dynamic rupture simulation, and the resulting ground motions were compared. To minimize the influence of other factors, the previously determined dynamic parameters were retained. Figure 12 shows the ground motions generated by the planar fault: the maximum intensity is IX, and the intensities on both sides of the fault are symmetrically distributed. Because the epicenter is closer to the southwestern end of the fault, the rupture propagates more slowly than on the northeastern side, so no pronounced directivity effect is produced in the southwest. The planar rupture (Figure 12) produces intensities of VII or higher in XiangHe, whereas the nonplanar rupture does not produce comparable intensities (Figure 10), which is consistent with the findings of Zhang et al. (2019) when studying rupture intensities for the Wenchuan earthquake using different fault geometries: planar and nonplanar ruptures yield markedly different intensities in different regions.
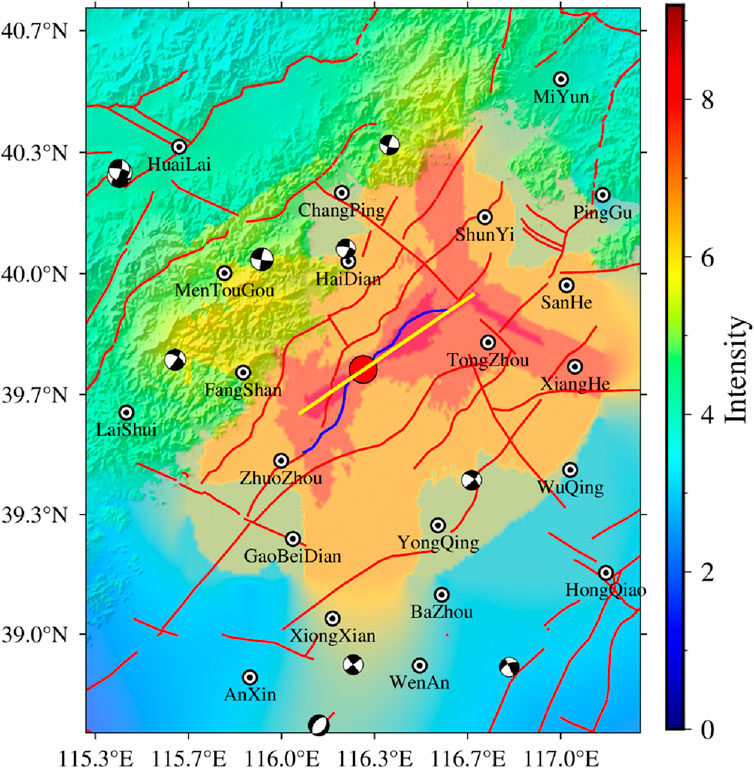
Figure 12. Trace of the planar fault and the spatial distribution of the resulting strong ground motion. The yellow line indicates the constructed planar fault; the blue line represents the original curved fault. The red circle denotes the epicenter—i.e., the initial rupture point. The color scale represents the intensity converted from the peak ground velocity; The focal mechanism solutions are taken from the 2009–2021 dataset for mainland China and adjacent regions (Guo et al., 2022).
4.3 Influence of the velocity model
In addition to the location of the initial rupture point and the fault geometry, the medium parameters also control the strong ground motion generated during dynamic rupture. To verify the ground motions of the 1,057 earthquake under different velocity models, we constructed a 3-D velocity model for the study area on the bases of USTClitho 1.0 (Deng et al., 2003; Li et al., 2013; Xin et al., 2018). USTClitho1.0 is a 3-D lithospheric velocity structure for mainland China obtained from seismic travel-time tomography Xin et al. (2018); its horizontal resolution is ∼50–100 km and is therefore suitable for building a 3-D data model for our study region. Using this 3-D velocity model and the dynamic parameters determined with the curved fault, we simulate the resulting strong ground motion (Figure 13a).
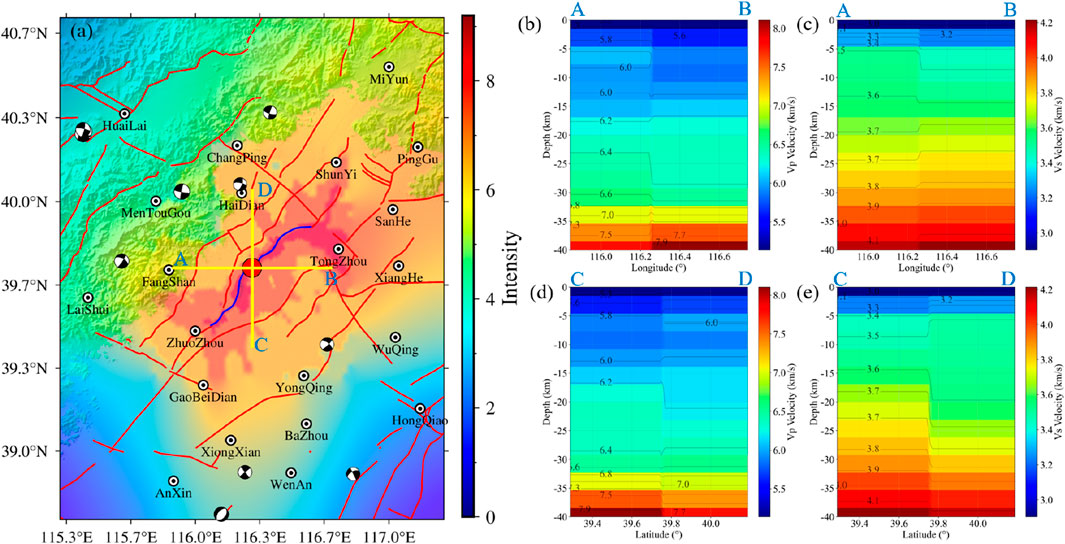
Figure 13. 3-D velocity model and velocity cross-sections near the epicenter (a) The blue line marks the surface trace of the curved fault; the yellow lines indicate the locations of the velocity cross-sections (b-e) Vp and Vs. velocity cross-sections along the yellow lines shown in (a).
The 3-D velocity model simulation revels that the hanging-wall side (southeast side) of the fault exhibits significantly greater ground motions than those produced by the 1-D layered model (Figure 10), particularly within the intensity-VII zone. Gao et al. (2005) used finite-element modeling to examine the relationship between the ground motions of the 1999 Chi-Chi earthquake and the stiffness of the fault-zone medium, and reported that the peak ground acceleration is approximately proportional to the fault-zone stiffness, whereas the peak ground velocity scales roughly with the square root of the stiffness. To investigate velocity contrasts across the fault, we extracted depth profiles along lines AB and CD (yellow lines in Figure 13) passing through the epicenter; the resulting Vp and Vs. cross-sections (Figure 13b–e) revealed pronounced differences across the Nanyuan-Tongxian fault. At depths down to 20 km and in the shallow crust, the hanging-wall (southeast) presents consistently lower Vp and Vs. than the hanging wall (northwest), a disparity caused mainly by different deformation styles across the fault (Le Pichon et al., 2005; Thurber et al., 2006).
Our study area lies within the Quaternary sedimentary basin. Ding et al. (2004) demonstrated through synthetic seismograms that Quaternary sediments strongly amplify ground motions in the Beijing region. Likewise, Zhou and Chen (2008), using the discrete wavenumber method to model two-dimensional ground motions in Beijing induced by the 1998 Zhangbei earthquake, reached conclusions similar to those of Ding et al. (2004). Moreover, larger contrasts in material properties lead to more pronounced spatial asymmetry in ground motion (Yuan and Zhu, 2016; Zhu and Jie, 2016). Therefore, the larger ground motions on the southeast side of the fault in our 3-D velocity simulations most likely resulted from the combined effects of fault-zone heterogeneity and amplification by Quaternary sedimentary cover.
5 Conclusion
This study reconstructed the rupture process of the 1057M6 earthquake through dynamic numerical simulation, revealing the unique faulting mechanism and disaster characteristics of the fault southwest of Beijing. The simulation results based on the geometric structure of the Nan Yuan–Tongxian fault and the parameters of the regional stress field reveal that the earthquake rupture lasted approximately 10 s, with a maximum slip of 0.75 m and a moment magnitude of Mw6.5, which is consistent with the historically recorded magnitude of M63/4. Rupture propagation was significantly controlled by the fault geometry. The SW side experienced a sharp increase in slip velocity due to bending (peak value of 0.7 m/s), whereas the NE side experienced more stable propagation. The difference in the attenuation distance of slip at the fault boundaries further delayed the rupture process at the upper boundary.
The results of strong ground motion show that the maximum intensity of Ⅷ is distributed along the fault and that there is a significant hanging wall effect. Unlike the seismic effects of faults northeast of Beijing (such as the Sanhe–Pinggu fault), this simulation revealed abnormally high intensities in areas far from the epicenter, such as Shunyi and Tongzhou. This is the result of the combined action of the NE-dipping bend of the fault and the directivity of the rupture, forming a “rupture front effect”. A comparison of the simulation results at different epicentral locations reveals that if the fault point is located to the left of the center of the fault, the Tongzhou area will experience more intense shaking, whereas the right epicenter will experience Gaobeidian and Zhuozhou high-risk areas.
The planar-fault simulation shows that, when the rupture nucleates away from the fault’s geometric center, a pronounced directivity effect develops toward the northeastern side of the fault, producing intensities of VII or greater in XiangHe; in contrast, the curved-fault rupture does not generate a comparable intensity pattern, so the intensities produced by planar and nonplanar ruptures differ markedly in different regions. The 3-D velocity-model results further demonstrate that strong ground motion depends not only on the fault’s dynamic parameters and geometry but also on the medium encountered during rupture propagation: the greater the contrast in material properties is, the stronger the spatial asymmetry of ground motion. The greater ground motion on the southeastern side of the fault relative to the northwestern side is most likely due to the combined effects of heterogeneous media on either side of the fault and amplification by Quaternary sediments.
This earthquake occurred nearly a thousand years ago. The accumulated stress released by the southwest fault is low, and there is still a risk of recurrence in the future. The study results show that fault geometry is the key factor controlling rupture propagation and the spatial distribution of ground motion. The amplification effect of the sedimentary layer of the Beijing Basin may further exacerbate the disaster. This result provides a dynamic basis for the seismic fortification of Beijing and its surrounding areas (especially potential high-risk areas such as Tongzhou and Shunyi) and highlights the need to focus on the stress accumulation state of the Nanyuan–Tongxian fault.
Data availability statement
The focal mechanism solution data are from Guo et al. (2022). The active fault data are from Xu et al. (2016). The numerical simulation program Specfem3D is from Komatitsch et al. (2024). Figures were created via Matplotlib and GMT Wessel et al. (2013). The original contributions presented in the study are included in the article/supplementary material, further inquiries can be directed to the corresponding author.
Author contributions
ZX: Conceptualization, Data curation, Formal Analysis, Funding acquisition, Investigation, Methodology, Project administration, Resources, Software, Supervision, Validation, Visualization, Writing – original draft, Writing – review and editing.
Funding
The author(s) declare that financial support was received for the research and/or publication of this article. We are grateful to Beijing Gangzhen Technology Co., Ltd. for providing the research topic “The Impact of Strong Ground Motion on Buildings” (Fund No. YF-202520). The funder was not involved in the study design, collection, analysis, interpretation of data, the writing of this article, or the decision to submit it for publication.
Acknowledgments
We are deeply grateful to the editors and the two reviewers for their thorough evaluation of our manuscript and for providing numerous detailed and constructive suggestions, which have greatly improved its clarity, accuracy, and overall quality. We also thank the Computational Infrastructure for Geodynamics (CIG, http://geodynamics.org).
Conflict of interest
Author ZX was employed by Beijing Gangzhen Technology Co., Ltd.
Generative AI statement
The author(s) declare that no Generative AI was used in the creation of this manuscript.
Any alternative text (alt text) provided alongside figures in this article has been generated by Frontiers with the support of artificial intelligence and reasonable efforts have been made to ensure accuracy, including review by the authors wherever possible. If you identify any issues, please contact us.
Publisher’s note
All claims expressed in this article are solely those of the authors and do not necessarily represent those of their affiliated organizations, or those of the publisher, the editors and the reviewers. Any product that may be evaluated in this article, or claim that may be made by its manufacturer, is not guaranteed or endorsed by the publisher.
References
Abercrombie, R. E., and Rice, J. R. (2005). Can observations of earthquake scaling constrain slip weakening? Geophys. J. Int. 162 (2), 406–424. doi:10.1111/j.1365-246X.2005.02579.x
Andrews, D. J. (1976). Rupture velocity of plane strain shear cracks. J. Geophys. Res. 81 (32), 5679–5687. doi:10.1029/JB081i032p05679
Andrews, D. J. (1980). A stochastic fault model: 1. Static case. J. Geophys. Res. Solid Earth 85 (B7), 3867–3877. doi:10.1029/JB085iB07p03867
Andrews, D. J. (1985). Dynamic plane-strain shear rupture with a slip-weakening friction law calculated by a boundary integral method. Bull. Seismol. Soc. Am. 75 (1), 1–21. doi:10.1785/BSSA0750010001
Ba, Z. N., Zhao, J. X., Liang, J. W., Zhang, Y. S., and Zhang, Y. J. (2022). Simulation of strong ground motion in beijing area based on finite fault source model:taking the 1679 sanhe-pinggu M8 earthquake as an example. J. Seismol. Res. 45 (3), 479–488. doi:10.20015/j.cnki.ISSN1000-0666.2022.0048
Bai, L. Y., Li, X., Qin, H. M., Zhang, X. L., and Zhang, Y. Z. (2018). Study on the cyclic stratigraphy activity of nankou-sunhe fault in beijing plain since Quaternary and its tectonic significance. Geoscience 32 (2), 270–278. doi:10.19657/j.geoscience.1000-8527.2018.02.06
Bhat, H. S., Olives, M., Dmowska, R., and Rice, J. R. (2007). Role of fault branches in earthquake rupture dynamics. J. Geophys. Res. Solid Earth 112 (B11). doi:10.1029/2007JB005027
Campillo, M., Favreau, P., Ionescu, I. R., and Voisin, C. (2001). On the effective friction law of a heterogeneous fault. J. Geophys. Research:Solid Earth 106 (B8), 16307–16322. doi:10.1029/2000JB900467
Chen, Q. C., Feng, C. J., Meng, W., Qin, X. H., and An, Q. M. (2012). Analysis of in situ stress measurements at the northeastern section of the longmenshan fault zone after the 5.12 wenchuan earthquake. Chin. J. Geophys. 55 (12), 3923–3932. doi:10.6038/j.issn.0001-5733.2012.12.005
Cheng, J., Rong, Y. F., Magistrale, H., Chen, G. H., and Xu, X. W. (2019). Earthquake rupture scaling relations for mainland China. Seismol. Res. Lett. 91 (1), 248–261. doi:10.1785/0220190129
Clayton, R., and Engquist, B. (1977). Absorbing boundary conditions for acoustic and elastic wave equations. Bull. Seismol. Soc. Am. 67 (6), 1529–1540. doi:10.1785/BSSA0670061529
Cocco, M., Spudich, P., and Tinti, E. (2006). On the mechanical work absorbed on faults during earthquake ruptures, earthquake: radiated energy and the. Phys. Earthquakes Faulting 170, 237–254. doi:10.1029/170GM24
Das, S., and Aki, K. (1977). A numerical study of two-dimensional spontaneous rupture propagation. Geophys. J. Int. 50 (3), 643–668. doi:10.1111/j.1365-246X.1977.tb01339.x
Day, S. M. (1982a). Three-dimensional finite difference simulation of fault dynamics: rectangular faults with fixed rupture velocity. Bull. Seismol. Soc. Am. 72 (3), 705–727. doi:10.1785/BSSA0720030705
Day, S. M. (1982b). Three-dimensional simulation of spontaneous rupture: the effect of nonuniform prestress. Bull. Seismol. Soc. Am. 72 (6A), 1881–1902. doi:10.1785/BSSA07206A1881
Deng, Q. D., Zhang, P. Z., Ran, Y. K., Yang, X. P., Min, W., and Chen, L. C. (2003). Active tectonics and earthquake activities in China. Earth Sci. Front. 10, 66–73.
Dieterich, J. H. (1972). Time-dependent friction in rocks. J. Geophys. Res. 77 (20), 3690–3697. doi:10.1029/JB077i020p03690
Dieterich, J. H. (1978). Time-dependent friction and the mechanics of stick-slip. Pure Appl. Geophys. 116 (4), 790–806. doi:10.1007/BF00876539
Dieterich, J. H. (1979). Modeling of rock friction: 1. Experimental results and constitutive equations. J. Geophys. Res. Solid Earth 84 (B5), 2161–2168. doi:10.1029/JB084iB05p02161
Dieterich, J. H. (1981). “Constitutive properties of faults with simulated gouge,” in Mechanical behavior of crustal rocks. Editors N. L. Carter, M. Friedman, J. M. Logan, and D. W. Stearns, 103–120. doi:10.1029/GM024p0103
Ding, Z., Romanelli, F., Chen, Y. T., and Panza, G. F. (2004). Realistic modeling of seismic wave ground motion in beijing city. Pure Appl. Geophys. 161 (5), 1093–1106. doi:10.1007/s00024-003-2498-6
Dong, S., and Zhang, H. M. (2019). Effects of angles on dynamic ruptures on Y-type branched faults. Chin. J. Geophys. 62 (11), 4156–4169. doi:10.6038/cjg2019M0572
Fang, T. M., Liu, H., Liu, Y., He, F. B., Zhang, L., Wang, H. B., et al. (2016). Fundamental geological survey situations and development trend in Beijing's urbanization process. Nat. Resour. Inf. (4), 52–56. doi:10.3969/j.issn.1674-3709.2016.04.010
Feng, C. J. (2014). Study on the present in situ stress field beneath the capital circle region. Beijing: Chinese Academy of Geological Sciences.
Festa, G., and Vilotte, J. P. (2005). The newmark scheme as velocity-stress time-staggering: an efficient PML implementation for spectral element simulations of elastodynamics. Geophys. J. Int. 161 (3), 789–812. doi:10.1111/j.1365-246X.2005.02601.x
Fu, C. H., Gao, M. T., and Yu, Y. X. (2015). Studying on amplification effect of beijing basin on 3∼10s ground motion by numerical simulation method. J. Seismol. Res. 38 (3), 448–460. doi:10.3969/j.issn.1000-0666.2015.03.016
Galvez, P., Somerville, P., Petukhin, A., Ampuero, J.-P., and Peter, D. (2020). Earthquake cycle modelling of multi-segmented faults: dynamic rupture and ground motion simulation of the 1992 Mw 7.3 landers earthquake. Pure Appl. Geophys. 177 (5), 2163–2179. doi:10.1007/s00024-019-02228-x
Gao, W. X., and Ma, J. (1993). Seismogeological environment and earthquake disasters in the capital circle[M]. Beijing: Science Press.
Gao, M. T., Yu, Y. X., Zhang, X. M., Wu, J., Hu, P., and Ding, Y. H. (2002). Three-dimensional finite-difference simulations of ground motions in the beijing area. Earthq. Res. China 18 (4), 356–364. doi:10.3969/j.issn.1001-4683.2002.04.005
Gao, M. T., Jiang, H., Yu, Y. X., Xu, L. S., and Tang, L. H. (2005). Effects on mechanism and rigidity of fault surface on strong ground motion. Chin. J. Rock Mech. Eng. (17), 3101–3106.
Guatteri, M. E., and Spudich, P. (2000). What can strong-motion data tell Us about slip-weakening fault-friction laws? Bull. Seismol. Soc. Am. 90 (1), 98–116. doi:10.1785/0119990053
Gui, B. L., He, D. F., Yan, F. W., and Zhang, W. J. (2012). 3D geometry and kinematics of daxing fault: its constraints on the origin of langgu depression, bohaiwan gulf basin, China. Earth Sci. Front. 19 (5), 86–99.
Guo, X. Y., Jiang, C. S., Han, L. B., Yin, H. Q., and Zhao, Z. Y. (2022). Focal mechanism data set in Chinese mainland and its adjacent area(2009-2021). Natl. Earthq. Data Cent. 2022. doi:10.12080/nedc.11.ds.2022.0004
Guo, X. Y., Han, L. B., Zhang, X., Zhang, Z., Fang, L. H., Chen, K., et al. (2024). Source parameters and rupture characteristics of the M6.2 jishishan earthquake in Gansu province on December 18, 2023. Prog. Earthq. Sci. 54 (1), 75–85. doi:10.19987/j.dzkxjz.2023-197
Hast, N. (1969). The state of stress in the upper part of the Earth's crust. Tectonophysics 8 (3), 169–211. doi:10.1016/0040-1951(69)90097-3
He, F. B., Xu, X. W., He, Z. J., Zhang, X. L., Liu, L. Y., Zhang, W., et al. (2020). Research on Neogene-Quaternary stratigraphic structure and shallow tectonic features in the north section of daxing fault zone based on shallow seismic reflection profiling. Seismol. Geol. 42 (4), 893–908. doi:10.3969/j.issn.0253-4967.2020.04.008
Huang, X. M., Wang, L. M., Xu, J., Fang, Z. J., Zhang, Y. M., Xiang, J. C., et al. (1991). Characteristics of neotectonic movement in beijing area. Seismol. Geol. (1), 43–51.
Huang, X., Chen, G., Li, Z. L., and Sun, J. Z. (2012). The study on nanyuan-tongxian fault in beijing daxing planning town. Urban Geol. 7 (4), 15–19. doi:10.3969/j.issn.1007-1903.2012.04.004
Ida, Y. (1972). Cohesive force across the tip of a longitudinal-shear crack and Griffith's specific surface energy. J. Geophys. Res. 77 (20), 3796–3805. doi:10.1029/JB077i020p03796
Ide, S., and Takeo, M. (1997). Determination of constitutive relations of fault slip based on seismic wave analysis. J. Geophys. Res. Solid Earth 102 (B12), 27379–27391. doi:10.1029/97JB02675
Jiang, Y., and Yin, N. (2021). Study on temporal and spatial distribution characteristics of earthquakes in beijing area, earthquake research in Shanxi. Earthq. Res. Shanxi 4, 1–7. doi:10.3969/j.issn.1000-6265.2021.04.001
Jiang, W. L., Hou, Z. H., and Xie, X. S. (2001). Study on the paleoearthquake events in the changping jiuxian trench across the nankou-sunhe fault zone in the beijing plain. Sci. China Earth Sci. 31 (6), 501–509. doi:10.1360/zd2001-31-6-501
Jiao, Q., and Qiu, Z. H. (2006). Research progress of major active faults in beijing Plain area. Bull. Inst. Crustal Dyn. (18), 72–84.
Jiao, Q., Qiu, Z. H., and Fan, G. S. (2005). Analysis on recent tectonic activity and seismicity of babao shan-huangzhuang-gaoliying fault in Beijing region. J. Geodesy Geodyn. 25 (4), 50–54. doi:10.3969/j.issn.1671-5942.2005.04.011
Komatitsch, D., and Tromp, J. (1999). Introduction to the spectral element method for three-dimensional seismic wave propagation. Geophys. J. Int. 139 (3), 806–822. doi:10.1046/J.1365-246X.1999.00967.X
Komatitsch, D., and Tromp, J. (2002a). Spectral-element simulations of global seismic wave propagation-I. Validation. Geophys. J. Int. 149 (2), 390–412. doi:10.1046/j.1365-246X.2002.01653.x
Komatitsch, D., and Tromp, J. (2002b). Spectral-element simulations of global seismic wave propagation-II. Three-dimensional models, oceans, rotation and self-gravitation. Geophys. J. Int. 150 (1), 303–318. doi:10.1046/j.1365-246X.2002.01716.x
Komatitsch, D., Tsuboi, S., and Tromp, J. (2005). The spectral-element method in seismology. Geophys. Monograph-American Geophys. Union 205, 205–227. doi:10.1029/157GM13
Komatitsch, D., Tromp, J., Garg, R., Gharti, H. N., Nagaso, M., Oral, E., et al. (2024). SPECFEM/specfem3d: SPECFEM3D v4.1.1 (v4.1.1). Zenodo. doi:10.5281/zenodo.10823181
Le Pichon, X., Kreemer, C., and Chamot-Rooke, N. (2005). Asymmetry in elastic properties and the evolution of large Continental strike-slip faults. J. Geophys. Res. Solid Earth 110 (B3). doi:10.1029/2004JB003343
Lei, X. D., Qi, B. S., Guan, W., Zhao, Y., Du, D., Yan, G. X., et al. (2021). Research on the faults identification based on gravity anomaly in beijing plain. Chin. J. Geophys. 64 (4), 1253–1265. doi:10.6038/cjg2021O0210
Li, F. Q., and Wang, L. J. (1979). Stress measurements in north China. Chin. J. Geophys. 22 (01), 1–8.
Li, Z. Y., Kang, L. X., and Li, X. G. (1985). Description of the neotectonic map of heibei plain and its surrounding areas. Beijing: Science Press.
Li, Y. H., Wu, Q. J., Pan, J. T., Zhang, F. X., and Yu, D. X. (2013). An upper-mantle S-wave velocity model for east Asia from rayleigh wave tomography. Earth Planet. Sci. Lett. 377-378, 367–377. doi:10.1016/j.epsl.2013.06.033
Li, Z. F., Li, Y. B., Zhou, B. G., Zhu, G. J., Liu, B. J., and Wu, J. (2021). New insight on the Holocene activity of the eastern marginal fault of daxing uplift, beijing Plain. Seismol. Geol. 43 (6), 1671–1681. doi:10.3969/j.issn.0253-4967.2021.06.018
Liang, Y. N. (2019). A study of structure and activity of the north part of Nankou-sunhe fault in beijing. Geol. Bull. China 38 (5), 858–865. doi:10.12097/gbc.dztb-38-5-858
Liao, L. (2017). Simulation of three-dimensional topographic effects on seismic ground motion in capital region based upon the spectral-element method. Seismol. Geomagnetic Observation Res. 38 (1), 7–14. doi:10.3969/j.issn.1003-3246.2017.01.002
Liu, B. Y., Shi, B. P., and Zhang, J. (2007). Strong motion simulation by the composite source modeling: a case study of 1679 m8.0 sanhe-pinggu earthquake. Acta Seismol. Sin. 29 (3), 302–313. doi:10.3321/j.issn:0253-3782.2007.03.009
Liu, C. L., Zheng, Y., Ge, C., Xiong, X., and Xu, H. Z. (2013). Rupture process of the M7.0 lushan earthquake, 2013, Sci. China Earth Sci. 43 (6), 1020–1026. doi:10.1360/zd-2013-43-6-1020
Long, F., Wen, X. Z., and Xu, X. W. (2006). Empirical relationships between magnitude and rupture length, and rupture area, for seismogenic active faults in north China. Seismol. Geol. 28 (4), 511–535. doi:10.3969/j.issn.0253-4967.2006.04.001
Ma, J., Ma, S. L., Liu, L. Q., Deng, W. H., Ma, W. T., and Liu, T. C. (1996). The evolution of the fault geometric structure and physical field, as well as the instability characteristics. Acta Seismol. Sin. 18 (2), 200–207.
Ma, C. H., Qian, F., and Zhang, H. M. (2021). Simulation of rupture process and its influence factors of the 2013 MS7.0 lushan earthquake. Chin. J. Geophys. 64 (1), 170–181. doi:10.6038/cjg2021O0114
Madariaga, R. (1976). Dynamics of an expanding circular fault. Bull. Seismol. Soc. Am. 66 (3), 639–666. doi:10.1785/BSSA0660030639
Matsu'ura, M., Kataoka, H., and Shibazaki, B. (1992). Slip-dependent friction law and nucleation processes in earthquake rupture. Tectonophysics 211 (1-4), 135–148. doi:10.1016/0040-1951(92)90056-C
Miyatake, T. (1992). Reconstruction of dynamic rupture process of an earthquake with constraints of kinematic parameters. Geophys. Res. Lett. 19 (4), 349–352. doi:10.1029/92GL00082
Niu, W. Z., He, F. B., Liu, Z. H., Cui, Y. B., Bai, L. Y., Wang, A. G., et al. (2023). Determination of the northeast section of the nanyuan–Tongxian fault in beijing and research on its Quaternary activity. J. Geomechanics (in Chinese) 29 (6), 879. doi:10.12090/j.issn.1006-6616.2023032
Ohnaka, M., and Yamashita, T. (1989). A cohesive zone model for dynamic shear faulting based on experimentally inferred constitutive relation and strong motion source parameters. Journal of Geophysical Research Solid Earth 94 (B4), 4089–4104. doi:10.1029/JB094iB04p04089
Ohnaka, M., Kuwahara, Y., and Yamamoto, K. (1987). Constitutive relations between dynamic physical parameters near a tip of the propagating slip zone during stick-slip shear failure. Tectonophysics 144 (1-3), 109–125. doi:10.1016/0040-1951(87)90011-4
Okubo, P. G., and Dieterich, J. H. (1984). Effects of physical fault properties on frictional instabilities produced on simulated faults. Journal of Geophysical Research Solid Earth 89 (B7), 5817–5827. doi:10.1029/JB089iB07p05817
Okubo, P. G., and Dieterich, J. H. (1986). State variable fault constitutive relations for dynamic slip. Earthquake Source Mechanics 37, 25–35. doi:10.1029/GM037p0025
Palmer, A. C., and Rice, J. R. (1973). The growth of slip surfaces in the progressive failure of over-consolidated clay. Proceedings of the Royal Society of London. A. Mathematical and Physical Sciences 332 (1591), 527–548. doi:10.1098/rspa.1973.0040
Pan, B., Xu, J. D., Guan, K. C. Z., and He, H. L. (2006). Simulation of the near-fault strong ground motion in beijing region. Seismology and Geology 28 (4), 623–634.
Patera, A. T. (1984). A spectral element method for fluid dynamics: laminar flow in a channel expansion. Journal of computational Physics 54 (3), 468–488. doi:10.1016/0021-9991(84)90128-1
Peyrat, S., Olsen, K., and Madariaga, R. (2001). Dynamic modeling of the 1992 landers earthquake. Journal of Geophysical Research Solid Earth 106 (B11), 26467–26482. doi:10.1029/2001JB000205
Qin, X. H., Zhang, P., Feng, C. J., Sun, W. F., Tan, C. X., Chen, Q. C., et al. (2014). In-situ stress measurements and slip stability of major faults in beijing region, China. Chinese Journal of Geophysics 57 (7), 2165–2180. doi:10.6038/cjg20140712
Ran, H. L. (2011). Empirical relations between earthquake magnitude and parameters of strike-slip seismogenic active faults associated with historical earthquakes in Western China. Seismology and Geology 33 (3), 577–585. doi:10.3969/j.issn.0253-4967.2011.03.008
Ruina, A. (1983). Slip instability and state variable friction laws. Journal of Geophysical Research Solid Earth 88 (B12), 10359–10370. doi:10.1029/JB088iB12p10359
Seriani, G., and Priolo, E. (1991). High-order spectral element method for Acoustic wave modeling. SEG Technical Program Expanded Abstracts 1991, 1561–1564. doi:10.1190/1.1888989
Sunilkumar, T. C., Zhang, Z., Wang, Z., Wang, W., and He, Z. (2024). Unveiling the mechanisms of the 1819 M 7.7 kachchh earthquake, India: integrating physics-based simulation and strong ground motion estimates. Earth and Space Science 11 (8), e2023EA003308. doi:10.1029/2023EA003308
Thurber, C., Zhang, H., Waldhauser, F., Hardebeck, J., Michael, A., and Eberhart-Phillips, D. (2006). Three-dimensional compressional wavespeed model, earthquake relocations, and focal mechanisms for the parkfield, California, region. Bulletin of the Seismological Society of America 96 (4B), S38–S49. doi:10.1785/0120050825
Tinti, E., Bizzarri, A., Piatanesi, A., and Cocco, M. (2004). Estimates of slip weakening distance for different dynamic rupture models. Geophysical Research Letters 31 (2), L02611. doi:10.1029/2003GL018811
Wan, Y. G. (2010). Contemporary tectonic stress field in China. Earthquake Science 23 (4), 377–386. doi:10.1007/s11589-010-0735-5
Wang, Y. H., Cui, X. F., Hu, X. P., and Xie, F. R. (2012). Study on the stress state in upper crust of China mainland based on in-situ stress measurements. Chinese Journal of Geophysics 55 (09), 3016–3027. doi:10.6038/j.issn.0001-5733.2012.09.020
Wang, M. F., Zheng, A., Yu, X. W., and Zhang, W. B. (2018). Study on the influence of local mountainous topography to fault dynamic rupture. Acta Seismologica Sinica 40 (6), 737–752. doi:10.11939/jass.20180022
Wang, Z. J., Li, Y. L., Wang, W. Q., Zhang, W. Q., and Zhang, Z. G. (2022). Revisiting paleoearthquakes with numerical modeling: a case study of the 1679 sanhe–pinggu earthquake. Seismological Research Letters 94 (2A), 720–730. doi:10.1785/0220220208
Weeks, J. D., and Tullis, T. E. (1985). Frictional sliding of dolomite: a variation in constitutive behavior. Journal of Geophysical Research Solid Earth 90 (B9), 7821–7826. doi:10.1029/JB090iB09p07821
Weng, H. H., and Ampuero, J. P. (2019). The dynamics of elongated earthquake ruptures. Journal of Geophysical Research Solid Earth 124 (8), 8584–8610. doi:10.1029/2019JB017684
Wessel, P., Smith, W. H. F., Scharroo, R., Luis, J., and Wobbe, F. (2013). Generic mapping tools: improved version released. Transactions American Geophysical Union 94 (45), 409–410. doi:10.1002/2013EO450001
Wu, M. J., Zhu, H. B., Yue, X. Y., Lin, X. D., and Li, H. (2013). Analysis on potential earthquake risk of Capital Zone based on multiple seismicity parameters. North China Earthquake Sciences 31 (1), 25–30. doi:10.3969/j.issn.1003-1375.2013.01.005
Xie, Y. S., and Cai, M. B. (1983). Compilation of historical seismological data. China, Beijing: Science Press.
Xie, Z. D., Yu, X. W., and Zhang, W. B. (2024). Dynamic rupture process of the 2018 Hokkaido MW6.6 earthquake, Japan. Chinese Journal of Geophysics 67 (8), 2972–2989. doi:10.6038/cjg2023Q0942
Xie, Z. D., Yu, X. W., and Zhang, W. B. (2025). Dynamic source rupture process of the 2022 Menyuan Mw6.6 earthquake, Qinghai province. Acta Seismologica Sinica 47 (1), 21–36. doi:10.11939/jass.20230144
Xin, H. L., Zhang, H. J., Kang, M., He, R. Z., Gao, L., and Gao, J. (2018). High-resolution lithospheric velocity structure of Continental China by double-difference seismic travel-Time Tomography. Seismological Research Letters 90 (1), 229–241. doi:10.1785/0220180209
Xu, X. W., Yu, G. H., Ran, Y. K., Yang, X. P., Zhang, L. M., Sun, F. L., et al. (2015). Introduction to active faults in Chinese cities: findings from the detection of active faults in 20 cities. Beijing: Science Press, 380–403.
Xu, X. W., Han, Z. J., and Yang, X. P. (2016). Seismotectonic map in China and its adjacent regions. Beijing: Science Press.
Xu, C. Y., Zhang, Y., Wang, R., Hua, S., Xu, Y., Dai, D., et al. (2023). Application of MEMS data to fast inversion of rupture process: tests with recordings from the IRREEW network. Seismological Research Letters 94 (4), 1821–1835. doi:10.1785/0220220369
Yang, D. X., and Zhao, Y. (2010). Effects of rupture forward directivity and fling step of nearfault ground motions on seismic performance of base-isolated building structure. Acta Seismologica Sinica 32 (5), 579–587. doi:10.3969/j.issn.0253-3782.2010.05.007
Yang, Y., Shi, B. P., and Sun, L. (2008). Seismic hazard estimation based on the distributed seismicity in northern China. Acta Seismologica Sinica 30 (2), 198–208. doi:10.3321/j.issn:0253-3782.2008.02.009
Yuan, J., and Zhu, S. B. (2016). Distributions of strong ground motion due to dynamic ruptures across a bimaterial fault: implications for seismic hazard analyses. Journal of Asian Earth Sciences 131, 81–94. doi:10.1016/j.jseaes.2016.09.010
Zhang, Q. W., and Zhu, S. B. (2019). The coulomb stress changes and seismicity on some major faults in north China. Seismology and Geology 41 (3), 649–669. doi:10.3969/j.issn.0253-4967.2019.03.008
Zhang, W., Iwata, T., Irikura, K., Sekiguchi, H., and Bouchon, M. (2003). Heterogeneous distribution of the dynamic source parameters of the 1999 chi-chi, Taiwan, earthquake. Journal of Geophysical Research Solid Earth 108 (B5). doi:10.1029/2002JB001889
Zhang, L., Bai, L. Y., Cai, X. M., Wang, J. M., Liu, Y., He, F. B., et al. (2014). An analysis of the activity of the northwest part of nankou-sunhe fault. Geology in China 41 (3), 902–911. doi:10.3969/j.issn.1000-3657.2014.03.017
Zhang, L. F., Bunichiro, S., Liao, W. L., Li, J. G., and Wang, Q. L. (2016). Controlling factors analysis of dynamic rupture propagation simulation of curved fault based on boundary integral equation method. Chinese Journal of Geophysics 59 (3), 981–991. doi:10.6038/cjg20160320
Zhang, L., Bai, L. Y., Zhao, Y., Zhang, X. L., Yang, T. S., Cai, X. M., et al. (2017a). The difference of deposition rate in the boreholes at the junction between nankou-sunhe fault and huangzhuang-gaoliying fault and its response to fault activity in the beijing area. Seismology and Geology 39 (5), 1048–1065. doi:10.3969/j.issn.0253-4967.2017.05.013
Zhang, L., Zhang, X. L., Bai, L. Y., Yang, T. S., Cai, X. M., and Liang, Y. N. (2017b). Activity study and disaster effect analysis of the north section of Huangzhuang-Gaoliying fault in Beijing. Journal of Geomechanics 23 (4), 548–557. doi:10.3969/j.issn.1006-6616.2017.04.006
Zhang, Z. G., Zhang, W. Q., and Chen, X. F. (2019). Dynamic rupture simulations of the 2008 Mw 7.9 wenchuan earthquake by the curved grid finite-difference method. Journal of Geophysical Research Solid Earth 124 (10), 10565–10582. doi:10.1029/2019JB018630
Zhao, H. G., and Liu, C. Y. (2002). Study on the segmentation of the daxing fault. Oil and Gas Geology 23 (4), 368–371. doi:10.11743/ogg20020414
Zhao, Z. H., and Zhu, H. J. (2003). The main characteristics of geological environment and present situation of geological hazard in plain area of Shunyi, Beijing. The Chinese Journal of Geological Hazard and Control 14 (2), 61–66. doi:10.3969/j.issn.1003-8035.2003.02.013
Zhao, L., Li, Y. M., Cui, W. J., Luo, Y., Zhang, Y. Q., Tian, F., et al. (2018). Disaster characteristics and influence factors for ground fissures at songzhuang village in beijing. Journal of Engineering Geology (in Chinese) 26 (6), 1600–1610. doi:10.13544/j.cnki.jeg.2017-426
Zhao, L., Li, Y. M., Luo, L., Liu, J. R., Cui, W. J., Zhang, Y. Q., et al. (2021). An extension-dominant 9-km-long ground failure along a buried geological fault on the eastern beijing Plain, China, Engineering Geology, 289, 106168. doi:10.1016/j.enggeo.2021.106168
Zhou, H., and Chen, X. F. (2008). Simulation of strong ground motion in beijing city due to the zhangbei earthquake. Progress in Geophysics 23 (5), 1355–1366.
Zhu, S. B. Y., and Jie, Y. (2016). Mechanisms for the fault rupture of the 2008 wenchuan earthquake (MS=8.0) with predominately unilateral propagation. Chinese Journal of Geophysics 59 (11), 4063–4074. doi:10.6038/cjg20161111
Keywords: Nanyuan–Tongxian fault, dynamic simulation, strong ground motion, potentialearthquake, rupture intensity
Citation: Xie Z (2025) Dynamics of the 1057 M 6 earthquake rupture and seismic hazard implications for the Beijing region, China. Front. Earth Sci. 13:1669495. doi: 10.3389/feart.2025.1669495
Received: 19 July 2025; Accepted: 23 September 2025;
Published: 17 October 2025.
Edited by:
Paolo Capuano, University of Salerno, ItalyReviewed by:
Liangyu Zhu, China Earthquake Administration, ChinaFang Ouyang, China Earthquake Administration, China
Copyright © 2025 Xie. This is an open-access article distributed under the terms of the Creative Commons Attribution License (CC BY). The use, distribution or reproduction in other forums is permitted, provided the original author(s) and the copyright owner(s) are credited and that the original publication in this journal is cited, in accordance with accepted academic practice. No use, distribution or reproduction is permitted which does not comply with these terms.
*Correspondence: Zhangdi Xie, eGllemhhbmdkaTIwQG1haWxzLnVjYXMuYWMuY24=