 Xiao Li1,2*
 Ying Tang1,2Youwu Li1,2Fan Yang1,2Xiaodan Wu1,2Jingyao Sun1,2Jingyun Cui1,2Qing Zhang1,2Siqi Yuan1,2ZhiQin Kang3
- 1CNOOC Key Laboratory of Liquefied Natural Gas and Low-carbon Technology, Beijing, China
- 2CNOOC Gas & Power Group, Research & Development Center, Beijing, China
- 3Taiyuan University of Technology, Taiyuan, China
Introduction: In-situ pyrolysis technology for oil-rich coal represents a low-carbon resource development strategy characterized by ‘hydrogen extraction and carbon retention,’ holding significant importance for advancing the efficient exploitation of coal-based oil and gas resources. However, substantial differences exist between in-situ pyrolysis and conventional pyrolysis in terms of conversion efficiency and product composition, making the control of operating conditions a critical challenge in this field.
Methods: This study utilized large-sized block oil-rich coal samples from the Xie Gou mining area in Shanxi Province. Employing a self-developed, fully enclosed pyrolysis experimental system, the research simulated the high-temperature, high-pressure, slow-heating-rate, and long-duration reaction environment typical of in-situ pyrolysis. The distribution patterns of gaseous, liquid, and solid pyrolysis products from the oil-rich coal under varying temperatures were systematically investigated. Building upon the experimental results, industrial-scale simulations of oil-rich coal in-situ pyrolysis were conducted using COMSOL Multiphysics software.
Results and Discussion: The key findings are as follows: (1) The primary gaseous product of the pyrolysis reaction is CH4, with the total gas yield increasing significantly as temperature rises; (2) The temperature window of 450 °C–550 °C offers the potential for maximizing light oil recovery; (3) The stability of the carbon skeleton within the oil-rich coal enhances progressively as the pyrolysis reaction proceeds; (4) For industrial application, optimal oil production is achieved within approximately 500 days of heating, while optimal gas production occurs around 1900 days of heating. This study provides crucial theoretical support for the industrialization of oil-rich coal in-situ pyrolysis and demonstrates considerable application potential for the extraction of high-value oil and gas fuels.
1 Introduction
In recent years, with the intensification of global extreme weather events, world-wide emphasis on climate governance has significantly increased. As one of the world’s major economies, China has correspondingly proposed its ‘carbon peak and carbon neutrality’ targets. However, given that coal occupies the dominant position in China’s energy consumption structure—a situation expected to persist long-term—the development and utilization of oil-rich coal is urgently required to address the energy reality characterized by ‘abundant coal but scarce oil and gas.’ As a special coal resource possessing triple attributes of coal, oil, and gas (Feng et al., 2016; Kang et al., 2020), oil-rich coal features high hydrogen content and abundant aliphatic structures (Wang S. et al., 2024). Through pyrolysis, it can yield 7%–12% coal tar, enabling the efficient utilization of coalbased oil and gas resources (Wang M. et al., 2024; Wang et al., 2021; Ning et al., 2025). China’s reserves of oil-rich coal exceed 550 billion tonnes (5.5 × 10¹¹t), with potential oil and gas resources estimated at 50 billion tonnes and 75 trillion cubic meters, respectively, indicating immense resource potential (Ju et al., 2021).
Numerous scholars domestically and internationally have conducted research on oil-rich coal development and utilization technologies. Investigations into the thermal decomposition characteristics of oil-rich coal form the theoretical foundation for its utilization. Yang et al. (2023a) analyzed the pyrolysis characteristics of oil-rich coal within its original geological environment, determining its typical thermodynamic functions and related parameters, and established the primary reaction functions for the oil-rich coal pyrolysis process. Bhattacharyya et al. (2024) examined the product composition of biomass-containing coal samples under various pyrolysis conditions, identifying the influence of biomass component content and pyrolysis conditions on the pyrolysis products. Zhang et al. (2025) systematically studied the structural characteristics of oil-rich coal and their correlation with pyrolysis products through proximate and ultimate analysis, providing a theoretical basis for the precise directional conversion of oil and gas. Fu et al. (2023a) employed techniques like electrical heating to pyrolyze oil-rich coal after artificial fracturing, investigating the optimal pyrolysis temperature windows under different coal quality characteristics and pyrolysis atmospheres. Ye et al. (2023) focused on analyzing heat transfer modes and physicochemical reactions during pyrolysis within fractured porous zones of oil-rich coal. Thermogravimetric analysis (TGA) is the most frequently used method for studying oil-rich coal pyrolysis characteristics. Guo et al. (2023) analyzed the distribution characteristics of oil and gas resources in recoverable strata and their impact on recovery efficiency by studying the properties of residual organic matter postpyrolysis. To analyze the differences between oil-rich coal and ordinary coal, Yu et al. (2023) utilized TGA coupled with in-situ Fourier transform infrared spectroscopy (FTIR) to study the pyrolysis characteristics of oil-rich coal macerals. They discovered that the vitrinite in oil-rich coal possesses more aliphatic long chains and alkyl side chains compared to ordinary coal, resulting in superior py-rolysis reactivity. Xie et al. (2018), building on this, further analyzed the differences in the decomposition behavior of carboxylic acid groups between oil-rich coal and ordinary bituminous coal during the pyrolysis process by using infrared spectroscopy technology. Yu G. et al. (2024) characterized the low-temperature pyrolysis processes of three coal types using TGA, deriving the various product yields from oil-rich coal pyrolysis by analyzing its reaction process parameters. Furthermore, many scholars have investigated practical engineering application technologies for oil-rich coal pyrolysis. Chen M. et al. (2025) simulated the influence of temperature, pressure, and other factors on the in-situ pyrolysis reaction process by conducting gas pressurization experiments on oil-rich coal in autoclaves. Duan et al. (2024) conducted field pyrolysis experiments on oil-rich coal in Northern Shaanxi, China, comprehensively analyzing suitable geological conditions for in-situ pyrolysis and obtaining optimal parameters such as formation temperature and pressure. Krumm et al. (2017) enhanced oil and gas recovery from coal seams by injecting CO2 after heating deep coal layers, observing changes in coal structure and gas adsorption capacity with increasing heating temperature. Wang et al. (2025a), Wang L. et al. (2024), and Wang et al. (2025b) conducted extensive experimental studies on the pyrolysis product distribution, anisotropic evolution, and heat transfer mechanisms of coal samples under high-temperature steam environments, providing theoretical foundations for investigating both macroscopic and microscopic mechanisms of coal pyrolysis. Extensive research on in-situ pyrolysis of oil-rich coal indicates that, compared to traditional surface retorting processes, this technology offers advantages such as reduced carbon emissions, minimized surface disturbance, and improved energy recovery efficiency (Yuan et al., 2025; Ju et al., 2022; Tian et al., 2024; Yu Z. et al., 2024; Dong et al., 2025).
Although numerous scholars have investigated the pyrolysis mechanism of oil-rich coal and in-situ pyrolysis technologies, research to date has predominantly focused on rapid surface pyrolysis of powdered coal samples. Studies on the pyrolysis processes and characteristics of largescale oil-rich coal under prolonged, enclosed in-situ conditions remain extremely scarce. Building upon this gap, this research employs lump oil-rich coal from the Xie Gou Mine in Lvliang, Shanxi Province as the study object. Integrating gas chromatography-mass spectrometry (GC-MS) and rock thermal analysis technology, the study simulates the reaction processes of large coal masses under extended duration and controlled low heating rates, along with parameter variations induced by high-temperature and high-pressure conditions. It systematically analyzes the influence of pyrolysis temperature on the three-phase products of oil-rich coal. Based on experimental parameter fitting, numerical simulations of hundred-meter-scale oil-rich coal in-situ pyrolysis were conducted using COMSOL Multiphysics software. This work provides both theoretical support and technical exploration for the industrialization of oil-rich coal in-situ pyrolysis.
2 Materials and methods
2.1 Sample preparation
The experimental coal samples were selected from oil-rich coal at the Xie Gou Mine in Shanxi Province, China. The Xiegou coal samples employed in this study are representative of 78.3% of Shanxi Province’s oil-rich coal reserves. The selected samples exhibited black, lumpy morphology with dense texture and weak greasy luster. After crushing and sieving to obtain 20–30 mm particle size fractions, the coal was dried at 105 °C for 24 h to remove surface moisture. The mean maximum vitrinite reflectance (Ro,max) of the prepared samples was measured as 0.74% ± 0.02. Organic maceral composition was determined using a Leica DM6000M image analyzer employing a grayscale-reflectance model and automated vitrinite recognition technology (see Figure 1), yielding the following composition: vitrinite (60.3%), inertinite (30.1%), and liptinite (10.6%). Gray-King assay pyrolysis was conducted under conditions of 600 °C final temperature, 5 °C/min heating rate, and 15-min holding time, with resultant pyrolysis products detailed in Table 1.
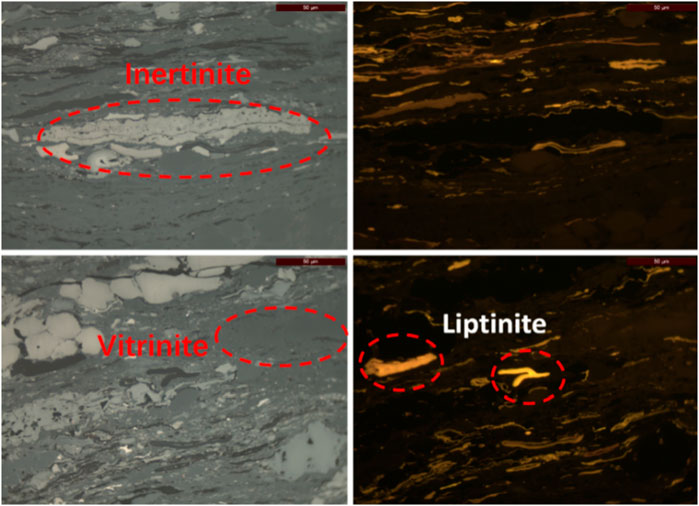
Figure 1. Microscopic component identification of whole rock thin Section (1:500).

Table 1. Gieseler distillation product distribution and Ro,max of Xiegou gas coal.
Under the conditions of an initial temperature of 25 °C, a final temperature of 900 °C, and air as the carrier gas, the weight loss rate of oil-rich coal was measured at a heating rate of 10 °C/min. The results are shown in Figure 2, and the sample exhibited a relatively high weight loss rate.
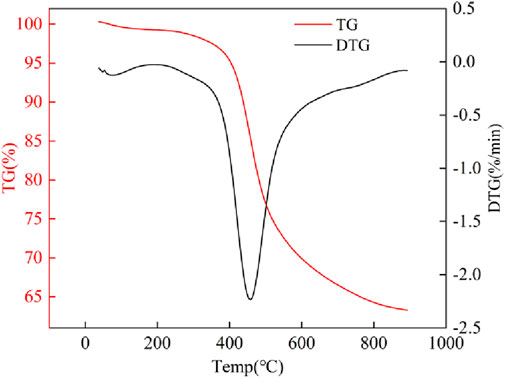
Figure 2. Thermogravimetric curve of Xiegou Oil-rich coal.
2.2 Pyrolysis experiment
Fifty grams coal samples were reacted in a high-temperature/high-pressure autoclave to simulate in-situ pyrolysis of oil-rich coal under varying thermal conditions. Six separate samples underwent sealed pyrolysis experiments at designated temperatures of 350 °C, 400 °C, 450 °C, 500 °C, 550 °C, and 600 °C. Detailed data are shown in Table 2.

Table 2. Final stable pressure of in-situpyrolysis tar-rich coal system.
The experiments in this study were conducted to simulate the in-situ underground environment, and a reaction system was constructed to simulate the in-situ temperature-pressure conditions of the strata over extended periods (schematic diagram of the equipment shown in Figure 3, equipment photos shown in Figure 4). The system consists of four main components: the data acquisition and control module; the in-situ pyrolysis module, which provides a sealed reaction environment with a maximum pressure of 50 MPa; the product separation and collection module; and the precise atmosphere control module.
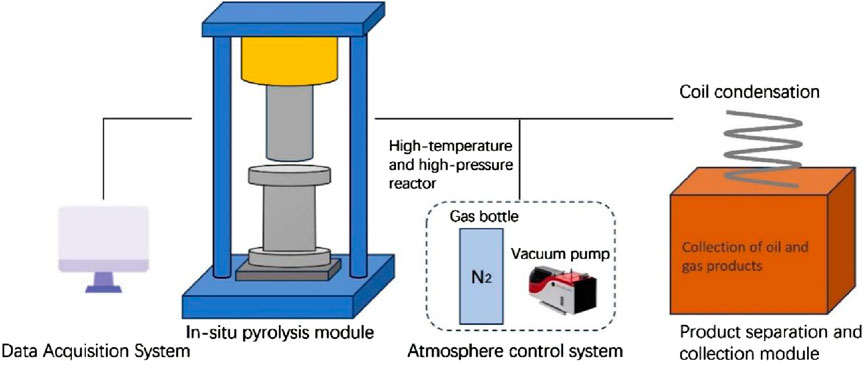
Figure 3. Schematic of long-term in-situ temperature-pressure simulation systems.
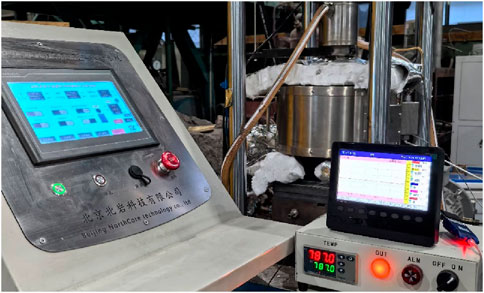
Figure 4. Long-term in-situ temperature-pressure simulation reaction system.
During the experiment, the pretreated samples were placed in the reaction vessel, and a 15 MPa axial load was applied using a servo pressurization system to simulate the in-situ stress conditions at a depth of approximately 600 m underground. The system was then thoroughly checked for airtightness, followed by a 1 h vacuum pretreatment to eliminate any residual gas interference.
In the experiment, each sample was heated to the preset final pyrolysis temperature at a heating rate of 1 °C min−1. To investigate the distribution of pyrolysis products under long-term closed conditions, the reactor was completely sealed immediately after heating commenced, and the reaction was maintained at the final temperature. Under these conditions, the pressure inside the reactor gradually increased over time. Heating was ceased after the pressure remained stable without increasing for 2 h, with 48 h ultimately determined as the duration for a single experiment. Following the experiment, once the system cooled to 180 °C, the outlet of the high-temperature and high-pressure reactor was opened. Volatile products generated by pyrolysis entered the product separation system, where oil-gas products and solid residues were collected. The reactor and pipelines were then flushed with dichloromethane. The oil phase in the high-pressure reactor and pipelines was labeled as “discharged oil,” while the oil phase in the residual solid was obtained via extraction and labeled as “residual oil.”
After long-term reaction under in situ conditions, the morphology of the coal sample underwent significant changes: the originally dispersed coal particles coked and agglomerated together, thereby affecting the heat and mass transfer efficiency, as shown in Figure 5.
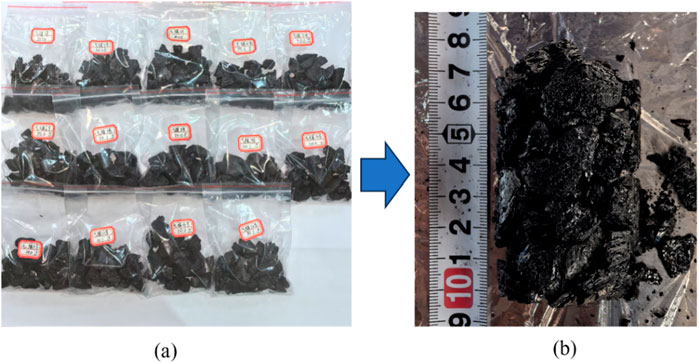
Figure 5. Photos of Xiegou tar-rich coal before and after pyrolysis. (a) Initial sample. (b) Post-pyrolysis sample.
2.3 Theoretical basis for industrial-scale extraction simulation of oil-rich coal
2.3.1 Physical model
The well layout for electric heating exploitation of oil-rich coal is shown in Figure 6. To ensure the model conforms to actual conditions, the total size of the model is a cuboid of 50 × 50 × 30 m, and an axial pressure of 15 MPa was applied to simulate the oil-rich coal reservoir with a burial depth of 600 m. A 6-m-thick oil-rich coal seam is positioned in the middle of the model; this coal seam is enclosed by two layers (roof and floor), each 12 m thick, as depicted in Figure 6a. Figure 6b illustrates the layout of heaters and production wells, where red represents heaters and blue represents production wells. The outer-most heaters are located 7 m from the boundary. Heaters are arranged at 3-m intervals, with a production well placed midway between every two adjacent heaters:
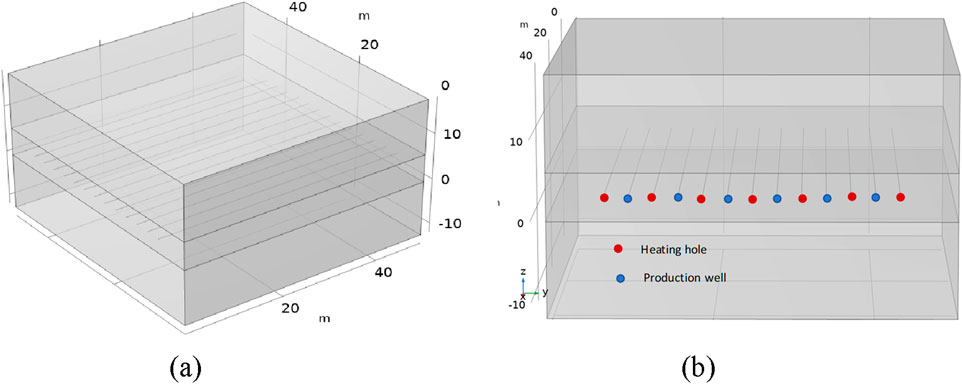
Figure 6. Simulation physical model for oil-rich coal mining. (a) Front view. (b) Pattern shape.
2.3.2 Mathematical model
2.3.2.1 Energy conservation equation
Where:
2.3.2.2 Gas energy conservation equation
Where:
2.3.2.3 Static equilibrium equation
Where:
2.3.3 Experimental parameter fitting model
During the pyrolysis process, the permeability, thermal conductivity, and thermal expansion coefficient of the oil-rich coal reservoir all vary with temperature, which were fitted based on the data obtained from experimental studies to obtain the relational expressions for each parameter of the physical model. In addition, considering that the temperature range in the numerical simulation process is larger than that in the experiments, the permeability within the temperature range beyond the experimental range is still extrapolated horizontally based on adjacent experimental data. Since oil-rich coal is a weakly anisotropic material (Yang et al., 2021), the coal seam is assumed to be an isotropic reservoir.
2.3.3.1 The variation law of permeability with temperature
The fitting equation of coal seam permeability varying with temperature is:
Where:
2.3.3.2 The variation law of the coefficient of thermal expansion with temperature
In previous experiments, we employed a Netzsch dilatometer to measure the thermal expansion coefficient of coal under varying temperatures and pressures. The thermal expansion coefficient equation is as follows:
Where:
2.3.3.3 The variation law of thermal conductivity coefficient at temperature
There is a critically important relationship between thermal conductivity and the heat transfer characteristics of oil-rich coal seams. In the author’s previous research, the thermal conductivity of oil-rich coal was fitted and obtained using the NETZSCH LFA 457 laser thermal conductivity analyzer:
Where:
2.3.4 Boundary conditions
Boundary conditions for the temperature field: The initial temperature of the coal seam, roof, and floor is 20 °C; the temperature of heating wells is fixed at 600 °C; the initial temperature of production wells is 20 °C; and the surrounding boundaries of the model are thermally insulated.
Boundary conditions for the solid deformation field: The upper boundary is subject to a vertically downward boundary load of 15 MPa to simulate the environment at a burial depth of 600 m; the surrounding boundaries are roller supports to constrain horizontal displacement; and the lower boundary is a fixed boundary.
3 Experimental results
3.1 In-situ pyrolysis gas-phase product analysis
Through sealed pyrolysis experiments on oil-rich coal samples from Shanxi Xie Gou Mine, the total gas yield and system pressure under heating conditions were measured. The temperature-dependent correlations are plotted in Figure 7. As shown, when temperature increased from 350 °C to 600 °C, system pressure rose from 0.8 MPa to 14.5 MPa. Analysis of gas yield reveals a progressive increase to 150 mL/g with rising temperature, exhibiting a growth rate that initially accelerates then decelerates.
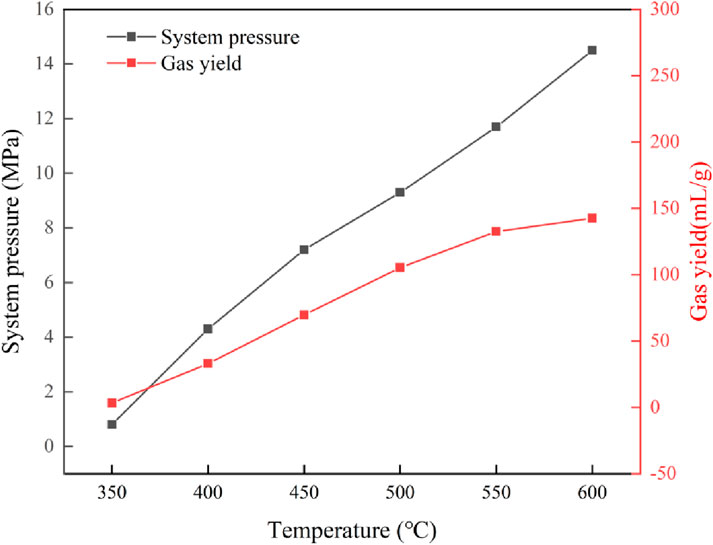
Figure 7. Pressure in a closed system and pyrolysis gas yield.
Figure 8a shows the variation diagram of the proportion of each component in the pyrolysis gases with temperature, from the figure it can be seen that at 350 °C, CO2 accounts for the highest proportion in the gaseous products, with increasing temperature the proportion of CO2 gradually decreases, and the proportion also gradually decreases, at 500 °C a slight rebound occurs; the proportion of CH4 gas rapidly increases with increasing temperature, although a significant decrease appears in the temperature range of 450 °C–500 °C, thereafter it rapidly increases, reaching a peak of 82.1% at 550 °C; the proportions of C2 and C3 gases increase in the range of 350 °C–400 °C, reaching peaks at 400 °C, afterwards with increasing temperature the proportions of both gases decrease; furthermore, the proportion of H2 overall shows a decreasing trend, but exhibits a slight rebound at 600 °C, in contrast, throughout the entire pyrolysis reaction process the proportion of CO remains relatively small.
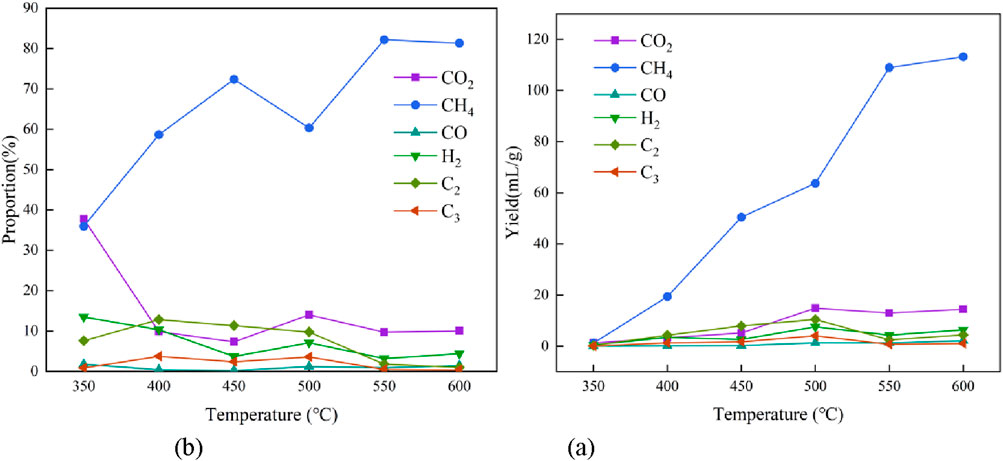
Figure 8. Pyrolysis gas composition and yield distribution. (a) Yield of pyrolysis gas. (b) Proportion of pyrolysis gas.
Figure 8b shows the temperature-dependent yield trends of pyrolytic gas components. CH4 yield exhibits the most significant increase, reaching 113.2 mL/g at 600 °C. Conversely, CO, C2, and C3 yields decline progressively with rising temperature, aligning with their proportional composition trends. Within the 550 °C–600 °C interval, CH4 and H2 yields increase while CO2 yield remains comparable to 500 °C levels.
3.2 In-situ pyrolysis liquid-phase products analysis
Figure 9 illustrates variations in residual and discharged oil yields after prolonged sealed pyrolysis of oil-rich coal. As shown in Figure 9, discharged oil yield gradually increases between 350 °C and 450 °C but declines with further temperature rise. Additionally, residual oil yield progressively decreases with increasing temperature. When temperature continues rising to 450 °C, discharged oil yield increases; after this point, both discharged and residual oils show decreasing trends.
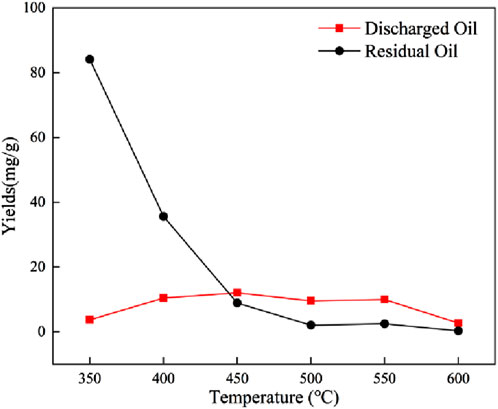
Figure 9. Residual and discharged oil yield vs. temperature curve.
Figure 10 shows compositional changes in discharged and residual oils from sealed pyrolysis of lump oil-rich coal. Using SARA analysis, coal tar is categorized into aromatics, saturates, asphaltenes, and non-hydrocarbons. Observing Figure 10, under prolonged in-situ sealed pyrolysis conditions: with increasing temperature, saturates content in discharged oil shows an overall rising trend, while in residual oil, saturates content exhibits a more pronounced increase from 350 °C to 600 °C; while aromatics content remains relatively high in both oil types; additionally, non-hydrocarbons show minimal fluctuations between 350 °C and 600 °C, with discharged oil maintaining greater stability at approximately 20%; asphaltenes content decreases in both discharged and residual oils.
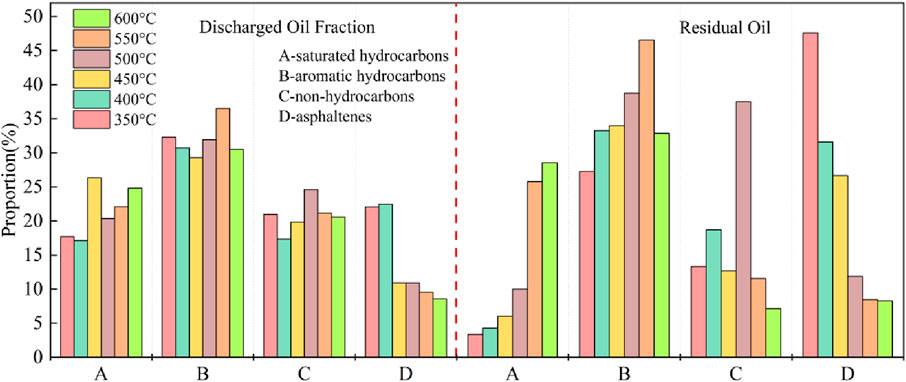
Figure 10. Comparison of residual and discharged oil fraction components.
Figure 11 shows the carbon number distributions of discharged and residual oils from prolonged sealed pyrolysis of lump oil-rich coal. According to GC-MS analysis, the carbon number distributions of discharged and residual oils exhibit similar trends with temperature change. Here, C5–C16 components are defined as light fractions, C17–C19 as medium fractions, and C20+ as heavy fractions. Based on Figure 11, as temperature increases, the light fraction content in discharged oil gradually rises, reaches a peak of 30.0% during 500 °C–550 °C, then declines after 550 °C. The light fraction content in residual oil also increases significantly but reaches its peak at 450 °C. C17–C19 content in discharged oil remains stable between 17% and 25% without significant change, while in residual oil it increases significantly at 400 °C and stabilizes around 30% when temperature exceeds 400 °C; for heavy fractions (C20+), both discharged and residual oils show an initial decrease followed by an increase trend: discharged oil decreases significantly from 350 °C to 550 °C to 49.2%, then rises to 72.3% at 600 °C, while residual oil decreases to 42.4% before rising with further temperature increase.
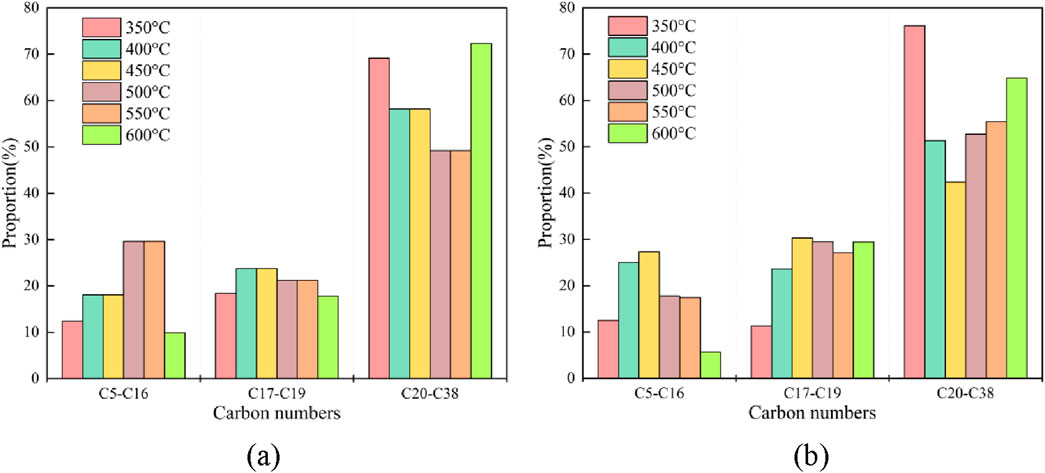
Figure 11. Carbon number distribution of pyrolysis residual oil and discharged oil. (a) Discharged oil. (b) Residual oil.
Comprehensive hydrocarbon chromatography studies indicate that within the 450 °C–550 °C temperature range, discharged oil exhibits higher proportions of light fractions and lower heavy fraction content; group component analysis further reveals elevated saturates content in discharged oil during this same interval.
3.3 In-situ pyrolysis solid products analysis
Analysis of solid residues from sealed pyrolysis of Xie Gou oil-rich coal using Rock-Eval pyrolysis equipment is presented in Figure 12. The original sample contains 69.19% TOC and 14.81% PC. With increasing temperature, TOC content continuously rises by 17.5%, while PC content decreases from 14.81% to 1.66%. Figure 12 further shows PC content decreases continuously with rising temperature, exhibiting particularly pronounced changes at 350 °C.
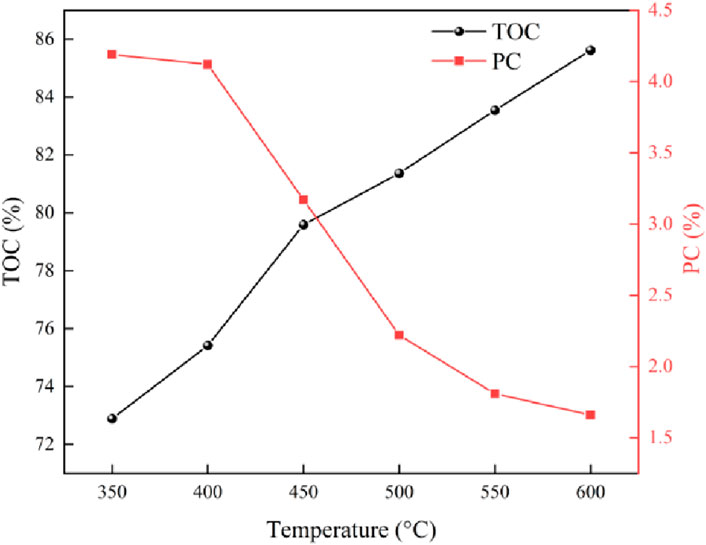
Figure 12. TOC and PC changes in Xiegou tar-rich coal pyrolysis residue with temperature.
3.4 Analysis of simulation results obtained based on experimental data
3.4.1 Temperature field variation of in-situ pyrolysis via electric heating method
From the results of oil-rich coal pyrolysis experiments, it is known that when the temperature exceeds 350 °C, pyrolysis gas and coal tar start to generate in oil-rich coal. As the temperature increases, when the temperature exceeds 500 °C, the gas yield starts to increase while the oil yield decreases. Therefore, temperature is an important factor affecting the pyrolysis oil and gas yields of oil-rich coal, and also an important indicator reflecting the in-situ heating efficiency of oil-rich coal.
Figure 13 shows the variation law of the temperature field under different heating times, obtained by fitting experimental data. At 100 days, the temperature around the heaters rises, forming a pyrolysis zone, and the area with temperature above 500 °C accounts for 11.5% of the entire coal seam. As the heating time extends to 600 days, the high-temperature area continues to expand to the distal end of the heaters; at this time, the 500 °C isotherms are still not interconnected, and the area above 500 °C accounts for 40.6% of the entire coal seam.
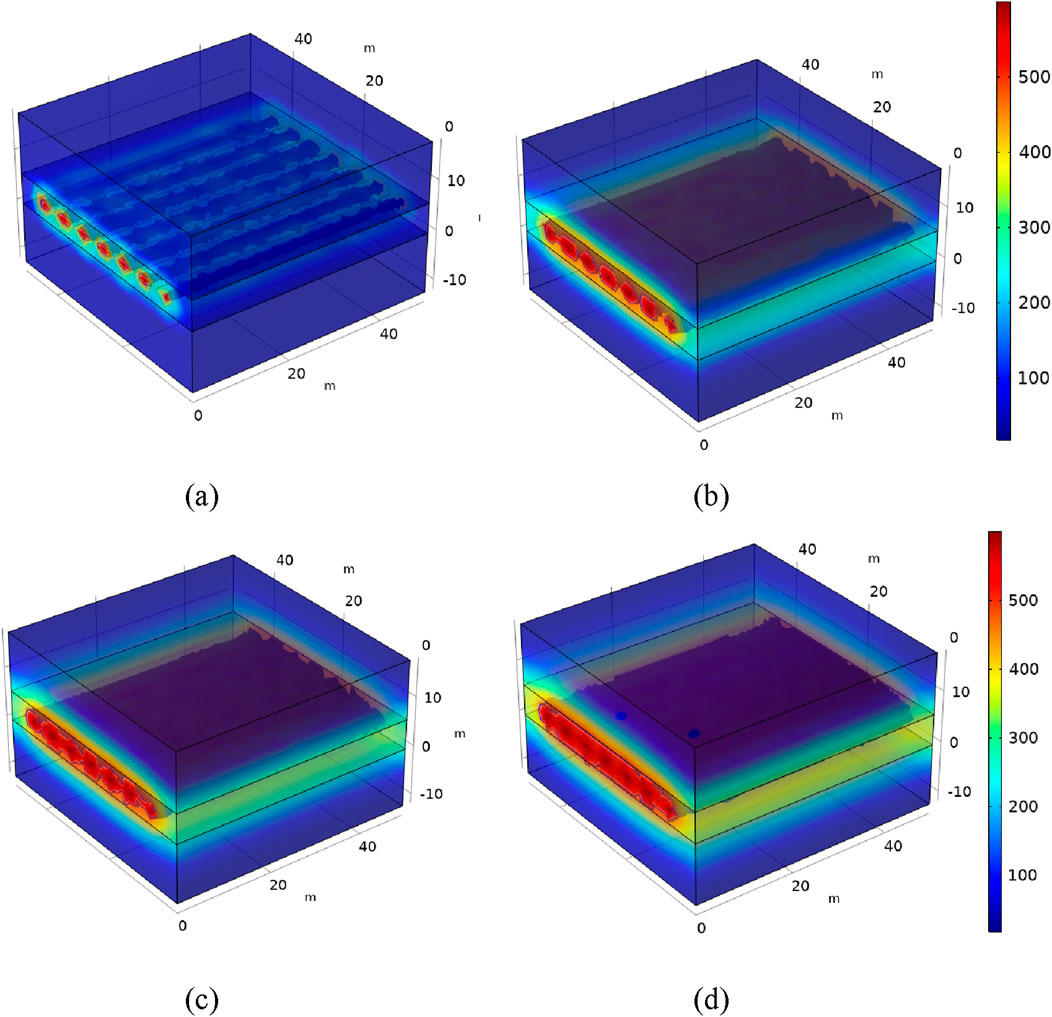
Figure 13. Temperature field distribution diagrams under different heating times. (a) 100 d. (b) 600 d. (c) 1,000 d. (d) 1,500 d.
When the heating time reaches 1,000 days, the 500 °C isotherms gradually interconnect. At 1,500 days, the temperature of the coal seam between heaters has all reached above 500 °C, with the average temperature of the coal seam reaching 502.1 °C. This indicates that the in-situ electric heating method can effectively heat the oil-rich coal seam, thereby exploiting oil and gas resources.
3.4.2 Yield variation of three-phase products of in-situ pyrolysis via electric heating method
Based on the yield data obtained from experiments, the cumulative yields of discharged oil, CH4, and H2 from in-situ pyrolysis of oil-rich coal at the industrial scale were derived, as shown in Figure 14. The cumulative yields of liquid fuel and natural gas both continuously increase with heating time, but the growth rate gradually slows down, reflecting the gradual nature of the pyrolysis reaction. Specifically, the cumulative yield of discharged oil increases from an initial 48,099 kg to a final 919,910 kg; CH4 increases from 9.48 × 10⁵ L to 3.23 × 10⁷ L; and H2 increases from 7.86 × 10⁴ L to 2.37 × 10⁶ L. The yields follow the order: CH4 > discharged oil > H2, with significant differences in their scales, consistent with the trends observed in previous experiments.
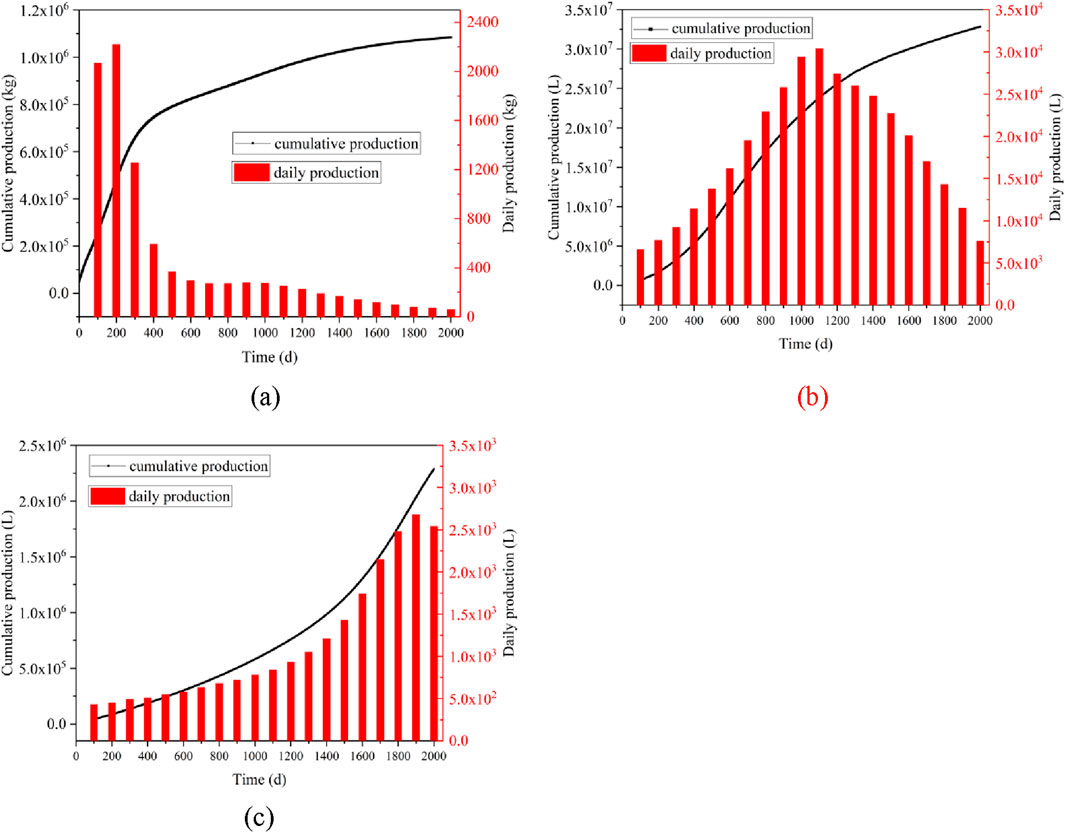
Figure 14. Variation patterns of major pyrolytic products over time. (A) Discharged oil. (B) CH4. (C) H2.
Discharged oil daily production change presents a pattern of first rapid rise then continuous decline: at 200 days reaching peak 2,320 kg, afterward sharply decreasing, after 400 days below 600 kg, after 1,500 days only less than 100 kg, indicating tar generation concentrates in the early low-medium temperature stage; CH4 daily production peak (3.16 × 10⁴ L) appears at 1,100 d, H2 daily production peak appears at 1,900 d, its occurrence time latest, simultaneously daily production lowest, peak only 2,680 L.
4 Discussion
The oil-rich coal sample undergoes significant temperature-dependent changes in gaseous products, liquid products, and residual solids during thermal decomposition in a confined environment. Firstly, for pyrolytic gaseous products: the variation trends of total gas yield and system pressure show a distinct positive correlation with temperature, because elevated temperature promotes coal pyrolysis reactions, releasing more volatile organic compounds from the coal sample and converting them into gaseous products. Thus, the gas generation rate accelerates, increasing gas production. However, when temperature reaches 550 °C, high pressure in the confined system inhibits forward reactions, reducing the gas yield growth rate. Consequently, gas yield exhibits a trend of initial increase followed by decrease. The increase in gas yield does not entirely determine the oil/gas production efficiency of oil-rich coal samples; analysis of specific component contents in the produced gases remains essential. As system temperature rises, the generation rates and proportions of different gas types exhibit significant variations: during low-temperature stages, pyrolysis reactions primarily involve cleavage of oxygen-containing functional groups like carboxyl and carbonyl groups, reactions accompanied by substantial CO2 production, this was confirmed in the work of Li et al. (2018). making CO2 the dominant gas component. With continued temperature increase, oxygen-containing functional groups gradually deplete, slowing CO2 generation. At this stage, cleavage of multiple functional groups coupled with prolonged high-temperature reactions triggers secondary reactions in organic matter, generating abundant CH4. Consequently, CO2 proportion rapidly declines while CH4 proportion surges. Upon further temperature rise, partial CH4 participates in secondary cracking reactions of tar within oil-rich coal, causing a minor rebound in CO2 and a corresponding decrease in CH4 proportion. C2 and C3 gases, as primary products from thermal cleavage of macromolecular structures like aliphatic alkyl side chains and bridging bonds in oil-rich coal, have their proportions mainly governed by macromolecular pyrolysis (Xu et al., 2025). This reaction process intensifies most severely within the 350 °C–400 °C range. Within this interval, rising temperature accelerates aliphatic structure fragmentation, increasing C2 and C3 generation. However, further temperature elevation causes C2 and C3 gases to crack into CH4 and semi-coke, thus reducing C2/C3 proportions while elevating CH4 proportion. When heating oil-rich coal to 600 °C, pyrolysis enters the semi-coke polycondensation stage where tar cracking completes (Wang et al., 2024d; Fu et al., 2023b). Dehydrogenation during polycondensation becomes dominant, producing H2. Additionally, since aliphatic fragmentation and aromatic sidechain cleavage primarily generate hydrocarbon gases and H2 (Wang et al., 2024e), CO shows no significant upward trend. Comprehensive analysis of gas component yields confirms that 550 °C–600 °C constitutes a critical phase for in-situ pyrolysis of lump oil-rich coal, characterized by rising CH4 and H2 yields, establishing it as the optimal temperature window for natural gas extraction.
Secondly, for liquid products: during lower temperature stages, organic matter in oil-rich coal undergoes incomplete decomposition (Zhou et al., 2018), producing predominantly higher molecular-weight oils, thus liquid products are dominated by residual oil. When temperature rises to 450 °C, macromolecular organics undergo cracking reactions releasing light oil components, causing discharged oil yield to increase gradually. With the completion of organic cracking reactions and further temperature elevation, secondary reactions of pyrolytic oils generate substantial gases (Xu et al., 2019) while reducing both discharged and residual oil yields–corresponding to the characteristics of pyrolytic gaseous products. Specific analysis of the components in the liquid phase products reveals that, as saturated hydrocarbons primarily originate from the cracking of aliphatic structures (Yang et al., 2023a), the cracking of aliphatic structures intensifies with increasing temperature; the aromatic hydrocarbon component is markedly more pronouncedly affected by temperature, which is due to the fact that aromatic hydrocarbons mainly originate from the cleavage of aromatic side chains and aromatic condensation reactions, and the natural content of aromatics in oil-rich coal is inherently high (Yu et al., 2023), with increasing temperature the cleavage of aromatic side chains and aromatic condensation reactions generate more aromatic oils, and this reaction is more intense in the residual oil; Furthermore, as asphaltenes primarily originate from the condensation reactions of large molecular organic compounds, the temperature range of 400 °C–500 °C promotes the rapid progression of this reaction and accelerates the cracking of asphaltenes into light oils or gases, therefore their content decreases more significantly within this interval; total hydrocarbon chromatographic analysis of the liquid phase products reveals that, as light oil components primarily originate from the cracking of aliphatic structures, with increasing temperature the cracking of aliphatic structures accelerates, generating more light components, while in the high-temperature range, due to prolonged sealed pyrolysis, partial components undergo secondary reactions, at this stage light components decompose, generating hydrocarbon gases, when the primary pyrolysis reaction of the oil-rich coal sample occurs, at this stage heavy components crack into light hydrocarbons through β-position bond scission reactions (Zhao et al., 2025), therefore the proportion of heavy oil decreases, and when the temperature rises to 600 °C, due to prolonged in-situ sealed pyrolysis reactions causing high-temperature recombination of small molecular radicals in the retained oil, combining to form large molecular asphaltenes, the heavy oil component increases again, at this stage the yields of both retained oil and discharged oil significantly decrease, substantial amounts of short-chain coal tar transform into hydrocarbon gases, while the heavy components, due to their better thermal stability, decompose more slowly, further promoting the increase in their proportion; comprehensive analysis can determine the temperature range of 450 °C–550 °C as the optimal temperature window for light oil recovery.
Thirdly, the solid phase products from in-situ pyrolysis are primarily the solid residues generated after oil-gas separation, with increasing temperature the aliphatic side chains, oxygen-containing functional groups, and weak bonds in the coal sample fracture, generating small-molecule gases and tar which escape, resulting in a reduction in the total mass of the char and a gradual increase in the TOC proportion, simultaneously the PC content decreases; furthermore with increasing temperature aliphatic carbon transforms into more stable aromatic structures through cyclization and dehydrogenation reactions (Wu and Zhang, 2019), forming graphitic microcrystals, enhancing the stability of the carbon skeleton, while after high-temperature pyrolysis the inorganic carbon further decomposes causing the TOC content to rise; when the temperature is raised to 400 °C, due to the aliphatic structures fracturing to generate tar and pyrolysis gas, PC participates as a reaction intermediate in radical recombination, therefore its content exhibits significant changes at 350 °C.
Through industrial scale simulation of the oil and gas production from oil-rich coal, the effects in practical engineering applications can be effectively simulated, and the optimal time and temperature for oil and gas production can be sought; according to the simulation results, the peak CH4 production from oil-rich coal pyrolysis occurs at 1,100 d, which is due to the fact that at this time the surface area of the high-temperature zone is the largest, after 1,100 d the pyrolysis of the oil-rich coal reservoir between the heaters is completed, and the growth rate of the high-temperature zone surface area slows down; this indicates that hydrogen generation requires high temperature for promotion, and its active period is short, the reason is similar to that of CH4, both being related to the propagation of the temperature field, which is consistent with the law obtained from the previous experimental findings, reflecting the characteristic that methane is continuously generated during the middle stage of pyrolysis and ultimately reaches its peak.
Overall, the yields of the three-phase products align with the experimental results, and prolonged sealed experiments can effectively simulate the underground in-situ pyrolysis environment; therefore, for practical applications aimed at oil production, it is recommended that the heating time be controlled within 500 days; while during long-term production processes, the gaseous products will become predominant, thus prolnged pyrolysis is beneficial for development and utilization targeting natural gas.
5 Conclusion
Through systematic analysis of the pyrolysis behavior of Xiegou oil-rich coal under long-term reaction at different temperatures, this study reveals the distribution laws and reaction mechanisms of pyrolysis products. The main conclusions are as follows:
1. Total pyrolytic gas yield increases significantly with temperature, with CH4 being the dominant component. CH4 proportion peaks at 550 °C while its yield peaks at 600 °C, establishing 550 °C–600 °C as the optimal temperature window for natural gas extraction.
2. For liquid pyrolysis products: discharged oil yield peaks at 450 °C, while residual oil yield decreases monotonically with temperature. Within the 450 °C–550 °C interval, discharged oil exhibits high saturates content, indicating this range as the potential temperature window for maximizing light oil recovery.
3. In solid pyrolysis products: TOC increases and PC decreases with rising temperature, demonstrating enhanced carbon skeleton stability of oil-rich coal during pyrolysis, facilitating oil/gas extraction and utilization.
4. Industrial scale simulations recommend a 500 days heating period for optimal oil production, extending to 1,900 days for optimal gas production.
This study provides a theoretical basis for the development of in-situ pyrolysis technology for oil-rich coal and is of great significance for promoting the efficient development of coal-based oil and gas resources.
Data availability statement
The original contributions presented in the study are included in the article/supplementary material, further inquiries can be directed to the corresponding author.
Author contributions
XL: Writing – original draft, Writing – review and editing. YT: Conceptualization, Writing – original draft. YL: Investigation, Writing – review and editing. FY: Software, Writing – review and editing. XW: Data curation, Writing – review and editing. JS: Data curation, Writing – review and editing. JC: Methodology, Writing – review and editing. QZ: Formal Analysis, Writing – review and editing. SY: Formal Analysis, Writing – review and editing. ZK: Supervision, Writing – review and editing.
Funding
The author(s) declare that financial support was received for the research and/or publication of this article. The Open Fund Project of CNOOC Key Laboratory of Liquefied Natural Gas and Low-Carbon Technology (KJQZ-2024-1105).
Conflict of interest
The authors declare that the research was conducted in the absence of any commercial or financial relationships that could be construed as a potential conflict of interest.
Generative AI statement
The author(s) declare that no Generative AI was used in the creation of this manuscript.
Any alternative text (alt text) provided alongside figures in this article has been generated by Frontiers with the support of artificial intelligence and reasonable efforts have been made to ensure accuracy, including review by the authors wherever possible. If you identify any issues, please contact us.
Publisher’s note
All claims expressed in this article are solely those of the authors and do not necessarily represent those of their affiliated organizations, or those of the publisher, the editors and the reviewers. Any product that may be evaluated in this article, or claim that may be made by its manufacturer, is not guaranteed or endorsed by the publisher.
References
Bhattacharyya, M., Shadangi, K. P., Purkayastha, R., Mahanta, P., and Mohanty, K. (2024). Co-pyrolysis of coal and biomass blends: impact of pyrolysis temperature and biomass blending on thermal stability of coal, and composition of pyrolysis products. Process Saf. Environ. Prot. 187, 1010–1021. doi:10.1016/j.psep.2024.05.037
Chen, H., Chen, Y., and Kou, J. (2024). Energy stable finite element approximations of gas flow in poroelastic media. Comput. Methods Appl. Mech. Eng. 428. doi:10.1016/j.cma.2024.117082
Chen, M., Wang, C., Yuan, T., Ning, X., Huang, X., Deng, L., et al. (2025a). Experimental investigation on gas-liquid–solid tri-phase product distributions during the simulated in-situ pyrolysis of tar-rich coal. Fuel 381, 133465. doi:10.1016/j.fuel.2024.133465
Chen, Z., Song, S., Zhang, W., and Mei, S. (2025b). Investigation of thermal-hydraulic-mechanical coupling model for in-situ transformation of oil shale considering pore structure and anisotropy. Eng. Geol. 344, 107859. doi:10.1016/j.enggeo.2024.107859
Dong, Z., Chen, Y., and Zhang, M. (2025). Production capacity prediction of U-shaped horizontal wells for in-situ pyrolysis of tar-rich coal: experimental and numerical simulation study. J. China Coal Soc. 50 (2), 1175–1191. doi:10.13225/j.cnki.jccs.2024.0340
Duan, Z., Wang, F., and Wang, Z. (2024). Pilot experiment for underground in-situ pyrolysis of tar-rich coal in the northern Shaanxi Province. Coal Geol. Explor. 52 (7), 14–24. doi:10.12363/issn.1001-1986.24.05.0362
Feng, Z., Zhou, D., Zhao, Y., and Cai, T. (2016). Study on microstructural changes of coal after methane adsorption. J. Nat. Gas. Sci. Eng. 30, 28–37. doi:10.1016/j.jngse.2016.01.044
Fu, D., Duan, Z., and Yang, F. (2023a). Key problems in in-situ pyrolysis of tar-rich coal drilling for extraction of coal-based oil and gas resources. J. China Coal Soc. 48 (4), 1759–1772. doi:10.13225/j.cnki.jccs.2022.0183
Fu, D., Yu, Z., Gao, K., Duan, Z., Wang, Z., Guo, W., et al. (2023b). Thermodynamic analysis on in situ underground pyrolysis of tar-rich coal: secondary reactions. ACS Omega 8 (14), 12805–12819. doi:10.1021/acsomega.2c08033
Guo, W., Li, Q., Deng, S. H., Wang, Y., and Zhu, C. F. (2023). Mechanism and reservoir simulation study of the autothermic pyrolysis in-situ conversion process for oil shale recovery. Pet. Sci. 20 (2), 1053–1067. doi:10.1016/j.petsci.2022.08.030
Ju, Y., Zhu, Y., Zhou, H. W., and Xie, H. (2021). Microwave pyrolysis and its applications to the in situ recovery and conversion of oil from tar-rich coal: an overview on fundamentals, methods, and challenges. Energy Rep. 7, 523–536. doi:10.1016/j.egyr.2021.01.021
Ju, Y., Zhu, Y., and Zhang, Y. (2022). Effects of high-power microwave irradiation on tar-rich coal for realising in situ pyrolysis, fragmentation, and low-carbon utilisation of tar-rich coal. Int. J. Rock Mech. Min. Sci., 157. doi:10.1016/j.ijrmms.2022.105165
Kang, Z., Zhao, Y., and Yang, D. (2020). Review of oil shale in-situ conversion technology. Appl. Energy 269, 115121. doi:10.1016/j.apenergy.2020.115121
Kou, J., Wang, X., Chen, H., and Sun, S. (2023). An energy stable, conservative and bounds-preserving numerical method for thermodynamically consistent modeling of incompressible two-phase flow in porous media with rock compressibility. Int. J. Numer. Meth Eng. 124 (11), 2589–2617. doi:10.1002/nme.7222
Krumm, R. L., Gneshin, K. W., and Deo, M. (2017). Adsorption characteristics of coals pyrolyzed at slow heating rates. Energy Fuels 31 (2), 1803–1810. doi:10.1021/acs.energyfuels.6b03116
Li, J., Li, Z., Yang, Y., and Wang, C. (2018). Study on oxidation and gas release of active sites after low-temperature pyrolysis of coal. Fuel 233, 237–246. doi:10.1016/j.fuel.2018.06.039
Ning, X., Huang, X., Xue, X., Wang, C., Deng, L., and Che, D. (2025). Experimental study on yield and quality of tar from tar-rich coal under the simulated in-situ conditions. J. Energy Inst. 118, 101912. doi:10.1016/j.joei.2024.101912
Tian, H., Zhang, R., and Wang, Q. (2024). Spatiotemporal distributions of typical contaminants from the in-situ pyrolysis of tar-rich coals. Coal Geol. Explor. 52 (7), 64–72. doi:10.12363/issn.1001-1986.24.01.0052
Wang, X., and Feng, Z. (2021). Thermal deformation of long flame coal under thermo-mechanical coupling. Coal Eng. 53 (06). doi:10.11799/ce202106026
Wang, G., Yang, D., Kang, Z., Zhao, J., and Lv, Y. (2019). Numerical investigation of the in situ oil shale pyrolysis process by superheated steam considering the anisotropy of the thermal, hydraulic, and mechanical characteristics of oil shale. Energy and Fuels 33 (12), 12236–12250. doi:10.1021/acs.energyfuels.9b02883
Wang, S., Shi, Q., and Wang, S. (2021). Resource property and exploitation concepts with green and low-carbon of tar-rich coal as coal-based oil and gas. J. China Coal Soc. 46 (5), 1365–1377. doi:10.13225/j.cnki.jccs.ST21.0860
Wang, S., Shi, Q., and Sun, Q. (2024a). Strategic value and scientific exploration of in-situ pyrolysis of tar-rich coals. Coal Geol. Explor. 52 (7), 1–13. doi:10.12363/issn.1001-1986.24.06.0412
Wang, M., Wang, C., and Ning, X. (2024b). Research progress of in-situ pyrolysis technology for tar-rich coal. J. China Coal Soc. 49 (9), 3969–3984. doi:10.13225/j.cnki.jccs.2023.0790
Wang, L., Zhang, R., Zhao, J., Yang, D., Kang, Z., et al. (2024c). Effect of long reaction distance on gas composition from organic-rich shale pyrolysis under high-temperature steam environment. Int. J. Coal Sci. and Technol. 11 (1), 34. doi:10.1007/s40789-024-00689-7
Wang, K., Guo, L., Zhai, X., Deng, J., and Li, Y. (2024d). Hydrogen abstraction reaction mechanism of oil-rich coal spontaneous combustion. Fuel 367, 131538. doi:10.1016/j.fuel.2024.131538
Wang, K., Ding, J., Deng, J., Zhai, X., and Zhang, Y. (2024e). Hydrogen generation mechanism of oil-rich coal oxidation in low temperature. Energy 293, 130739. doi:10.1016/j.energy.2024.130739
Wang, L., Wang, G., Yang, D., Zhao, J., Kang, Z., Zeng, Q., et al. (2025a). Research on the mechanical properties and anisotropy evolution of uniaxial compression of oil shale under real-time high-temperature steam. Rock Mech. Rock Eng. 58 (2), 1911–1932. doi:10.1007/s00603-024-04246-1
Wang, L., Wang, Z., Zhao, Y., Zhang, R., Yang, D., Kang, Z., et al. (2025b). Macroscopic seepage and microstructural behavior of oil shale using water vapor injection during mining. J. Rock Mech. Geotechnical Eng. 17 (3), 1489–1509. doi:10.1016/j.jrmge.2024.10.024
Wu, D., and Zhang, W. (2019). Evolution mechanism of macromolecular structure in coal during heat treatment: based on FTIR and XRD in situ analysis techniques. J. Spectrosc. 2019, 1–18. doi:10.1155/2019/5037836
Wu, H., Chen, Y., Lv, H., Xie, Q., and Gu, J. (2022). Stability analysis of rib pillars in highwall mining under dynamic and static loads in open-pit coal mine. Int. J. Coal Sci. Techn 9 (1), 38. doi:10.1007/s40789-022-00504-1
Xie, X., Zhao, Y., Qiu, P., Lin, D., Qian, J., Hou, H., et al. (2018). Investigation of the relationship between infrared structure and pyrolysis reactivity of coals with different ranks. Fuel 216, 521–530. doi:10.1016/j.fuel.2017.12.049
Xu, F., Liu, H., Wang, Q., Pan, S., Zhao, D., Liu, Q., et al. (2019). ReaxFF-based molecular dynamics simulation of the initial pyrolysis mechanism of lignite. Fuel Process. Technol. 195, 106147. doi:10.1016/j.fuproc.2019.106147
Xu, T., Chen, L., Chen, J., Lei, Y., Wang, X., Yang, X., et al. (2025). Characteristics of pyrolysis products of tar-rich coal under cryogenic pretreatment with liquid nitrogen. Processes 13, 1064. doi:10.3390/pr13041064
Yang, D., Wang, L., Zhao, Y., and Kang, Z. (2021). Investigating pilot test of oil shale pyrolysis and oil and gas upgrading by water vapor injection. J. Pet. Sci. Eng. 196, 108101. doi:10.1016/j.petrol.2020.108101
Yang, F., Gao, K., Yu, Z., Ma, L., Cao, H., Yang, P., et al. (2023a). Thermodynamic analysis of in situ underground pyrolysis of tar-rich coal: primary reactions. Acs Omega 8 (21), 18915–18929. doi:10.1021/acsomega.3c01321
Yang, F., Cheng, X., Li, M., Wei, J., Duan, Z., and Ma, L. (2023b). Numerical investigation of the heat and mass transfer during the in situ pyrolysis process of oil-rich coal. Processes 11 (11), 3226. doi:10.3390/pr11113226
Ye, Q., Li, M., Hao, J., Huang, Z., and Wei, J. (2023). Multi-physics simulation of tar-rich coal in situ pyrolysis with a multiregion homogenization treatment. ACS Omega 8 (36), 32565–32579. doi:10.1021/acsomega.3c01481
Yu, Z., Guo, W., Yang, P., Zhang, J., Gao, K., Shang, J., et al. (2023). In-situ infrared and kinetic characteristics analysis on pyrolysis of tar-rich coal and macerals. Fuel 348, 128601. doi:10.1016/j.fuel.2023.128601
Yu, G., Bai, X., Fan, X., He, X. Y., Zou, H. X., Dilixiati, Y., et al. (2024a). In-situ evaluation of volatile products released during pyrolysis of coals with different ranks. J. Energy Inst. 115, 101660. doi:10.1016/j.joei.2024.101660
Yu, Z., Guo, W., Yang, P., Yang, F., Ma, L., Wang, J., et al. (2024b). Kinetic characteristics and product distribution of tar-rich coal in-situ underground pyrolysis: influence of heterogeneous coal seam. J. Anal. Appl. Pyrolysis. 183, 106729. doi:10.1016/j.jaap.2024.106729
Yuan, T., Wang, C. A., Chen, M., Yang, F., Hou, Y., Ma, L., et al. (2025). Simulation investigation on separation characteristics of gas-liquid model products from in-situ pyrolysis of tar-rich coal. J. Environ. Chem. Eng. 13 (2), 115719. doi:10.1016/j.jece.2025.115719
Zhang, Z., Zhou, A., Shi, Z., Zhang, H., He, X., Wang, Y., et al. (2025). Explaining relationships between chemical structure and tar-rich coal pyrolysis products yield based on pearson correlation coefficient. Fuel 395, 135029. doi:10.1016/j.fuel.2025.135029
Zhao, J., Shi, Q., and Wang, S. (2025). Study on molecular structural heterogeneity of tar-rich coal based on micro-FTIR. Spectrochim. Acta A, 330. doi:10.1016/j.saa.2025.125749
Keywords: in-situ pyrolysis, three-phase products, oil-rich coal, closed system, numerical simulation
Citation: Li X, Tang Y, Li Y, Yang F, Wu X, Sun J, Cui J, Zhang Q, Yuan S and Kang Z (2025) Study on pyrolysis characteristics of oil-rich coal under in-situ conditions and industrial-scale extraction simulation. Front. Earth Sci. 13:1671000. doi: 10.3389/feart.2025.1671000
Received: 22 July 2025; Accepted: 14 August 2025;
Published: 29 August 2025.
Edited by:
Qingchao Li, Henan Polytechnic University, ChinaReviewed by:
Wei Li, Northeast Petroleum University, ChinaSunhua Deng, Jilin University of the Arts, China
Yulin Ma, Liaoning Technical University, China
Copyright © 2025 Li, Tang, Li, Yang, Wu, Sun, Cui, Zhang, Yuan and Kang. This is an open-access article distributed under the terms of the Creative Commons Attribution License (CC BY). The use, distribution or reproduction in other forums is permitted, provided the original author(s) and the copyright owner(s) are credited and that the original publication in this journal is cited, in accordance with accepted academic practice. No use, distribution or reproduction is permitted which does not comply with these terms.
*Correspondence: Xiao Li, MjAyMzMxMDI2NUBsaW5rLnR5dXQuZWR1LmNu, eGlhb2xpNkBjbm9vYy5jb20uY24=