 Mingtao Liu
 Ruihui Hao
 Bing Leng
 Xiangyu Meng
 Guoyu Wang
 Zhaohe Pang
 Yaojin Zhang
- 1Oil Production Technology Research Institute, Liaohe Oilfield Branch, Petrochina, Panjin, China
- 2School of Petroleum and Natural Gas Engineering, Changzhou University, Changzhou, China
- 3Innovation Alliance of Petrochina, Changzhou University, Changzhou, China
Introduction: With the global energy demand on the rise, natural gas plays a crucial role as a clean and efficient energy source. However, wellbore liquid loading has become a key constraint on the stable production of gas fields in their mid-to-late stages—specifically, it affects approximately 40% of the gas wells in the Liaohe Oilfield, leading to productivity declines or even well shut-ins. Foam Assisted Lift (FAL) is a mainstream technical solution to mitigate wellbore liquid loading due to its low cost and strong adaptability. Nevertheless, FAL is plagued by crude design of dosing parameters in practical applications, which either causes unnecessary chemical waste (from overdosing) or results in operational failure (from underdosing), limiting its efficiency and economic viability.
Methods: This study focused on three typical gas wells (Well Y-1, Y-2, and Y-3) with distinct liquid loading and FAL application statuses: Well Y-1 did not adopt foam drainage technology; Well Y-2 achieved good liquid production after FAL application but suffered from excessive foam drainage agent injection; Well Y-3 used FAL but failed to meet the expected foam drainage target. To address the limitations of traditional FAL parameter design, this research innovatively treated foam as a special type of liquid to align with existing wellbore pressure (e.g., Beggs-Brill method) and temperature distribution models. On this basis, three core technical components were developed: 1) a segmented liquid loading calculation model based on the casing-tubing pressure difference; 2) a comprehensive dosing parameter optimization system covering initial dosage, daily replenishment amount, and injection cycle; and 3) validation of critical liquid-carrying velocity models (including the Turner model, Li Min model, and Wang Yizhong model) to screen the most applicable one for foam systems.
Results: The optimized FAL scheme yielded significant performance improvements and cost reductions. In terms of liquid-carrying capacity: Well Y-1 (previously without FAL) saw a 26.89% enhancement, and Well Y-3 (with underperforming FAL) saw a 22.64% enhancement. In terms of cost control: the daily dosing amount for Well Y-2 was reduced to 32.3% of the original dosage, and the FAL operation cycle for Well Y-3 was extended from 6 days to 17 days, reducing both chemical consumption and operational frequency. Additional key findings include: 1) the Wang Yizhong model was confirmed to have high engineering applicability for predicting foam liquid-carrying capacity, outperforming the Turner and Li Min models; 2) the SP-7 foaming agent exhibited better foaming and liquid-carrying performance under low-salinity conditions; and 3) concentration of the foaming agent, gas flow rate, and wellbore temperature were identified as key factors significantly influencing the efficacy of SP-7.
Discussion: This research addresses the core problem of crude dosing parameter design in traditional FAL technology by integrating a segmented liquid loading calculation model and a targeted parameter optimization system. The confirmation of the Wang Yizhong model’s applicability provides a reliable theoretical tool for foam liquid-carrying prediction, while the insights into SP-7’s performance under different conditions offer practical guidance for foaming agent selection in field operations. Overall, this study establishes a technical foundation for efficient, cost-effective foam drainage in liquid-loading gas wells, particularly those in mid-to-late-stage gas fields like the Liaohe Oilfield, and provides a reference for solving similar liquid loading challenges in other gas-producing regions.
1 Introduction
Amid the continuously rising global energy demand, natural gas has become an increasingly prominent clean and efficient energy source. In China, gas field development has progressively entered the middle and late stages. With the depletion of reservoir energy, liquid loading in the wellbore has become a key factor constraining stable production in gas wells. Statistics indicate that approximately 40% of gas wells in the Liaohe Oilfield currently experience varying degrees of liquid loading, leading to productivity declines or even well shut-ins. Foam Assisted Lift (FAL) technology, leveraging its advantages of low cost and strong adaptability, has become one of the mainstream methods for mitigating wellbore liquid loading. However, a prevalent issue in current field applications is the crude design of foam drainage agent injection parameters, resulting in either resource waste due to overdosing or liquid-carrying failure due to underdosing.
At present, wellbore liquid loading has become the core issue restricting gas well productivity (Zhang et al., 2019). In essence, it is caused by the insufficient liquid-carrying capacity of gas wells, leading to liquids remaining in the wellbore in the form of droplets or liquid films (Tugan, 2020). Studies have shown that the liquid loading mechanism is not caused by a single liquid factor but results from the coupled interaction between the formation and wellbore. Transient disturbances in gas wells (such as well opening/closing and production fluctuations) can disrupt gas-liquid equilibrium, promoting the formation of dynamic liquid levels, which is related to the basic laws of gas-liquid two-phase pipe flow (Pagou A. L. H. et al., 2020; Pagou A. L. et al., 2020; Liu et al., 2011). For both conventional low-permeability gas reservoirs (permeability 0.01–0.1 mD) and unconventional shale gas wells, productivity decline, wellbore blockage, and reservoir damage caused by liquid loading are widespread (Albiter et al., 2025; Elyasa et al., 2024).
Taking development blocks such as China’s Liaohe Oilfield and Sulige Gas Field as examples, the liquid loading phenomenon is particularly pronounced. Statistics show that approximately 40% of gas wells in the Liaohe Oilfield suffer from productivity decline due to wellbore liquid loading, and some wells are even forced to shut in due to excessive liquid column backpressure (Minyan et al., 2010). In shale gas horizontal wells, the complex wellbore trajectory leads to the attenuation of liquid carrying energy, with liquid loading in the horizontal section accounting for up to 60% (Brito et al., 2017). Additionally, if liquid is not timely discharged after fracturing tight gas wells, it may trigger deterioration of reservoir physical properties, causing irreversible productivity loss (Bahrami et al., 2012).
In low-production gas wells, low gas flow velocity and weak liquid carrying capacity can easily form a liquid column at the bottomhole, which can kill the well in severe cases (Fadili and Shah, 2016). In deviated and horizontal wells, the well deviation angle alters gas-liquid distribution. The critical flow velocity for liquid carrying is maximum in the build-up section (30°–60°), and the critical flow rate in the horizontal section is significantly lower than in the vertical section, making it a high-incidence area for liquid loading (Abhulimen et al., 2023). For high-pressure gas wells, the maximum critical flow rate tends to appear near the wellhead, while for low-pressure gas wells, it concentrates at the bottomhole. Furthermore, even if the gas well production exceeds the minimum critical liquid carrying flow rate, there still exists a maximum critical liquid carrying capacity, which increases with the decrease of wellhead pressure and decreases with the increase of pipe diameter. This means that gas wells with higher production may still experience liquid loading due to excessive liquid carrying volume, exacerbating the difficulty of liquid loading prediction and control (Eromoses et al., 2022; Sankar and Karthi, 2019; Peng et al., 2024).
To tackle this challenge, Foam Assisted Lift (FAL) technology has become the mainstream process due to its high efficiency and economic viability. Research on this technology began overseas in the 1950s, with gas fields in Oklahoma, United States, achieving an application success rate of over 90%. In China, the first experiment was conducted in the Yumen Oilfield in 1965 (Fadili and Shah, 2016). In the field of low-permeability gas reservoirs, the Sulige Gas Field initially focused on laboratory screening of foam drainage agents and the calculation of critical liquid carrying flow rates for low-pressure and low-yield gas wells with liquid loading issues. However, neglecting key factors such as the injection mode and timing led to limited process success rates (El, 2023; Veeken et al., 2017; Amani and Firouzi, 2023). An optimized injection mode of “small amounts multiple times, fixed casing-tubing pressure difference” was established via in-depth analysis of the matching relationship between process parameters and gas well production characteristics. This mode reduced the foam drainage agent dosage per well by 38% and the number of construction operations by 23%, effectively improving the stable production effect (Tayyab et al., 2014; Tavakkoli et al., 2021; Bonafé et al., 2020; Nasab et al., 2024). For the Longfengshan Condensate Gas Reservoir, which suffered from foam drainage agent defoaming when encountering oil, an oil-resistant system combining “F-C bond + nanoparticles” was adopted. This system solved the issues of crude oil emulsification and residual foam pollution. Field application in 98 wells yielded an accumulated additional gas production of 30.637 × 10⁶ m3 and an input-output ratio of 1:4.7 (Wang et al., 2018). In the development of shale gas horizontal wells, the Fuling Shale Gas Field established a comprehensive evaluation system, including key indicators such as drainage capacity and production increase capacity. Combined with a rapid evaluation procedure, dynamic optimization of foam drainage effects was achieved. The field application compliance rate for 182 well operations reached 92%, and the program optimization success rate was 96% (Xusen and Chun, 2024). However, the Zhongjiang Gas Field, with high condensate oil content, still faces the problem of bottom-hole emulsification. By optimizing oil-resistant foam drainage agents and emulsifying re-foaming agents, and establishing a liquid loading prediction and parameter calculation method, a targeted process technology was formed (Xin, 2021). For the challenge of restoring high-sulfur flooded wells in the Yuanba Gas Field, the “Nitrogen Injection with Water Accompaniment + foam drainage” process was developed, accompanied by the research and development of high-temperature sulfur-resistant foam drainage agents. This was successfully applied to field wells such as YB29-1, achieving the emptying of wellbore liquid loading (Huang et al., 2023). The Chuanxi Gas Field constructed an economic and technical evaluation system using the entropy weight method, identifying that indicators such as gas production and financial internal rate of return significantly impact process effects, and proposing countermeasures for optimizing production plans and technological innovation (Guo et al., 2024). For low-pressure and low-yield wells, the middle-shallow gas reservoir in Chuanxi divided the intervention timing of conventional foam drainage and low-surface tension foam drainage, formulating a classified maintenance system for intermittent and continuous water production. This increased the foam drainage efficiency from 81.7% to 93.7% (Jiang et al., 2021). In cluster well development, the automated foam drainage process has achieved technical breakthroughs in continuous foam drainage and sufficient defoaming through optimized dosing parameters (Nobakht et al., 2012; Oyindamola et al., 2022; Kruglyakov et al., 2008; Al-Ahmadi et al., 2010; Lidan et al., 2023).
In terms of new foam drainage agents, researchers used Gemini foaming agents as the main component, added grafted nanoparticles as foam stabilizers, and combined them with characteristic additives. This successfully led to the development of two types and six subtypes of nanoparticle foaming agents suitable for major gas fields in China. These new foaming agents exhibit excellent performance. Their CO2 resistance reaches 100%, and their condensate resistance is 40%. Compared with traditional foaming agents, the average gas flow rate of each gas well increases by 62.48%, the pressure difference decreases by 18.9%, and the cost is reduced by 45%, significantly achieving cost reduction and efficiency improvement. Currently, the process is shifting from “experience-driven” to “data-driven” (Singh and Mohanty, 2017; Xiong et al., 2019). Despite these advancements, process bottlenecks in complex well conditions remain prominent. For example, in parts of the Sulige Gas Field with high liquid-gas ratios, the foam drainage efficiency is relatively low, requiring integration with processes such as plunger gas lift to narrow the application scope (Schmid and Geiger, 2013). In the later stages of deep coalbed methane wells in Yanchuannan, the problems of low liquid production and coal powder interference have been encountered. The feasibility of cost reduction was verified by combining optimized string selection with foam drainage technology (Darabi et al., 2012). In theoretical research, there are still deviations in the liquid loading prediction models for gas wells, necessitating the integration of formation-wellbore coupling experiments to reveal the multi-factor control mechanism (Fu et al., 2015; Q. Y. et al., 2023). The calculation of critical liquid carrying values for deviated and horizontal wells needs to consider the influence of liquid droplet deformation and well deviation angle, with the build-up section (30°–60°) becoming the focus of liquid loading judgment (Kanta et al., 2025). Currently, the foam drainage process system is transitioning from “experience-driven” to “data-driven.” Through refined parameter design, the development of functional foam drainage agents with oil and sulfur resistance, and multi-process collaboration, the applicability to complex gas reservoirs is continuously improving. However, further breakthroughs are still needed in process integration and long-term effectiveness for gas wells with high sulfur content, ultra-high temperatures, and strong heterogeneity.
The theoretical research on the critical liquid carrying flow rate of gas wells began in the 1960s. In 1969, Turner established the classic liquid droplet model, deriving the critical velocity formula by assuming liquid droplets as rigid spheres, which became the core engineering tool in the early stage. However, it overestimates the critical value in low-pressure gas wells. In 2001, the Li Min team proposed the MinLI model, where the critical velocity is 20%–30% lower than the Turner formula, and field cases in the Sichuan Gas Field verified an error of less than 8% (Min et al., 2001). In 2007, Wang Yizhong et al. proposed the spherical-cap liquid droplet model, reducing the prediction error in the Daqing Oilfield from 12% to 7% (Yi-zhong and Qing-wen, 2007). In the same year, Westende et al. revealed the regulation mechanism of liquid droplets on liquid film instability through experiments, laying the foundation for multiphase flow modeling (van ’t Westende et al., 2007). In 2010, the Xiao Gaomian team proposed a piecewise calculation method, improving the prediction accuracy by 15% in the Fuling Shale Gas Field (Gao-mian et al., 2010). Since 2012, a number of deviated well experiments have quantified the effect of well deviation angle, but the prediction deviation in high-deviation wells reaches 40% (Sarica et al., 2023; Guner et al., 2015). In 2012, Wang Zhibin constructed the Ck-Wecrit model, controlling the theoretical error within 6% in the Daniudi Gas Field (Wang, 2012). In 2018, Skopich et al. experimentally revealed the limitations of Turner-type models in high Reynolds number flow regimes (Darabi et al., 2012; He et al., 2021; Skopich et al., 2015). In recent years, Wang Yuejie et al. proposed a deviated well model with an accuracy rate increased to 94.6% (Wang and Zhang, 2022). In 2024, Huang Quanhua et al. determined that a pipe deviation angle of 46° is the extreme point of liquid carrying resistance (Zhijian et al., 2024; Huang et al., 2024). However, existing models have not clarified the critical liquid carrying characteristics of foam (Teng et al., 2025; Wang et al., 2025; Zhengzheng et al., 2025; Du et al., 2024).
Currently, the foam drainage agent injection process faces two common challenges. Firstly, the inability to acquire real-time downhole liquid loading information before foam drainage agent injection makes it difficult to determine the optimal dosing timing; secondly, since the agent is injected from the wellhead, it tends to float on the liquid surface or fail to reach the designated location, thus preventing adequate mixing with the bottomhole liquid loading. These issues lead to the following consequences. 1) If the bottom-hole liquid loading increases rapidly and foam drainage agent injection is not timely, it may cause the gas well to be flooded quickly; 2) If the bottom-hole liquid loading is low, excessive foam drainage agent injection not only causes waste of foam drainage agents, but the excess foam drainage agents also become part of the liquid loading, increasing the drainage burden; 3) The foam drainage agent concentration at the bottom of the liquid loading is too low, resulting in insufficient foam generation and the inability to drain liquid fully. Therefore, timely foam drainage agent injection and shutdown, based on downhole liquid loading information, while ensuring sufficient mixing of the foam drainage agent with the liquid loading, are the keys to the success of foam drainage.
This study takes three typical gas wells, Y-1, Y-2, and Y-3, as research objects, systematically analyzing their wellbore structure parameters and production dynamic data. Innovatively, foam is regarded as a special liquid phase, and the distribution of gas and foam is transformed into the gas-liquid distribution characteristics of gas and special liquid phase, meeting the application conditions of wellbore pressure (Beggs-Brill method) and temperature distribution (Ramey wellbore heat transfer model) calculation models. By establishing a segmented calculation model of wellbore liquid loading based on casing-tubing pressure difference, and combining the physico-foam drainage agent parameters of foam fluid determined in the laboratory, a three-dimensional parameter optimization system including initial dosage of foam drainage agent, daily replenishment amount, and foam drainage agent injection cycle is constructed. Parameters such as the density and viscosity of natural gas and mixed liquid in the wellbore fluid, the compression factor of natural gas, the volume flow rate of natural gas, and the volume flow rate of liquid are calculated. The temperature and pressure distribution in the foam drainage gas well are calculated to clarify the bottom-hole flowing pressure, and finally, the foam flow pattern in the wellbore under different foam drainage agent injection systems is determined. The study focuses on discussing the influence laws of key factors such as foaming volume and surface tension on the critical liquid carrying velocity. By comparing the prediction results of classic models such as Turner and Li Min, the engineering applicability of the Wang Yizhong model in foam liquid carrying prediction is verified.
2 Methodology
2.1 Calculation of gas-liquid parameters for foam drainage wells
Foam is regarded as a special liquid phase, whose density is determined by the gas contained within the foam and the foam drainage liquid. The proportions of the total gas volume and liquid volume in the foam can be determined by the foaming volume measured in the laboratory. According to the Class III foaming volume standard specified in SY/T 7494-2020 Experimental Evaluation Method for Foaming Agents Used in Oil and Gas Fields and Q/SY 17815-2021 Technical Specification for Foaming Agents Used in Drainage Gas Recovery, the foaming volume of 200 mL of a foaming liquid with a 0.5% concentration shall be ≥750 mL. The proportion of the total gas volume in the foam is given by Equations 1, 2.
The gas-liquid surface tension σ is determined through experiments and is approximately regarded as a constant. Generally, the measured value of the standard foaming liquid is slightly lower than 30 mN/m.
The density and viscosity of the foaming liquid are determined in the laboratory and are approximately regarded as constants. Therefore, the liquid viscosity is given by Equation 3.
Where,
xg—Proportion of the total gas volume in the foam, decimal;
Vp—Foaming volume, m3;
Vlp—Foaming liquid volume, m3;
μl—Liquid viscosity, Pa·s;
μg—Gas viscosity, Pa·s;
μlp—Viscosity of foaming liquid, Pa·s.
1. During the process of foam being transported from the bottom of the well to the wellhead, the foam volume remains in a state of dynamic equilibrium, where the volume of gas released by foam breaking is equal to the volume of free gas consumed in generating new foam.
2. As a stable gas-liquid mixture in the wellbore, foam is regarded as a special liquid phase and thus forms a special gas-liquid two-phase flow with free gas.
Given the temperature and pressure, the empirical formula for calculating the gas compressibility factor is given by Equations 4–11.
The gas density can be expressed as,
The gas viscosity can be expressed as,
2.2 Calculation of initial dosage of foam drainage agent
The product of the initial bottom-hole liquid loading and the foam drainage agent concentration is the initial dosage of the foam drainage agent. By determining the bottom-hole liquid loading, the initial dosage of the foam drainage agent can be calculated.
The target liquid loading is obtained by first calculating the relevant wellbore liquid loading depth and then multiplying this depth by the pipe cross-sectional area. Bottom-hole liquid loading can be calculated in three sections from top to bottom, the section from the tubing liquid level to the casing-tubing annulus liquid level, the section from the casing-tubing annulus liquid level to the bottom of the tubing, and the section from the bottom of the tubing to the middle depth of the gas layer.
If the annulus liquid level depth is unknown, the target liquid loading can be estimated using the casing-tubing pressure difference. Using this pressure difference, the length of the section from the tubing liquid level to the casing-tubing annulus liquid level can be calculated; multiplying this length by the tubing cross-sectional area yields the liquid volume of this section. Further multiplying this volume by an appropriate conversion coefficient gives the total liquid volume, which includes both the section from the tubing liquid level to the casing-tubing annulus liquid level and the section from the casing-tubing annulus liquid level to the bottom of the tubing. The liquid volume of the section from the bottom of the tubing to the middle depth of the gas layer can be directly calculated from wellbore structure parameters (tubing bottom depth, gas layer middle depth, and casing diameter).
If the annulus liquid level depth has been measured, the length from the annulus liquid level to the bottom of the tubing can be determined; multiplying this length by the annulus cross-sectional area gives the liquid volume of the section from the casing-tubing annulus liquid level to the bottom of the tubing. By combining this volume with the liquid volume of the section from the tubing liquid level to the casing-tubing annulus liquid level and that of the section from the bottom of the tubing to the middle depth of the gas layer, the total liquid volume is obtained.
The section from the annulus liquid level depth to the tubing shoe liquid level is selectively ignored; instead, only the tubing liquid column above the annulus liquid level and the liquid column below the tubing shoe are calculated, so a conversion value η is added to the tubing liquid column. The formula for estimating wellbore liquid loading based on the casing-tubing pressure difference is as follows. See Equation 12 for details.
If the annulus liquid level depth ha has been measured, the wellbore liquid loading formula is as follows. See Equation 13 for details.
Therefore, the dosage of foam drainage agent is given by Equation 14.
Where,
η—Conversion coefficient, dimensionless, reference value 1.2;
Based on field data, the conversion factor η = 1.2 was determined via calibration against multiple typical gas wells with known liquid loading volumes in the study area. For vertical wells with an inner tubing diameter of 50.8–73 mm and an inner casing diameter of 139.7 mm, measured liquid loading volumes were compared with values calculated using Equation 4. Following optimization to minimize errors, η = 1.2 was derived; under this condition, the average error between the calculated and measured liquid loading volumes was constrained to within 5%.
It should be noted that for directional wells, the pay zone mid-depth, tubing shoe depth, annulus liquid level depth, as well as
2.3 Calculation of daily dosage of foam drainage agent and foam drainage agent injection cycle for foam drainage wells
Based on the total liquid volume, liquid production rate, and initial foam drainage agent concentration, the concentration of the foam drainage agent in the liquid loading on the nth day can be calculated. When this concentration is less than 0.3%, it is determined that replenishment of the foam drainage agent is required. Using the concentration of the foam drainage agent in the liquid loading on the nth day, the difference from the initial foam drainage agent content in the liquid loading can be derived, allowing calculation of the supplementary dosage of the foam drainage agent.
Following injection of the foam drainage agent, if gas and liquid production remain stable, this indicates that the daily liquid volume produced from the well bottom (including foaming liquid) is equal to the liquid volume replenished from the reservoir to the well bottom (excluding foaming liquid). From day 1 to day n, the liquid loading concentrations at the well bottom are
Therefore, the liquid loading concentration in the wellbore following n days of production is given by Equation 15.
If the concentration on the nth day is less than 0.3%, it is recommended to conduct the next foam drainage agent supplementation. The cycle interval is defined as n-1 day. Following the re-supplementation of foam drainage agent, the bottom-hole liquid loading concentration returns to 0.5%, and the required dosage of foam drainage agent is given by Equation 16.
1) Initial dosage. It refers to a one-time injection volume calculated from the initial bottom-hole liquid loading, aimed at rapidly increasing the foam drainage agent concentration to 0.5%,
2) Injection cycle. It refers to the number of days between two supplementary injections, which is determined by the time required for the foam drainage agent concentration to decrease to 0.3%. This cycle exhibits a positive correlation with the gas well’s daily liquid production, a higher daily liquid production results in a shorter cycle.
3) Daily supplementary dosage. Calculated as the ratio of the total supplementary volume within a cycle to the number of days in the cycle, its value is jointly determined by the injection cycle length and the foam drainage agent’s concentration decay rate.
On-site well examples were illustrated as follows.
For high liquid production wells (e.g., Well Y-1, with a daily liquid production of 2.936 m3/d). Owing to the high liquid discharge rate, the foam drainage agent concentration droped to below 0.3% within 1 day. Thus, the injection cycle was set to 1 day, and the daily supplementary dosage must reach 14.68 kg to maintain the effective concentration.
For low liquid production wells (e.g., Well Y-3, with a daily liquid production of 0.106 m3/d). The foam drainage agent concentration decreased slowly, so the injection cycle was extended to 17 days. By allocating the total supplementary volume across the cycle, only 7.12 kg of the agent was required daily.
Where
n—Foam drainage agent injection cycle, days;
2.4 Calculation of critical liquid carrying velocity for foam drainage wells
As a special liquid phase, foam exhibits prominent deformation characteristics under the action of pressure differences. By selecting an appropriate critical liquid-carrying velocity model, the corresponding critical liquid-carrying velocity can be calculated using gas-liquid interfacial tension, foam density, and gas phase density.
The Wang Yizhong model (van ’t Westende et al., 2007), Turner model, and Li Min model (Min et al., 2002) are given respectively as follows, with details shown in Equations 17–19.
Substituting 1-2 into the equations gives, with details shown in Equations 20–22.
Where,
The Turner model assumes that liquid droplets are rigid spheres and ignores the deformability of liquid droplets in foam systems. However, as a special gas-liquid mixed dispersed system, foam has thin liquid films that are prone to deformation under the shear force of gas flow, and the actual liquid droplets are closer to a “spherical cap shape” (flat shape) (Wang et al., 2015). Although the Li Min model modifies the rigidity assumption of the Turner model, it still fails to fully consider the surface tension gradient of foam droplets and the gas core encapsulation effect. The Wang Yizhong model considers the liquid droplet as a spherical cap, and the degree of liquid droplet deformation is higher than that in the Turner model and Li Min model. In recent years, many scholars continue to cite this model, which fully proves its sustained influence and value in the academic community (Sun et al., 2023; Gowida et al., 2024). These citations not only indicate that the Wang Yizhong model remains an important foundation for research in this field to this day. Therefore, it is recommended to use the Wang Yizhong model.
It should be noted that
2.5 Calculation of bottom-hole flowing pressure and acquisition of foam flow pattern for foam drainage wells
To facilitate the output of parameters at each wellbore position, the wellbore is divided into N sections from the wellhead to the well bottom, and coordinates are assigned. Starting from the first section, the unknown end pressure of each section is solved using the known end pressure, and this process is repeated until the last section is calculated.
The specific process of solving for the temperature and pressure of each section is as follows.
Assume the unknown end pressure, then obtain the temperature of this section via the temperature distribution calculation module. Using the known end pressure and unknown end pressure, obtain the average pressure of this section, then calculate the physical property parameters via the gas-liquid parameter calculation module. Via the pressure distribution calculation module, obtain the calculated value of the unknown end pressure and compare it with the assumed value. If the error exceeds the allowable value, use the calculated value of the unknown end pressure as the new assumed pressure value, and repeat the above calculation until the error meets the requirements. The unknown end pressure is then obtained.
1. Calculate the total number of segments
Segmentation is performed according to the total length of the wellbore flow channel and the depth calculation step size with details shown in Equations 23–32.
When the total length of the wellbore flow channel is exactly divisible by the depth calculation step size (the step size can be 10–50 m).
When the total length of the pipeline cannot be divisible by the depth calculation step.
Assign length coordinates to each pipeline section.
Use the following formula to assign coordinates to each section in the pipeline.
Where i = 1, 2, 3.N-1.
2. Assign coordinates to the last section
The pressure distribution from the first section to the last section is calculated iteratively.
3. The average pressure of each section of the wellbore flow channel is calculated.
① The lower end pressure is assumed to be,
② The average pressure of this section is calculated as,
4. The average temperature of each section of the wellbore flow channel is calculated
① The fluid temperature Tdown at the current lower end depth of the wellbore flow channel is calculated using the Ramey wellbore heat transfer model, based on the upper end temperature Tup of the wellbore flow channel.
② The average temperature of this section is calculated as,
5. The physical property parameters under the current pressure and temperature are calculated
The gas density
6. According to the Beggs-Brill method, the pressure gradient is solved.
7. The pressure drop in the pipeline is calculated based on the pipe section length and pressure gradient.
The pressure drop of the current pipe section is,
8. The lower end pressure of this pipe section is calculated.
The calculated value of the lower end pressure for this pipe section is,
9. The calculated value of the lower end pressure is checked
If
Otherwise, let
10. The upper end pressure of the first section is the wellhead tubing pressure pc. The upper end pressure of the next section is set equal to the lower end pressure of the current section,
The segmented liquid loading calculation model based on casing pressure difference established in this study has certain limitations in terms of applicability, especially for low-yield gas wells with a liquid production of <0.1 m3/d. In such wells, due to the extremely low liquid production rate, the casing pressure difference is usually very small (even close to zero), which greatly reduces the accuracy of liquid loading estimation using this model. In low-yield wells, minor measurement errors or transient fluctuations in gas flow rate may be amplified, leading to deviations in the estimated liquid loading depth and segmented volume. This further affects the rationality of key parameters designed based on the model, such as the initial dosage and supplementary cycle of foam drainage agents. Therefore, when applying this model to gas wells with a liquid production of <0.1 m3/d, adjustments can be made to the conversion coefficient η in Formula 4 according to on-site actual conditions (e.g., appropriately reducing η to avoid overestimation); meanwhile, on-site calibration of the model results can be conducted using actual liquid drainage data to ensure the reliability of foam drainage parameter design.
At this point, the temperature and pressure distribution in the entire wellbore can be obtained, and the foam flow pattern at different wellbore positions can then be determined based on the Beggs-Brill method.
3 Results and discussion
3.1 Case study
To determine the appropriate drainage mode and extract key string structure parameters for Y-1, Y-2, and Y-3 wells based on their recent gas production, liquid production, and casing-tubing pressure difference, a systematic approach integrating empirical models, field data calibration, and advanced multiphase flow analysis is proposed. Below is the optimized methodology.
3.1.1 Basic conditions
3.1.1.1 Basic production well information
According to Tables 1, 2 Well Y-1 originally adopted gas lift for production, characterized by high operational costs and a gas injection rate of less than 3,000 m3/d. This well is determined to have a low degree of liquid loading and high production, indicating sufficient reservoir energy and favorable gas-liquid supply capacity—these conditions provide a solid basis for switching to a foaming process (via injecting low-cost foaming agent into the wellbore).
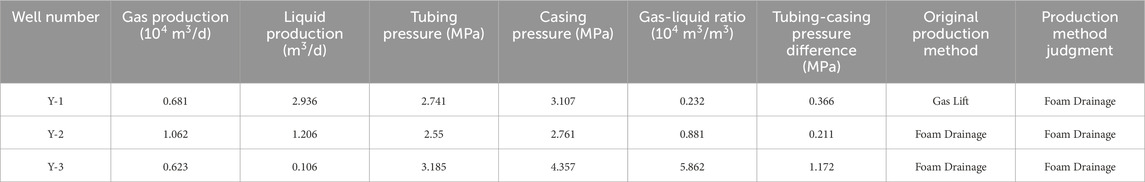
Table 1. Determination of drainage modes for each well.
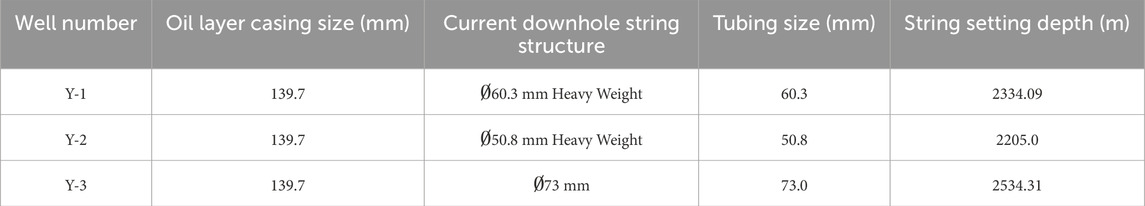
Table 2. Well structure parameter design.
Well Y-2 is a foam drainage well, with a daily foam drainage agent injection rate of 30 L (approximately 30 kg), leading to high operational costs. It is determined that this well also has a low degree of liquid loading and high production, alongside good gas supply and liquid drainage capabilities, making it suitable for the foam drainage production mode. However, the high cost of foam drainage necessitates further optimization of the design.
Well Y-3 is another foam drainage well, with a foam drainage agent injection cycle of 6 days and a single foam drainage rod used per injection. This well is determined to have a moderate degree of liquid loading, stable production, low liquid output, and good drainage capacity, thus being suitable for the foam drainage production mode. Nevertheless, its low liquid production means the drainage capacity has not been fully utilized, requiring further optimization.
As shown in Figures 1–3 under gas lift conditions, the gas production and liquid production of Well Y-1 fluctuate drastically, with the liquid production ranging from a minimum of 0 to a maximum of 7.81 m3/d. This is not conducive to stable production, production enhancement, or production control. Under foam drainage conditions, the liquid production of Well Y-2 is relatively stable, reflecting a good foam drainage effect; however, due to the daily injection of a high dose of foam drainage agent, the foam drainage cost is high. For Well Y-3 under foam drainage conditions, its gas production is relatively stable, but its liquid production fluctuates significantly, and the overall liquid production is low, failing to fully utilize the well’s foam drainage capacity.
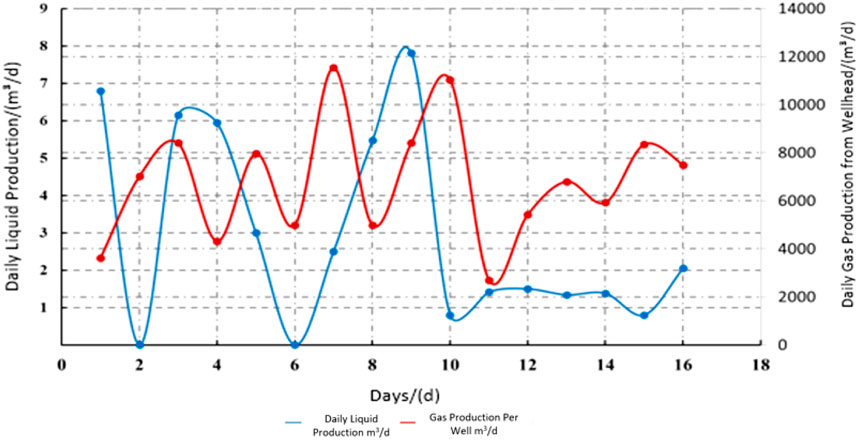
Figure 1. Application of production technology in well Y-1.
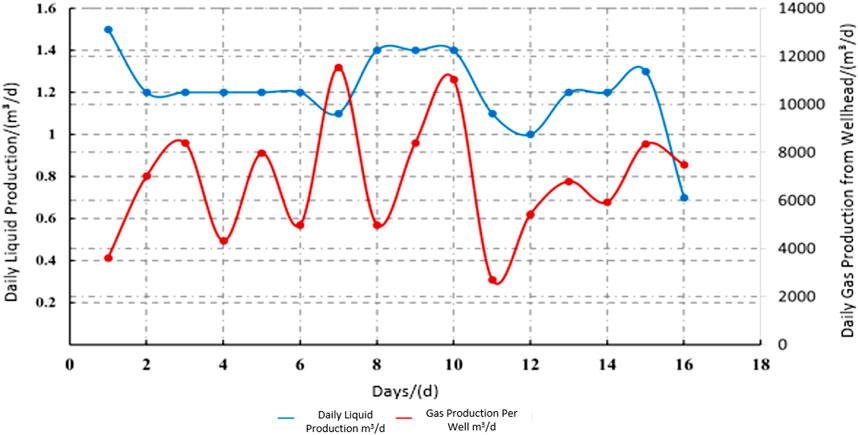
Figure 2. Application scenarios of production technology for well Y-2.
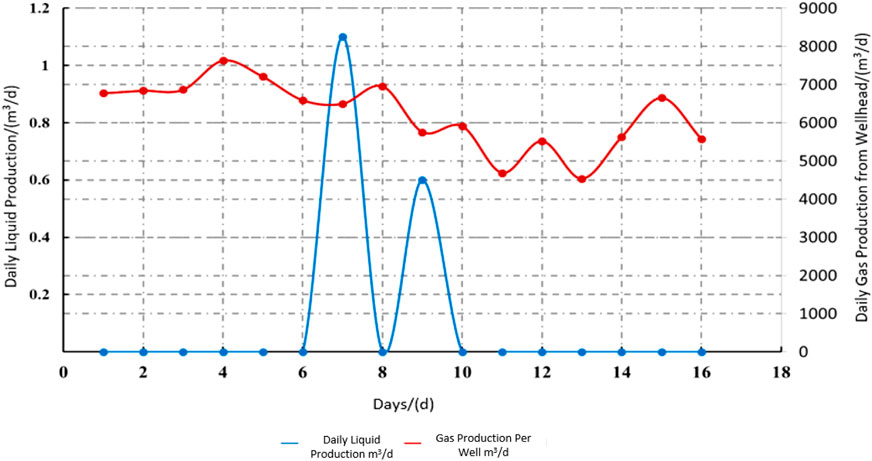
Figure 3. Application scenarios of production technology for well Y-3.
3.1.1.2 Basic conditions of foam drainage agents
To construct the foam drainage model, it is necessary to clarify the performance characteristics of the foam drainage agent used. Referencing SY/T 7494-2020 Experimental Evaluation Method for Foaming Agents Used in Oil and Gas Fields and Q/SY 17815-2021 Technical Specifications for Foaming Agents Used in Drainage Gas Recovery, 0.5% SP-7 foaming liquid was prepared using 80 g/L and 250 g/L standard simulated water samples. Tests on foaming performance, temperature resistance, liquid-carrying performance, and physical properties of the foam drainage agent were conducted to evaluate the compatibility and comprehensive foaming capacity of the agent.
As shown in Table 3, the test results of the 80 g/L and 250 g/L salinity standard SP-7 foaming liquids were evaluated separately. Comparison shows that the performance of SP-7 foaming liquids under 80 g/L and 250 g/L salinity conditions does not meet the standard requirements, but the liquid-carrying rate is close to the standard value, indicating a certain liquid-carrying capacity. The salinity of the on-site water sample is 62.3 g/L, which is lower than 80 g/L and much lower than that of the 250 g/L standard solution.
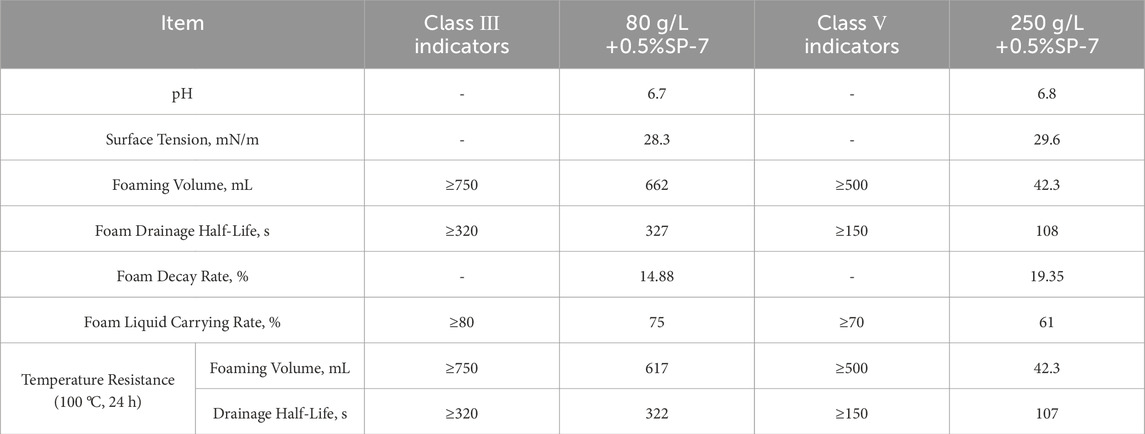
Table 3. Performance evaluation results of SP-7 foaming agent.
When the foam in the measuring cylinder has been left to stand for 30 min (or the user-specified time), gently lower a float along the inner wall of the measuring cylinder onto the foam-liquid interface using a glass rod. Separately read the total volume V1 indicated by the lower edge of the float and the volume V2 of the separated liquid. Calculate the foam decay rate Rt according to the following formula.
Rt—The foam decay rate at a specific time is expressed as a percentage.
V1 — The total volume of the system (in the measuring cylinder) after standing for a certain period and adding the float has a unit of milliliters (mL).
V2 — The volume of liquid separated from the foam after standing for a certain period has a unit of milliliters (mL).
V0 — The unit of foaming volume is milliliters (mL).
Based on the water sample test results of Wells Y-1 to Y-3, the chloride ion concentration is 39.160 g/L, which suggests that the total salinity of the on-site water sample is close to that of the Class III standard water sample (80 g/L).
Based on the test results, the following suggestions can be provided for foam drainage in gas wells.
1. The SP-7 foaming liquid exhibits a certain degree of salinity sensitivity and is recommended to be applied to foam drainage under low-salinity water conditions;
2. The SP-7 foaming liquid exhibits poor thermal stability and is recommended for application in wellbore drainage in a timely manner after preparation.;
3. The foam drainage half-life of the SP-7 foaming liquid complies with the Class III standard, thus exhibiting good foam stability. The selection of high-performance defoaming agents is recommended.
To clarify the influence of foaming liquid concentration, gas flow rate, temperature, and other factors on the foaming and liquid-carrying capacities of SP-7, foaming and liquid-carrying experiments under different concentrations and liquid-carrying experiments under different flow rates were conducted, totaling 9 groups. The simulation results show that.
① The higher the concentration of the SP-7 foaming liquid, the stronger its foaming and liquid-carrying capacities; however, the magnitude of this increase decreases as the concentration rises. When the concentration of the SP-7 foaming liquid increases to 0.5% and 0.9% respectively, the growth rates of the foaming volume and liquid-carrying rate slow down. It is recommended to use the SP-7 foaming liquid with a concentration of 0.9% in field applications.
② As the gas flow rate increases, the liquid-carrying rate increases significantly, and the liquid-carrying capacity is significantly enhanced. After the gas flow rate increases to 400 mL/min, the growth rate tends to slow down.
③ As the temperature increases, the foaming volume and liquid-carrying rate increase, and the foaming and liquid-carrying capacities are enhanced; however, the enhancement amplitude is limited.
3.1.2 Foam drainage agent injection effect
As shown in Table 4 and Figure 4, through simulation calculations, the liquid loading of Well Y-1 is 3.153 m3, and the initial dosage of the foam drainage agent is relatively large at 15.763 kg. Due to its high liquid production, the concentration of the foam drainage liquid decreases rapidly, falling below 0.3% in only 1 day, which requires daily injection of the foam drainage agent. According to this foam drainage design scheme, the liquid-carrying capacity in the wellbore is increased by 26.89%, which improves the drainage and gas production capacity of Well Y-1. The liquid loading of Well Y-2 is 3.098 m3, and the initial dosage of the foam drainage agent is relatively large at 15.486 kg. The concentration of the foam drainage liquid drops below 0.3% on the 2nd day, requiring daily injection of 9.71 kg of the foam drainage agent. According to this foam drainage design scheme, the dosage of the foam drainage agent in the wellbore is only about 32.3% of the original dosage, reducing the foam drainage cost by approximately 68%. The liquid loading of Well Y-3 is 3.448 m3, and the initial dosage of the foam drainage agent is relatively large at 17.442 kg. The concentration of the foam drainage liquid falls below 0.3% on the 18th day, requiring daily injection of 7.12 kg of the foam drainage agent. According to this foam drainage design scheme, the injection cycle of the foam drainage agent in the wellbore is extended from 6 days to 17 days, which reduces the injection cost of the foam drainage agent; meanwhile, the liquid-carrying capacity in the wellbore is increased by 22.64%, improving the drainage and gas production capacity of Well Y-3.
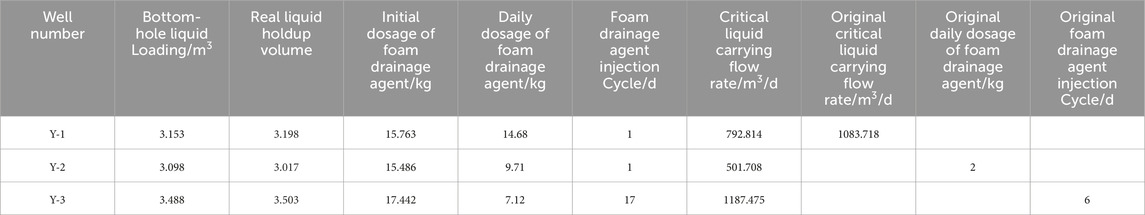
Table 4. Parameter design for foam drainage wells.
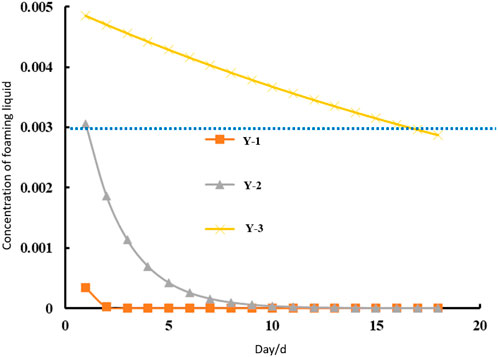
Figure 4. Concentration change diagram of foaming fluid in foam drainage wells after foam drainage agent dosing.
As shown in Figures 4–7, according to the foam drainage design scheme for Well Y-1, the liquid-carrying capacity in the wellbore is increased by 26.89%. Under foam drainage conditions, the liquid production of Well Y-2 is relatively stable, reflecting a good foam drainage effect; however, due to the daily injection of a high dose of foam drainage agent, the foam drainage cost is high. According to the foam drainage design scheme for Well Y-3, the injection cycle of the foam drainage agent in the wellbore is extended from 6 days to 17 days, reducing the operational cost of foam drainage agent injection; meanwhile, the liquid-carrying capacity in the wellbore is increased by 22.64%, which improves the drainage and gas production capacity of Well Y-3.
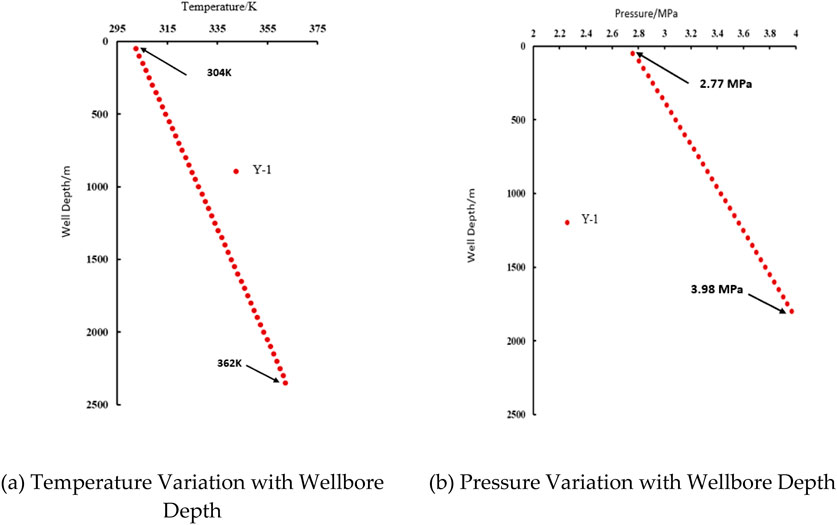
Figure 5. Variation diagrams of temperature and pressure with wellbore depth in well y-1 after foam drainage agent dosing. (a) Temperature variation with wellbore depth. (b) Pressure variation with wellbore depth.
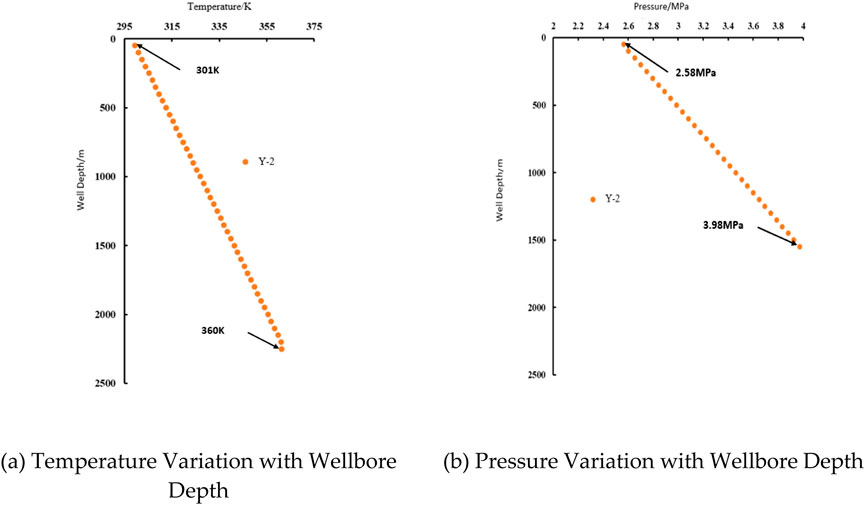
Figure 6. Variation diagrams of temperature and pressure with wellbore depth in well y-2 after foam drainage agent dosing. (a) Temperature variation with wellbore depth. (b) Pressure variation with wellbore depth.
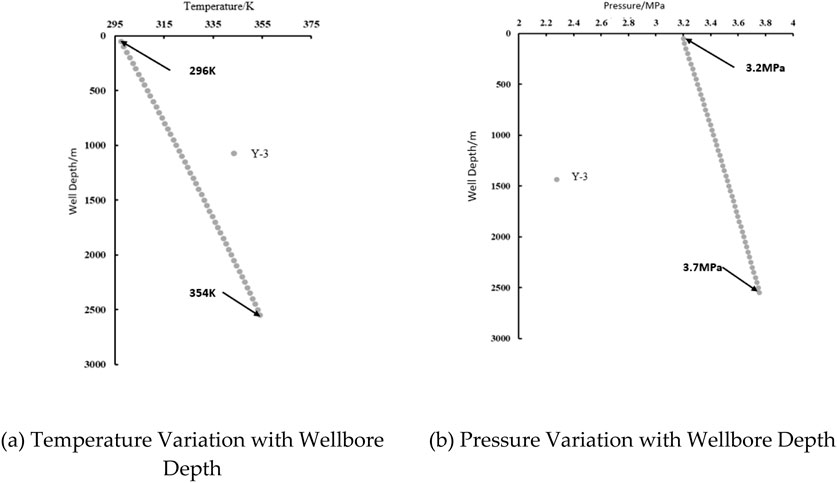
Figure 7. Variation diagrams of temperature and pressure with wellbore depth in well y-3 after foam drainage agent dosing. (a) Temperature variation with wellbore depth. (b) Pressure variation with wellbore depth.
3.2 Influence of liquid carrying factors
The critical velocity of the Turner model decreases continuously as the gas phase mass fraction increases, with its initial value significantly higher than those of the other two models (as shown in Figure 8, where σ = 30 mN/m). This indicates that when the gas phase mass fraction is low, the critical velocity predicted by the Turner model is higher; as the gas phase proportion increases, the critical velocity shows a distinct downward trend, demonstrating that the gas phase mass fraction has a significant influence on the model’s critical velocity. The critical velocities of the Wang Yizhong model and the Li Min model both exhibit a downward trend with the increase in the gas phase mass fraction (Xg), but their overall values are lower than that of the Turner model.
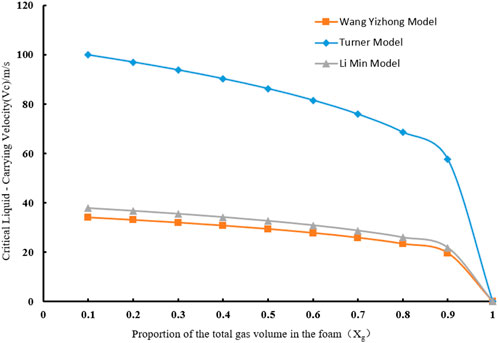
Figure 8. Comparison of relationships between critical liquid carrying velocity and foam gas volume fraction for different models.
The three models exhibit differences in predicting the “gas phase mass fraction–critical velocity” relationship. The Turner model is more sensitive to changes in the gas phase mass fraction and has a higher initial critical velocity, while the prediction results of the Wang Yizhong model and the Li Min model are relatively close and generally lower.
As shown in Figure 9 (where Xg = 0.8), by comparing the critical liquid-carrying velocity (Vc) prediction results of the Wang Yizhong model, Turner model, and Li Min model, the dynamic influence law of gas-liquid surface tension (σ) on liquid-carrying capacity is revealed. Under the experimental conditions, the value range of σ is 25–35 mN/m, and the corresponding critical velocity is distributed in the interval of 20–70 m/s.
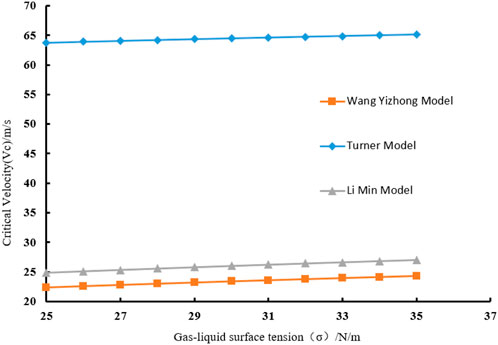
Figure 9. Comparison of the influence of gas-liquid surface tension on critical liquid carrying velocity for different models.
The study shows that the Vc predicted by the Wang Yizhong model exhibits a significant linear downward trend as σ increases. When σ = 25 mN/m, Vc reaches 70 m/s; when σ = 37 mN/m, Vc drops to 20 m/s, with a decrease of 71.4%. This is closely related to the deformation characteristics of spherical-cap liquid droplets in the model. The prediction value of the Turner model changes relatively gently. Its Vc decreases from 55 m/s (at σ = 25 mN/m) to 35 m/s (at σ = 37 mN/m), with a decrease of 36.4%, indicating that the classic liquid droplet theory has low sensitivity to changes in interface tension. The Li Min model exhibits nonlinear characteristics, in the range of σ = 29–33 mN/m, Vc remains stable between 40 and 45 m/s; at both ends of the σ range, steep descent (at σ < 29 mN/m) and slow rise (at σ > 33 mN/m) occur, which may be related to the coupling effect of foam phase change and turbulent boundary layer.
Further analysis, combined with casing-tubing pressure difference, foaming volume, and wellbore temperature-pressure parameters, shows that the prediction differences among different models stem from differences in their assumptions about the gas-liquid two-phase flow pattern and interface energy transfer mechanism. The Wang Yizhong model introduces a liquid droplet deformation correction coefficient, which is more consistent with the actual flow characteristics of foam fluid; its prediction results are highly consistent with the liquid-carrying capacity improvement range (22.6%–26.9%) of Wells Y-1 and Y-2 after on-site optimization. The conservative prediction of the Turner model under high gas phase mass fraction conditions is associated with the deviation in the liquid-carrying rate (75%) of the SP-7 foaming agent at a salinity of 80 g/L.
Treating the foam in the wellbore as a special liquid phase, a physical property calculation model was designed, which enables the calculation of foam drainage parameters (including the initial dosage of foam drainage agent, daily dosage of foam drainage agent, and foam drainage agent injection cycle) in the foam drainage wellbore and the acquisition of liquid-carrying capacity and wellbore temperature-pressure distribution characteristics. The initial dosage of the foam drainage agent has a significant positive correlation with the casing-tubing pressure difference and foam drainage agent concentration. The stronger the foaming capacity of the foaming agent, the stronger the liquid-carrying capacity; however, the magnitude of this increase narrows. The foam drainage agent injection cycle decreases sharply as liquid production increases, and when liquid production exceeds 2 m3/d, the foam drainage agent injection cycle drops to 1 day.
Figure 10 shows the relationship between the casing-tubing pressure difference and the mass and concentration of the foaming liquid during the foam drainage process. As observed from the figure, under different casing-tubing pressure differences, the mass of the foaming liquid exhibits an upward trend as the foaming liquid concentration increases.
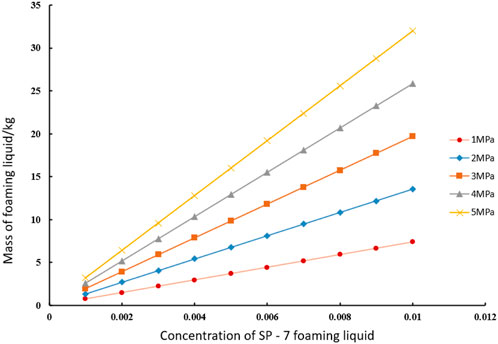
Figure 10. Relationship diagram of casing-tubing pressure difference with foaming fluid mass and concentration in foam drainage technology.
Under each casing-tubing pressure difference, the mass of the foaming liquid is positively correlated with the concentration of the foaming liquid. That is, as the concentration of the foaming liquid increases from 0 to approximately 0.012, the mass of the foaming liquid also increases continuously. This indicates that during the foam drainage process, increasing the concentration of the foaming liquid contributes to an increase in the mass of the foaming liquid, which may exert a positive effect on the drainage and gas production process—for instance, enhancing liquid-carrying capacity.
Differences exist among the curves for different casing-tubing pressure differences. The larger the casing-tubing pressure difference, the higher the mass of the foaming liquid at the same foaming liquid concentration. For example, when the foaming liquid concentration is 0.006, the mass of the foaming liquid under a 1 MPa casing-tubing pressure difference is approximately 10 kg, while that under a 5 MPa casing-tubing pressure difference is approximately 20 kg. This demonstrates that the casing-tubing pressure difference has a significant impact on the mass of the foaming liquid; a larger casing-tubing pressure difference can promote the retention of more foaming liquid in the wellbore. This may be associated with the casing-tubing pressure difference affecting factors such as wellbore liquid loading, further verifying that the initial dosage of the foam drainage agent (which is related to the mass of the foaming liquid) has a significant positive correlation with the casing-tubing pressure difference.
All curves in Figure 11 show that the concentration of the SP-7 foaming liquid decreases over time, indicating that the foaming liquid is continuously consumed or transformed with the passage of time, resulting in a decrease in concentration.
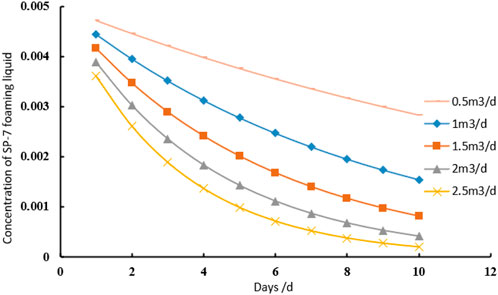
Figure 11. Relationship diagram of daily liquid production vs. foaming agent concentration in foam drainage technology.
The curve corresponding to a flow rate of 0.5 m3/d remains consistently at the highest position, indicating that the concentration of the foaming liquid exhibits a relatively slow decrease at this flow rate. The curve corresponding to a flow rate of 2.5 m3/d remains consistently at the lowest position, indicating that the concentration of the foaming liquid exhibits the fastest decrease at this flow rate. The curves for the remaining flow rates lie between these two extremes, following the trend that the larger the flow rate, the faster the concentration of the foaming liquid decreases within the same time period.
This demonstrates that the flow rate exerts a significant influence on the variation of the foaming liquid concentration. The larger the flow rate, the faster the foaming liquid is consumed or transformed, resulting in a more pronounced decrease in concentration.
As the foaming volume increases from 100 mL to 800 mL, the critical liquid-carrying velocity corresponding to each curve in Figure 12 exhibits a downward trend. This indicates that the larger the foaming volume, the lower the required critical liquid-carrying velocity—i.e., an increase in foaming volume facilitates liquid carrying at a lower velocity, which may be attributed to the enhanced liquid-carrying capacity provided by a greater volume of foam.
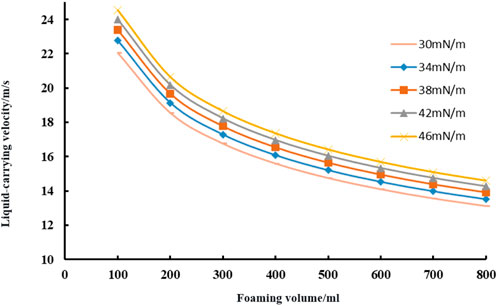
Figure 12. Relationship diagram of foaming liquid surface tension with foaming volume and critical liquid carrying velocity.
The curve corresponding to a surface tension of 46 mN/m remains consistently at the highest position, indicating that under the same foaming volume, the critical liquid-carrying velocity for this surface tension is the largest. In contrast, the curve corresponding to a surface tension of 30 mN/m remains consistently at the lowest position, indicating that the critical liquid-carrying velocity for this surface tension is the smallest. This demonstrates that at the same foaming volume, the larger the surface tension, the higher the critical liquid-carrying velocity. Additionally, when surface tension is low, the effect of foaming volume on reducing the critical liquid-carrying velocity is more pronounced.
4 Conclusion
Focusing on the wellbore liquid loading issue in Wells Y-1, Y-2, and Y-3, this study establishes a segmented liquid loading calculation model based on the casing-tubing pressure difference to accurately analyze the distribution and variation of liquid loading. Additionally, an innovative three-dimensional parameter optimization system—encompassing the initial dosage of the foam drainage agent, daily replenishment amount, and foam drainage agent injection cycle—was constructed to provide support for efficient foam drainage operations.
Through the accurate determination of the physicochemical parameters of the foam drainage agent for foam fluid in the laboratory, the bottom-hole flowing pressure and foam flow pattern in the wellbore were clarified, thereby deepening the understanding of the complex flow behavior of foam. This study confirms that the Wang Yizhong model exhibits high engineering applicability in predicting foam liquid-carrying capacity, providing reliable guidance for field applications.
Special attention was paid to the performance of the SP-7 foaming liquid. Laboratory experiments confirm that it possesses a certain liquid-carrying capacity under low-salinity conditions, but its performance is sensitive to salinity and temperature. Concentration, gas flow rate, and temperature significantly influence its foaming and liquid-carrying capacities. Concentration affects foam generation and stability; gas flow rate determines the flow state and liquid-carrying effect; temperature impacts the physicochemical properties of the foaming liquid.
Practical application results show that the optimized foam drainage process significantly improves liquid-carrying capacity (26.89% for Well Y-1 and 22.64% for Well Y-3) while reducing costs. The foam drainage agent dosage for Well Y-2 was reduced to 32.3% of the original dosage; the foam drainage agent injection cycle for Well Y-3 was extended from 6 days to 17 days, reducing both foam drainage agent consumption and operational frequency.
Data availability statement
The original contributions presented in the study are included in the article/supplementary material, further inquiries can be directed to the corresponding author.
Author contributions
ML: Writing – original draft, Writing – review and editing. RH: Writing – original draft, Writing – review and editing. BL: Methodology, Writing – review and editing. XM: Validation, Methodology, Writing – original draft, Writing – review and editing. GW: Investigation, Writing – review and editing. ZP: Formal Analysis, Resources, Writing – original draft. YZ: Formal Analysis, Writing – original draft.
Funding
The author(s) declare that no financial support was received for the research and/or publication of this article.
Conflict of interest
Authors ML, RH, BL, XM, and GW were employed by Petrochina. The remaining authors declare that the research was conducted in the absence of any commercial or financial relationships that could be construed as a potential conflict of interest.
Generative AI statement
The author(s) declare that no Generative AI was used in the creation of this manuscript.
Any alternative text (alt text) provided alongside figures in this article has been generated by Frontiers with the support of artificial intelligence and reasonable efforts have been made to ensure accuracy, including review by the authors wherever possible. If you identify any issues, please contact us.
Publisher’s note
All claims expressed in this article are solely those of the authors and do not necessarily represent those of their affiliated organizations, or those of the publisher, the editors and the reviewers. Any product that may be evaluated in this article, or claim that may be made by its manufacturer, is not guaranteed or endorsed by the publisher.
References
Abhulimen, K. E., Abhulimen, K. E., and Oladipupo, A. D. (2023). Modelling of liquid loading in gas wells using a software-based approach. J. Petroleum Explor. Prod. Technol. 13 (1), 1–17. doi:10.1007/s13202-022-01525-x
Al-Ahmadi, H. A., Almarzooq, A. M., and Wattenbarger, R. A. (2010). “Application of linear flow analysis to shale gas wells—Field cases[C],” in SPE unconventional resources conference/gas technology symposium. SPE.
Albiter, A., Vargas, J., Contreras, A., and Cruz-Castro, L. (2025). A case study on the application of a mechanical system in a Mexican gas well with liquid loading issues. Flow Meas. Instrum. 104, 104102887–102887. doi:10.1016/j.flowmeasinst.2025.102887
Amani, P., and Firouzi, M. (2023). Uninterrupted lift of gas, water, and fines in unconventional gas wells using foam-assisted artificial lift. Gas Sci. Eng. 114, 204977. doi:10.1016/j.jgsce.2023.204977
Bahrami, H., Rezaee, R., and Clennell, B. (2012). Water blocking damage in hydraulically fractured tight sand gas reservoirs: an example from Perth basin, Western Australia. J. Petroleum Sci. Eng. 88, 100–106. doi:10.1016/j.petrol.2012.04.002
Bonafé, M. F., Braga, A., and Barreto, Jr A. B. (2020). Approximate solution for pressure behavior during a multiple rate injectivity test. J. Petroleum Explor. Prod. Technol. 10 (6), 2373–2386. doi:10.1007/s13202-020-00868-7
Brito, R., Pereyra, E., and Sarica, C. (2017). Effect of well trajectory on liquid removal in horizontal gas wells. J. Petroleum Sci. and Eng. 156, 1–11. doi:10.1016/j.petrol.2017.03.042
Darabi, H., Ettehad, A., Javadpour, F., and Sepehrnoori, K. (2012). Gas flow in ultra-tight shale strata. J. Fluid Mech. 710, 641–658. doi:10.1017/jfm.2012.424
Du, F., Yuan, S., and Liu, W. (2024). Application research on intelligent plunger gas lift liquid drainage technology. Petrochem. Ind. Appl. 43 (11), 41–45. doi:10.3969/j.issn.1673-5285.2024.11.008
El, S. (2023). “Impact of the stress shadow on the proppant transport and the productivity of the multi-stage fractured marcellus shale horizontal wells,” in ARMA US rock mechanics/geomechanics symposium. ARMA. doi:10.56952/ARMA-2023-0811
Elyasa, A., Hassan, A., Mahmoud, M., Gajbhiye, R., El-Husseiny, A., and Abu-Mahfouz, I. S. (2024). Mitigating liquid loading in gas Wells using thermochemical fluid injection: an experimental and simulation study. ACS omega 9 (28), 31081–31092. doi:10.1021/acsomega.4c04423
Eromoses, K. A., Abhulimen, K. E., and Oladipupo, A. D. (2022). Modelling of liquid loading in gas wells using a software-based approach. J. Petroleum Explor. Prod. Technol. 13 (1), 1–17. doi:10.1007/s13202-022-01525-x
Fadili, Y. E., and Shah, S. (2016). A new model for predicting critical gas rate in horizontal and deviated wells. J. Petroleum Ence and Eng., 150. doi:10.1016/j.petrol.2016.11.038
Fu, X., Agostini, F., Skoczylas, F., and Jeannin, L. (2015). Experimental study of the stress dependence of the absolute and relative permeabilities of some tight gas sandstones. Int. J. Rock Mech. Min. Sci. 77, 36–43. doi:10.1016/j.ijrmms.2015.03.005
Gao-mian, XIAO, Ying-chuan, L. I., and Xin, Y. U. (2010). Theory and experiment research on the liquid continuous removal of horizontal gas well. J. Southwest Petroleum Univ. and Technol. Ed. 32 (03), 122–197. doi:10.3863/j.issn.1674-5086.2010.03.023
Gowida, A., Elkatatny, S., Kamal, M. S., and Hussain, S. M. S. (2024). Experimental study on an eco-friendly gemini foaming agent for enhancing foam drilling applications. J. Petroleum Explor. Prod. Technol. 14 (7), 1995–2010. doi:10.1007/s13202-024-01801-y
Guner, M., Pereyra, E., and arica, C. (2015). “An experimental study of low liquid loading in inclined pipes from 90° to 45°,” in SPE production and operations symposium. doi:10.2118/173631-MS
Guo, T., Deng, M., and Liu, B. (2024). Research on the economic and technical evaluation of the bubble - drainage process based on the entropy weight method. Shandong Foam Drain. Agent Ind. 53 (19), 114–117. doi:10.19319/j.cnki.issn.1008-021x.2024.19.023
He, X., Hu, W., and He, W. (2021). A new model for predicting critical liquid loading flow rate of gas Wells in yan'an gas field. Unconv. Oil Gas 8 (05), 56–62. doi:10.19901/j.fcgyq.2021.05.08
Huang, W., Tong, L., and Yuan, J. (2023). Research on the nitrogen injection with water + bubble - drainage process for the revival of flooded Wells in the yuanba gas field. Nat. Gas Oil 41 (02), 80–86. doi:10.3969/j.issn.1006-5539.2023.02.011
Huang, Q., Huang, Z., Yang, Y., Liu, S., Wang, D., Yan, X., et al. (2024). A new model for predicting critical fluid-carrying flow rate in horizontal wells with high gas-liquid ratio. Fault-Block Oil and Gas Field 31 (05), 843–850. doi:10.6056/dkyqt202405012
Jiang, H., Huang, Z., and Liu, J. (2021). Research on the technical limits of the application of the bubble - drainage process in low - pressure and low - production wells. Energy Energy Conservation (10), 121–123. doi:10.16643/j.cnki.14-1360/td.2021.10.045
Kanta, M., Tsimopoulos, E. G., Dimitriadis, C. N., and Georgiadis, M. C. (2025). Strategic investments and portfolio management in interdependent low-carbon electricity and natural gas markets. Comput. and Chem. Eng. 192, 108885. doi:10.1016/j.compchemeng.2024.108885
Kruglyakov, P. M. (2008). Foam drainage. Curr. Opin. Colloid and Interface Sci. 13 (3), 163–170. doi:10.1016/j.cocis.2007.11.003
Lidan, L., Tailiang, Z., and Cunchuan, Z. (2023). Study of foam drainage agent based on g-C3N4 nanosheets reinforced stabilization. Colloids Surfaces A Physicofoam drainage agent Eng. Aspects 657 (PA), 130607. doi:10.1016/j.colsurfa.2022.130607
Liu, J., Liao, R., and Shengxiao, Z. (2011). Quantitative analysis of the capability of liquid removing from different-productivity gas wells. Quantitative analysis of the capability of liquid removing from different-productivity gas wells. 31 (01), 113–114. doi:10.3787/j.issn.1000-0976.2011.01.013
Min, L., Sun, L., and Shilun, L. (2001). A new continuous liquid - discharge model for gas Wells. Nat. Gas. Ind. (05), 61–63. doi:10.3321/j.issn:1000-0976.2001.05.018
Min, L., Guo, P., and Zhang, M. (2002). Comparative study on continuous liquid carrying models for gas Wells. J. Southwest Petroleum Inst. (04), 30–32. doi:10.3969/j.issn.1005-8907.2002.06.012
Minyan, D., Chen, C., Wang, D., and Pan, M. (2010). Analysis of wellbore fluid accumulation and water drainage technology. Analysis Wellbore Fluid Accumulation Water Drainage Technol. 38 (06), 109–112.
Nasab, H. S., Rezaee, M., and Zitha, P. (2024). Foam drainage modeling of vertical foam column and validation with experimental results. Petroleum Res. 9 (4), 586–598. doi:10.1016/j.ptlrs.2024.05.001
Nobakht, M., Mattar, L., Moghadam, S., and Anderson, D. M. (2012). Simplified forecasting of tight/shale-gas production in linear flow. J. Can. Petroleum Technol. 51 (06), 476–486. doi:10.2118/133615-pa
Oyindamola, O., Ramadan, A., and Mahmood, A. (2022). The effects of pressure and column height on drainage behavior of oilfield foams. Upstream Oil Gas Technol. 9, 100076. doi:10.1016/j.upstre.2022.100076
Pagou, A. L. H., GuoqingPeng, L. D., OumaimaKamdem, V. G. A., FataiMccarthy, S. A. T., FritzHarmash, H., IrynaKanturina, Z., et al. (2020). Liquid loading prediction and identification model for vertical and inclined gas wells. J. Nat. gas Sci. Eng. 84 (1), 103641. doi:10.1016/j.jngse.2020.103641
Pagou, A. L., Wu, X., and Zhu, Z. (2020). Liquid film model for prediction and identification of liquid loading in vertical and inclined gas Wells. J. Petroleum Sci. and Eng. (188-), 188. doi:10.1016/j.petrol.2019.106896
Peng, L., Pagou, L. A., Tian, L., Chai, X., Han, G., Yin, D., et al. (2024). A fully coupled compositional wellbore/reservoir model for predicting liquid loading in vertical and inclined gas wells. Geoenergy Sci. Eng. 239, 239212874. doi:10.1016/j.geoen.2024.212874
Q. Y., S., P. Y., Z., W. Q., L., Fan, Z. Z., and Wei, A. Q. (2023). Research progress on new highly efficient foam drainage agents for gas Wells (A review). Pet. Chem. 63 (9), 1119–1131. doi:10.1134/s0965544123080029
Sankar, S., and Karthi, S. A. (2019). Study of identifying liquid loading in gas Wells and deliquification techniques. IJERT-International J. Eng. Res. and Technol. (6). doi:10.1016/j.jngse.2020.103568
Sarica, C., Yuan, G., and Sutton, R. P. (2023). An experimental study on liquid loading of vertical and deviated gas Wells. doi:10.2118/164516-MS
Schmid, K. S., and Geiger, S. (2013). Universal scaling of spontaneous imbibition for arbitrary petrophysical properties: water-wet and mixed-wet states and Handy's conjecture. J. Petroleum Sci. Eng. 101, 44–61. doi:10.1016/j.petrol.2012.11.015
Singh, R., and Mohanty, K. K. (2017). “Nanoparticle-stabilized foams for high-temperature, high-salinity oil reservoirs, ” in SPE annual technical conference and exhibition, 9–11 October. D021S028R004. doi:10.2118/187165-MS
Skopich, A., Pereyra, E., Sarica, C., and Kelkar, M. (2015). Pipe-diameter effect on liquid loading in vertical gas Wells. Spe Prod. and Operations 30, 164–176. doi:10.2118/164477-PA
Sun, Y. Q., Zhang, Y. P., Liu, Q. W., Fan, Z. Z., and Wei, A. Q. (2023). Research progress on new highly efficient foam drainage agents for gas Wells (A review). Pet. Chem. 63 (9), 1119–1131. doi:10.1134/S0965544123080029
Tavakkoli, M., Panuganti, S. R., Khemka, Y., Valdes, H., and Vargas, F. M. (2021). Foam-assisted gas lift: a novel experimental setup to investigate the feasibility of using a commercial surfactant for increasing oil well productivity. J. Petroleum Sci. Eng. 201, 108496. doi:10.1016/j.petrol.2021.108496
Tayyab, I., Uddin, M. F., and Ahmed, Q. I. (2014). “Combination of foam assisted lift and gas lift (FAGL) to De-Liquefy gas wells,” in SPE/PAPG Pakistan section annual technical conference. SPE. doi:10.2118/174711-MS
Teng, T., Chen, Y., Wang, Y., and Qiao, X. (2025). In situ nuclear magnetic resonance observation of pore fractures and permeability evolution in rock and coal under triaxial compression. J. Energy Eng. 151 (4), 04025036. doi:10.1061/JLEED9.EYENG-6054
Tugan, M. F. (2020). Deliquification techniques for conventional and unconventional gas wells: Review, field cases and lessons learned for mitigation of liquid loading. J. Nat. Gas Sci. Eng. 83, 103568. doi:10.1016/j.jngse.2020.103568
van ’t Westende, J. M. C., Kemp, H. K., Belt, R. J., Portela, L., Mudde, R., and Oliemans, R. (2007). On the role of droplets in cocurrent annular and churn-annular pipe flow. Int. J. Multiph. Flow 33 (6), 595–615. doi:10.1016/j.ijmultiphaseflow.2006.12.006
Veeken, K., (2017). “Evaluating performance of foam-assisted lift in Sultanate of Oman by dedicated field testing,” in Abu Dhabi international petroleum exhibition and conference. SPE. doi:10.2118/188223-MS
Wang, Z. L. I. Y. (2012). The mechanism of continuously removing liquids from gas wells. Acta Pet. Sin. 33 (04), 681–686. doi:10.7623/syxb201204021
Wang, Y., and Zhang, H. (2022). A new approach for predicting critical liquid-carrying flow rate in directional gas wells. Foam drainage agent Eng. Oil and Gas 51 (04), 69–74. doi:10.3969/j.issn.1007-3426.2022.04.013
Wang, K., Zhang, Y., and Ma, W. (2015). “An experimental study on the dynamics of a liquid film under shearing force and thermal influence, ” in 4th Thermal and Fluids Engineering Conference. doi:10.1615/TFEC2019.fnd.027953
Wang, M., Chen, S., and Lin, M. (2018). Enhancing recovery and sensitivity studies in an unconventional tight gas condensate reservoir. Petroleum Sci. 15 (2), 305–318. doi:10.1007/s12182-018-0220-7
Wang, L., Zhang, W., Cao, Z., Xue, Y., and Xiong, F. (2025). Coupled effects of the anisotropic permeability and adsorption-induced deformation on the hydrogen and carbon reservoir extraction dynamics. Phys. Fluids 37 (6), 066608. doi:10.1063/5.0270765
Xin, X. (2021). Research on the bubble - drainage process technology for high - condensate oil - gas wells in zhongjiang gas field. China Petroleum Foam drainage agent Stand. Qual. 41 (10), 192–193.
Xiong, C. M., Cao, G. Q., Zhang, J. J., Xu, W., Wu, J., et al. (2019). Nanoparticle foaming agents for major gas fields in China. Petroleum Explor. Dev. 46 (5), 1022–1030. doi:10.1016/s1876-3804(19)60259-4
Xusen, H., and Chun, L. (2024). “Research on the evaluation method of the bubble - drainage process effect in shale gas horizontal Wells//xi'an shiyou university, Shaanxi petroleum society,” in Proceedings of the 2024 international conference on oil and gas field exploration and development I. Project management department of shale gas exploration and development (Xi’an, China: CNPC Chuanqing Drilling Engineering Company Limited), 1618–1623. doi:10.26914/c.cnkihy.2024.050978
Yi-zhong, WANG, and Qing-wen, L. I. U. (2007). A new method to calculate the minimum critical liquids carrying flow rate for gas Wells. Petroleum Geol. and Oilfield Dev. Daqing (06), 82–85. doi:10.3969/j.issn.1000-3754.2007.06.021
Zhang, L., Luo, C., Liu, Y., Yulong, Z., Xie, C., Qi, Z., et al. (2019). Research progress in liquid loading prediction of gas wells. Res. Prog. Liq. Load. Predict. gas wells 39 (01), 57–63. doi:10.3787/j.issn.1000-0976.2019.01.006
Zhengzheng, C., Yi, X., Yi, X., Feng, D., Zhenhua, L., Cunhan, H., et al. (2025). Diffusion evolution rules of grouting slurry in mining-induced cracks in overlying strata. Rock Mech. Rock Eng. 58, 6493–6512. doi:10.1007/s00603-025-04445-4
Keywords: foam assisted lift, wellbore liquid loading, foaming agent, critical liquid-carryingvelocity, production optimization design
Citation: Liu M, Hao R, Leng B, Meng X, Wang G, Pang Z and Zhang Y (2025) Study on liquid carrying law and foam drainage system optimization design for liquid-loading gas wells. Front. Earth Sci. 13:1671644. doi: 10.3389/feart.2025.1671644
Received: 23 July 2025; Accepted: 29 September 2025;
Published: 04 November 2025.
Edited by:
Xingyuan Liang, China University of Petroleum, ChinaReviewed by:
Zhengzheng Cao, Henan Polytechnic University, ChinaLong He, Shaanxi University of Science and Technology, China
Wen Liu, Foshan University, China
Copyright © 2025 Liu, Hao, Leng, Meng, Wang, Pang and Zhang. This is an open-access article distributed under the terms of the Creative Commons Attribution License (CC BY). The use, distribution or reproduction in other forums is permitted, provided the original author(s) and the copyright owner(s) are credited and that the original publication in this journal is cited, in accordance with accepted academic practice. No use, distribution or reproduction is permitted which does not comply with these terms.
*Correspondence: Xiangyu Meng, YWlueS1tb3JuaW5nOEBvdXRsb29rLmNvbQ==