 Meiben Gao1,2,3,4
 Binbin He1*
 Wenhui Li5*Wanjia Guo2,6Shiming Bai3Lijuan Wang1,2,6Rui Bian2,6
 Liang Zhang3Zhihao He1,2,3,6
 Feng Lu3
- 1School of Resources and Environment, University of Electronic Science and Technology of China, Chengdu, China
- 2Sichuan Academy of Safety Science and Technology, Chengdu, China
- 3School of Emergency Management, Xihua University, Chengdu, China
- 4Key Laboratory of Landslide Risk Early-warning and Control,Ministry of Emergency Management, Chengdu University of Technology, Chengdu, China
- 5Qingdao Geo-Engineering Surveying Institute (Qingdao Geological Exploration and Development Bureau), Qingdao, China
- 6Major Hazard Measurement and Control Key Laboratory of Sichuan Province, Chengdu, China
The mechanical behavior of landslide rock masses and slip zone soils plays a crucial role in the initiation and evolution of landslides, particularly under prolonged rainfall conditions, where the saturation process leads to strength degradation and changes in failure mechanisms. This study focuses on the Shibanping landslide in Yunyang County, Chongqing, and systematically investigates the mechanical properties and energy evolution of the rock and soil mass in the slip zone under different saturation durations. Conventional triaxial compression tests were conducted on sandstone and argillaceous sandstone to examine their strength, elastic modulus, and failure modes under natural and saturated conditions. In situ direct shear tests were performed on slip zone soils to evaluate the degradation trend of shear strength parameters with changing water content. The results indicate that the peak strength and elastic modulus of the rock mass increase with confining pressure, while water saturation significantly weakens the rock strength, with argillaceous sandstone exhibiting greater water sensitivity and structural degradation. After saturation, the cohesion and internal friction angle of the slip zone soil decreased by 29.7% and 25.0%, respectively, leading to a pronounced reduction in shear resistance. Furthermore, energy evolution curves during the rock mass loading process reveals that energy release occurs earlier and more violently under saturated conditions, indicating a more abrupt failure process. This study can enhance the understanding of the stability evolution mechanism of rainfall-induced landslides, and provides theoretical and parameter support for disaster early warning and engineering mitigation.
Highlights
• In-site shear tests were conducted on water-saturated mylonitized interlayers in the sliding zone, revealing the mechanical behaviors of the mylonitized interlayers under different water content conditions.
• Argillaceous sandstone is extremely sensitive to water, and micro-damage will occur after being soaked for 2 h.
• The intervention of water alters the energy distribution pattern of rock masses, inducing instability in advance.
1 Introduction
The mechanical properties of the rock and soil mass in the slip zone play a critical role in slope stability (Cui et al., 2025; Wang Q. Y. et al, 2025). In numerous documented landslide cases both in China and abroad, research has predominantly focused on the influence of the cohesion and internal friction angle of slip zone soils on landslide initiation. However, under extreme rainfall conditions, the rock mass can also undergo significant mechanical deterioration due to prolonged water infiltration and saturation (Zhou et al., 2021; Miao and Wang, 2023). Under different environments, the physical characteristics of rock and soil masses may change, and the mechanical responses vary significantly (Lin et al., 2025; Zhang et al., 2025a). Their mechanical behavior plays a key role in geotechnical engineering applications (Lin et al., 2021; Chen et al., 2025; Zhang et al., 2025b). Particularly after several days or even weeks of continuous rainfall, both the slope-forming rock mass and slip zone soils often reach a state of long-term saturation, resulting in substantial changes in their strength, stiffness, and deformation characteristics (Xiang et al., 2013; Wang et al., 2017). If these changes are not fully understood and incorporated, they may lead to inaccurate disaster risk assessments and ineffective mitigation strategies. While previous studies have confirmed that short-term saturation can reduce the strength of slip zone soils (Zhu et al., 2022; Li and Zhou, 2023). The hydro-softening processes and interfacial effects between slip zone soil and rock under prolonged immersion are complex and intertwined, potentially exhibiting mechanical responses that differ significantly from those under dry or briefly saturated conditions (Nian et al., 2011; Ji et al., 2016; Liu et al., 2022). Therefore, revealing the mechanical evolution of these materials under varying saturation durations is particularly important for landslide stability assessment, especially during frequent rainfall seasons.
Current studies on saturation duration have mainly concentrated on the short-term mechanical degradation of slip zone soils, lacking comprehensive analyses of the coupled mechanical behavior of both rock and slip zone materials under long-term saturation (Liao et al., 2021; Miao and Wang, 2021). It is well known that extended water exposure can lead to clay softening, increased pore water pressure, and active interfacial failure (Yang et al., 2025). If such effects are not incorporated into numerical models, it becomes difficult to accurately simulate the mechanisms of slope instability under prolonged rainfall infiltration. Moreover, the evolution of rock saturation and microcrack propagation under these conditions remains poorly understood, representing a critical gap in knowledge for improving landslide disaster prevention. From the perspective of long-term rainfall-induced hazard mitigation, conducting multi-stage property tests on rock and slip zone soils under different saturation durations can help establish strength–time degradation functions more aligned with field conditions, thereby enhancing the effectiveness of early warning systems and engineering interventions (Yang et al., 2024; Xue et al., 2023).
In recent years, energy-based approaches to fracture initiation and propagation have attracted increasing attention. The energy distribution behavior of rock masses during loading can provide early indications of impending failure zones (Tang et al., 2025; Qi et al., 2025; Yang et al., 2025). While previous studies have identified characteristic patterns of energy accumulation and release in unsaturated rock, the influence of saturation duration on energy evolution has not yet been systematically explored (Wang et al., 2024; Gao et al., 2024). Addressing this knowledge gap could offer new insights into the mechanisms of crack growth and failure threshold evolution under saturated conditions.
This study aims to systematically investigate the mechanical properties of rock and soil mass in the slip zone, as well as the energy evolution characteristics of the rock mass, under different saturation durations. The experimental work includes immersion treatment, laboratory triaxial and in-situ direct shear tests, and rock energy analysis during loading. The objectives are to clarify the evolution of mechanical parameters with increasing saturation duration and to uncover the intrinsic links between energy evolution and instability. The findings will provide reliable mechanical parameters and energy thresholds under prolonged rainfall conditions, offering essential support for landslide risk assessment and mitigation design. This research effectively addresses a current gap in the literature and enhances the scientific basis for evaluating and managing landslide hazards in regions prone to recurrent heavy rainfall.
2 Materials and methods
2.1 Sample preparation
2.1.1 Sampling site
The Shibanping landslide is located in Group 15, Zhongyuan Village, Longtang Community, Pingan Town, Yunyang County, Chongqing City. Its longitude and latitude coordinates are 108.451697° east longitude and 31.0003° north latitude. On 30 June 2020, the rear edge of the landslide was excavated for the construction of a village road, revealing multiple rock cracks. On July 25, local misalignment deformation and collapse occurred at the front edge of the landslide, resulting in a small-scale shallow rock landslide. The east and west sides of the landslide are demarcated by gullies, the rear edge by village roads, and the front edge by houses on the inner side of the roads (Figure 1a). The landslide is approximately 157 m in length and 65 m in width. Its planar shape is tongue-shaped, with an average thickness of about 4.0 m. It is distributed at elevations ranging from 473 m to 431 m, covering an area of about 1.78 × 10⁴ m2 and a volume of approximately 7.12 × 10⁴ m3. According to the volume classified of landslide, it belongs to a small landslide (<10 × 104 m3). The main deformation and failure feature of landslides is manifested as the collapse (Figure 1b). The potential sliding direction of the landslide is 355°, and the height of the forward is 3–6 m. The landslide area is mainly composed of sandstone, argillaceous sandstone, mylonitized interlayers, etc., forming a special lithological combination with a hard upper part, a weak interlayer in the middle, and a relatively impermeable lower part (Figures 1c–e). This lithological combination is the key to the instability of landslides. The mylonitized interlayer, as the main weak area of the sliding surface, has a relatively low shear strength. The infiltration of rainfall and water further reduces the shear strength of the mylonitized interlayer. The damage to the landslide mass gradually penetrates from the surface layer, creeping along the mylonitized interlayer, and the deformation gradually extends to the rock mass in the front part of the landslide, thus leading to the occurrence of the landslide. For this purpose, potential sliding surface sandstone and argillaceous sandstone were selected to conduct indoor mechanical tests (core in the red area of Figure 1c), and in-site direct shear tests were carried out in the area of the sliding and mylonitized interlayer at the leading edge (Figure 1e), thereby obtaining the mechanical parameters of the sliding rock and soil.
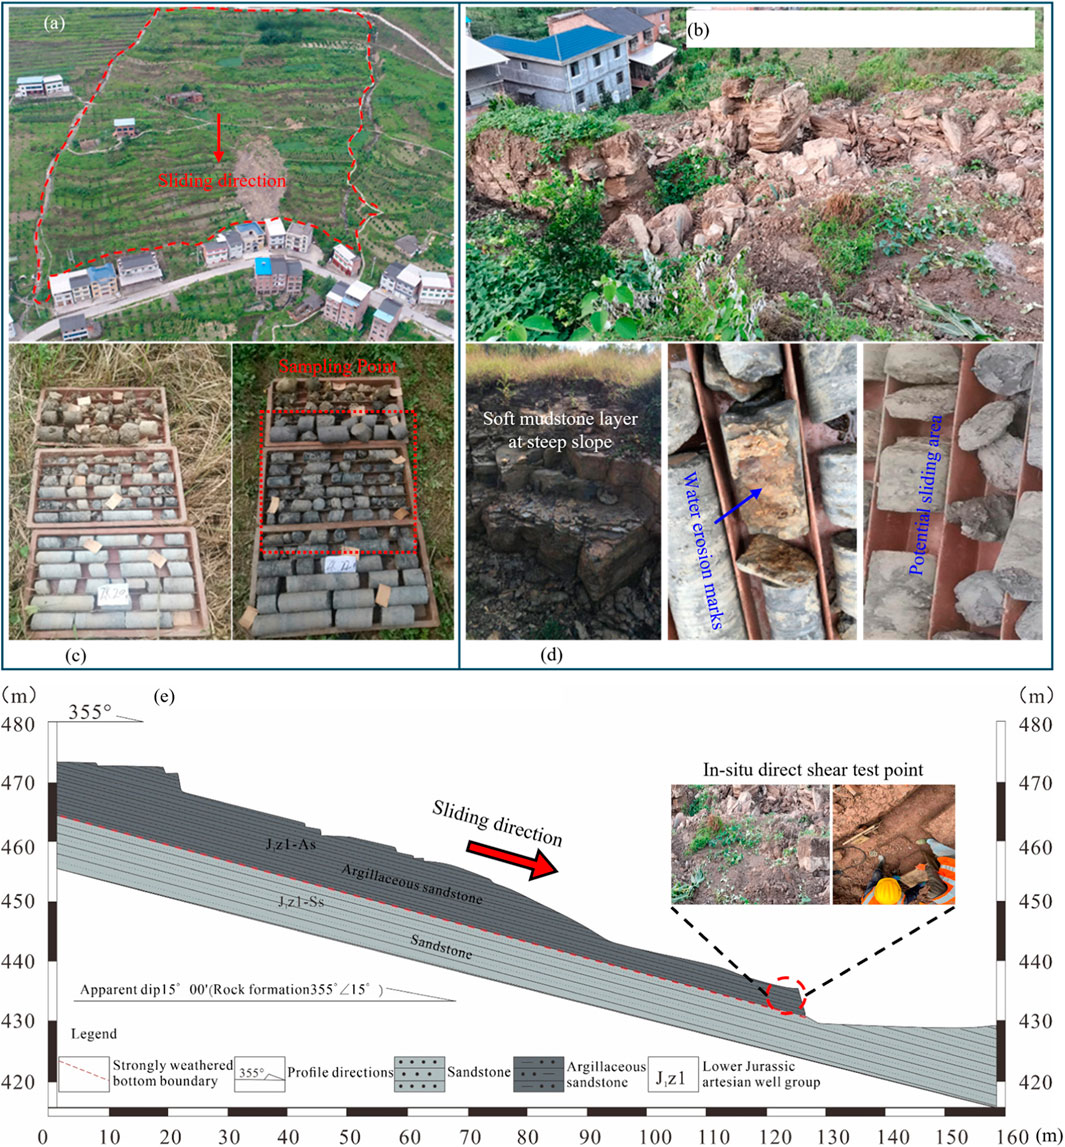
Figure 1. Schematic diagram of the characteristics of Shibanping landslide and sampling points. (a) Overview of Shibanping landslide. (b) Deformation and collapse at the forefront. (c) Drilled core of Shibanping landslide. (d) Deformation of Shibanping landslide. (e) Geological cross-section of Shlbanping landslide.
2.1.2 Sample introduction
According to the landslide characteristics, the sandstone, argillaceous sandstone and argillaceous interlayer at the potential sliding area of the Shibanping landslide were selected for experiments. Under natural conditions, the average densities of sandstone, argillaceous sandstone and mylonitized interlayer are 2.36 g/cm3, 2.47 g/cm3 and 2.07 g/cm3 respectively, and the average water contents are 3.69%, 3.72% and 3.75% respectively.
Conventional triaxial compression tests were carried out for sandstone and argillaceous sandstone using standard cylindrical specimens with dimensions of 50 mm in diameter and 100 mm in height. The sample was subjected to standardized saturated water treatment by vacuum saturation method, and the atmospheric pressure was set at 0.07 MPa. Natural sandstone samples were subjected to 24 h of water saturation under vacuum conditions to ensure that water fully permeated the pore structure of the rock mass. For argillaceous sandstone, after vacuum saturation 24 h, obvious structural deterioration occurred in the specimens, manifested as volume rupture, edge spalling and loss of integrity. It could not meet the requirements of conventional triaxial mechanical tests (As shown in NS-15 photos in Table 1). For this purpose, this study designed a hierarchical and progressive satiety scheme. Taking 1 h as the initial saturation duration and increasing by 1 h each time, the integrity and testability of the samples after saturation treatment at different time periods were evaluated successively. The data statistics are shown in Table 1. According to Table 1, after being saturated with water for 2 h, cracks began to appear on the surface of the argillaceous sandstone. Four hours later, the cracks penetrated, and small chunks of the argillaceous sandstone specimens cracked. After being saturated with water for 24 h, it severely cracked and failed to meet the test requirements. Given that a small portion of the components decompose and dissolve in water, the quality is reduced after saturated water treatment (NS-15). For this purpose, the saturated water treatment time for argillaceous sandstone was set at 1 h, and samples that met the test conditions were selected to carry out triaxial compression tests.
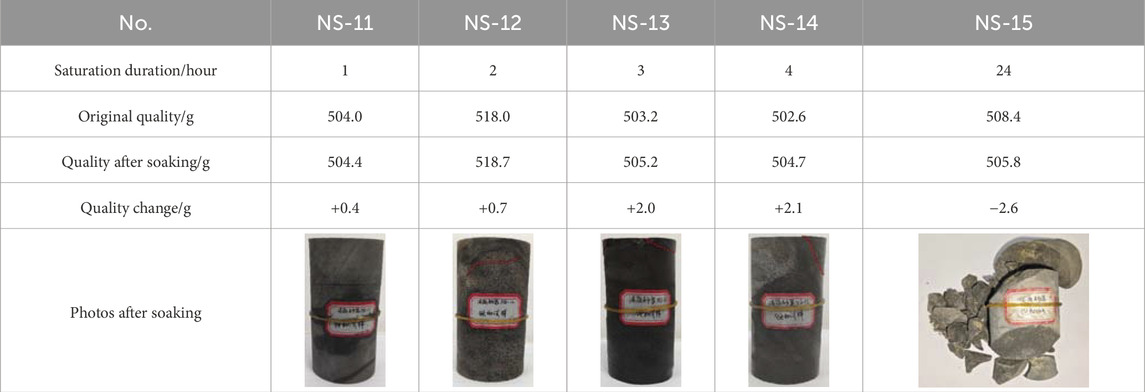
Table 1. Saturated treatment results of argillaceous sandstone (NS: argillaceous sandstone).
The in-site shear test of the mylonitized interlayer was carried out in the test pit at the front edge of the landslide. First, the working surface is excavated with an excavator. To strictly control the disturbance, then in-site cutting and trimming are carried out manually according to the dimensions of 50 cm × 50 cm × 28 cm to ensure that the top surface of the sample is flat and facilitate the uniform transfer of load. To simulate the actual sliding structural plane, the preset width of the shear seam is controlled between 3 and 6 mm (Figure 2). A total of 10 groups of shear specimens were prepared, among which 5 groups were in their original state (naturally hydrated state), and the other 5 groups were subjected to shear after artificial saturation treatment.
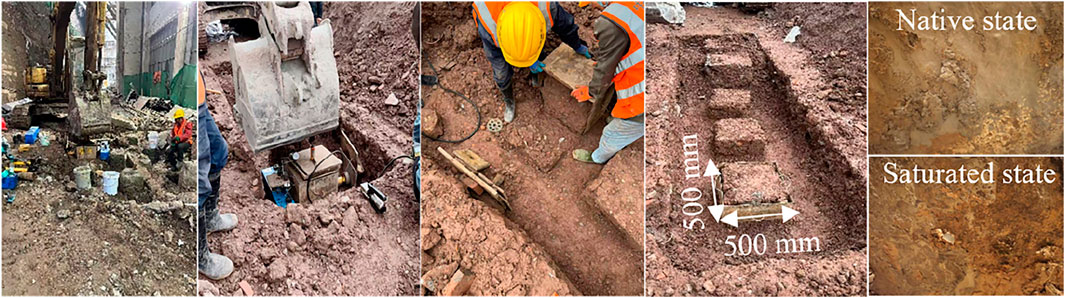
Figure 2. In-site direct shear sample preparation process for mylonitized interlayer.
The specimens in the saturated group were subjected to a saturation process by continuous water infiltration from the upper surface of the shear zone. The infiltration was maintained for 24–36 h until matric suction measured by tensiometers dropped below 2–3 kPa and volumetric water content reached approximately 95% of the saturated value, consistent with the commonly accepted saturation criteria in unsaturated soil mechanics (Fredlund and Xing, 1994). This ensured that the structural surface was close to full saturation and that the water–soil interaction effects were fully mobilized during shearing.
2.2 Experimental equipment and methods
The conventional triaxial compression test was conducted using the IRSM-THMC-1500 multi-field coupled test system at the Test Center in the School of Emergency Management, Xihua University (Figure 3). This system was developed by the Institute of Rock and Soil Mechanics, Chinese Academy of Sciences in Wuhan. Its maximum axial loading capacity reaches 1,500 kN, and the maximum confining pressure loading capacity is 60 MPa. It is capable of conducting various types of mechanical tests on rocks under the multi-field coupling conditions of heat, water and force, including uniaxial compression, triaxial compression, creep and stress relaxation tests. The confining pressure loading control accuracy is better than 0.01 MPa, and the flow control range is 0.01–60 mL/min, meeting the demand for high-precision control of the loading process in the thermally water-force coupling state. The system is equipped with two sets of high-precision LVDT displacement sensors, with an axial range of ±5 mm and a circumferential range of 0–10 mm. The minimum resolution can reach 0.2 μm, which can record the deformation of the sample in real time during the loading process and capture the deformation and fracture evolution characteristics of the sample under triaxial stress conditions.
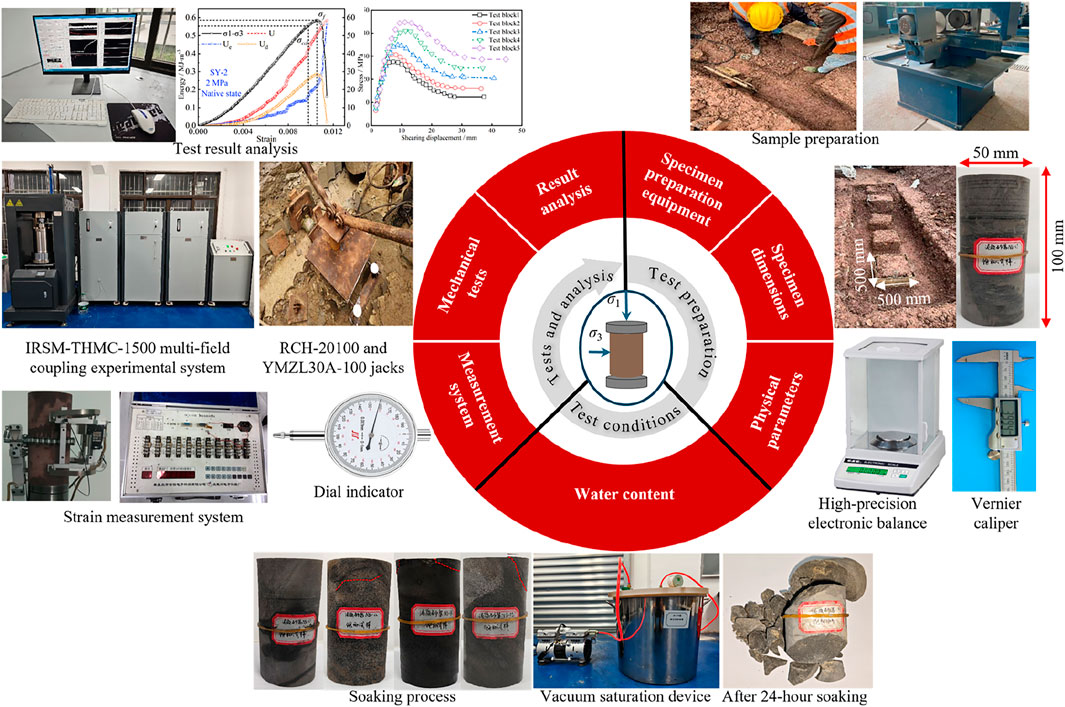
Figure 3. Experimental equipment.
The in-situ direct shear test equipment is mainly composed of two types of hydraulic jacks: Model RCH-20100 and Model YMZL30A-100 (Figure 3). Among them, the RCH-20100 jack has a rated load of 200 kN and a stroke of 100 mm. YMZL30A-100 jack, with a rated load of 300 kN and an equivalent stroke capacity, is mainly used for shear mechanical tests under working conditions where a larger normal load needs to be applied. The test setup is equipped with 8 high-precision displacement transducers (with a resolution of 0.01 mm). They are respectively arranged in the normal and tangential loading directions to accurately record the displacement responses during the deformation process. Meanwhile, high-precision strain-type force sensors are provided to conduct real-time monitoring of the shear force and normal force. All sensor signals are synchronously collected and stored through an automatic acquisition system, providing reliable data support for the stress-strain analysis of the sliding zone soil at different loading stages.
To ensure the safety of the test process and accurately obtain the stress-strain response curves of rock samples under different confining pressure conditions, the loading mode of this triaxial compression test adopts the displacement control mode. Firstly, the confining pressure is applied at a loading rate of 0.6 MPa/min until reaching the set value. The confining pressure levels are 1 MPa, 2 MPa, and 3 MPa respectively. After the confining pressure stabilizes, the axial load is applied, with the displacement increasing rate under the displacement control mode being 0.15 mm/min until the sample fails.
The loading system for the in-situ direct shear test adopts a vertical steel frame reaction device to form a reaction support. The loading is implemented by means of hydraulic jacks, which cooperate with rigid loading plates to transfer forces to the shear plane. In terms of loading conditions, based on the overlying normal stress (approximately 60–120 kPa) on the Shibanping landslide, the normal stresses selected for the two groups of tests are 80 kPa and 120 kPa, respectively. The normal and tangential loads are transmitted to the specimen through a Φ505 mm rigid bearing plate and its matching reaction device, achieving a uniform and stable loading process. Before the shear test, a graded normal load is first applied to the test body, which is divided into four stages and gradually increased to the preset target value. After each stage of normal loading is completed, the application of shear load commences once the normal deformation of the specimen stabilizes. The application process of shear load adopts the control mode of constant normal stress and graded shear loading. Based on the estimated maximum shear strength of the test, the shear load is divided into 8–12 loading levels, with an interval of approximately 10 min between each level, and the loading rate is adjusted in real-time according to the change of shear displacement. During the entire shearing process, data on normal stress, shear stress, and shear displacement are recorded synchronously to ensure the complete acquisition of the full stress-strain process. The test is judged to reach the failure limit and loading is terminated when the specimen undergoes through-going shear failure, the structural plane completely slides and loses stability along the predetermined shear joint, or the shear stress-displacement curve shows an obvious peak drop trend. After the test, the specimen is flipped to accurately measure the actual area of the shear plane, and the failure morphology of the shear plane is systematically observed and recorded, including the width of the shear zone, changes in the roughness of the shear plane, and the failure mode. This data will provide basic support for subsequent inversion of shear strength parameters and research on the failure mechanism of structural planes.
To ensure accurate and reliable of in-site shear test measurements when using large-stroke hydraulic jacks (RCH-20100 and YMZL30A-100), several critical measures were implemented, such as high-precision transducers, staged loading, and robust mechanical support. For example, eight high-precision displacement transducers (resolution 0.01 mm) were installed in both normal and shear directions, enabling precise tracking of specimen deformation even over large displacements. Similar precision-oriented strategies have been recommended in interface shear testing. For instance, rigorous control of rate and uniform loading in direct shear tests is a standard requirement to achieve acceptable accuracy (friction angle variation of ±1.6° and shear stress deviation below 7%) (Wang Z. M. et al., 2025).
3 Experimental results
3.1 Mechanical properties of sandstone and argillaceous sandstone
To systematically elucidate the mechanical response patterns of different rock types within rock landslides, this study conducted a series of conventional triaxial compression tests on 12 representative rock specimens, including natural sandstone, natural argillaceous sandstone, and their saturated counterparts, under various confining pressures. All tests were performed under displacement-controlled loading conditions, with real-time acquisition of axial stress–strain data.
The stress–strain curves for all tested specimens were compiled and plotted (see Figure 4). The results reveal that the deformation and failure process of the rock masses typically exhibits four evolutionary stages. Initial compaction stage: Pore spaces within the rock are compressed, leading to a rapid increase in axial stress. The stress–strain curve shows a slightly concave profile. Linear elastic stage: The stress–strain relationship becomes approximately linear, reflecting the elastic response of the intact rock structure. Plastic evolution stage: The specimen enters a nonlinear deformation phase as microcracks initiate and propagate, resulting in a gradual reduction in stiffness. Failure stage: After reaching the peak strength (σf), the stress drops rapidly, exhibiting a clear post-peak softening behavior. Each stress–strain curve distinctly identifies key mechanical characteristic points, including the damage stress point (σcd) and the peak strength point (σf), which provide the necessary data foundation and segmentation criteria for subsequent energy evolution analyses.
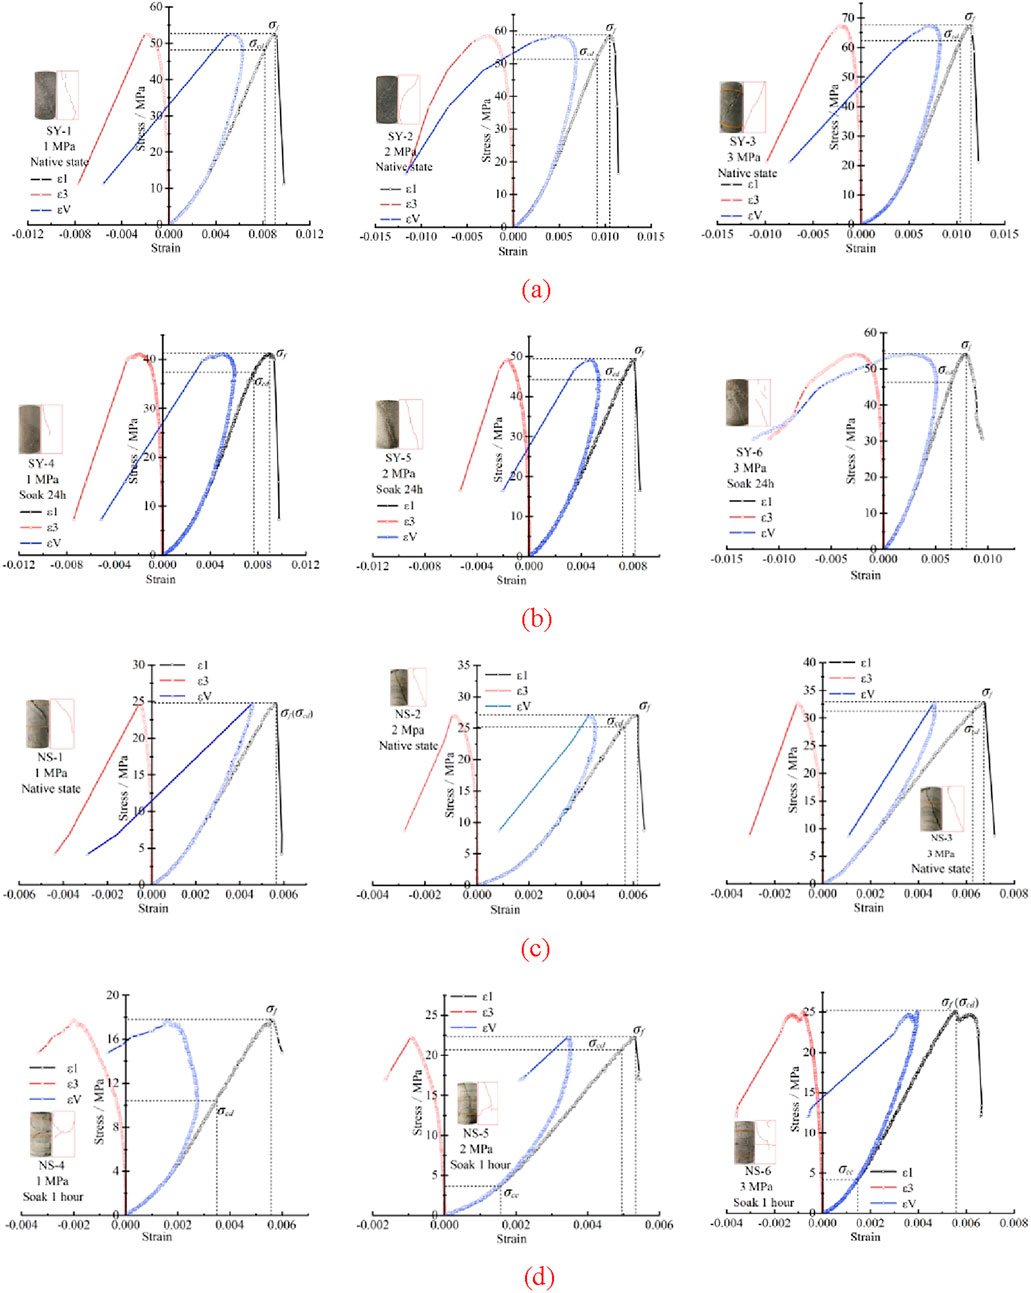
Figure 4. Stress-strain curves (SY: Sandstone, NS: Argillaceous sandstone). (a) Stress-strain curves of sandstone under native state (No. SY-1 ∼ SY-3). (b) Stress-strain curves of sandstone after soak 24 h (No. SY-4 ∼ SY-6). (c) Stress-strain curves of argillaceous sandstone under native state (No. NS-1 ∼ NS-3). (d) Stress-strain curves of argillaceous sandstone after soak 1 h (No. NS-4 ∼ NS-6).
Overall, the mechanical response characteristics vary significantly among different lithologies and saturation states, particularly in terms of peak strength, residual bearing capacity, and post-peak softening behavior. These findings offer valuable reference for identifying deformation mechanisms in landslide rock masses and for the inversion of strength parameters in stability assessments.
In geotechnical engineering, the shear strength parameters of landslide rock masses—particularly cohesion (c) and internal friction angle (φ)—are key indicators for evaluating slope stability and failure mechanisms. Traditionally, these parameters are determined by plotting the Mohr–Coulomb strength envelope, based on the peak principal stress data obtained from conventional triaxial compression tests under different confining pressures.
However, in the triaxial compression tests conducted in this study, it was observed that the rock specimens exhibited pronounced nonlinear behavior during loading, especially under conditions where the axial stress (σ1) greatly exceeds the confining pressure (σ3), i.e., σ1 ≫ σ3. This resulted in unevenly distributed data when constructing Mohr circles, making it difficult to fit a stable and accurate strength envelope.
This issue is particularly evident in weakly cemented rocks or fractured rock masses. The significant strength anisotropy and variability in failure modes tend to amplify fitting errors, thereby reducing the reliability of the derived cohesion and internal friction angle. Moreover, the yielding behavior of rocks under high confining pressure often deviates from the classical linear Mohr–Coulomb criterion, exhibiting nonlinear dilation or contraction characteristics, which further complicates parameter regression.
To improve the accuracy of strength parameter estimation and to avoid the aforementioned challenges, this study adopted a mechanical parameter inversion method recommended in the Standard for Test Methods of Engineering Rock Masses (GB/T 50266-2013). This method does not rely on the complete construction of Mohr circles but instead estimates cohesion and internal friction angle using statistical treatment of the σ1–σ3 data and simplified analytical equations. Although still based on the Mohr–Coulomb strength criterion, this approach is more suitable for cases involving limited confining pressures, small datasets, or pronounced nonlinear behavior in the rock mass.
The specific parameter calculation formulas Equations 1–3 are as follows:
Where: F is the slope of the σ1–σ3 curve, R is the intercept of the σ1–σ3 curve on the σ1-axis, f is the friction coefficient (equal to the tangent of the internal friction angle), c is the cohesion.
Using these formulas, the cohesion and internal friction angle for both natural and water-saturated sandstone and argillaceous sandstone were calculated. The results, along with the elastic modulus and Poisson’s ratio for each condition, are summarized in Table 2.
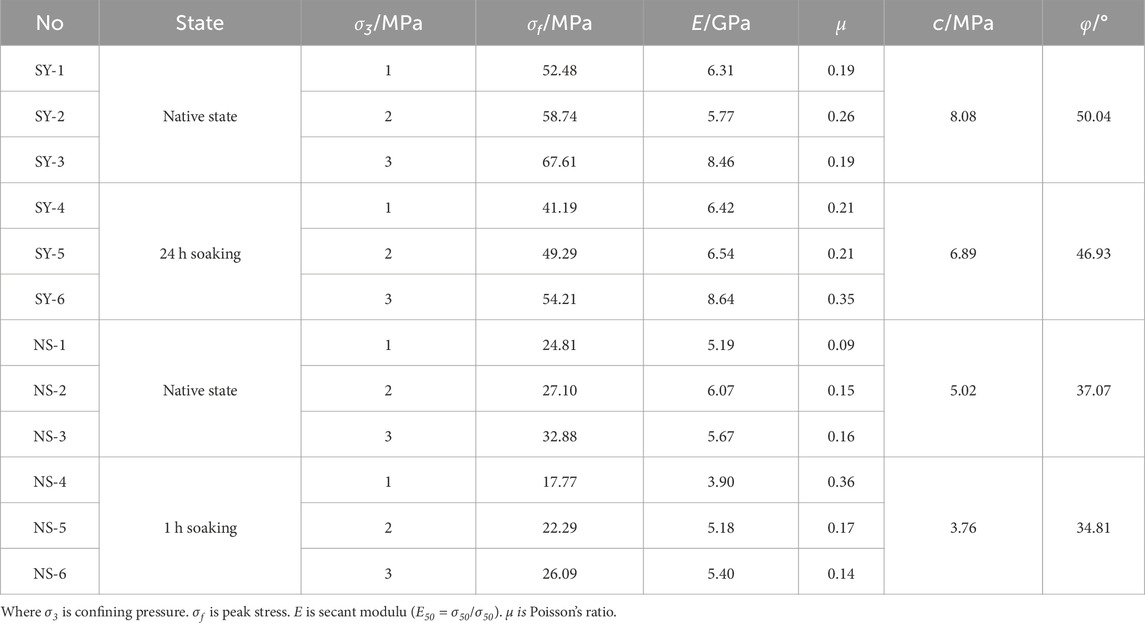
Table 2. Physical and mechanical parameters of sandstone and argillaceous sandstone.
According to Table 2, the cohesion and internal friction angle of sandstone in the natural state are 8.08 MPa and 50.04° respectively. After being saturated with water for 24 h, its cohesion and internal friction angle are 6.89 MPa and 46.93° respectively, with decreases of 1.19 MPa and 3.11°, corresponding to a reduction rate of 15% and 6% respectively. For argillaceous sandstone, in the native state, its cohesion and internal friction angle are 5.02 MPa and 37.07° respectively. After being saturated with water for 1 h, the cohesion and internal friction angle are 3.76 MPa and 34.81° respectively, with decreases of 1.26 MPa and 2.26°, and the reduction rates reach 25% and 6% respectively. Meanwhile, regardless of whether they undergo saturation treatment or not, the values of elastic modulus and internal friction angle of sandstone are both greater than those of argillaceous sandstone.
To further analyze the variation patterns of peak strength, elastic modulus, and Poisson’s ratio, their characteristic diagrams of sandstone and argillaceous sandstone under different states were plotted (Figures 5, 6).
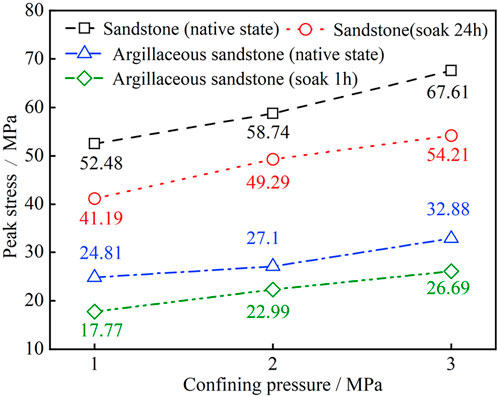
Figure 5. Peak strength characteristics of sandstone and argillaceous sandstone under different states.
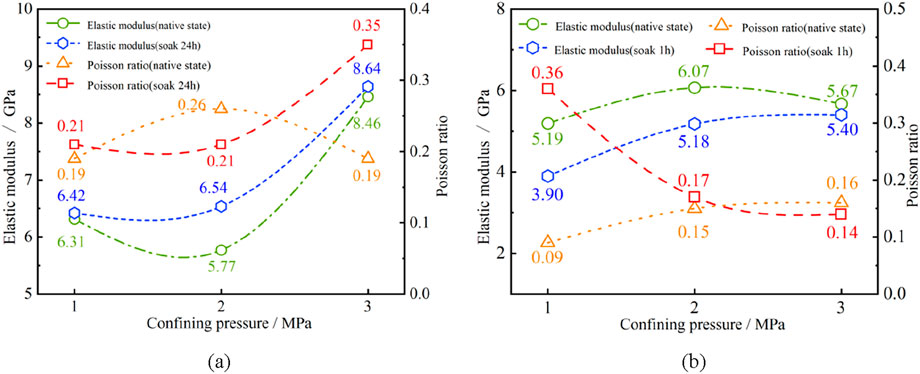
Figure 6. Changes in elastic modulus and Poisson’s ratio of sandstone and mudstone sandstone under different states. (a) Sandstone. (b) Argillaceous sandstone.
As shown in Figure 5, overall, regardless of rock type or water-bearing state, the peak strength increases significantly with the rise of confining pressure, presenting a typical stress-enhanced response. This trend reflects the significant constraining effect of confining pressure on rock failure behavior, which is mainly manifested in the inhibition of lateral expansion of rock mass and the opening of fractures. Quantitative analysis indicates that with the increase of confining pressure, the peak strength of sandstone in the natural state increases from 52.48 MPa to 67.61 MPa, with an increase rate of 28.8%. The peak strength of argillaceous sandstone in the natural state increases from 24.81 MPa to 32.88 MPa, with an increase rate of 32.5%. The strength of sandstone after 24-h immersion decreases by an average of 19.14%, while argillaceous sandstone shows an average strength attenuation of 20.78% within only 1 h. This indicates that argillaceous sandstone responds more rapidly and sensitively to water, further verifying the dominant role of clay minerals in water absorption expansion and structural damage (Huang et al., 2022).
As shown in Figure 6, in the natural state, the elastic modulus of sandstone exhibits a response characteristic of “first decreasing and then increasing” with changes in confining pressure (6.31 GPa → 5.77 GPa → 8.46 GPa). When the confining pressure ranges from 1 MPa to 2 MPa, due to heterogeneity and initial distribution of fractures in sandstone, the confining pressure fails to fully close the micro-fractures. And some fragile areas may induce the propagation of micro-cracks due to boundary disturbance or local stress concentration, resulting in a slight decrease in the overall stiffness of the specimen. When the confining pressure increases from 2 MPa to 3 MPa, the closure of fractures and the compaction of skeleton particles are significantly enhanced, which effectively inhibits the propagation of cracks and improves the contact stiffness between particles, thus leading to a significant increase in the elastic modulus. In the state of being soaked for 24 h, the elastic modulus of sandstone shows an overall monotonous upward trend (6.42 GPa → 6.54 GPa → 8.64 GPa). This indicates that although moisture may cause the softening of cementing materials, the confining pressure effectively inhibits the propagation of micro-cracks induced by water-rock interaction. It promotes the formation of a new stress-balanced structure in the rock mass under the action of stress, thereby improving the overall stiffness. This also verifies the dominant role of confining pressure in the path of “closing fractures—enhancing stiffness—strengthening elastic modulus” (Wong and Baud, 2012).
In the native state, the elastic modulus of argillaceous sandstone exhibits a characteristic of “first increasing and then decreasing” with confining pressure (5.19 GPa → 6.07 GPa → 5.67 GPa). When the confining pressure increases from 1 MPa to 2 MPa, it promotes pore compaction and rearrangement of fine-grained particles, leading to a more compact structure and enhanced stiffness. When the confining pressure ranges from 2 MPa to 3 MPa, clay minerals in the argillaceous components may undergo local disintegration of the microstructure due to slipping and hydration shear, forming shear softening zones. It in turn weakens the overall bearing capacity, manifested as a decrease in elastic modulus. After soaking process, the elastic modulus of argillaceous sandstone shows a continuous upward trend (3.90 GPa → 5.18 GPa → 5.40 GPa) with confining pressure, indicating that confining pressure can effectively counteract the weakening effect caused by hydration softening. It achieves the recovery of effective stress through fracture closure and compaction rearrangement, thereby strengthening the bearing capacity of the rock mass structure.
In the natural state, the Poisson’s ratio of sandstone exhibits a trend of “first increasing and then decreasing” with confining pressure (0.19 → 0.26 → 0.19). At the low confining pressure stage, it promotes the closure of fractures, enhances the structural compactness, and increases the lateral strain, thereby increasing the Poisson’s ratio. However, under high confining pressure, local fragmentation and rearrangement of framework particles may occur, with increased sliding between particles. The structure gradually evolves towards anisotropy, and the lateral deformation capacity is instead restricted, leading to a decrease in Poisson’s ratio (Jaeger et al., 2007). In the saturated state, the Poisson’s ratio of sandstone shows a characteristic of “remaining stable initially and then increasing” (0.21 → 0.21 → 0.35). In the early stage, the confining pressure is low, the closure of microfractures is limited, and the water-containing state does not significantly change the lateral deformation mechanism. As the confining pressure increases, the particle boundary sliding and plastic flow in the hydration-softened regions are enhanced. Coupled with the increased degree of fracture closure, the sensitivity of lateral strain is intensified, resulting in a rapid increase in Poisson’s ratio.
In the natural state, the Poisson’s ratio of argillaceous sandstone exhibits a continuous increase with confining pressure (0.09 → 0.15 → 0.16), which is closely related to the compressibility of its internal clay minerals and their ability to undergo structural reconstruction. When external confining pressure is applied, clay particles tend to generate lateral deformation under the combined effects of volumetric compression and interfacial sliding, leading to a significant increase in Poisson’s ratio (Horn and Deere, 1962). However, after soaking process, the Poisson’s ratio shows a marked decreasing trend (0.36 → 0.17 → 0.14). This is attributed to the intrusion of water, which enhances the frictional resistance between particles. Particularly under high confining pressure, the effective stress increases rapidly, causing the rock mass structure to become increasingly compact and restricting lateral strain, thus resulting in a significant reduction in Poisson’s ratio. This trend reveals the evolutionary path of “compaction → densification → deformation inhibition” of argillaceous components under the coupled environment of high confining pressure and water.
3.2 Mechanical properties of mylonitized interlayer
To investigate the shear strength variation of shear zone soil under different moisture conditions, this study systematically observed the physical composition and structural characteristics of the shear specimens, and combined the shear test results for mechanical parameter analysis.
The results show that all specimens had relatively smooth shear surfaces, which were generally filled with sand particles and fine-grained clay (Figure 7). The clay fraction was distributed in small clusters or as localized dispersions, showing some heterogeneity. The distribution of the filling material was not continuous, with localized areas of enrichment and sparsity, which could potentially affect the stress concentration and the continuity of the failure path during the shear process. Notably, there were no obvious frictional polishing marks or shear bands on the shear surfaces, indicating that the structural surfaces were still in the early stages of low-stress sliding evolution, and shear failure had not yet developed into a distinct plastic slip zone.
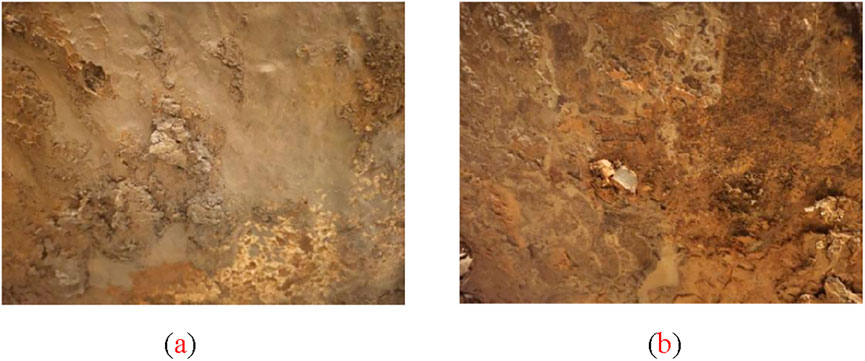
Figure 7. In-situ large direct shear test results. (a) Native sample. (b) Saturated sample.
The mechanical test results are shown in Figure 8. In the natural state, the shear strength of the structural surface was characterized by a cohesion of 15.5 kPa and an internal friction angle of 16°, indicating that the shear surface still had certain shear strength and interface bonding ability. The cohesion was mainly attributed to the cementation between clay particles and the “interlocking” effect caused by the roughness of the structural surface. In the saturated state, the strength of the structural surface decreased significantly, with cohesion dropping to 10.9 kPa and the internal friction angle decreasing to 12°, both of which were significantly lower than in the natural state. This strength degradation can be attributed to several factors: In the saturated state, pore water infiltrated the structural surface and its filling materials, reducing the adsorption force between micro-particles and the effective stress caused by hydrostatic pressure, thereby weakening the bonding ability between the soil particles. The presence of water reduces the friction coefficient between particles. After the clay components soften, a thin clay membrane forms, leading to a decrease in shear strength at the sliding surface. In the saturated state, local structural surfaces may undergo micro-reconstruction, breaking the original shear path and the interlocking relationship between particles, facilitating rapid development of failure in the form of sliding.
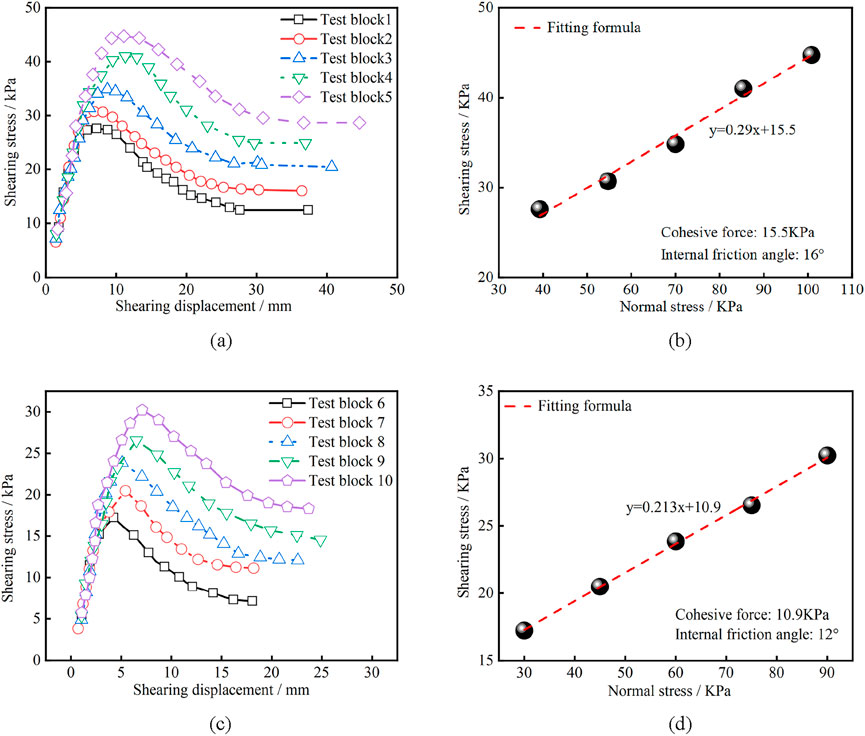
Figure 8. Results of in-situ large direct shear tests. (a) Shear stress vs. shear displacement (Native state). (b) Normal stress vs. shear stress (Native state). (c) Shear stress vs. shear displacement (Saturated state). (d) Normal stress vs. shear stress (Saturated state).
In conclusion, the structural surfaces of shear zone soils exhibit significant mechanical degradation under hydro-mechanical coupling, particularly in the saturated state, where their shear strength is significantly reduced. This reduction in shear strength will greatly affect the overall stability of the landslide mass.
4 Analysis of energy evolution mechanism
The occurrence of rockslides is not only controlled by the lithological characteristics and geological structures of the rock mass, but also closely related to external rainfall infiltration, water migration within the rock mass, and the resulting energy transformation. Particularly under rainfall infiltration conditions, when water enters the rock mass, it significantly alters the pore water pressure, causing the expansion of microcracks and structural damage within the rock mass. This change not only directly affects the stress field and mechanical strength of the rock mass but can also lead to a reduction in material brittleness and softening, thereby decreasing the shear strength of the rock mass and ultimately reducing the overall stability and safety factor of the slope.
This paper aims to explore the energy effects of water on sandstone and argillaceous sandstone, helping to deepen the understanding of how water-rock interactions affect rock mechanical properties. Specifically, it investigates how water, through its influence on energy transformation and distribution, facilitates rock mass instability during landslide events. The core of this process lies in the regulation of energy within the rock mass by water and the differences in the deformation and failure mechanisms of rocks under different moisture conditions.
In general, the energy involved in the process of rock deformation under stress can be divided into the total energy absorbed from the outside (U), elastic strain energy (Ue), and dissipated energy (Ud) that causes internal damage and fracture of the rock. The calculation principles and formulas thereof refer to the literature (Xie et al., 2008; Chen et al., 2016) and will not be elaborated here. According to energy theory and calculation formula, the energy results of sandstone and argillaceous sandstone in their natural state and after soaking can be calculated. The results are shown in Figure 9.
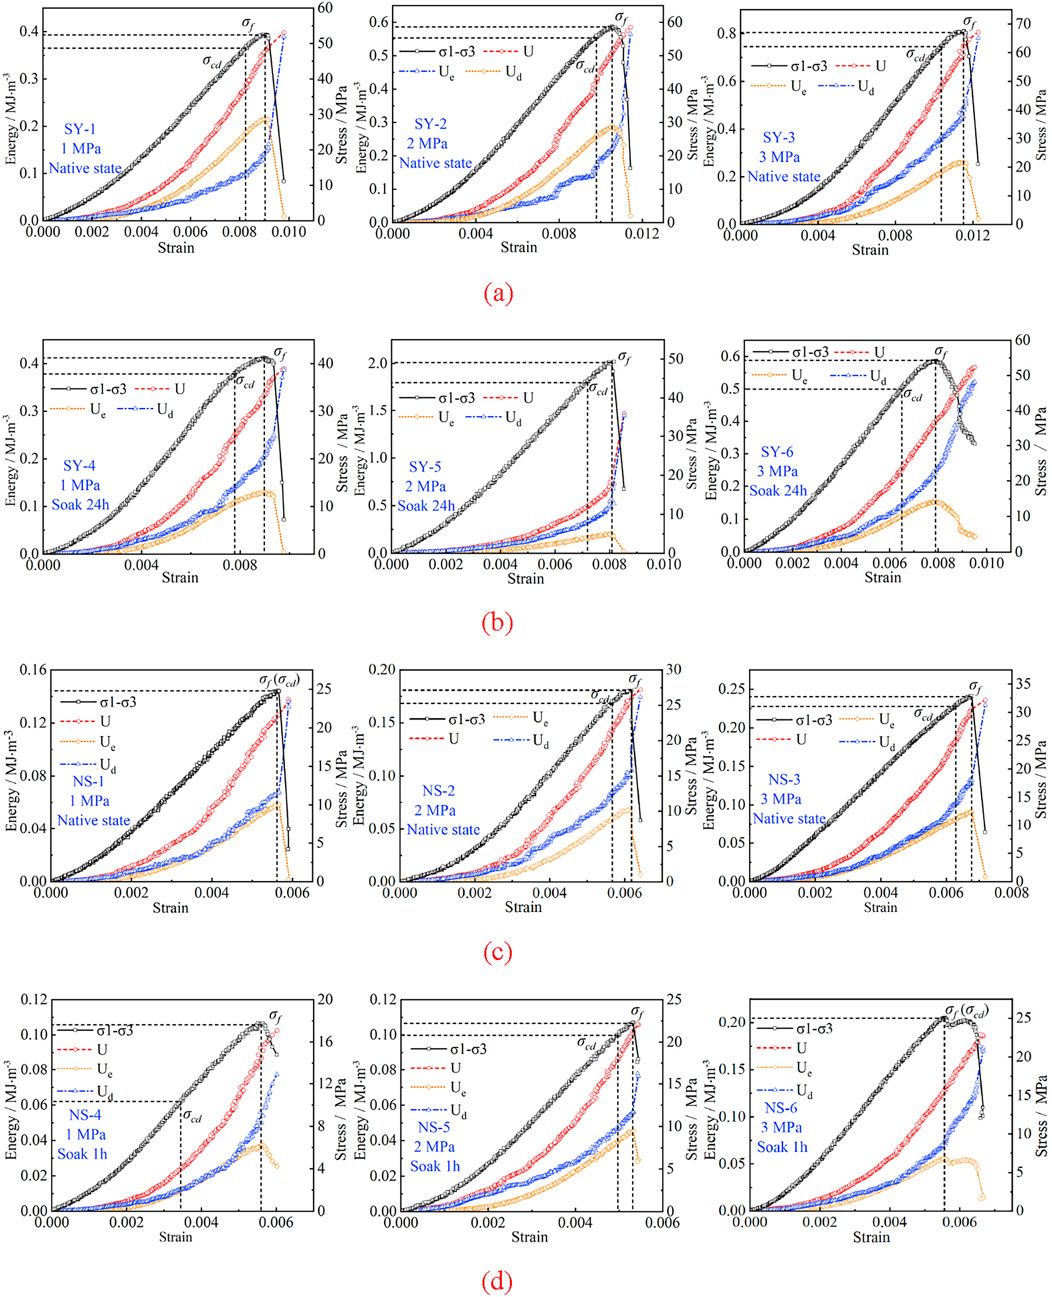
Figure 9. Energy characteristic curves of experimental rocks. (a) Energy characteristic curves of sandstone under native state (No. SY-1 ∼ SY-3). (b) Energy characteristic curves of sandstone after soak 24 h (No. SY-4 ∼ SY-6). (c) Energy characteristic curves of argillaceous sandstone under native state (No. NS-1 ∼ NS-3). (d) Energy characteristic curves of argillaceous sandstone after soak 1 h (No. NS-4 ∼ NS-6).
According to Figure 9, by comparing and analyzing the energy evolution curves of sandstone and argillaceous sandstone under different states, the energy transformation mechanisms of rocks at different loading stages can be clearly identified. Overall, during the initial compaction stage of the rock mass, the total energy U, the elastic strain energy Ue stored within the rock, and the dissipated energy Ud increase slowly. This phenomenon reflects that under low stress, the rock mass’s structure does not experience significant damage or crack extension, and the externally applied energy is mainly stored in the rock as elastic deformation. Subsequently, as the pressure increases, microcracks inside the rock begin to initiate and propagate, leading to a rapid increase in dissipated energy. For instance, when the strain of sandstone reaches 0.004 and that of argillaceous sandstone reaches 0.002, the dissipated energy of both increases rapidly, which is manifested as a continuous increase in the slope of the blue curve in Figure 9. Generally, the process of rock deformation and failure can be divided into several stages: initial compaction, linear elasticity, damage evolution, and instability. The following is an analysis of the energy evolution characteristics combined with each stage of deformation and failure of sandstone and argillaceous sandstone:
Initial Compaction Stage: Microstructural Changes and Energy Storage.
In the initial compaction stage, the externally applied stress has not yet caused significant macroscopic crack damage within the rock mass. During this phase, the rock primarily exhibits elastic deformation, and the externally applied energy U is mainly converted into “stored deformation energy,” causing the elastic energy Ue to gradually increase. At the same time, microcracks, bedding, or particle contact surfaces within the rock may experience slight frictional sliding or localized damage. Although these irreversible processes are relatively minor, they slowly accumulate dissipated energy Ud, resulting in a gradual increase in dissipated energy during this stage.
Elastic Stage: Nonlinear Energy Accumulation Before Macrocrack Propagation.
As the stress continues to be applied, the deformation of the rock mass gradually intensifies. During the elastic stage, since no significant crack extension occurs, the primary accumulation of energy remains in the form of elastic energy Ue, which is reflected in the continuous rise of the curve. However, during this phase, microcracks inside the rock begin to expand, especially at locations of stress concentration, such as particle contact surfaces or structural interfaces. Local microcracks lead to some friction and energy dissipation, which gradually intensifies as stress increases. Consequently, the dissipated energy Ud gradually increases in the elastic stage, even though elastic energy remains the dominant form of energy.
Damage Stage: Nonlinear Energy Release and Instability.
In the damage stage, microcracks rapidly propagate along weak cementation zones, particle interfaces, or pore edges within the rock mass. Localized ruptures occur frequently, leading to a significant increase in dissipated energy Ud during this stage. At the same time, the increment of elastic energy ΔUe begins to decrease, indicating a significant reduction in rock stiffness and a limitation in energy storage. As cracks continue to expand, the rock mass enters the irreversible deformation stage, leading to a decrease in strength and eventually reaching a “critical state” before peak strength. During this stage, energy release intensifies, and the speed of energy release and dissipation increases significantly.
Instability Stage: Macrocrack Formation and Rapid Energy Release.
In the later part of the damage stage, as external loading continues, the rock mass approaches an unstable state, and macrocracks form and rapidly propagate. At this point, the failure process of the rock enters a stage of rapid energy release, where the overall strength of the rock mass rapidly decreases, and the speed of energy release significantly increases, eventually leading to rock mass instability and failure.
The damage and peak point of rocks are key stages in their deformation and failure process. The deformation, strength, and energy characteristics at these two stages are the focus of rock mechanics’ research. To further quantitatively analyze the energy characteristics of sandstone and argillaceous sandstone of Shibanping landslide at the damage and peak stages, their energy magnitudes and proportions have been compiled (Table 3; Figure 10). The specific analysis is as follows.
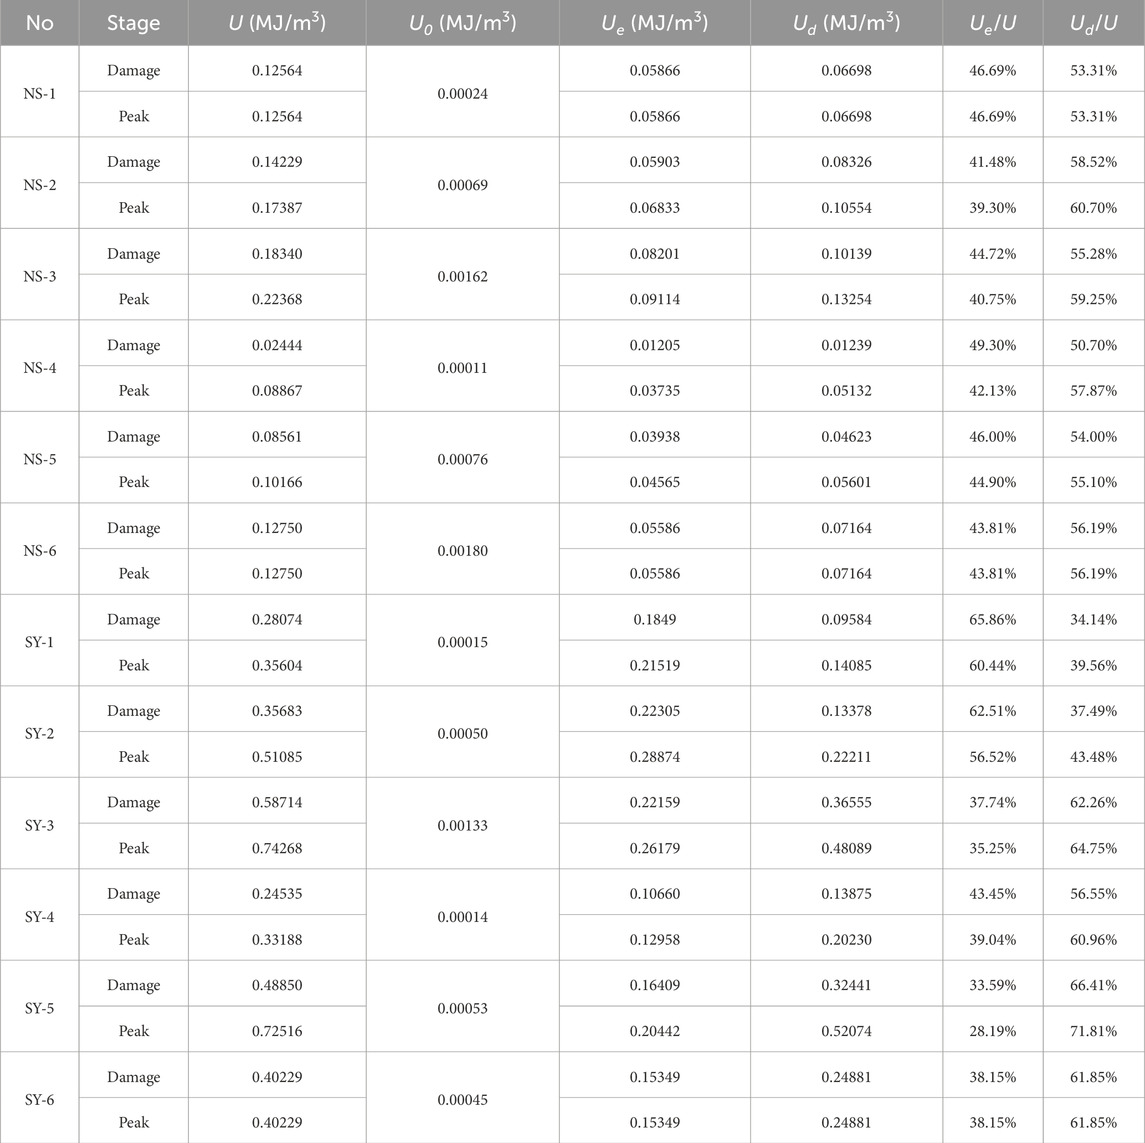
Table 3. Energy values of damage and peak points for sandstone and argillaceous sandstone.
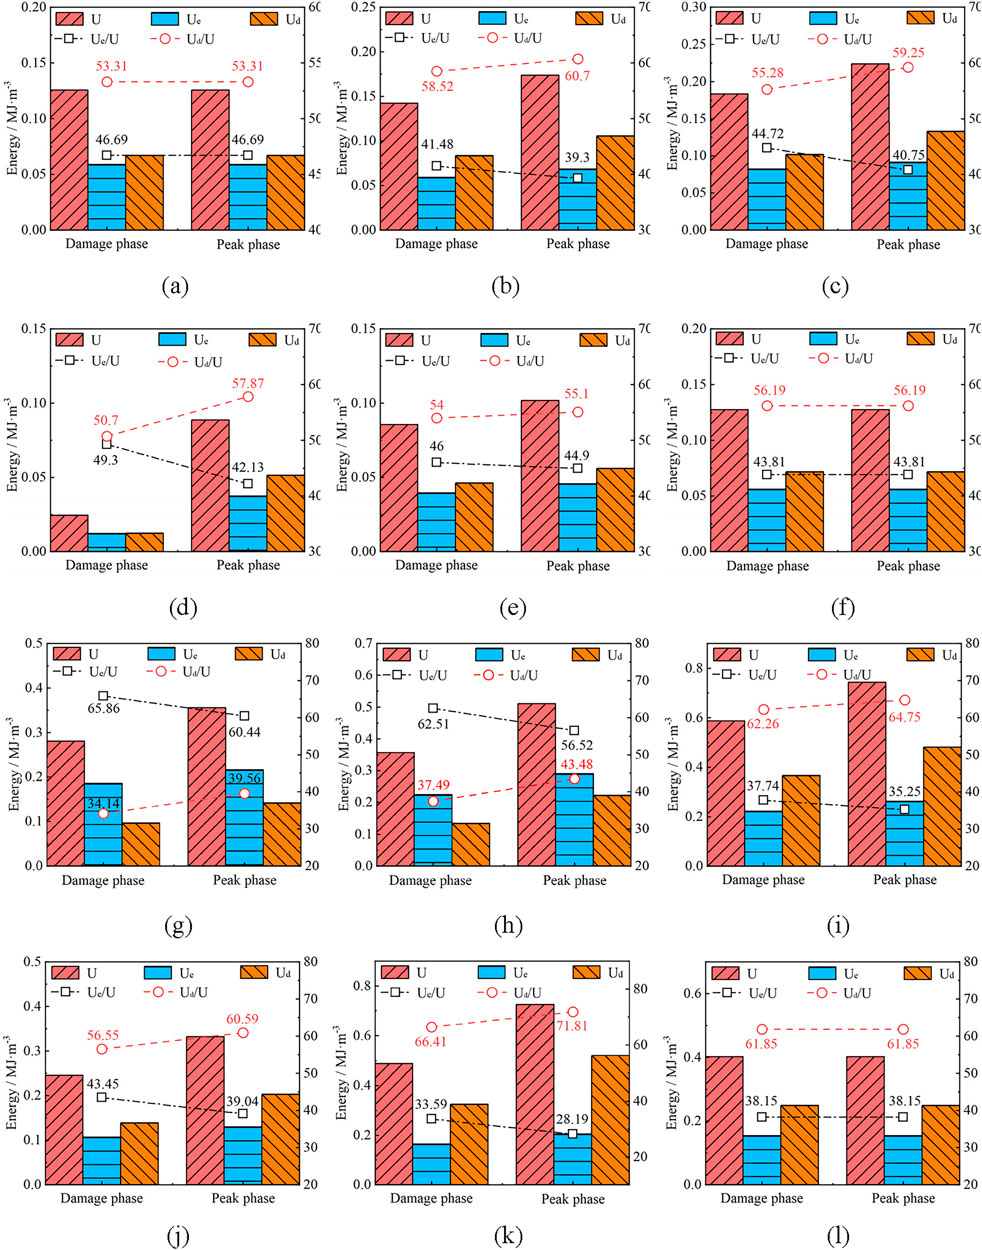
Figure 10. Energy value statistics of damage and peak points for sandstone and argillaceous sandstone. (a) NS-1 energy analysis. (b) NS-2 energy analysis. (c) NS-3 energy analysis. (d) NS-4 energy analysis. (e) NS-5 energy analysis. (f) NS-6 energy analysis. (g) SY-1 energy analysis. (h) SY-2 energy analysis. (I) SY-3 energy analysis. (j) SY-4 energy analysis. (k) SY-5 energy analysis. (l) SY-6 energy analysis.
4.1 Energy evolution characteristics of sandstone
By comparing the energy curves of sandstone in its natural state and after 24 h of immersion, a significant difference between the two states can be observed. In the natural state, sandstone has strong cementation, and the pores and microcracks have not been fully wetted or softened. This allows the rock mass to maintain a higher elastic modulus, with most of the externally applied energy stored in the form of elastic deformation energy Ue. Correspondingly, the dissipated energy Ud is relatively small, mainly due to slow friction and microcrack expansion processes. However, after 24 h of immersion, water penetrates the rock, reducing the inter-particle bonding, softening the cementation, and lowering the rock’s stiffness and elastic modulus, resulting in more energy being converted into dissipated energy. As microcracks expand, frictional sliding and localized instability occur, causing a noticeable increase in dissipated energy Ud, while the growth of elastic energy Ue becomes relatively smaller.
4.2 Energy evolution characteristics of argillaceous sandstone
The energy evolution characteristics of argillaceous sandstone differ from those of sandstone. Whether in its natural state or after 24 h of immersion, the dissipated energy Ud of argillaceous sandstone is always higher than the elastic energy Ue. This phenomenon is primarily due to the clay minerals in argillaceous sandstone. The low cementation strength and looser structure of clay minerals lead to a lower overall stiffness. The development of fractures and significant friction between particles in argillaceous sandstone makes the rock mass more susceptible to sliding, bond failure, and friction during loading, accompanied by energy release. Even after 1 h of immersion, the clay minerals absorb water, causing volume expansion and softening, which leads to more localized ruptures and increased particle sliding, further exacerbating the increase in dissipated energy.
4.3 Analysis of total energy and energy proportion
By calculating the total energy U, elastic energy Ue, and dissipated energy Ud at the damage and peak points for different specimens, and summarizing the changes through energy proportion (see Table 3), the energy transformation characteristics of the rock mass under different states can be more clearly revealed. Figure 10 shows the trend of energy proportion changes. According to Figure 10 and Table 3, the Ue/U ratio of argillaceous sandstone ranges from 39.3% to 46.69%, showing a decreasing trend with the increase of confining pressure. The maximum ratio occurs at both the damage point and peak point of NS-1, reaching 46.49%, while the minimum ratio appears at the peak point of NS-2. The Ud/U ratio of argillaceous sandstone is between 50.7% and 60.7%, and it tends to increase with the rise of confining pressure. For example, under the condition of 1 h saturation, the Ud/U ratios of argillaceous sandstone at the damage point under different confining pressures are 50.7%, 54%, and 56.19% respectively, with an increase of 5.39%.
The Ue/U ratio of sandstone ranges from 28.19% to 65.86%, also showing a decreasing trend as confining pressure increase. The maximum ratio is found at the damage point of SY-1, and the minimum ratio is at the peak point of SY-5. The Ud/U ratio of sandstone is between 34.14% and 71.81%, and it tends to increase with the increase of confining pressure (except for SY-6, which remains at 61.85%).
By comparing the energy evolution curves in Figures 9, 10, it is clear that the damage point and peak point for samples NS-1, NS-6, and SY-6 coincide, exhibiting a “discontinuous” characteristic in the stress and energy responses. This phenomenon can be attributed to the heterogeneity and brittleness of the rock mass material: during the loading process, once local microcracks initiate and quickly coalesce, the stored elastic strain energy is rapidly released, bypassing the stable crack propagation stage and directly entering macro-damage. This typical “brittle fracture” behavior means that the rock mass does not display a significant progressive damage process, and the damage point and peak point tend to coincide in their physical response. This reflects the high sensitivity of certain specimens to local micro-damages and their low ductility (Brace, et al., 1966).
However, from an overall trend, regardless of lithology (sandstone or argillaceous sandstone) and state (natural or soaked), most samples show a continuous increase in total energy U from the damage point to the peak point. This reflects that before the peak strength is reached, the rock mass continues to absorb external energy to maintain structural stability, enhancing its temporary bearing capacity through skeleton compression and delayed crack propagation.
From the perspective of energy composition, the loading process from the damage point to the peak point shows the following characteristics: The elastic energy Ue and its proportion gradually decrease, indicating that the rock’s ability to store elastic deformation energy is weakening, and the rock stiffness is declining. Some energy begins to be released in an irreversible manner. The dissipated energy Ud and its proportion continue to increase, revealing that the expansion of microcracks, frictional sliding, and particle shearing, as irreversible processes inside the rock, are significantly enhanced. These energy dissipation mechanisms become the dominant factors driving rock mass instability and failure. This energy transformation pattern clearly reflects the mechanical evolution path of the rock mass from “energy storage-dominated” to “energy dissipation-dominated,” i.e., after damage occurs, the rock mass must continue to absorb energy to maintain its bearing capacity. However, due to structural damage and local destruction accumulation, the energy is primarily released in the form of dissipation, which gradually pushes the rock mass toward its limit state.
By comparing the energy curves of the natural state and the soaked state, it can further be observed that the total energy of the soaked rock samples is significantly lower than that of the natural state, and the trend of decreased elastic energy proportion and increased dissipated energy proportion is still apparent. This phenomenon suggests that water significantly weakens the rock’s energy bearing capacity and energy storage ability, lowering the stress accumulation threshold of the rock mass during loading. The cemented minerals inside the rock are softened or dissolved by the water, making crack propagation easier and premature particle sliding, further exacerbating the release of energy in the form of dissipation.
Particularly for argillaceous sandstone, the clay minerals, which are widely developed within the rock, tend to expand upon water absorption, leading to the softening and instability of the cemented structure. This makes cracks more easily propagate and local damage more concentrated, causing dissipated energy to dominate the energy composition. This phenomenon indicates that the intrusion of water not only triggers the deterioration of the rock’s mechanical properties but also accelerates the evolution of energy dissipation mechanisms at the microstructural level, further shortening the stable bearing phase of the rock mass.
Regardless of lithology, the proportion of elastic energy within the energy structure continues to decrease, while the proportion of dissipated energy continuously increases, becoming the dominant form of energy as the rock mass gradually becomes unstable. The effect of water amplifies the dissipation mechanism, especially for mudstone, where the rock mass is more likely to enter the crack propagation and structural failure stages prematurely. The energy evolution trend reflects the macroscopic response of the microstructural failure mechanisms in the rock mass, providing important theoretical support for understanding the instability incubation process of rockslides and predicting key critical points.
5 Discussions and analysis
5.1 Influence of water on rock masses
Most of the sliding zone rock mass lies below the groundwater level, being significantly affected by self-weight and water-rock interactions. As water infiltrates along fractures into the sliding surface, its hydration effect will induce structural reconstruction of the rock and soil on the sliding surface. The results of this study show that water significantly weakens the peak strength of sandstone and argillaceous sandstone, but has a certain increasing effect on the elastic modulus. This may be caused by the superposition of multiple mechanisms.
On the one hand, the increase in moisture generally leads to a reduction in the peak strength of sandstone, which is caused by the lubricating, softening, and mineral hydration effects of water. For example, when water enters the pores of the rock, it can cause physical softening or chemical dissolution of cementing materials (such as calcite and clay minerals), thereby damaging the connections between particles (Zhou et al., 2023). Meanwhile, water-rock interactions induce micro-expansion of structural planes and the interconnection of fractures, making the fracture paths more continuous. Finally, the presence of water reduces the interfacial friction coefficient between particles, and in particular, forms sliding films in argillaceous rocks, significantly accelerating the sliding instability of shear planes.
On the other hand, in this study, the increase in water content led to an increase in the elastic modulus of sandstone and argillaceous sandstone, which is inconsistent with conventional understanding. The analysis suggests that this may be due to the effects of water on their pore structure and inter-particle interactions, resulting in an enhancement of the overall resistance to elastic deformation. The possible reasons are reflected in the following two aspects: First, sandstone is a typical particle-cemented porous medium. The transition from “air-filled” to “water-filled” pores significantly reduces the compressibility of the pores. Generally, sandstone contains a large number of connected or isolated pores (with a porosity usually ranging from 10% to 30%). As water content increases, water gradually displaces the air in the pores, forming “water-saturated or partially saturated pores.” Second, water improves the contact between particles: water films transmit stress and reduce stress concentration. With the increase in water content, a continuous water film forms on the surface of particles (especially since quartz, feldspar particles, and clay cements commonly found in sandstone all have a certain degree of hydrophilicity). These water films can act as “stress transmission media,” transforming the “point/line contact” between particles into “surface-contact stress transmission,” thereby enhancing the resistance to deformation.
The phenomenon observed in this study, whereby increased water content leads to differential changes in the peak strength and elastic modulus of sandstone and argillaceous sandstone, is relatively uncommon. This constitutes a problem worthy of in-depth investigation. The authors have only conducted a preliminary analysis; subsequent research will further explore its underlying mechanisms by integrating more experimental data and advanced technical methods. It is also hoped that more scholars will pay attention to this intriguing issue.
It is noteworthy that the peak strength of sandstone is consistently higher than that of argillaceous sandstone, which is primarily attributed to the fundamental differences in mineral composition and structural characteristics between the two types of rocks. Sandstone is predominantly composed of hard cementing minerals such as quartz and feldspar, with dense intergranular contacts, high stability of pore structure, and superior mechanical integrity. In contrast, argillaceous sandstone is rich in clay minerals like illite and kaolinite, which exhibit weak cementation between particles, a loose structure, high porosity, and significant water sensitivity. These characteristics make it prone to structural reconstruction, softening, and disintegration under stress or water exposure. Consequently, even under the same confining pressure, its strength level is significantly lower.
5.2 Influence of water on sliding zone soil
The focus of previous sections has been on intact rocks (sandstone and argillaceous sandstone). However, in the Shibanping landslide slip zone, the sliding-zone soil plays a critical role in controlling landslide initiation and progression. Studies on similar landslide shear zones demonstrate that sliding soils exhibit markedly low peak shear strength and pronounced strain-softening behavior, which are essential for understanding landslide reactivation and stability (Zhu et al., 2022).
Moreover, research involving shear and interface tests on sliding-zone soils under varying moisture conditions highlights how water significantly weakens shear strength—particularly in soil–bedrock interfaces—providing important insights into failure mechanisms (Zhang M. X. et al., 2025).
Ring shear and direct shear testing have been employed to characterize sliding-zone soils. These tests capture key parameters such as cohesion and friction angle under different saturation levels and shear rates. For example, direct shear testing combined with numerical simulation (PFC) reveals that seepage causes strain-softening and notable reductions in friction angle, especially under increased seepage stress (Wang et al., 2024). Similarly, ring shear tests show that both water content and shear rate critically influence shear behavior—higher shear rates and moisture content reduce shear strength and facilitate sliding (Jeong, 2022).
In the context of this study, the significance of shear tests on sliding-zone soil lies in their ability to capture residual strength and softening characteristics under realistic stress and moisture conditions. These parameters complement rock triaxial data by representing the mechanical behavior of actual shear surfaces within landslide zones. Ultimately, they enable a more comprehensive and accurate assessment of overall slope stability and failure mechanisms.
6 Conclusion
This study systematically investigates the mechanical properties of rock masses and shear zone soils in rock landslide under different soaking durations, revealing the strength evolution laws and mechanisms of key materials within the landslide body under prolonged rainfall conditions. The main conclusions are as follows:
1. Both shear zone soils and rock masses exhibit significant mechanical property degradation when saturated. The shear strength of shear zone soils decreases significantly with increased saturation, with cohesion and internal friction angle decreasing by 29.7% and 25%, respectively. This degradation is primarily influenced by pore water softening, lubrication effects, and structural disturbances. Rock masses, particularly argillaceous sandstones, are highly sensitive to water, with a short soaking duration (2 h) causing microstructural damage, resulting in noticeable strength reduction and increased deformation.
2. The strength and deformation parameters of rock masses are jointly controlled by confining pressure and water content. Increased confining pressure effectively constrains crack propagation, enhancing the overall strength and stiffness of the rock mass, while water content weakens inter-particle cementation and friction, reducing peak strength. Specifically, argillaceous sandstone exhibits the largest change in elastic modulus under confining pressures of 1 MPa–3 MPa, indicating its weakest structural stability under wet-mechanical coupling conditions.
3. Natural sandstone exhibits a complete energy evolution process of accumulation, release, and dissipation during loading, while argillaceous sandstone shows brittle failure characteristics with low peak strength and high dissipation. The introduction of water significantly alters the energy distribution of the rock mass, inducing premature instability, manifested as early crack propagation and enhanced strain localization.
4. The proposed time-dependent saturation treatment method effectively controls the intensity of water-rock interaction. Specifically, in the argillaceous sandstone tests, an optimal soaking duration of 1 h was identified, ensuring the samples reach a fully saturated state while retaining their structural integrity, providing reliable support for subsequent mechanical testing of the rock mass.
5. The research findings provide a mechanical foundation for understanding the disaster mechanisms of rainfall-induced landslides and engineering responses. By constructing the “strength-time-saturation” response relationship for typical rock masses and shear zone soils, the study offers experimental parameter support for landslide risk assessment models, aiding in improving the accuracy of rainfall-induced landslide early warning systems and the adaptability of mitigation measures.
Finally, it should be noted that in this paper, after water immersion treatment, the peak strength of sandstone and argillaceous sandstone decreases, while their elastic modulus increases. This phenomenon is relatively uncommon. Although this paper has preliminarily analyzed the possible reasons in the discussion, further experimental and numerical simulation studies are needed to deeply reveal the underlying mechanism. Meanwhile, the relationship between Ud and damage evolution can be further quantified theoretically.
Data availability statement
The raw data supporting the conclusions of this article will be made available by the authors, without undue reservation.
Author contributions
MG: Funding acquisition, Writing – original draft. BH: Supervision, Writing – review and editing. WL: Supervision, Writing – original draft. WG: Supervision, Writing – review and editing. SB: Investigation, Writing – original draft. LW: Funding acquisition, Writing – original draft. RB: Formal Analysis, Writing – original draft. LZ: Formal Analysis, Funding acquisition, Methodology, Writing – original draft. ZH: Funding acquisition, Methodology, Writing – original draft. FL: Funding acquisition, Methodology, Writing – original draft.
Funding
The author(s) declare that financial support was received for the research and/or publication of this article. This research was supported by Humanities and Social Sciences Youth Foundation, Ministry of Education (23YJCZH051), the Opening Foundation of Key Laboratory of Landslide Risk Early-warning and Control, Ministry of Emergency Management (Chengdu University of Technology) (KLLREC2022K003), the Opening Foundation of State Key Laboratory of Geological Hazard Prevention and Geoenvironmental Protection (SKLGP2024K007), the Opening Foundation of Major Hazard Measurement and Control Key Laboratory of Sichuan Province (KFKT2023-04), Natural Science Foundation of Sichuan Province (2024YFFK0111, 2024NSFSC0971, 2025ZNSFSC0416) and Sichuan Provincial ‘Bidding for Talents’ Project (2025YFNH0008).
Conflict of interest
The authors declare that the research was conducted in the absence of any commercial or financial relationships that could be construed as a potential conflict of interest.
Generative AI statement
The author(s) declare that no Generative AI was used in the creation of this manuscript.
Any alternative text (alt text) provided alongside figures in this article has been generated by Frontiers with the support of artificial intelligence and reasonable efforts have been made to ensure accuracy, including review by the authors wherever possible. If you identify any issues, please contact us.
Publisher’s note
All claims expressed in this article are solely those of the authors and do not necessarily represent those of their affiliated organizations, or those of the publisher, the editors and the reviewers. Any product that may be evaluated in this article, or claim that may be made by its manufacturer, is not guaranteed or endorsed by the publisher.
References
Brace, W. F., Paulding, B. W., and Scholz, C. H. (1966). Dilatancy in the fracture of crystalline rocks. J. Geophys. Res. 71 (16), 3939–3953. doi:10.1029/JZ071i016p03939
Chen, Z. Q., Li, T. B., and Chen, G. Q. (2016). Experimental study on energy evolution of sandstone under different stress paths. Eng. Mech. 33 (6), 120–128. doi:10.6052/j.issn.1000-4750.2014.10.0860
Chen, G. Q., Zhang, Y., Xu, Q., Wu, X., Meng, K., and Fan, H. (2025). A novel brittle evaluation method considering the difference in energy evolution during rock failure process. Eng. Fail. Anal. 170, 109280. doi:10.1016/j.engfailanal.2025.109280
Cui, F. P., Xiong, C., Wu, Q., Zhou, Y., Hou, C., Fan, L., et al. (2025). Dynamic mechanism triggering the catastrophic xinjing landslide in alxa, Inner Mongolia, China. Eng. Geol. 346, 107911. doi:10.1016/J.ENGGEO.2025.107911
Fredlund, D. G., and Xing, A. (1994). Equations for the soil-water characteristic curve. Can. Geotechnical J. 31 (4), 521–532. doi:10.1139/t94-061
Gao, M. B., Li, T. B., Zhang, L., Gao, Y., He, Z., and Zhong, Y. (2024). Fracture mechanism and constitutive model considering post-peak plastic deformation of marble under thermal–mechanical action. Geomechanics Geophys. Geo-Energy Geo-Resources 10 (1), 168. doi:10.1007/s40948-024-00881-8
Horn, H. M., and Deere, D. U. (1962). Frictional characteristics of minerals. Geotechnique 12 (4), 319–335. doi:10.1680/geot.1962.12.4.319
Huang, T., Wang, L., Li, J., Zhang, B., Wang, X., and Xu, X. (2022). Study on mechanical properties and fracture surface characteristics of argillaceous sandstone under different stress paths. Sci. Rep. 12 (1), 16072. doi:10.1038/s41598-022-20433-y
Jaeger, J. C., Cook, N. G. W., and Zimmerman, R. (2007). Fundamentals of rock mechanics. 4th ed. Malden, MA: Blackwell Publishing.
Jeong, S. W. (2022). Determining the shear resistance in landslides with respect to shear displacement and shearing time in drainage-controlled ring shear tests. Appl. Sci. 12 (11), 5295. doi:10.3390/app12115295
Ji, X., Liang, Y., Wang, J., Yang, S., and Ou, G. q. (2016). Numerical simulation for different motion forms of sliding soil along slope with PFC3D. J. Mt. Sci. 13, 146–156. doi:10.1007/s11629-014-3401-x
Li, Z., and Zhou, P. (2023). Research progress of coarse-grained slip zone soil in China. Nat. Hazards 118 (1), 1–29. doi:10.1007/S11069-023-06005-X
Liao, K., Wu, Y., Miao, F., Li, L., and Xue, Y. (2021). Effect of weakening of sliding zone soils in hydro-fluctuation belt on long-term reliability of reservoir landslides. Bull. Eng. Geol. Environ. 80, 3801–3815. doi:10.1007/S10064-021-02167-9
Lin, Q. B., Cao, P., Wen, G. P., Meng, J., Cao, R., and Zhao, Z. (2021). Crack coalescence in rock-like specimens with two dissimilar layers and pre-existing double parallel joints under uniaxial compression. Int. J. Rock Mech. Min. Sci. 139, 104621. doi:10.1016/j.ijrmms.2021.104621
Lin, Q. B., Zhang, S. C., Lin, H., Zhang, K., Fan, W., Huang, C., et al. (2025). Failure behavior of jointed rock masses containing a circular hole under compressive-shear load: insights from DIC technique. Theor. Appl. Fract. Mech. 139 (B), 105089. doi:10.1016/j.tafmec.2025.105089
Liu, K., Wang, X., Lian, B., Zhu, Z., and Xue, C. (2022). Study on mechanical behavior of slip zone soils under different factors—A case study. Front. Earth Sci. 10, 847772. doi:10.3389/FEART.2022.847772
Miao, H. B., and Wang, G. H. (2021). Effects of clay content on the shear behaviors of sliding zone soil originating from muddy interlayers in the three gorges reservoir, China. Eng. Geol. 294, 106380. doi:10.1016/J.ENGGEO.2021.106380
Miao, H. B., and Wang, G. H. (2023). Prediction of landslide velocity and displacement from groundwater level changes considering the shear rate-dependent friction of sliding zone soil. Eng. Geol. 327, 107361. doi:10.1016/J.ENGGEO.2023.107361
Nian, T. K., Feng, Z. K., Yu, P. C., and Wu, H. J. (2011). Shear test on mixed slide-zone soils of landslide under different water content. Adv. Mater. Res. 301, 1208–1213. doi:10.4028/www.scientific.net/AMR.301-303.1208
Qi, C., Wang, B., Mao, Y., Li, Z., Qi, T., Hu, G., et al. (2025). Effect of thickness and inclination angle of weakly cemented interlayer on fracture development and fracture energy evolution of rock mass. Sci. Rep. 15 (1), 14999. doi:10.1038/S41598-025-00046-X
Tang, M., Zhang, T., Li, Y., Wang, Q., Wang, M., Chen, Y., et al. (2025). Investigation on fracture propagation and energy evolution of ultra-low permeability sandstone during reservoir pressurization. Rock Mech. Rock Eng. 58, 8935–8950. doi:10.1007/S00603-025-04607-4
Wang, Y., Liu, J. Z. X., and Yuan, S. J. (2017). Estimation of probability distribution of shear strength of slip zone soils in Middle Jurassic red beds in wanzhou of China. Landslide 14, 2165–2174. doi:10.1007/s10346-017-0890-z
Wang, R., Wang, G., Zhang, L., Sun, F., and Li, B. (2024). Macro-micro damage and energy release rates of fractured sandstone subjected to dry-wet cycles. J. Rock Mech. Geotechnical Eng. 17 (6), 3563–3576. doi:10.1016/J.JRMGE.2024.09.055
Wang, Q. Y., Tang, H. M., An, P. J., Fang, K., Zhou, B., and Zhang, X. (2025). Shear strength and permeability in the sliding zone soil of reservoir landslides: insights into the seepage-shear coupling effect. J. Rock Mech. Geotechnical Eng. 17 (4), 2031–2040. doi:10.1016/J.JRMGE.2024.04.033
Wang, Z. M., Qi, C. G., Zhang, Z. C., Huang, R., Guo, C., Dong, L., et al. (2025). Improved in-situ direct shear test of rock mass structural plane and its application to stability analysis of bedding slope. Case Stud. Constr. Mater. 23, e04976. doi:10.1016/j.cscm.2025.e04976
Wong, T., and Baud, P. (2012). The brittle-ductile transition in porous rock: a review. J. Struct. Geol. 44, 25–53. doi:10.1016/j.jsg.2012.07.010
Xiang, X. H., Li, Z. Y., and Zhang, X. T. (2013). Influence of rainfall infiltration on landslide treatment engineering. Adv. Mater. Res. 709, 936–941. doi:10.4028/www.scientific.net/AMR.709.936
Xie, H. P., Ju, Y., and Li, L. Y. (2008). Energy mechanism of deformation and failure of rock masses. Chin. J. Rock Mech. Eng. 27 (9), 1729–1740. doi:10.3321/j.issn:1000-6915.2008.09.001
Xue, Y. R., Li, Z. L., Song, D. Z., He, X., Wang, H., Zhou, C., et al. (2023). A method to predict rockburst using temporal trend test and its application. J. Rock Mech. Geotechnical Eng. 16 (3), 909–923. doi:10.1016/j.jrmge.2023.07.017
Yang, J. Q., Cui, Z. D., Xi, B. L., and Song, W. (2024). Experimental study on cyclic triaxial behaviors of saturated soft soil considering time intermittent and variable confining pressure. Soil Dyn. Earthq. Eng. 179, 108508. doi:10.1016/J.SOILDYN.2024.108508
Yang, Y., Choi, H., Lee, J., Choe, Y., and Won, J. (2025). Impact of flow direction on suffusion of sand-clay mixtures under variably saturated conditions. J. Rock Mech. Geotechnical Eng. 17 (4), 2511–2525. doi:10.1016/J.JRMGE.2024.05.038
Zhang, M. X., Wang, W. Z., Hao, Y. B., Liu, X., Zhang, R., Tian, Z., et al. (2025). Study on the formation mechanisms and stability of a gently inclined and shallow accumulative landslide. Sci. Rep. 15, 15246. doi:10.1038/s41598-025-98031-x
Zhang, Y., Ma, C. C., Zou, M. L., Li, T., Zeng, P., Zhao, Y., et al. (2025a). Thermomechanical failure analysis of sandstone subjected to high ground temperature. J. Rock Mech. Geotechnical Eng. 17 (6), 3524–3545. doi:10.1016/j.jrmge.2025.04.004
Zhang, Y., Meng, K., Fan, X. M., Chen, G., Zheng, X., Li, S., et al. (2025b). Advancements in laboratory studies of layered rock masses for deep engineering: insights and future perspectives. J. Earth Sci. 36 (3), 1334–1340. doi:10.1007/s12583-025-2032-1
Zhou, Z., Shen, J. H., Tang, S., Duan, W., Wang, J., Yang, R., et al. (2021). Analysis of weakening law and stability of sliding zone soil in thrust-load-induced accumulation landslides triggered by rainfall infiltration. Water 13 (4), 466. doi:10.3390/W13040466
Zhou, S., Sun, Q., Zhang, H., Meng, H., Gao, Q., and Zhou, Y. (2023). Elemental dissolution characteristics of granite and gabbro under high-temperature water-rock interactions. Sci. Total Environ. 897, 165455. doi:10.1016/j.scitotenv.2023.165455
Keywords: landslide, mechanical properties, saturation duration, energy evolution, confining pressure
Citation: Gao M, He B, Li W, Guo W, Bai S, Wang L, Bian R, Zhang L, He Z and Lu F (2025) Study on mechanical properties of rock and soil mass in the slip zone of shibanping landslide. Front. Earth Sci. 13:1675192. doi: 10.3389/feart.2025.1675192
Received: 29 July 2025; Accepted: 15 September 2025;
Published: 29 September 2025.
Edited by:
Wenling Tian, China University of Mining and Technology, ChinaReviewed by:
Qibin Lin, University of South China, ChinaKun He, Southwest Jiaotong University, China
Peng Li, Chang’an University, China
Copyright © 2025 Gao, He, Li, Guo, Bai, Wang, Bian, Zhang, He and Lu. This is an open-access article distributed under the terms of the Creative Commons Attribution License (CC BY). The use, distribution or reproduction in other forums is permitted, provided the original author(s) and the copyright owner(s) are credited and that the original publication in this journal is cited, in accordance with accepted academic practice. No use, distribution or reproduction is permitted which does not comply with these terms.
*Correspondence: Binbin He, YmluYmluaGVAdWVzdGMuZWR1LmNu; Wenhui Li, MTg3NjYyNjU4MTVAMTYzLmNvbQ==