 Juncheng Dai
 Wenzheng Lv1
- 1Exploration and Development Research Institute, PetroChina Southwest Oil and Gasfield Company, Chengdu, Sichuan, China
- 2PetroChina Southwest Oil and Gasfield Company, Chengdu, Sichuan, China
With the increasing demand for unconventional resources, accurate characterization of tight sandstone gas reservoirs has become crucial. This study introduces an innovative multi-wave seismic sedimentology approach integrating P-wave, converted S-wave (PS-wave), and pseudo-S-wave attributes to enhance lithological prediction and reservoir heterogeneity analysis in the Jurassic Shaximiao Formation, Sichuan Basin. By combining 90° phase rotation, high-frequency stratal slicing, and differential PP- and PS-wave amplitude and phase analysis, the workflow effectively resolves vertically stacked sand bodies and identifies high-porosity “sweet spots.” Results demonstrate that PS-wave data provide stable polarity responses for lithology discrimination, while pseudo-S-wave attributes improve vertical resolution for multi-phase channel identification. Field validations confirm >90% accuracy in sand body geometry predictions, with horizontal drilling achieving 87% reservoir encounter rates. The methodology overcomes limitations of conventional P-wave methods in low-impedance-contrast reservoirs and offers a cost-effective solution for early-phase exploration with limited well data. This integrated approach advances tight gas exploration by enabling robust characterization of complex geological anomalies and heterogeneous systems.
1 Introduction
With the increasing scarcity of conventional natural gas resources, tight sandstone gas, as a crucial unconventional resource, has garnered significant attention in exploration and development. China possesses abundant tight sandstone gas reserves, widely distributed across major gas-bearing basins, particularly in the Sichuan Basin, Ordos Basin, and Tarim Basin. In recent years, substantial progress has been achieved in the exploration of tight sandstone gas reservoirs in China, with continuously increasing proven geological reserves and annual production growth, positioning it as a pivotal domain for natural gas reserve enhancement and production growth (Zhang et al., 2024; Dong et al., 2017).
The Sichuan Basin, one of China’s most important gas-bearing basins, exhibits immense potential for tight sandstone gas resources, particularly in the Jurassic Shaximiao Formation (Dong et al., 2017). The Shaximiao Formation is characterized by shallow-water delta-lacustrine deposits, with deltaic channel sand bodies serving as the primary exploration targets. The study area, located in the central low-relief structural zone of the Sichuan Basin, serves as a key region for Shaximiao tight gas exploration (Figure 1) (Dong et al., 2017). In this area, the sand bodies of the Shaximiao Formation exhibit vertically stacked multi-phase development, with generally low porosity (5%–9%) and strong reservoir heterogeneity (Li et al., 2021), posing challenges for sand body characterization and reservoir prediction. Traditional P-wave-based methods are limited by complex wave group relationships (Li et al., 2024), hindering accurate identification of sand body distribution and physical property variations. Consequently, there is an urgent need to develop novel technical approaches to enhance the precision of sand body identification and the reliability of reservoir prediction in the study area, thereby supporting efficient exploration and development of tight gas resources.
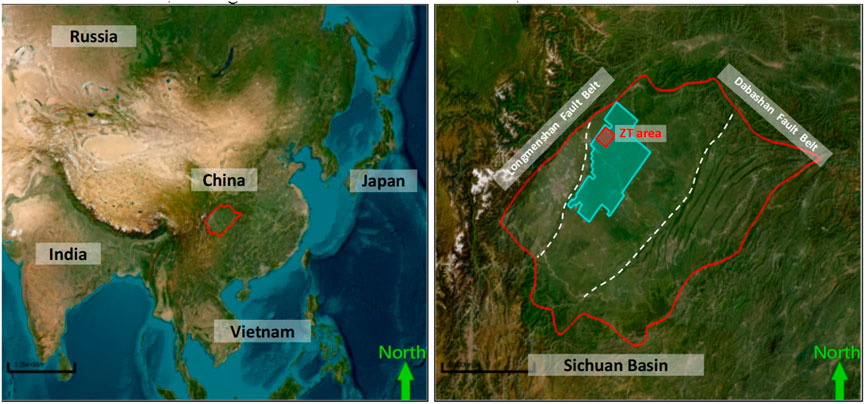
Figure 1. The location of research area (Sichuan Basin in western China). Light blue area: 3D seismic coverage; white dashed lines: structural boundary lines, dividing the Sichuan Basin into eastern, central, and western Sichuan; red area: the study area.
Multi-wave seismic sedimentology, which integrates P-wave and converted S-wave data (Ran et al., 2024; Zhang et al., 2024; Li et al., 2024; Zhang and Margrave, 2003), provides comprehensive insights into lithology and physical properties of subsurface geological targets. This approach offers unique advantages for sand body identification and reservoir prediction, particularly in low-porosity heterogeneous systems (Guo, 2023; Zeng et al., 2021; Yutan et al., 2024; Chen et al., 2024). This study focuses on the application of seismic sedimentology in multicomponent seismic joint interpretation, emphasizing the advantages of utilizing shear wave data and seismic sedimentology approaches for lithology prediction and characterization. We propose a workflow to efficiently derive attribute volumes characterizing lithological distribution patterns through rapid processing of conventional P-wave 3D seismic data. This methodology proves particularly valuable for early exploration phases with limited well data, enabling swift identification of prospective areas through large-scale 3D seismic interpretation.
The innovative pseudo-shear wave seismic methodology integrated with seismic sedimentology analysis demonstrates capability in comprehensive characterization of complex impedance sand bodies. Furthermore, reservoir petrophysical properties can be efficiently classified through differential analysis of P-wave and S-wave seismic responses. Industrial applications and subsequent drilling verification confirm the high consistency of this technical system, suggesting significant potential for broader implementation in exploration geology.
2 Geological setting
The Sichuan Basin, located in southwestern China, is a large composite sedimentary basin formed through multi-stage tectonic evolution (Xiao et al., 2020; Liu et al., 2018). The study area is situated in the northwestern part of the Sichuan Basin, within the tectonic framework of the southwestern Sichuan Northern Paleo-Mesozoic Depression Low-Gentle Belt (as shown in Figure 1). This structural belt is bounded by the Dabashan Fault Belt to the north, the Longmenshan Fault Belt to the west, the Western Sichuan Neozoic Depression Low-Steep Belt and the Central Sichuan Paleo-Uplift Gentle Slope Belt to the south, and the Eastern Sichuan Paleo-Slope Central Uplift High-Steep Fault Belt to the east. The overall structural configuration of the study area is characterized by an asymmetric syncline. The strata near the Longmenshan front exhibit relatively steep dips of 15°–25°, while the eastern limb of the syncline shows low-amplitude uplift, with locally developed faults (Cheng et al., 2023; Wan et al., 2023).
From top to bottom, the stratigraphic sequence in study area includes the Upper Jurassic Penglaizhen Formation, Suining Formation, Middle Jurassic Shaximiao Formation, Lower Jurassic Lianggaoshan Formation, and Ziliujing Formation (Cheng et al., 2023; Wan et al., 2023; Cheng et al., 2023). The Shaximiao Formation exhibits complex lithology, primarily comprising purplish-red mudstone interbedded with gray-green and gray siltstone and sandstone (Zhang et al., 2023; Yu et al., 2025).
A distinctive gray-green or gray-black “laminated shale” layer serves as a marker for subdividing the formation into the Shaximiao-1 Member (J2s1) and Shaximiao-2 Member (J2s2) (Cheng et al., 2023; Yang et al., 2024). The target interval, the Shaximiao-1 Member, has a thickness ranging from 150 m to 270 m, thinning from northeast to southwest (Xiao et al., 2020; Liu et al., 2018). Based on lithological and electrical characteristics, the Shaximiao-1 Member is further divided into three sub-members bounded by two maximum flooding surfaces: the Shaximiao-1-1 Sub-member (J2s11) with a thickness of 45–110 m, the Shaxiimao-1-2 Sub-member (J2s12) at 65–135 m, and the Shaximiao-1-3 Sub-member (J2s13) at 30–70 m (refer to Figure 3). All sub-members exhibit consistent thinning trends from northeast to southwest. Vertically, the Shaximiao-1 Member is subdivided into five sand groups (Jiang et al., 2022; Zeng, 2025).
The Shaximiao Formation in the study area is characterized by shallow-water delta-lacustrine deposition (Zhang et al., 2023; Yang et al., 2024). During the Sha-1 Member depositional period, delta-front subfacies dominated, with well-developed subaqueous distributary channel sand bodies and local occurrences of mouth bars and graded bedding (Zhang et al., 2023; Jiang et al., 2022). The subaqueous distributary channels within the delta front represent favorable depositional microfacies, providing the foundation for sand body and reservoir-scale development (Jiang et al., 2022). The Sha-1 Member channels in the study area display lateral migration and vertical stacking of multi-phase sand bodies (Li et al., 2023). The cumulative sand thickness ranges from 70 m to 120 m, with 3–7 vertically superimposed sand layers. Individual sand bodies exhibit rapid thickness variations, ranging from 5 m to 42 m.
The sandstone reservoirs feature diverse lithologies, predominantly lithic arkose and feldspathic litharenite, with minor occurrences of arkose and litharenite (see Figures 2, 3). Grain sizes are mainly medium to fine, with sporadic coarse grains. The reservoir physical properties vary rapidly, characterized by low porosity (7.1%–10.2%, median 8.44%) and ultra-low permeability (0.03–5.22 mD, median 0.48 mD) (Morad et al., 2010; Sima et al., 2017).
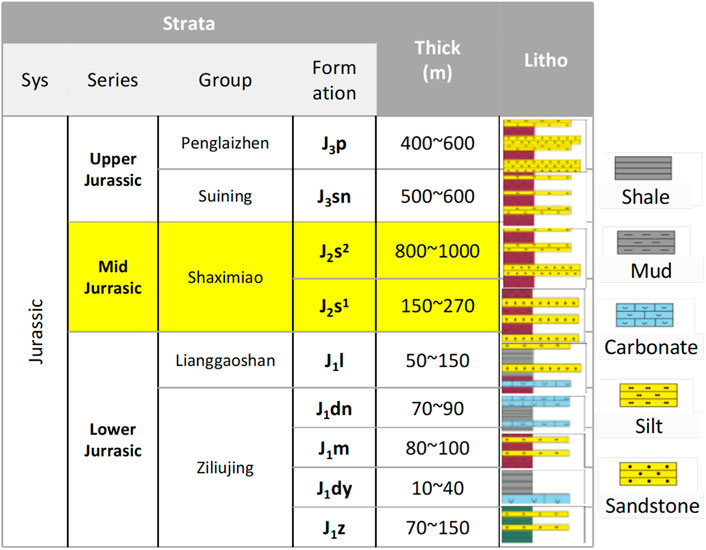
Figure 2. Jurassic stratigraphic column.
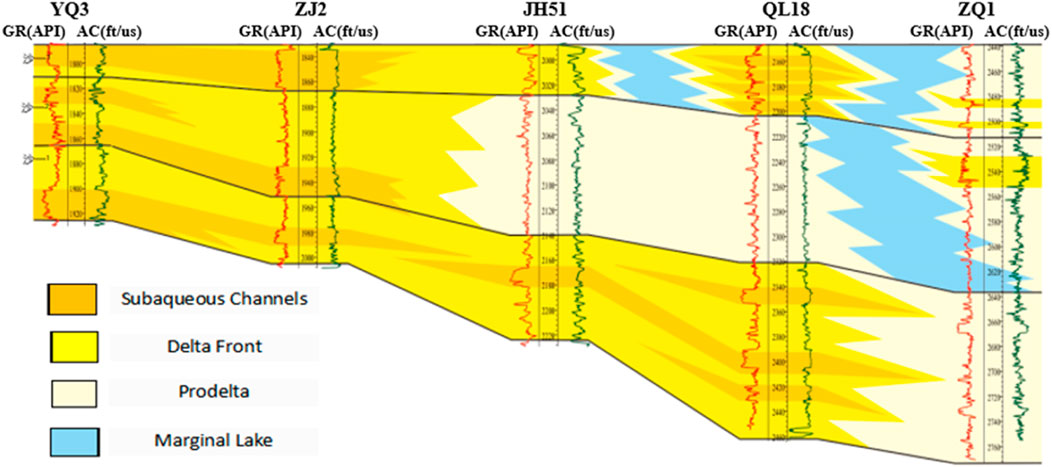
Figure 3. Sedimentary facies correlation diagram. GR and AC are the abbreviation for the gamma ray curve and acoustic curve respectively.
3 Data and methods
This section provides an overview on data, e.g., geophysical, rock physics and methods, e.g., pseudo-S wave construction and seismic sedimentology that used in this paper.
3.1 Data
In this study, the newly collected 1,626.04 km2 three-dimensional three-component transverse wave (PS wave) seismic data are used, combined with conventional pre-stack and post-stack longitudinal wave (PP wave) seismic data. This multi-component seismic survey was acquired using a P-wave explosive source and DSU3 digital three-component receivers to simultaneously record reflected wavefield information in XYZ directions. Wavefield separation techniques were applied to obtain PP-wave and PS-wave seismic profiles. The acquisition geometry was configured with 20 × 20 m receiver spacing, 6 s record length, and 2 m sampling interval.
Six wells (ZT1-ZT6) within the study area provide both P-wave and S-wave acoustic logging data for multi-component seismic-well-tie. Figure 4 demonstrates the synthetic seismic records generated through convolution of ZT2 well log data with 35 Hz and 25 Hz Ricker wavelets, respectively. The results exhibit strong correlations (>0.85) with adjacent PP-wave and PS-wave seismic traces, establishing a robust foundation for subsequent analysis of sandbody seismic response characteristics through integrated well-seismic interpretation.
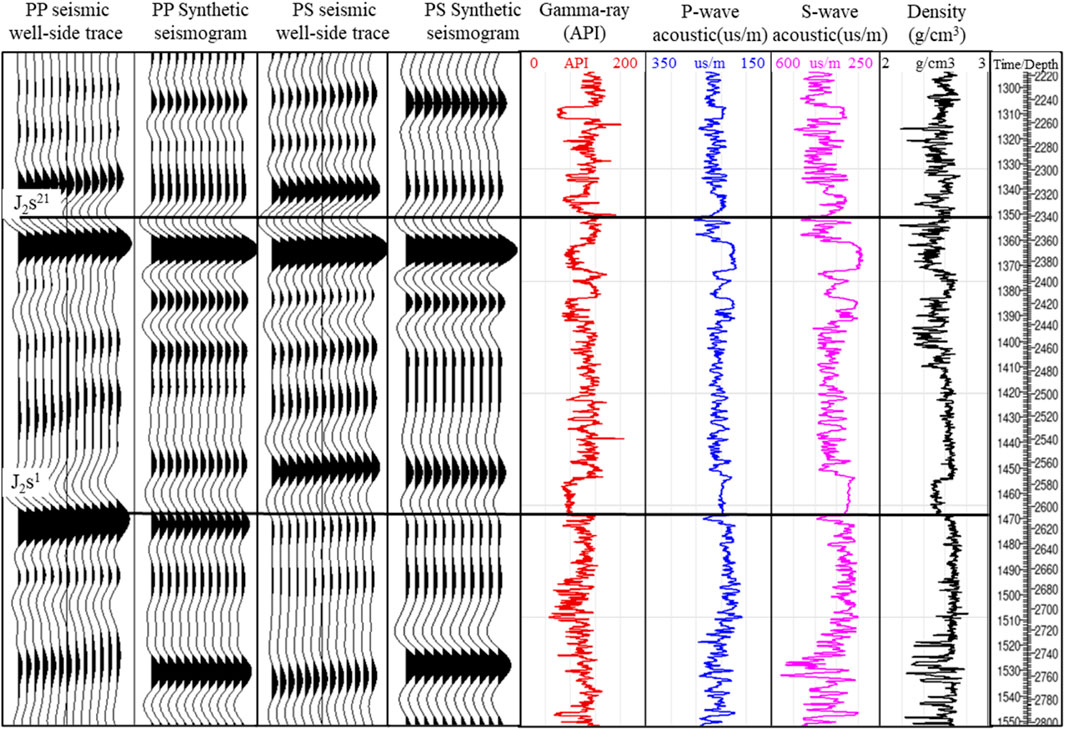
Figure 4. ZT2 Well-to-Seismic Tie/Calibration. Black in seismic trace denotes positive peaks and white denotes negative troughs.
Integrated well logging and rock physics ultrasonic experimental results are compiled in Table 1, presenting elastic parameters of sands with varying petrophysical properties and typical surrounding mudstones within the study area. These data provide a critical foundation for subsequent PP- and PS-wave seismic forward modeling based on geological frameworks. Analysis reveals that PP-wave velocities exhibit greater sensitivity to lithological and petrophysical variations compared to PS-wave velocities. As porosity increases from low to high values, P-wave velocities relative to surrounding mudstones exhibit a sequential transition from high to medium and then low velocities. Notably, no petrophysical variation reduces sandstone S-wave velocities below those of mudstones.
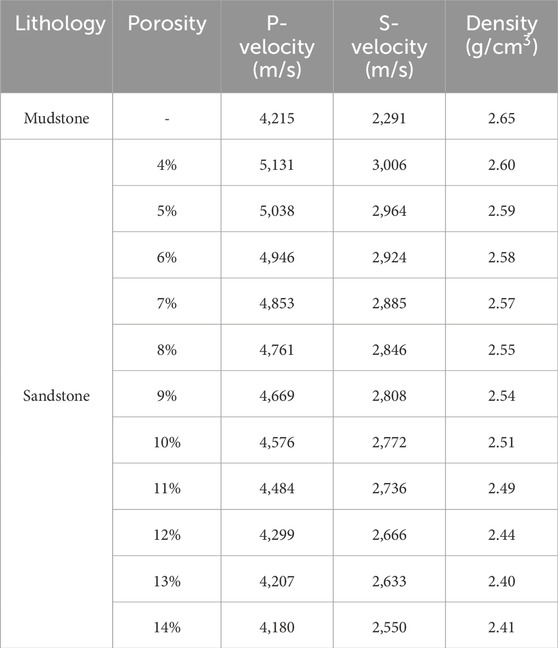
Table 1. This is Physical and Mechanical Parameter Table of Sandy Mudstone.
3.2 Methods
The core of PS wave seismic data processing lies in post-stack amplitude preservation. Key technical steps include static correction, low-frequency noise suppression, anisotropic pre-stack time migration, and absorption compensation. High-precision amplitude recovery and consistency processing ensure that amplitudes accurately reflect reflection coefficients and lithological variations.
For P-wave data, pre-stack AVO-compliant processing focuses on high-fidelity amplitude recovery and correction. Critical steps comprise surface-consistent amplitude compensation, signal enhancement via beamforming and Radon transform, high-resolution velocity analysis, anisotropic pre-stack time migration, time-variant spectral constraint deconvolution, and pre-stack gather regularization. These procedures preserve offset-dependent amplitude relationships and provide high-quality gather data for subsequent pre-stack attribute analysis and seismic response pattern recognition.
All processing workflows were implemented within the GeoEast software platform.
Processed results demonstrate dominant frequencies of 35 Hz for PP-waves and 25 Hz for PS-waves.
3.2.1 Pseudo-S-wave
Pre-stack PP AVO (Amplitude Versus Offset) technology is grounded in elastic wave reflection theory, analyzing the variation of seismic reflection amplitudes with incident angles (or offsets) to infer lithological and fluid properties (Zhi et al., 2016; Pan et al., 2016; Swan et al., 1993; Zhou et al., 2017; Gholami et al., 2018; Liu et al., 2025). Its theoretical foundation originates from the Zoeppritz equations, which describe the nonlinear relationship between reflection coefficients and the P-wave velocity (
Foster et al., 2010 [33] further demonstrated that when the P-wave to S-wave velocity ratio (
The intercept
Combined attributes derived from intercept and gradient, such as P⋅G, P−G cross-plots, and Poisson’s ratio contrasts, enhance fluid sensitivity by integrating complementary information (Swan et al., 1993). The subtraction of intercept and gradient attributes (Equation 5) eliminates the
The S in Equation 5 represents pseudo-S attribute, intercept-minus-gradient attribute (P–G).
The discrepancy in two-way travel time between PS and PP seismic events enables pseudo-s wave seismic attribute to serve as an interpretative bridge through its waveform similarity with PS waves and common moveout characteristics shared with PP reflections. This dual-domain correlation mechanism enhances multi-component seismic data integration by leveraging both kinematic (travel time) and dynamic (waveform) matching criteria.
Equation 1 demonstrates that pre-stack seismic amplitude exhibits an approximately linear relationship with the square of the sine of the incidence angle (sin2θ). This relationship enables efficient derivation of intercept and gradient attribute profiles by analyzing amplitude variation with incidence angle in crossplots.
To mitigate noise and outlier effects while enhancing computational efficiency for large-scale pre-stack seismic gathers, this study employs a super-gather stacking-based AVO attribute extraction method. Super-gathers are generated by stacking adjacent reflection angle traces within pre-stack angle gathers prior to amplitude-versus-offset (AVO) fitting. This approach significantly reduces data volume (typically orders of magnitude larger than post-stack data) while preserving computational accuracy.
For practical implementation, angle gathers within 30° incidence are stacked at 3° intervals, producing 10 super-gathers for AVO attribute calculation (Figure 5). This method reduces computation time by a factor of 5 compared to conventional processing. Comparative analysis reveals less than 5% deviation in AVO fitting curves between original gathers and super-gathers. Moreover, the resulting intercept and gradient profiles show consistent spatial trends and value ranges, with super-gather-derived attributes exhibiting higher signal-to-noise ratio due to noise suppression and improved linear fitting stability (Figure 6).

Figure 5. Comparison between AVO pattern derived from original angle gather and super-angle-gather. (a) Original angle gather; (b) Super-angle-gather; (c) The cross plot between angle of incidence and amplitude. Blue line denotes the AVO pattern of original angle gather at 1402 m. Orange line denotes the AVO pattern of super-angle-gather at 1402 m. Black in seismic trace denotes positive peaks and white denotes negative troughs.
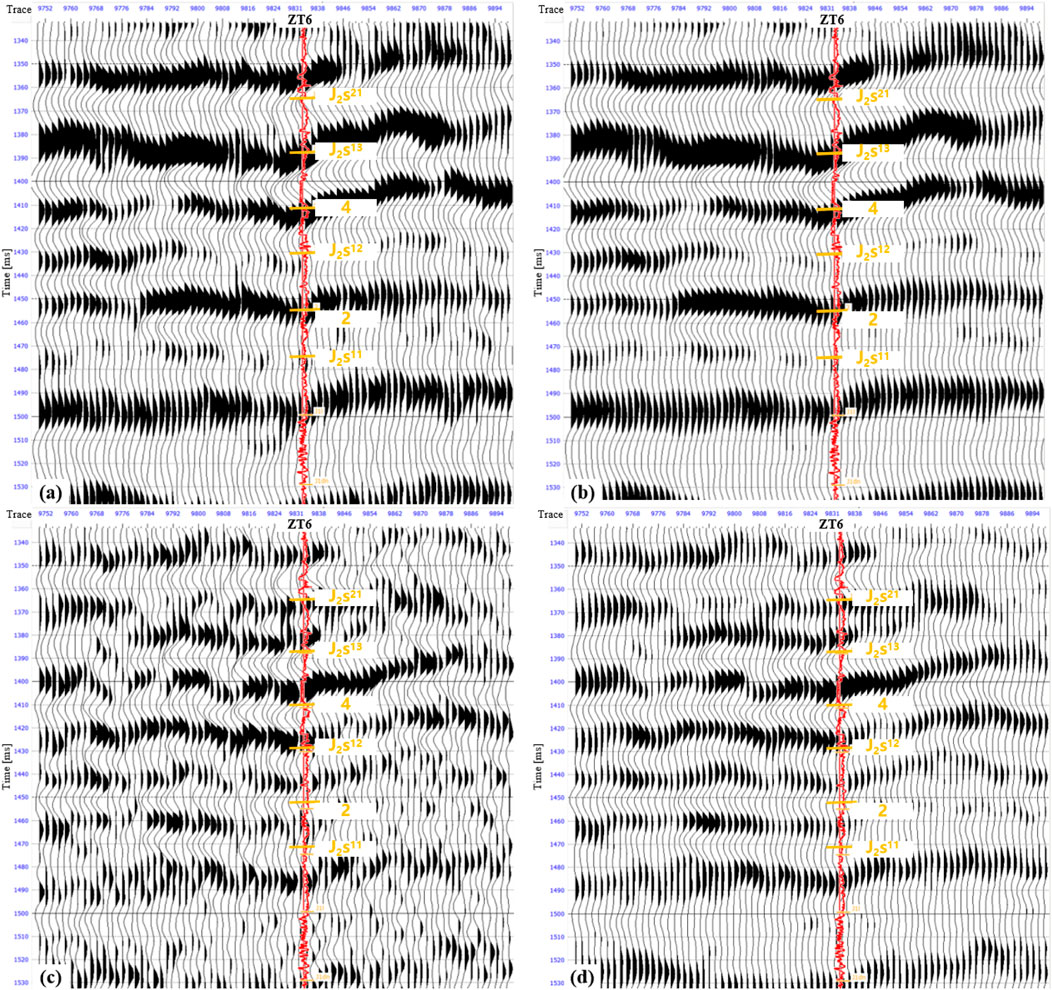
Figure 6. Comparison between intercept and gradient attribute profiles derived from original angle gather and super-angle-gather. (a) Intercept attribute profile derived from original angle gather; (b) Intercept attribute profile derived from super-angle-gather; (c) Gradient attribute profile derived from original angle gather; (d) Gradient attribute profile derived from super-angle-gather. Black in seismic trace denotes positive peaks and white denotes negative troughs.
3.2.2 Seismic sedimentology
Seismic sedimentology, as an interdisciplinary field bridging geophysics and sedimentology, utilizes seismic data to reconstruct depositional systems, lithofacies distributions, and stratigraphic architectures. Its theoretical foundation lies in the reinterpretation of seismic reflections as non-chronostratigraphic markers, emphasizing lateral lithofacies variations over strict isochronicity (Zeng, 2017; Zeng et al., 2001; Liu et al., 2021; Zeng et al., 2022).
Among its core technologies, 90° phase rotation stands out for enhancing thin-bed identification by aligning seismic waveforms with lithological interfaces. Traditional zero-phase seismic data often fail to resolve thin layers (<λ/4, where λ is the dominant wavelength) due to waveform interference between top and base reflections. By rotating the seismic phase by 90°, the waveform symmetry shifts to the lithology center rather than stratigraphic boundaries, effectively decoupling amplitude responses from bed thickness variations. Meanwhile, high-frequency stratal slicing interpolates proportional surfaces between chronostratigraphic markers to generate quasi-isochronous slices, preserving depositional system geometries and resolving lateral facies variations (Zeng, 2010; Zeng and Backus, 2005a; Zeng and Backus, 2005b; Zeng et al., 2007).
3.2.3 Overall research framework
To effectively integrate PP-wave, PS-wave, and pre-stack pseudo-S-wave attributes, this study establishes a hybrid workflow for joint P- and S-wave seismic characterization of sand bodies, as outlined below and in Figure 7.
• Rock Physics-Driven Seismic Response Analysis. The workflow initiates with rock physics modeling to quantify the distinct seismic response characteristics of sand bodies under P- and S-wave regimes. This step leverages the differential sensitivity of PP- and PS-wavefields to lithology and reservoir quality.
• 90° Phase Rotation and Chronostratigraphic Framework Construction. 90° phase rotation is applied to the PP-, PS-, and pseudo-S-wave datasets, transforming seismic reflections from impedance-boundary-centric (e.g., sand/mud interfaces) to lithology-centric signals. This critical adjustment aligns seismic troughs/peaks with sand body centers, mitigating tuning effects in thin beds. Leveraging the phase-corrected pseudo-S-wave attribute volume as an interpretative bridge, a high-resolution chronostratigraphic framework is established through integration of regional stratigraphic divisions and well-constrained seismic-to-well ties. The pseudo-S-wave dataset compensates for PP-PS travel time discrepancies in anisotropic media, enabling precise alignment of isochronous surfaces across multi-component datasets.
• High-Frequency Stratal Slicing for Sand Body Mapping. High-frequency stratal slices (1–5 ms sampling interval) are extracted from the phase-rotated PP- and PS-wave volumes to delineate lateral distributions of multi-phase fluvial/deltaic sand bodies. This technique preserves depositional geometries by proportionally interpolating surfaces between chronostratigraphic markers, effectively resolving lateral facies variations with <10 m vertical resolution. Comparative analysis of PP- and PS-derived slices enhances interpretation reliability, particularly in complex reservoirs with overlapping channel systems.
• Multi-Attribute Porous Sand Bodies Discrimination. Based on precise sand body identification and horizon interpretation, porous and gas-bearing sand bodies are further identified through systematic comparison of amplitude and phase characteristics between PP- and PS-wave datasets.
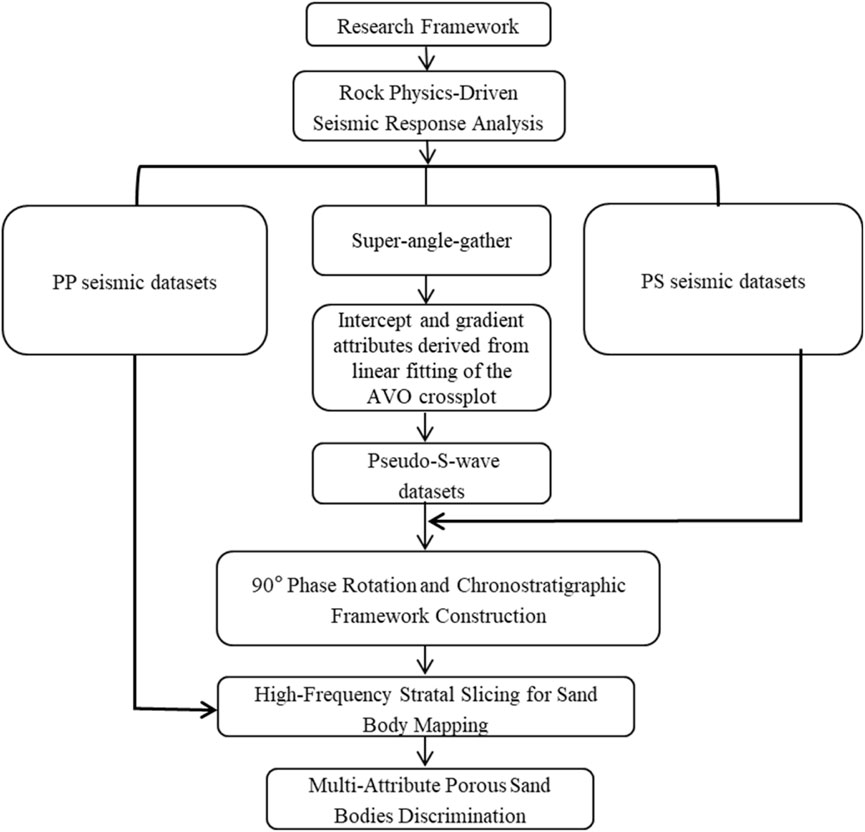
Figure 7. Overall research framework.
4 Analysis of results
Figure 8a illustrates the dual-layer geological model established in this study, where the overlying grey region represents surrounding mudstone, and the underlying colored blocks denote channel sand bodies with porosity ranging from 4% to 13%. The elastic parameters of sands with varying porosity are assigned according to Table 1, with sand body thickness and width set at 20 m and 60 m, respectively. The synthetic seismic profiles are generated by first calculating PP- and PS-wave reflection coefficients at the interface using the Zoeppritz equations, followed by convolution with Ricker wavelets of 35 Hz (PP) and 25 Hz (PS) dominant frequencies.
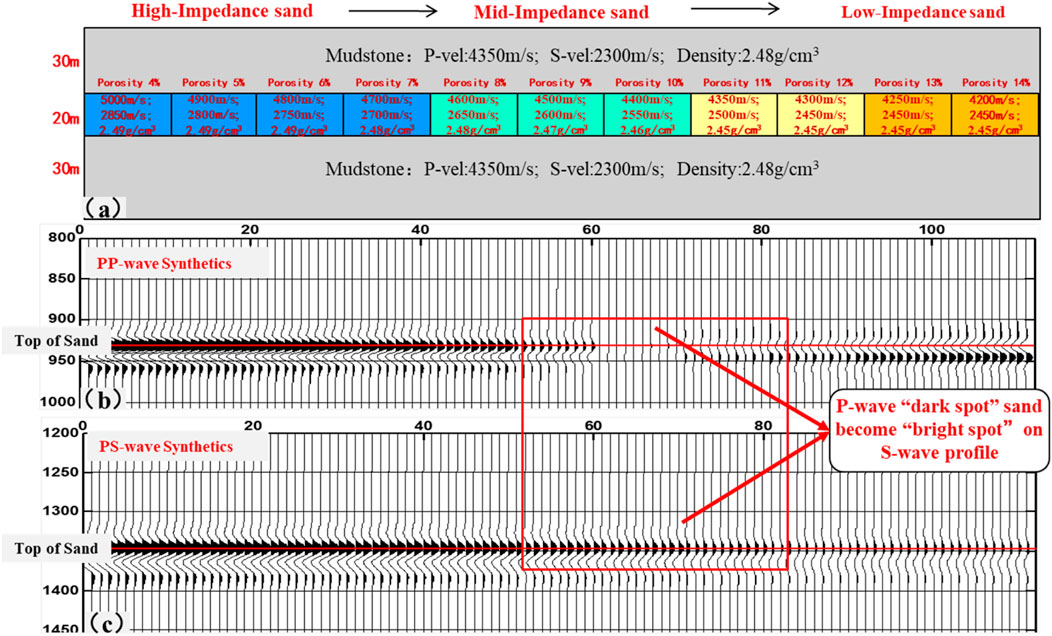
Figure 8. A simplified 3-layered model of P-wave and S-wave synthetics varies with sandstone porosity from 4% to 14%. (a) 3-layered model; (b) PP-wave synthetics; (c) PP-wave synthetics. Black in seismic trace denotes positive peaks and white denotes negative troughs.
Forward modeling results in Figure 8b reveal distinct seismic response characteristics of sands with different petrophysical properties on PP-wave profiles. As porosity increases, the seismic polarity at the sand top boundary transitions from a “peak-trough” to a “trough-peak” configuration. This polarity reversal introduces ambiguity in delineating sand top/base boundaries using PP-wave data alone. Notably, sands with intermediate porosity (8%–9%) exhibit minimal acoustic impedance contrast with surrounding mudstones, resulting in attenuated reflections (amplitude <5% of background) on PP-wave sections. These low-impedance-contrast sand bodies demonstrate “dark spot” characteristics, challenging conventional PP-wave interpretation.
In contrast, PS-wave modeling in Figure 8c demonstrates stable seismic signatures regardless of porosity variations. Even at porosities exceeding 12%, the PS-wave reflections maintain a consistent “peak-trough” configuration at the sand top boundary without polarity reversal. This stability arises from the S-wave velocity contrast between sand and mudstone being less sensitive to porosity changes compared to P-wave velocity. Statistical analysis confirms that PS-wave peak amplitude variations remain below 50% across the entire porosity range (4%–14%), enabling unambiguous identification of sand boundaries.
Figure 9 presents a crossplot analysis of P-wave (Vp) and S-wave (Vs.) logging velocities versus gamma ray (GR) values for the Shaximiao Formation in wells ZT1 to ZT6. Blue data points represent mudstone intervals, while red points denote sandstone intervals. The analysis reveals significant overlap in P-wave velocities between sandstone and mudstone, explaining the highly variable post-stack seismic response at sandstone top boundaries. In contrast, S-wave velocities exhibit a distinct separation: sandstone velocities consistently exceed 2,400 m/s, whereas mudstone velocities remain below this threshold. This robust Vs. differentiation provides a stable petrophysical basis for the consistent peak reflections observed at sandstone tops in forward seismic modeling.
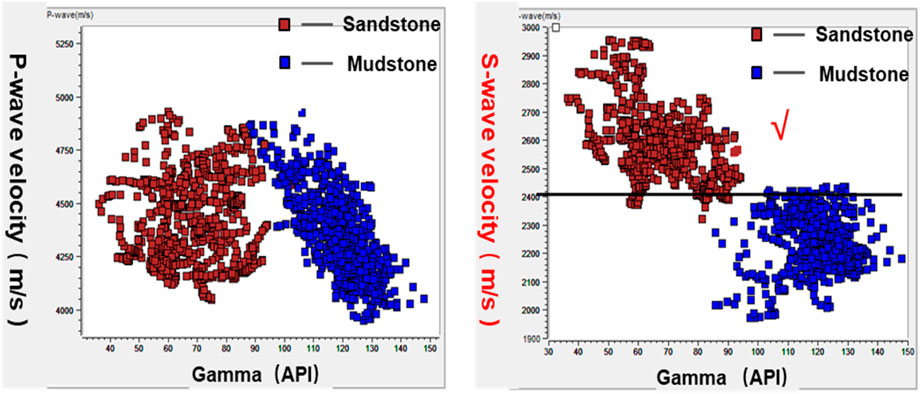
Figure 9. The petrophysical crossplot analysis for Wells ZT1–ZT6, based on well-log data and lithological interpretation.
Figure 10 displays the PP- and PS-wave seismic profiles at the same location. The PS-wave data exhibit a superior correlation with low-gamma sandstone intervals identified in well logs, demonstrating a significant improvement in sandstone identification accuracy compared to PP-wave data. Specifically, the stratal slice shown in Figure 11 at the position of Sand Body #7 reveals distinct fluvial channel geometries characterized by PS-wave amplitude anomalies (e.g., peak amplitudes >15% above background), whereas the PP-wave profile fails to resolve clear morphological features due to tuning effects and impedance ambiguities.
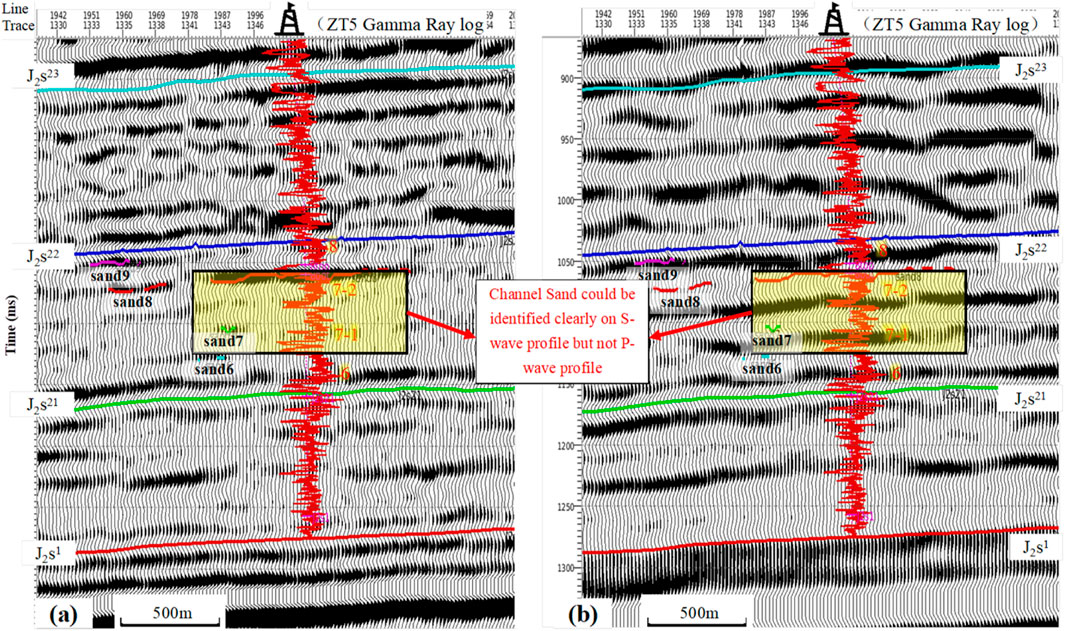
Figure 10. PP-wave (a) and PS-wave (b) seismic profile. Numbers highlighted in yellow: the stratigraphic divisions of Sand 6 to 9 in well; red, purple, blue short lines: seismic reflection of Sand 6 to 9. Black in seismic trace denotes positive peaks and white denotes negative troughs.
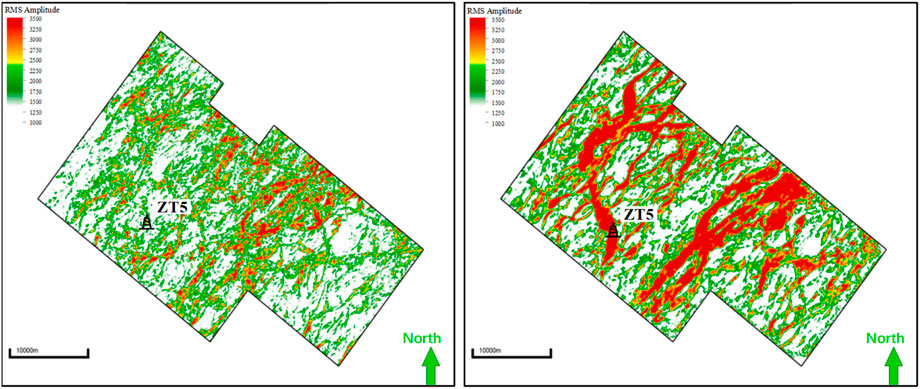
Figure 11. PP-wave (left) and PS-wave (right) amplitude slice. The slice is located in the red square shown in Figure 1. The red high-amplitude seismic anomalies are interpreted as deltaic subaqueous distributary channels, based on an integrated well-seismic analysis.
Figure 12 displays PS-wave, and pseudo-S-wave seismic profiles at the same location. A high degree of waveform similarity is observed between the PS-wave and pseudo-S-wave reflections. Notably, the pseudo-S-wave attribute achieves higher vertical resolution (35 Hz dominant frequency, equivalent to PP-wave data) relative to PS-wave data (25 Hz dominant frequency), enabling differentiation of vertically stacked channel sands. As shown in Figure 13, two different phases of sand bodies are resolved as distinct seismic events on the pseudo-S-wave attribute profile, whereas they remain indistinguishable on the PS-wave profile.
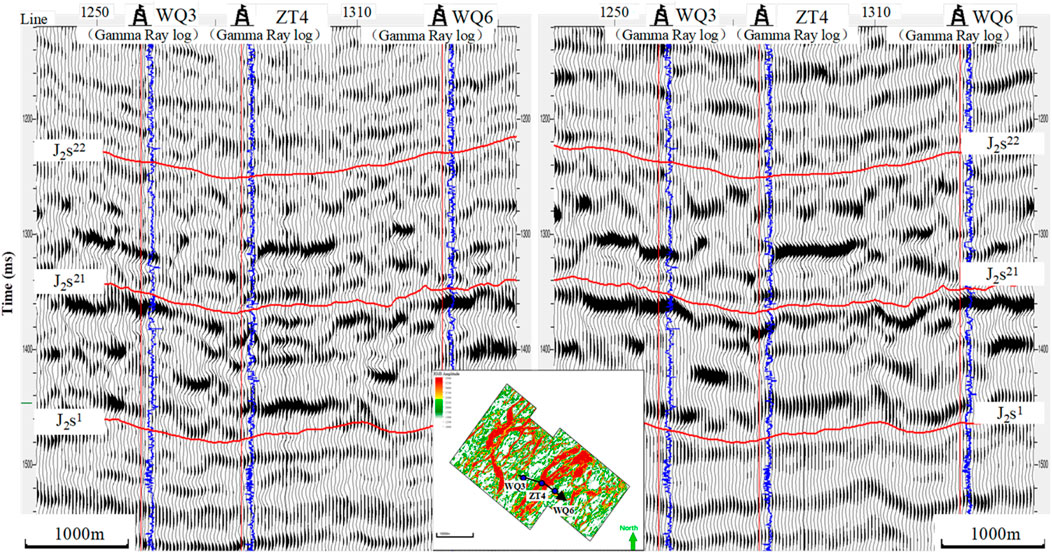
Figure 12. Pseudo-S-wave (left) and S-wave (right) seismic profile. Black in seismic trace denotes positive peaks. The location of the cross-section is superimposed on a map of the amplitude slice for Sand Body #7.
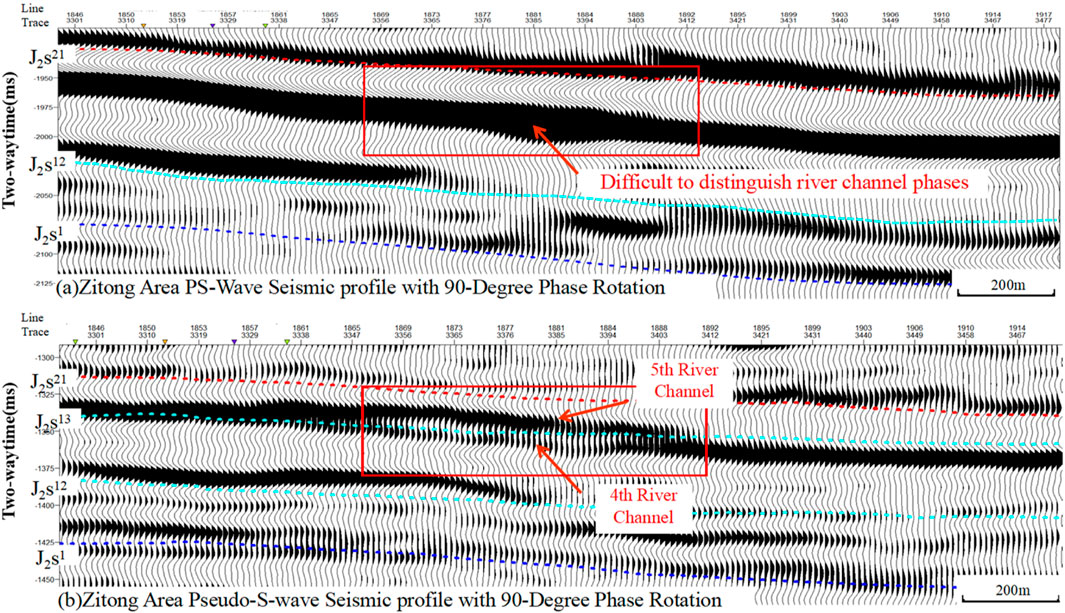
Figure 13. Comparative seismic profile for superimposed river channel identification. (a) PS-wave seismic profile; (b) pseudo-S-wave seismic profile. The red rectangular area in the figure highlights superimposed channel sand bodies that are seismically unresolved on the PS-wave section due to limited vertical resolution. In contrast, the pseudo-shear wave attribute profile clearly discriminates two distinct channel responses, revealing their sequential depositional chronology. Black in seismic trace denotes positive peaks and white denotes negative troughs.
However, the PS-wave data exhibit more amplitude focusing and clearer lateral boundaries of sand bodies (“bright spots”) compared to the pseudo-S-wave attribute. This disparity arises because pseudo-S-wave attribute fidelity critically depends on pre-stack gather quality—noise contamination in pre-stack data amplifies AVO interpretation uncertainties. Specifically, pseudo-S-wave attributes are constrained by multiple acquisition and processing factors including fold coverage, offset distribution, signal-to-noise ratio, etc.
Thus, while pseudo-S-wave attributes enhance vertical resolution for multi-phase sand identification, their application necessitates high-fidelity pre-stack data with robust AVO signal retention. Field validations in the study area demonstrate that integrating PS-wave lateral continuity and pseudo-S-wave vertical resolution achieves >90% accuracy in sand body mapping, even for reservoirs with thicknesses below tuning frequency limits (λ/4, λ ≈ 28 m at 35 Hz).
Figure 14 compares the S-wave seismic profile and the 90° phase-rotated trace adjacent to Well ZT3 after calibration. The well penetrated three box-shaped fluvial sand bodies (Sand Bodies #1, #2, and #3), each approximately 20 m thick. Notably, the proximity of Sand Bodies #2 and #3 (vertical spacing: 13 m) causes the top reflection of Sand Body #2 to merge with the tuning response of Sand Body #3, resulting in interpretive ambiguity in the original zero-phase dataset. The 90° phase rotation aligns seismic reflection with lithologic bodies, enabling precise vertical partitioning and interpretation. Post-rotation analysis reveals distinct seismic reflections corresponding to individual sand bodies, with Sand Body #2 exhibiting a phase-reversed trough at its top boundary (amplitude: −15% relative to background) and Sand Body #3 displaying a coherent peak reflection (amplitude: +23%).
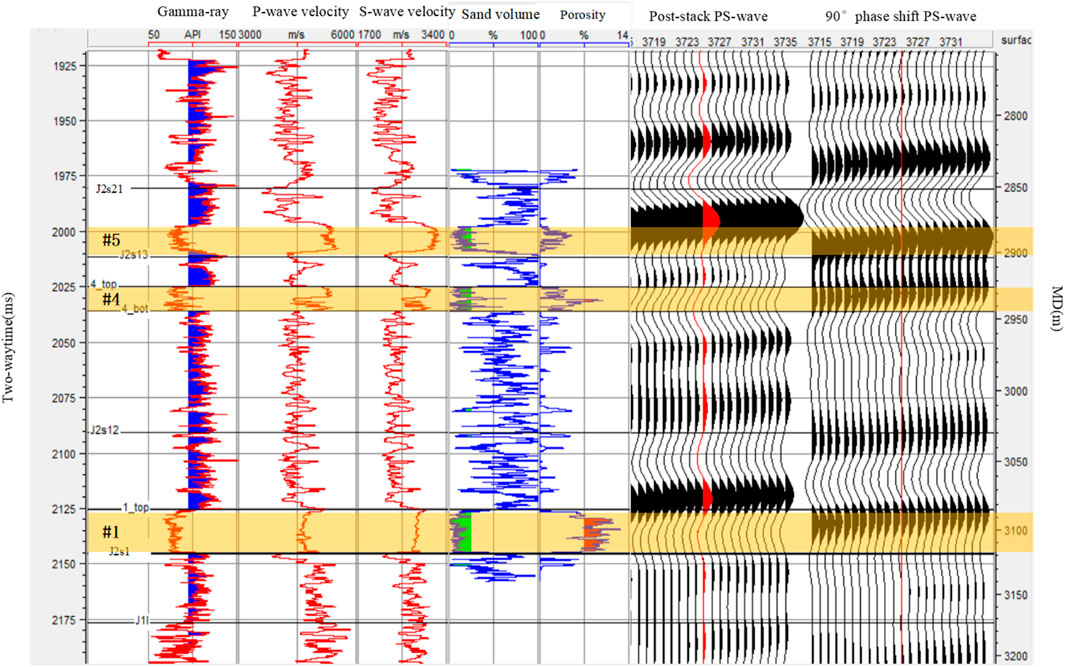
Figure 14. The PS-wave seismic profile and the 90°phase-rotated trace adjacent to Well ZT3 after calibration. Black in seismic trace denotes positive peaks. The location of ZT3 is labeled in Figure 15.
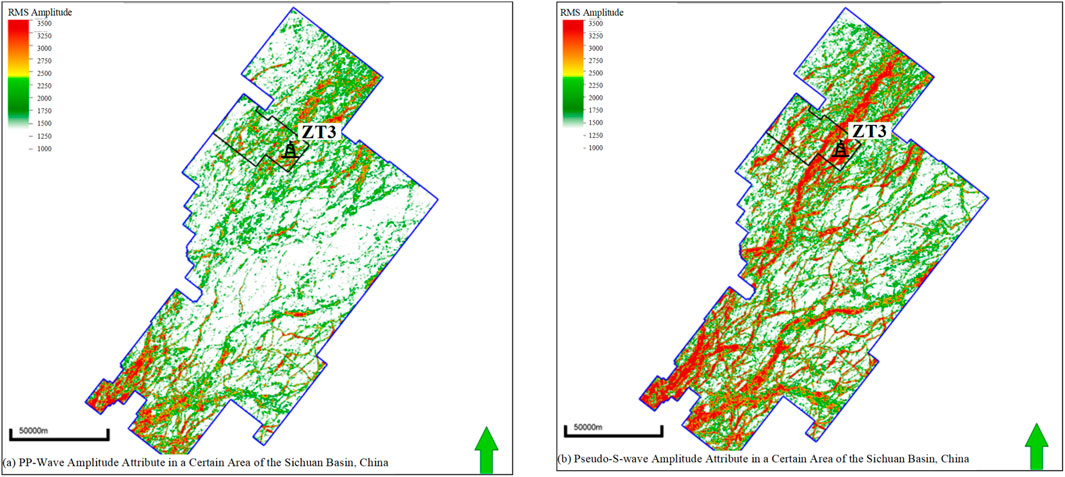
Figure 15. Amplitude attribute in a certain area of the Sichuan Basin, China. The slice is located in the lightblue square shown in Figure 1. The red high-amplitude seismic anomalies are interpreted as deltaic subaqueous distributary channels, based on an integrated well-seismic analysis. (a) PP-wave amplitude attribute; (b) pseudo-S-wave amplitude attribute.
Following seismic-well calibration, framework horizon interpretation was conducted under geological stratigraphic constraints. High-resolution stratal slicing with a 1 m sampling interval was applied to scan the 3D seismic volume, revealing distinct amplitude anomalies corresponding to vertically stacked fluvial channels of varying depositional phases. Notably, while converted-wave (PS) seismic data coverage is often limited due to acquisition equipment and cost constraints, the integration of pseudo-S-wave seismic analysis enables refined sand body characterization within conventional P-wave 3D datasets using equivalent shear-wave attribute techniques. As illustrated in Figure 15, a pseudo-S-wave seismic sedimentology workflow was implemented across a contiguous P-wave 3D seismic survey spanning over 10,000 km2 in the Sichuan Basin, China. This approach delineated deltaic channel sands covering more than 1,000 km2, with validation accuracy exceeding 95% based on over 100 drilled wells, thereby significantly supporting the expansion of exploration and development blocks.
Building upon sand body phase division and lateral boundary delineation, the integrated interpretation of multi-component seismic data enables systematic identification of high-porosity sands through comparative analysis of PP- and PS-wave seismic responses. In the Shaximiao Formation of the study area, three distinct seismic response patterns were classified based on porosity variations (Table 2). High-porosity sands (>9%, Class I reservoirs) exhibit a diagnostic “S-wave peak/P-wave trough” configuration, where the top boundary corresponds to moderate-to-strong peak amplitudes on PS-wave profiles but manifests as strong trough reflections on PP-wave sections. This polarity reversal phenomenon—attributed to P-wave velocity reduction in porous gas-bearing sands—serves as a direct indicator of reservoir quality, exemplified by Well ZT2, where a 34.3 m-thick Sand Body #1 demonstrates an average porosity of 9.7%. Moderately porous sands (7%–9%, Class II reservoirs) display “S-wave strong/P-wave weak” signatures, characterized by prominent PS-wave peaks but diminished PP-wave reflectivity, as observed in Well ZT4’s 24.2 m-thick Sand Body #2 with 7.6% porosity. Tight sands (<7%, Class III units) lack reservoir potential despite showing coherent peaks on both PP- and PS-wave profiles, reflecting lithologic presence without effective porosity. The pre-stack P-G attribute bridges PP/PS datasets by correlating PS-wave peaks with PP-wave troughs, facilitating high-porosity sand mapping through amplitude-thresholded geobody extraction.
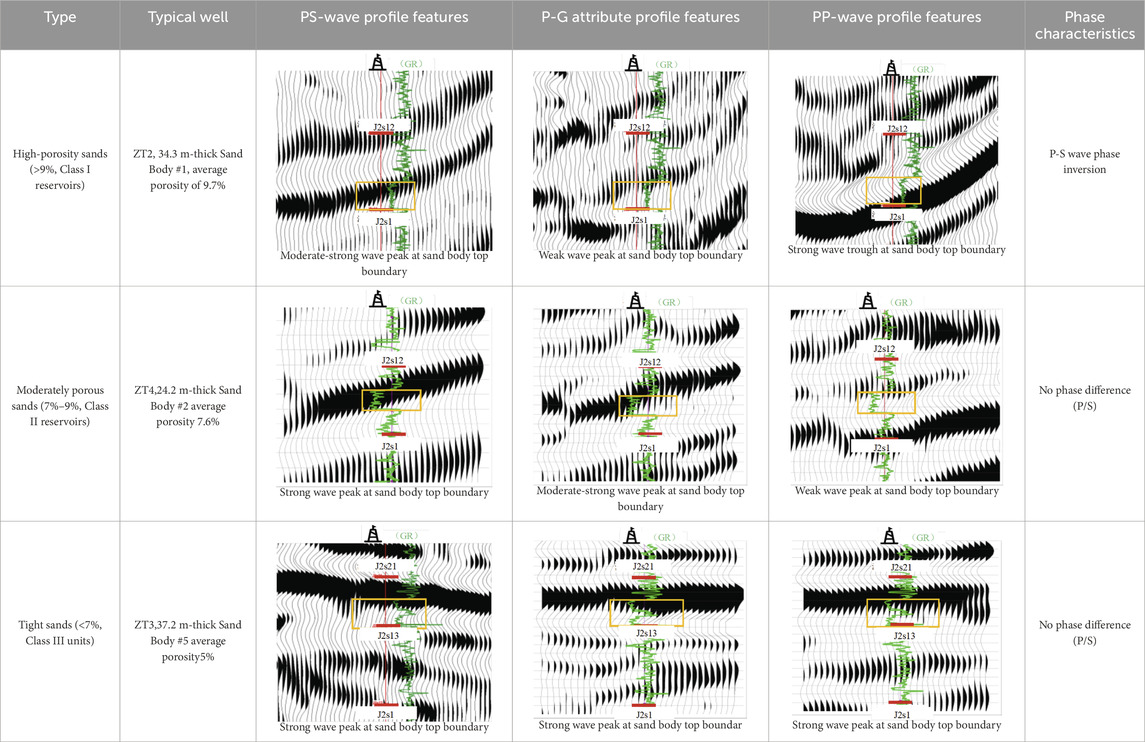
Table 2. Three typical seismic response patterns classified by porosity differences.
The application of this technical workflow in the study area successfully predicted the lateral distribution of channel sands and high-porosity sweet spots within the Shaximiao formation. Multi-component seismic joint prediction results demonstrate that #1 channel sands exhibit a NE–SW orientation shown in Figure 15a, with intersecting distributary pattern shown in Figure 16b. The prediction result is highly consistent with drilled wells. The efficacy of this workflow was further validated by the newly drilled Well W1, where a 1,250 m horizontal section achieved a 99% sand encounter rate and an 87% reservoir encounter rate. The encountered sands exhibit an average porosity of 9%, aligning closely with pre-drill predictions. This high-fidelity match between seismic-derived sand geometries (spatial accuracy >90%) and well data underscores the robustness of multi-wave seismic integration in resolving complex fluvial reservoir architectures, particularly in areas with heterogeneous impedance contrasts.
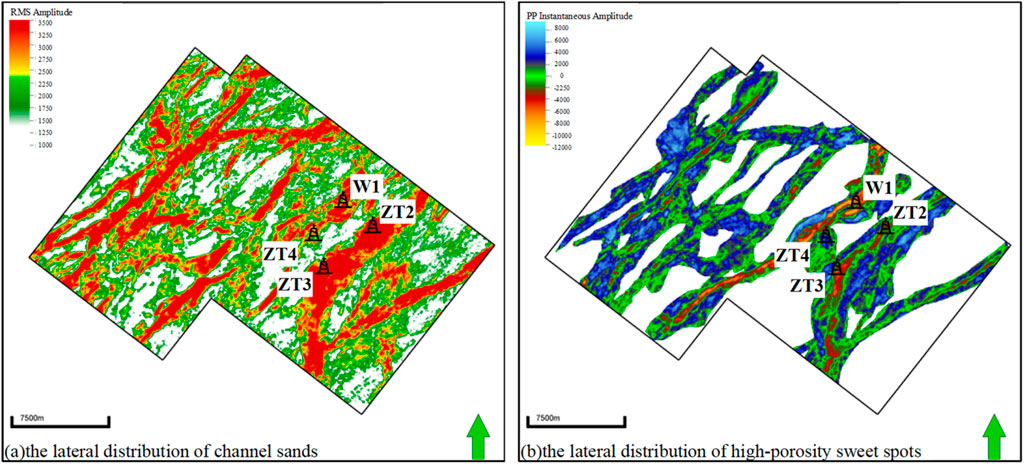
Figure 16. Plan View of River Channel Sand Bodies and High-Porosity Sweet Spots of Sand Body #4 in the Shaximiao Formation, ZT area, shown in red square in Figure 1. (a) represents the distributary channels as red high-amplitude anomalies, and the outer boundary displayed in (b) is derived from the red boundary in (a).
5 Conclusion
This study demonstrates that integrated multi-wave seismic analysis significantly enhances the characterization of deltaic channel systems by leveraging complementary petrophysical sensitivities of PP- and PS-wave data. Key outcomes include: the identification of PP-wave polarity reversal as a direct indicator of porosity variation in sandstones; the stability of PS-wave responses for robust lithology discrimination; and the complementary resolution of pseudo-S-wave attributes in resolving thin-bedded and stacked sand bodies. These findings collectively establish a more reliable framework for reservoir prediction and reduce interpretation uncertainty in complex depositional environments.
5.1 Distinctive multi-wave seismic responses to sandstone petrophysical properties
PP-wave and PS-wave seismic data exhibit fundamentally different behaviors in response to variations in sandstone petrophysical properties. PP-wave reflections show a pronounced polarity transition at sandstone top boundaries: high-porosity sands (>9%) generate strong trough reflections, whereas low-porosity tight sands (<7%) produce peak reflections.
This contrast enables effective reservoir quality discrimination and supports the prioritization of high-porosity, prospective zones. In contrast, PS-wave responses remain polarity-stable across varying porosity conditions, consistently exhibiting peak reflections at sand top interfaces.
This invariance underscores the robustness of S-wave amplitude attributes for lithologic identification and channel sand discrimination, independent of fluid or porosity effects.
5.2 Complementary resolution and interpretative advantages of derived pseudo-S-wave attributes
Both PS-wave and pseudo-S-wave attributes exhibit amplitude responses that correlate systematically with porosity variations. PS-wave data provide exceptional lateral resolution, enabling precise delineation of channel margins and geomorphic features.
Meanwhile, pseudo-S-wave attributes, derived from pre-stack AVO inversion, achieve higher vertical resolution (dominant frequency ∼35 Hz compared to ∼25 Hz for PS-wave), making them particularly effective for identifying thin interbeds and vertically stacked sand phases.
Furthermore, since pseudo-S-wave attributes are computed directly from PP-wave gathers, they circumvent the temporal and phase misalignment challenges typical of conventional PP-PS data integration, thereby serving as an efficient interpretative bridge between acoustic and elastic seismic domains.
5.3 Enhanced reservoir characterization via multi-wave seismic sedimentology
The integration of multi-wave seismic sedimentology significantly improves the characterization of deltaic channel systems, especially in identifying thin-bed reservoirs. Techniques such as 90° phase rotation and stratal slicing enhance the alignment between seismic amplitudes and lithologic boundaries, facilitating more accurate sand-body mapping and depositional environment interpretation. However, the reliability of pseudo-S-wave attributes is strongly dependent on the quality of pre-stack data: only amplitude-preserved gathers with sufficient offset coverage (>40-fold) and signal-to-noise ratio (>2.0) yield stable shear impedance estimates. Suboptimal data conditions—such as noise contamination, limited offset, or improper amplitude recovery—amplify uncertainties in AVO interpretation and may lead to erroneous fluid or lithology predictions.
5.4 Implications for data processing and future applications
These findings highlight the critical importance of robust pre-stack data conditioning—including amplitude compensation, noise suppression, and gather regularization—in mitigating interpretation risks and maximizing the value of multi-wave seismic analysis. Future efforts should focus on optimizing angle-dependent inversion workflows and incorporating rock physics constraints to further improve the quantification of reservoir properties. When properly validated, multi-wave seismic sedimentology provides a powerful framework for reducing interpretation ambiguity and enhancing predictive accuracy in complex sedimentary basins.
The comparative analysis reveals that this research introduces significant academic innovation by integrating 3D multi-save seismic sedimentology and quantitative morphometrics to characterize fluvial systems, surpassing the conventional 2D seismic stratigraphy and the qualitative geomorphic approaches (Zeng et al., 2015; Harishidayat et al., 2025). This methodology enables high-resolution mapping of single-story channel bodies and their scaling relationships, providing novel insights into sediment transport mechanisms and reservoir heterogeneity. Application superiority is demonstrated through enhanced reservoir modeling, optimized well placement based on meander belt dimensions, directly impacting hydrocarbon recovery and de-risking exploration in complex siliciclastic basins.
6 Featured application
This study presents a novel multi-wave seismic sedimentology workflow for efficient tight sandstone reservoir characterization. The methodology is particularly valuable for hydrocarbon exploration in low-porosity, heterogeneous systems with sparse well control, enabling rapid 3D seismic interpretation to identify prospective areas.
Data availability statement
The original contributions presented in the study are included in the article/supplementary material, further inquiries can be directed to the corresponding author.
Author contributions
JD: Writing – original draft, Writing – review and editing. WL: Data curation, Formal Analysis, Writing – original draft. WW: Formal Analysis, Methodology, Writing – original draft. YY: Data curation, Investigation, Visualization, Writing – review and editing. BL: Funding acquisition, Investigation, Resources, Supervision, Writing – review and editing. QR: Conceptualization, Funding acquisition, Project administration, Resources, Supervision, Writing – review and editing. KC: Conceptualization, Methodology, Project administration, Supervision, Writing – review and editing. YW: Validation, Visualization, Writing – review and editing.
Funding
The author(s) declare that financial support was received for the research and/or publication of this article. This work was supported by the PetroChina Science and Technology Major Project “Fine Characterization Technology for Tight Sandstone Gas Reservoirs”, grant number 2023ZZ25-001 and “Key Geophysical Evaluation Technology for Jurassic Crude Oil in the Sichuan Basin”, grant number 2024D1ZD-02-03.
Conflict of interest
Authors JD, WL, WW, YY, BL, QR, KC, YW were employed by PetroChina Southwest Oil and Gasfield Company. The authors declare that this study received funding from PetroChina. The funder had the following involvement in the study: study design, data collection, and decision to publish.
Generative AI statement
The author(s) declare that no Generative AI was used in the creation of this manuscript.
Any alternative text (alt text) provided alongside figures in this article has been generated by Frontiers with the support of artificial intelligence and reasonable efforts have been made to ensure accuracy, including review by the authors wherever possible. If you identify any issues, please contact us.
Publisher’s note
All claims expressed in this article are solely those of the authors and do not necessarily represent those of their affiliated organizations, or those of the publisher, the editors and the reviewers. Any product that may be evaluated in this article, or claim that may be made by its manufacturer, is not guaranteed or endorsed by the publisher.
References
Castagna, J. P., Swan, H. W., and Foster, D. J. (1998). Framework for AVO gradient and intercept interpretation. Geophysics 63 (3), 948–956. doi:10.1190/1.1444406
Chen, Q., Chen, K., Wang, H., Yang, G., Guo, X., Wei, W., et al. (2024). Prediction of tight sandstone reservoirs by multiwave joint prestack inversion technology: a case study of the qiulin area in the sichuan basin. Interpretation 12 (3), SE75–SE87. doi:10.1190/INT-2023-0111.1
Cheng, D., Zhang, Z., Zhang, S., Qin, C., Yuan, X., Zhang, B., et al. (2023). Sequence structure, sedimentary evolution and their controlling factors of the Jurassic lianggaoshan formation in the east sichuan basin, SW China. Petroleum Explor. Dev. 50 (2), 293–305. doi:10.1016/S1876-3804(23)60388-X
Dawei, C. H. E. N. G., Zhijie, Z. H. A. N. G., Haitao, H. O. N. G., Shaomin, Z. H. A. N. G., Chunyu, Q. I. N., Xuanjun, Y. U. A. N., et al. (2023). Sedimentary and provenance characteristics and the basin-mountain relationship of the Jurassic lianggaoshan formation in eastern sichuan basin, SW China. Petroleum Explor. Dev. doi:10.11698/PED.20220412
Dong, H., LiYucong, L. M., Jiajing, Y., Rong, B., and Zhi, Y. (2017). Reservoir features and exploration potential of the 1st member of shaximiao formation of Middle Jurassic in central sichuan basin. China Pet. Explor. 22 (2), 44. doi:10.3969/j.issn.1672-7703.2017.02.005
Fatti, J. L., Smith, G. C., Vail, P. J., Strauss, P. J., and Levitt, P. R. (1994). Detection of gas in sandstone reservoirs using AVO analysis: a 3-D seismic case history using the geostack technique. Geophysics 59 (9), 1362–1376. doi:10.1190/1.1443695
Foster, D. J., Keys, R. G., and Lane, F. D. (2010). Interpretation of AVO anomalies. GEOPHYSICS 75 (5), 75A3–75A13. doi:10.1190/1.3467825
Gholami, A., Aghamiry, H. S., and Abbasi, M. (2018). Constrained nonlinear amplitude variation with offset inversion using Zoeppritz equations. Geophysics 83 (3), R245–R255. doi:10.1190/geo2017-0543.1
Guo, J. L. (2023). “Application of seismic sedimentology in tight sandstone reservoirs in zhengning area,” in International field exploration and development conference (Singapore: Springer Nature Singapore), 991–1000. doi:10.1007/978-981-97-0468-2_77
Harishidayat, D., Al-Shuhail, A., and Al-Shuhail, A. (2025). Seismic stratigraphy and evolution of mesozoic deposits in the central Arabian basin. Sci. Rep. 15 (1), 21494. doi:10.1038/s41598-025-05349-7
Jiang, L., Zhao, W., Zhang, B., Zheng, C., Hong, F., and Hao, J. (2022). Characterization method of tight sandstone reservoir heterogeneity and tight gas accumulation mechanism, Jurassic formation, Sichuan basin, China. Geofluids 2022 (1), 1–10. doi:10.1155/2022/9420835
Jinsong, L., Xiaodong, Z., Zhiyong, G., Yonggen, L., Ying, L., and Xingli, L. (2009). Application of high-resolution sequence stratigraphy in improving the precision of reservoir prediction. Petroleum Explor. Dev. 36 (4), 448–455. doi:10.1016/S1876-3804(09)60139-7
Li, C., Zhang, Y., Wang, H., Niu, C., Wang, D., and Ling, Y. (2021). Numerical investigation of the effect of heterogeneous pore structures on elastic properties of tight gas sandstones. Front. Earth Sci. 9, 641637. doi:10.3389/feart.2021.641637
Li, H., Li, J., and Li, Z. (2023). Quantitative scale analysis of the channel bar in a braided river and its internal architecture. Appl. Sci. 14 (1), 257. doi:10.3390/app14010257
Li, Y., Wang, D., Zhang, M., Liu, F., Zhao, Y., and Bai, J. (2024). Research and application of joint interpretation using P-wave and PS-wave in tight gas exploration. J. Earth Sci. 35, 1402–1406. doi:10.1007/s12583-024-1995-7
Liu, J. L., Yin, W., Ji, Y. L., Wang, T. Y., Huang, F. X., Yu, H. Y., et al. (2018). Sequence architecture and sedimentary characteristics of a Middle Jurassic incised valley, Western sichuan depression, China. Petroleum Sci. 15 (2), 230–251. doi:10.1007/s12182-017-0211-0
Liu, H., Zhang, M., and Chi, X. (2021). Application of seismic sedimentology in a fluvial reservoir: a case study of the guantao formation in dagang oilfield, Bohai Bay basin, China. Geol. J. 56 (10), 5125–5139. doi:10.1002/gj.4227
Liu, Y., Li, Y., Peng, J., and Wang, M. (2025). Semi-supervised learning for AVO inversion with strong spatial feature constraints. arXiv Prepr. arXiv:2501.15473. doi:10.48550/arXiv.2501.15473
Morad, S., Al-Ramadan, K., Ketzer, J. M., and De Ros, L. F. (2010). The impact of diagenesis on the heterogeneity of sandstone reservoirs: a review of the role of depositional facies and sequence stratigraphy. AAPG Bull. 94 (8), 1267–1309. doi:10.1306/04211009178
Pan, X.-P., Zhang, G.-Z., Zhang, J.-J., and Yin, X.-Y. (2016). Zoeppritz-based AVO inversion using an improved markov chain monte carlo method. Petroleum Sci. 14 (1), 75–83. doi:10.1007/s12182-016-0131-4
Ran, Q., Wei, W., Chen, K., Yang, G., Dai, J., Yan, Y., et al. (2024). Multi-wave seismic based depiction of subtle channel sandbody: a case study of the shaximiao formation in the ZT area, northwestern sichuan basin. Nat. Gas. Ind. 44 (3), 87–96. doi:10.3787/j.issn.1000-0976.2024.03.007
Shuey, R. T. (1985). A simplification of the zoeppritz equations. Geophysics 50 (4), 609–614. doi:10.1190/1.1441936
Sima, L., Wang, C., Wang, L., Wu, F., Ma, L., and Wang, Z. (2017). Effect of pore structure on the seepage characteristics of tight sandstone reservoirs: a case study of Upper Jurassic penglaizhen Fm reservoirs in the Western sichuan basin. Nat. Gas. Ind. B 4 (1), 17–24. doi:10.1016/j.ngib.2017.07.003
Swan, H. W., Castagna, J. P., and Backus, M. M. (1993). Properties of direct AVO hydrocarbon indicators. Offset dependent reflectivity–theory and practice of AVO anomalies. Investigations Geophys. 8, 78–92. doi:10.1190/1.9781560802624.ch5
Wan, N., Liu, S., Li, X., Zhang, B., Ren, R., and Chen, Z. (2023). Limited flexural control of fold-thrust belts on the Jurassic sichuan Basin, South China. Front. Earth Sci. 11, 1276832. doi:10.3389/feart.2023.1276832
Wang, Y. (1999). Approximations to the Zoeppritz equations and their use in AVO analysis. Geophysics 64 (6), 1920–1927. doi:10.1190/1.1444698
Xiao, F. S., Wei, T. Q., Wang, X. J., Guan, X., Wu, C. J., and Hong, H. T. (2020). Research on the sequence stratigraphy of the Shaximiao Formation in Chuanzhong-Chuanxi area, Sichuan Basin. Nat. Gas. Geosci., 31 (9): 1216–1224.
Yang, T., Li, X., Yang, Y., Wen, L., Cao, Z., Wang, X., et al. (2024). Evolution from shallow-water deltas to fluvial fans in lacustrine basins: a case study from the Middle Jurassic Shaximiao Formation in the central Sichuan Basin, China. Sedimentology 71 (3), 1023–1055. doi:10.1111/sed.13163
Yu, K., Deng, Q., Tang, B., Zhu, D., Yang, X., Feng, Y., et al. (2025). Geoscience-engineering-integration for efficient development of tight sandstone gas reservoirs-case of Sha II member in NW Sichuan Basin. Earth S. C. 522, 28. doi:10.1134/S1028334X2460590X
Yutan, D., Daxing, W., Mengbo, Z., Fei, L., Guanghong, D., Yonggang, W., et al. (2024). Tight sandstone fluid detection technology based on multi-wave seismic data. Open Geosci. 16 (1), 20220727. doi:10.1515/geo-2022-0727
Zeng, H. (2010). Stratal slicing: benefits and challenges. Lead. Edge 29 (9), 1040–1047. doi:10.1190/1.3485764
Zeng, H. (2017). What is seismic sedimentology? A tutorial. Interpretation 6 (2), 1–SD12. doi:10.1190/INT-2017-0145.1
Zeng, H. (2025). High-Resolution mapping of subsurface sedimentary facies and reservoirs using seismic sedimentology. Appl. Sci. 15 (12), 6387. doi:10.3390/app15126387
Zeng, H., and Backus, M. M. (2005a). Interpretive advantages of 90°-phase wavelets: part 1—Modeling. Geophysics 70 (3), C7–C15. doi:10.1190/1.1925740
Zeng, H., and Backus, M. M. (2005b). Interpretive advantages of 90°-phase wavelets: part 2—Seismic applications. Geophysics 70 (3), C17–C24. doi:10.1190/1.1925741
Zeng, H., Ambrose, W. A., and Villalta, E. (2001). Seismic sedimentology and regional depositional systems in Mioceno norte, Lake Maracaibo, Venezuela. Lead. Edge 20 (11), 1260–1269. doi:10.1190/1.1487259
Zeng, H., Loucks, R. G., and Brown, L. F. (2007). Mapping sediment-dispersal patterns and associated systems tracts in fourth- and fifth-order sequences using seismic sedimentology: example from Corpus Christi Bay, Texas. AAPG Bull. 91 (7), 981–1003. doi:10.1306/02060706048
Zeng, H., Zhao, X., Zhu, X., Jin, F., Dong, Y., Wang, Y., et al. (2015). Seismic sedimentology of sub-clinoformal shallow-water meandering river Delta: a case from the suning area of raoyang sag in jizhong depression, Bohai Bay basin, NE China. Petroleum Explor. Dev. Online 42 (5), 621–632. doi:10.1016/S1876-3804(15)30057-4
Zeng, H., He, Y., and Zeng, L. (2021). Impact of sedimentary facies on machine learning of Acoustic impedance from seismic data: lessons from a geologically realistic 3D model. Interpretation 9 (3), T1009–T1024. doi:10.1190/INT-2021-0035.1
Zeng, Z., Zhu, H., Zeng, H., Yang, X., and Xu, C. (2022). Seismic sedimentology analysis of fluvial-deltaic systems in a complex strike-slip fault zone, Bohai Bay basin, China: implications for reservoir prediction. J. Petroleum Sci. Eng. 208, 109290. doi:10.1016/j.petrol.2021.109290
Zhang, F., and Li, X. (2013). Generalized approximations of reflection coefficients in orthorhombic media. J. Geophys. Eng. 10 (5), 054004. doi:10.1088/1742-2132/10/5/054004
Zhang, H., and Margrave, G. F. (2003). Joint PP-PS inversion at Pikes Peak Oilfield, Saskatchewan. Society of Exploration Geophysicists. doi:10.1190/1.1817657 [Abstract retrieved from SEG Technical Program Expanded Abstracts 2003 (177 – 180)].
Zhang, X., Deng, H., Li, T., Xu, Z., Fu, M., Ling, C., et al. (2023). The conditions and modelling of hydrocarbon accumulation in tight sandstone reservoirs: a case study from the Jurassic shaximiao formation of Western sichuan basin, China. Geoenergy Sci. Eng. 225, 211702. doi:10.1016/j.geoen.2023.211702
Zhang, M., Zhang, X., Liang, J., Jiang, X., Gan, L., Sun, X., et al. (2024). Application of multicomponent seismic data to tight gas reservoir characterization: a case study in the sichuan basin, China. Geophysics 89 (4), B301–B315. doi:10.1190/geo2023-0442.1
Zhi, L., Chen, S., and Li, X.-Y. (2016). Amplitude variation with angle inversion using the exact zoeppritz equations—Theory and methodology. Geophysics 81 (2), N1–N15. doi:10.1190/geo2014-0582.1
Keywords: multi-wave seismic sedimentology, tight sandstone gas, pseudo-S-wave attribute, seismic lithology prediction, Sichuan Basin
Citation: Dai J, Lv W, Wei W, Yan Y, Luo B, Ran Q, Chen K and Wang Y (2025) Multi-wave seismic sedimentology in geological anomaly characterization: methodological innovations and case applications. Front. Earth Sci. 13:1675581. doi: 10.3389/feart.2025.1675581
Received: 29 July 2025; Accepted: 30 September 2025;
Published: 16 October 2025.
Edited by:
Dicky Harishidayat, Pertamina Hulu Energi, IndonesiaReviewed by:
Amir Ismail, Texas A&M University Corpus Christi, United StatesNandito Davy, King Fahd University of Petroleum and Minerals, Saudi Arabia
Copyright © 2025 Dai, Lv, Wei, Yan, Luo, Ran, Chen and Wang. This is an open-access article distributed under the terms of the Creative Commons Attribution License (CC BY). The use, distribution or reproduction in other forums is permitted, provided the original author(s) and the copyright owner(s) are credited and that the original publication in this journal is cited, in accordance with accepted academic practice. No use, distribution or reproduction is permitted which does not comply with these terms.
*Correspondence: Juncheng Dai, ZGFpanVuY2hlbmcxOTk1QHBldHJvY2hpbmEuY29tLmNu