 Wei Huang1,2
 Du Xiao2*Junfeng Li1
 Fang Ben1
 Fei Li2*Zhili Xu2Zhanhong Cao2Lei Liu2Shan Wu3Hao Wang3Zhiqiang Ding3
- 1State Key Laboratory of Deep Earth and Mineral Exploration, Institute of Geophysical and Geochemical Exploration, Chinese Academy of Geological Sciences, Beijing, China
- 2Ministry of Natural Resources, Institute of Geophysical and Geochemical Exploration, Chinese Academy of Geological Science, Tianjin, China
- 3Laboratory of geophysical Electromagnetic Probing Technologies, Ministry of Land and Resources, Tianjin, China
Introduction: The fixed-wing time-domain airborne electromagnetic (FTDAEM) detection system is a geophysical exploration equipment carried on a fixed-wing aircraft, which detects underground electrical structures by transmitting and receiving transient electromagnetic fields. The FTDAEM systems hold a pivotal position in aerial geophysical exploration due to their exceptional endurance and high-efficiency survey capabilities. Although significant progress has been made in airborne electromagnetic technology, core technical details of various systems remain confidential.
Methods: To foster technological exchange and advancement in this field, our research team has, for the first time, fully disclosed the proprietary technology of the self-developed FTDAEM system (iFTEM-II). Building upon the 350-m detection depth achieved by the first-generation system (iFTEM-I), the team selected the Y12F aircraft platform with superior payload capacity and conducted comprehensive redesigns and research and development on all critical components, successfully developing a second-generation deep-detection system. This system has achieved multiple technological breakthroughs: (1) instantaneous kiloampere-level high-current, low-base-frequency large-moment transmission technology; (2) aircraft modification featuring externally mounted flexible transmitter coils and long-suspended receiver pods; (3) precise extraction technology for nanovolt-level weak signals in dynamic high-interference environments; and (4) high-volume data rapid processing and practical inversion technology.
Results: Verified by the actual exploration data, the effective detection depth of this system has reached 600 m. The successful development of the iFTEM-II system provides a reliable technical means for the rapid conduct of large-scale deep resource surveys.
Discussion: The open sharing measures of the system technology are conducive to promoting the progress of industry technology.
1 Introduction
The time-domain airborne electromagnetic (TDAEM) exploration system is a geophysical exploration equipment based on an aircraft platform. It emits a pulsed electromagnetic field (primary field) into the ground through an airborne transmitting coil and uses a receiving system to observe the transient electromagnetic response (secondary field) induced in the underground medium. Then, it inversely calculates the underground electrical structure. It is widely used in mineral resource exploration, hydrogeological surveys, and other fields (Lin et al., 2021). As an efficient and high-precision airborne geophysical exploration technology, it has significant value in metal ore exploration, water resource assessment, environmental monitoring, and other aspects. The fixed-wing time-domain airborne electromagnetic system uses a fixed-wing aircraft as the carrying platform and achieves detection through an external transmitting coil and a pod-type receiving device. It has the advantages of large detection depth and high working efficiency, and is particularly suitable for large-scale exploration in complex terrain areas such as mountains, deserts, and swamps, effectively breaking through the limitations of traditional ground exploration in terms of passage conditions.
The detection depth of FTDAEM systems can be flexibly adjusted based on parameters such as transmitter magnetic moment, enabling multi-scale exploration from shallow to deep subsurface. Internationally, a series of standardized equipment systems have been developed, primarily including.
1. The TEMPEST light system, based on a 3-ton-class Trislander aircraft platform with a magnetic moment of 50,000 Am2.
2. The iFTEM-I light system, using a 5-ton-class Y12IV aircraft platform with a magnetic moment of 504,000 Am2.
3. The GEOTEM medium system, deployed on an 8-ton-class CASA212 aircraft platform with a magnetic moment of 700,000 Am2.
4. The MEGATEM heavy system, mounted on a 20-ton-class Dash7 aircraft platform with a magnetic moment of 2,200,000 Am2.
These systems acquire secondary electromagnetic field responses—either the time-derivative (dB/dt) or the magnetic field (B) itself—using three-component receivers, achieving effective exploration depths of 300–800 m. They have been widely applied in mineral resource exploration, hydrogeological surveys, and environmental monitoring (Annan and Lockwood, 1991; Smith et al., 2003; Yin et al., 2015). With advancements in data processing and interpretation techniques, this method has become a vital tool in airborne geophysical exploration (Ley-Cooper et al., 2019; Burton et al., 2019). In recent years, the depletion of easily identifiable shallow mineral resources has posed significant challenges to mineral exploration, necessitating a major strategic shift. Exploration targets have transitioned from traditional near-surface deposits to deep-seated concealed deposits (>500 m) and resources beneath extensive overburden (Xiong et al., 2024). This shift demands geophysical exploration technologies with greater depth penetration and higher resolution (Di et al., 2019). Against this backdrop, the development of large-depth TDAEM systems has emerged as a critical focus in geophysical exploration.
Conventional airborne electromagnetic (AEM) systems struggle to meet the demands of deep mineral exploration due to limitations in transmitter power and signal reception sensitivity. The next-generation large-depth TDAEM systems, however, achieve significant improvements in exploration depth and signal-to-noise ratio (SNR) through key technological advancements, including high-power transmitter technology and high-sensitivity magnetic sensors. Research indicates that the system’s detection depth is closely related to several critical parameters, including sampling time, transmitter magnetic moment, ground conductivity, ambient noise levels, and instrument sensitivity. Among these, the transmitter magnetic moment—determined by the coil area, current intensity, and number of turns—exhibits a positive correlation with detection depth. Large-depth exploration requires high transmitter magnetic moment, low noise levels, and high sensitivity (Han et al., 2019). However, these parameters are interdependent and often involve trade-offs: for instance, wide bandwidth reduces sensitivity, while high sensitivity necessitates narrow bandwidth. Thus, optimizing detection depth requires a careful balance among these factors. To enhance system performance, the following strategies can be employed: increasing transmitter magnetic moment by optimizing current intensity, coil turns, and area; reducing noise levels to improve detection depth; controlling bandwidth appropriately to enhance resolution for subsurface structures up to 500 m; applying geometric corrections, primary field removal, and advanced data processing techniques to significantly improve SNR. Through these measures, the overall detection capability of the system can be substantially enhanced.
To overcome the technical bottlenecks arising from the mutual constraints among the aforementioned parameters and achieve effective detection of deeper underground resources, the research team successfully developed a next-generation large-depth FTDAEM exploration system (iFTEM-II) through optimization, upgrading, and innovative redesign of the existing iFTEM-I system (Zheng et al., 2022). While inheriting the traditional technical advantages, the iFTEM-II system has achieved comprehensive performance enhancements and technological innovations specifically tailored for deep exploration. This paper focuses on four core research achievements of the iFTEM-II system: (1) A large-magnetic-moment transmission system that provides kiloampere-level transmission current through the development of high-power supply units; (2) A high-sensitivity reception system that significantly improves signal acquisition quality while ensuring aircraft safety through spatially orthogonal triaxial broadband receiving coils, an intelligent winch control system, and an optical positioning and navigation system; (3) A specially modified flight platform that addresses flight safety and stability issues through professional modifications; (4) A data processing system that incorporates advanced algorithms for noise suppression to provide high-quality data for inversion and interpretation. These technological innovations collectively form a systematic solution for achieving greater exploration depths, offering a novel technical approach for deep resource exploration.
2 FTDAEM system design
The research and development of the FTDAEM system involves the collaborative design of software and hardware and mainly includes four core modules: a large magnetic moment launching system, a highly sensitive receiving system, a specialized flight platform modification, and an efficient data processing platform.
2.1 Launching system
The development of the transmitter system involves three core components: a high-power supply unit, transmitter, and transmitting coil.
2.1.1 Power supply
To achieve kiloampere-level transmission current and enhance the system’s magnetic moment, two critical technical challenges must be addressed: (1) the conflict between the instantaneous power limitation of the aircraft platform’s power supply (below 10 kW) and the kiloampere-level current requirement; and (2) the efficiency bottleneck of conventional full-bridge/half-bridge topologies in kilowatt-level power conversion. To overcome these challenges, this study proposes developing a dedicated transmitter to mitigate platform power supply constraints and designing a specialized high-power supply system to reduce transmission and conversion losses, thereby improving transmission efficiency.
The high-power supply system delivers stable power output to the transmitter. Addressing the constraints of the aircraft platform’s limited 28V DC power supply and the significant losses caused by power device voltage drops, loop impedance, and contact resistance under low-voltage conditions, this study proposes an innovative solution. As illustrated in the schematic diagram of the high-power supply system (Figure 1), a DC/DC array-based modular power architecture is employed, achieving power enhancement through series-connected voltage boosting and parallel-connected current expansion.
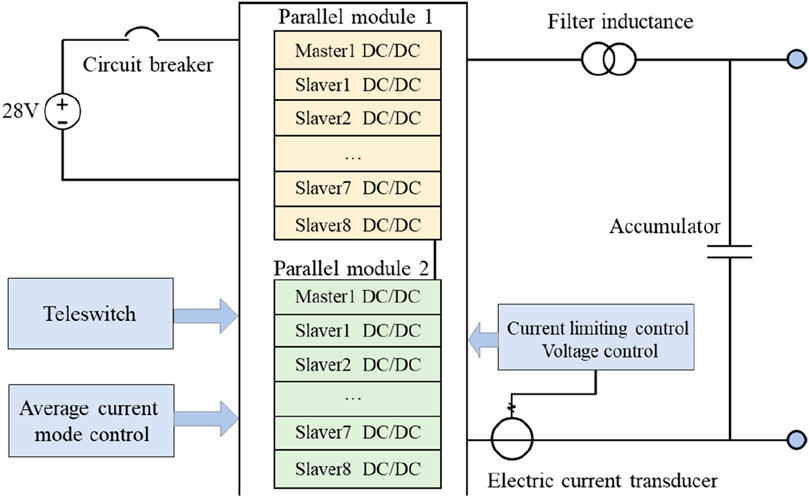
Figure 1. Block dagram of the array-type high-power supply. This system is constructed with multiple DC/DC modules in an array-like topology. It adopts a design scheme of parallel expansion of modules and series boosting between modules, combined with current sharing and constant current control technologies, to achieve stable output of kilo-ampere-level high current, providing core energy support for deep exploration.
The system incorporates current-sharing technology to mitigate transient/dynamic response and thermal dissipation challenges while improving reliability by preventing component damage from excessive current in individual branches. Current-stabilizing technology safeguards against output short-circuit or overcurrent damage to power modules, featuring intelligent monitoring of output current variations (Wang et al., 2022). This technology adjusts module output voltage through negative feedback to maintain current stability. The coordinated operation of all modules is ensured through the integration of both current-sharing and current-stabilizing control technologies.
A specially designed supercapacitor energy storage unit with 2000A instantaneous discharge capability effectively resolves high-power transient demand challenges. Figure 2a clearly demonstrates the compact layout of the internal modular array, while Figure 2b displays the power supply chassis exterior, with designated areas showing input current/voltage and output current/voltage parameters.
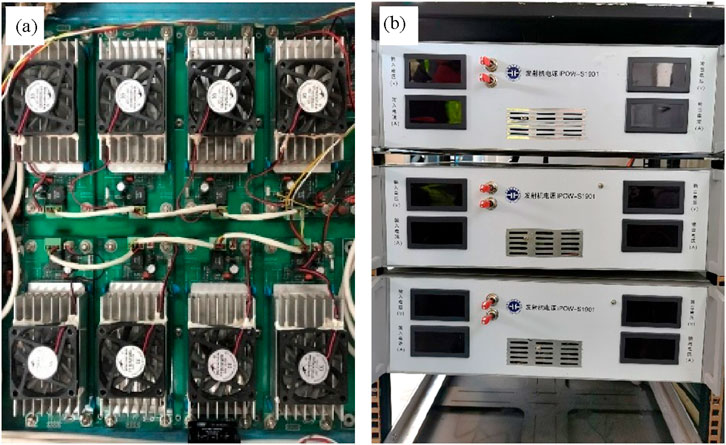
Figure 2. Internal and external physical views of the DC power supply chassis. (a) Array-configured modules of the power supply’s internal structure; (b) External view of the power supply chassis.
2.1.2 The transmitter
The high-power transmitter is equivalent to the source, providing a single field that can excite the medium underground. Considering the influence of air resistance of the transmission coil on the aircraft’s maneuverability, the diameter of the transmission coil cannot be increased, and the impedance of the transmission coil cannot be reduced. To achieve an increase of more than 1 times in the peak magnetic moment of the transmission, a low-loss and high-efficiency pulse transmission scheme must be designed. Under the condition of not significantly increasing the weight and volume of the system, a large magnetic moment transmission can be realized. The transmitter developed by the team consists of three core modules: the power inverter unit, the waveform control unit, and the system monitoring unit. The power inverter unit adopts a full-bridge topology structure to achieve efficient conversion from DC to bipolar pulse current; the waveform control unit is developed based on the FPGA architecture and integrates multi-channel IGBT synchronous drive functions; the system monitoring unit realizes real-time status monitoring and protection.
Key technical breakthroughs include: the innovative overvoltage protection circuit effectively suppresses the voltage overshoot during the large current turn-off; the specially designed absorption capacitor network can quickly dissipate the peak energy of the turn-off transient; multiple protection mechanisms (overvoltage/undervoltage/overcurrent/overheating) significantly improve the system reliability. Through these technological innovations, the final transmitter has advanced functions such as six-level power regulation, selectable base frequencies of 12.5 Hz/25 Hz, internal and external synchronous triggering, and single/multi-wave transmission modes. Its overall structure is shown in Figures 3a,b. This design improves the safety, electromagnetic compatibility, and reliability of the transmitter through optimized waveform shaping technology and electromagnetic compatibility measures.
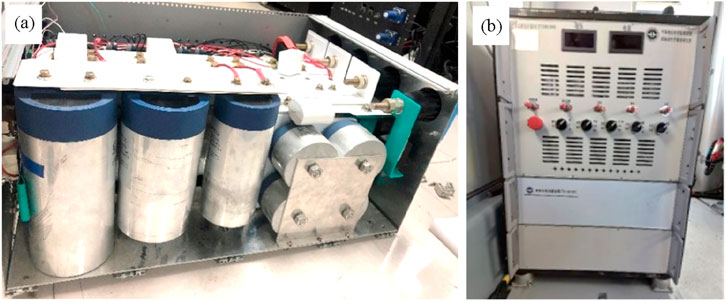
Figure 3. The internal and external entity diagrams of the transmitter. (a) Internal structure diagram of the transmitter. The cylindrical object represents multiple sets of parallel high-voltage energy storage capacitors, which achieve instantaneous kilo-ampere current output through coordinated charging and discharging; the white module on the upper right is the overvoltage protection device, which can effectively suppress the current rebound during the shutdown moment and ensure the safety of system components. (b) External operation panel of the transmitter. It is equipped with clearly segmented adjustment units, enabling flexible configuration of transmission parameters and quick switching of working modes.
2.1.3 Launch coil
The main focus of the operation of the launch coil is to address key issues such as material selection, pneumatic stability design, and ground verification. In terms of material selection, through comprehensive evaluation of core parameters such as resistivity and density, the coil’s DC resistance and weight indicators were optimized to ensure flight safety and high-current launch performance.
As shown in Figure 4, a specially designed aerodynamic stabilization device was specifically developed to effectively suppress the coil’s oscillation during flight, eliminating potential vibration risks. During the testing phase, the launch system was comprehensively verified, including tests of the coordinated operation of the transmitter, power supply, and coil, with a particular emphasis on key parameters such as coil turns, launch current, and effective area. The test data showed that under a launch current of 1.22 kA and a fundamental frequency of 12.5 Hz, the system could achieve a launch magnetic moment of 1211.46 kAm2.
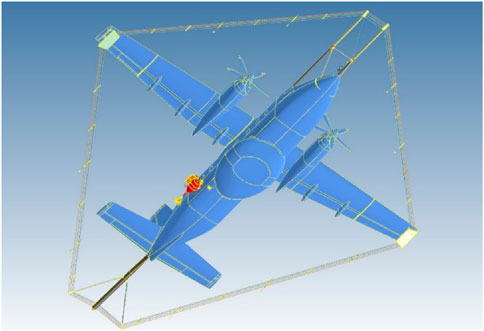
Figure 4. The design layout drawing of the transmitting coil. Five turns of transmitting coils are fixed around the Y12F aircraft, and pneumatic stabilizing devices are placed on them to reduce the noise caused by the swaying of the coils and avoid the impact of excessive swaying of the coils on the safety of the aircraft.
The current system primarily employs a half-sine wave as the transmission waveform, while also incorporating alternative waveform designs such as trapezoidal waves and multi-waves (a combination of half-sine waves and small trapezoidal waves). However, due to the specific requirements of practical exploration tasks, these waveforms have only undergone preliminary testing and have not yet been deployed in field operations. Based on the electrical characteristics of the subsurface media in the target area and the desired exploration depth, a transmission current of 700A is selected to meet the detection requirements. The system sampling rate is set to 100 kHz, with a fundamental frequency of 12.5 Hz, corresponding to a half-period of 40 ms for the half-sine wave. As shown in the measured waveform in Figure 5, the power-on time is 5.5 ms, and the power-off time is 34.5 ms. The current shutdown process is clean and sharp, with no adverse phenomena such as rebound, jitter, or tailing, fully demonstrating the excellent stability of the transmission system.
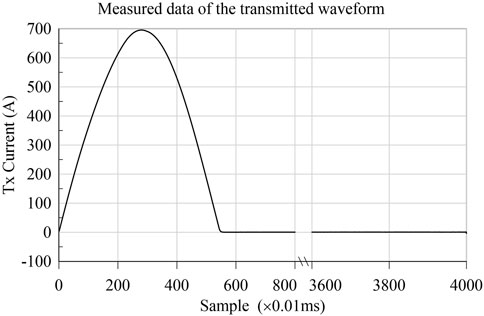
Figure 5. Measured bipolar half-sine emission waveform of the system. The system emits positive and negative alternating half-sine waves at a fundamental frequency of 12.5 Hz. The x-axis represents the sequence of sampling points, and the y-axis represents the current amplitude. The waveform starts to turn off at the 551th sampling point (corresponding to 5.5 ms), and the current remains zero from the 4000th sampling point (40 ms). While recording the signal during power supply, the system focuses on collecting the secondary field attenuation response after power interruption, which is used for the inversion of the electrical structure of the underground medium.
2.2 Receiving system
The receiving system is composed of a receiving pod, an electric winch, and high-precision positioning and navigation components. The receiving system is the device used by the FTDAEM system to receive signals. Below, the composition, functions, and development status of these three core components will be introduced respectively.
2.2.1 Induction coils
The receiving pod integrates three-component electromagnetic induction coils as the core sensing unit, while the electric winch is responsible for precisely controlling the deployment and retraction of the pod. The core of this system design lies in achieving the three-component synchronous measurement of the induction coil sensors, ultra-low noise characteristics, and wide-band response capability. Among these, multi-component measurement can comprehensively obtain the spatial orientation information of underground targets, the ultra-low noise design significantly improves the quality of late-channel signals to enhance the detection depth, and the wide-band response effectively improves the resolution ability of shallow geological structures.
The three-component electromagnetic induction coil is composed of three orthogonal axial induction units distributed in the X, Y, and Z directions in space. Its mechanical structure adopts a symmetrical layout of a hexahedral frame as shown in Figure 6. Considering the characteristics of the transient electromagnetic signal, such as a wide dynamic range, rapid attenuation, and wide frequency band, the receiving system is designed to cover the entire frequency band from 0 to 25 kHz. The system uses a programmable gain amplification circuit to process the microvolt-level secondary field signal (Wang et al., 2019), and combines an active mechanical suspension damping mechanism to effectively suppress motion noise interference. The receiving pod integrates a high-precision position sensor to record the three-axis spatial attitude data in real time for later motion correction. Through actual measurement, the successfully developed three-component induction coil has excellent low-noise characteristics, and the passbands of the X, Y, and Z component sensors have all reached 25 kHz.
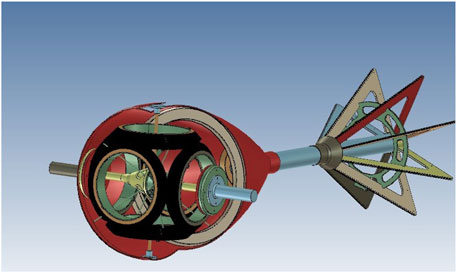
Figure 6. Schematic diagram of the internal three-component sensing coil structure of the receiving pod. The X, Y, and Z component coils are symmetrically distributed in a hexahedral configuration, with a suspension and shock absorption mechanism placed at the center, effectively suppressing mechanical vibration noise caused by air flow disturbances. The tail of the pod adopts an aerodynamic shape design, further enhancing the attitude stability during flight and ensuring the quality of data collection.
2.2.2 Electric winch
The aviation electric winch adopts advanced DC drive technology and makes improvements in system weight and size. It integrates the servo mechanism with the digital operating system, enhancing the control accuracy and operational adaptability of the winch. Besides having excellent electrical transmission performance, the system also incorporates intelligent functions such as automatic cable release, speed regulation, manual/automatic dual-mode switching, and precise measurement of release length. The specially designed receiving cable is made of high-strength composite material, featuring anti-tensile, wear-resistant, and anti-electromagnetic interference properties. As shown in Figure 7a, the electric winch is optimally arranged inside the aircraft, and the cable extends to the outside through a dedicated channel inside the fuselage. To ensure flight safety, an emergency braking device is set inside the aircraft skin (Figure 7b), which can respond quickly when there is an abnormality in the cabin, effectively avoiding potential safety risks. This integrated design not only ensures the functionality of the system but also fully considers the special safety requirements of aircraft.
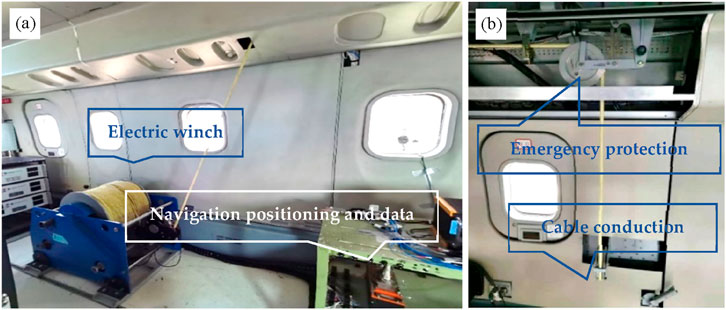
Figure 7. Receiving pod programmed winch take-up device. (a) Electric winch, navigation positioning and data acquisition; The receiving pod is operated for retraction and release through the electric winch. (b) Emergency protection device and cable conduction mechanism. When an uncontrollable situation occurs in the receiving pod and affects the safety of the aircraft, the emergency protection device will take cut-off measures to ensure the safety of the aircraft.
2.2.3 High-precision positioning and navigation
In response to the functional limitations of the Y12F airborne navigation system in airborne electromagnetic measurement, the project team developed a high-precision navigation and positioning system. This system includes professional measurement functions such as line planning, real-time yaw monitoring, and precise altitude maintenance.
The core of the system consists of three major modules: the line management module is responsible for flight mission planning, the real-time navigation module provides centimeter-level positioning guidance, and the data recording and playback module ensures the traceability of the measurement process.
The specially designed pod monitoring unit uses optical positioning sensors and differential GPS fusion technology to obtain the three-dimensional relative position relationship between the pod and the aircraft in real time, with a positioning accuracy of 0.1 m. All functional modules are integrated into an independently developed navigation software platform, and the measurement process is intelligently controlled through a user-friendly interface. Figure 8 shows the optical sensor configuration scheme of this system.
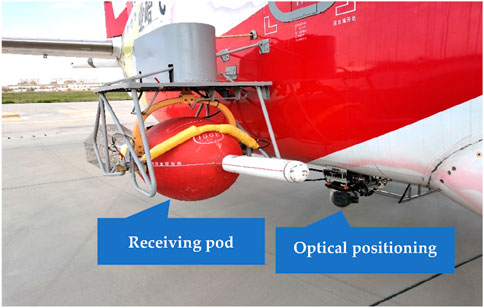
Figure 8. The layout of optical positioning sensor in flight platform. The receiving pod contains components such as the receiving coil, GPS positioning, pose acquisition module, and preamplifier. Staff can observe the position and safety of the receiving pod in real time through the optical positioning system.
2.3 Modification of the flight platform
To enhance the system’s detection capability, our research institute adopted an 8-ton Y12F aircraft platform and carried out professional modifications to achieve a larger emission magnetic moment. Systematic tests need to be conducted on the modified flight platform to ensure its flight performance and handling stability. The modification plan strictly follows aviation engineering standards, ensuring that the platform’s structural strength, stiffness characteristics, service life, and power system performance, among other core parameters, all maintain the same technical standards as the original Y12F aircraft.
According to the specific requirements of the FTDAEM system, a systematic modification design was carried out for the flight platform, with a focus on the aerodynamic characteristics of the launch coils and the receiving pods. A 1:9.5 scale model was used for aerodynamic simulation and wind tunnel tests to comprehensively evaluate the aerodynamic performance, structural stability, and control characteristics under different flight conditions. The aerodynamic analysis provided key parameters for design optimization, ensuring that the system achieves the best detection performance while maintaining flight safety. The wind tunnel tests simulated complex flight environments to verify key indicators such as structural strength, vibration characteristics, and noise levels, effectively reducing the actual modification risks.
Based on the feasible solution verified through experiments, the physical structure of the flight platform was modified. The interior renovation of the cabin included: converting the passenger cabin into a dedicated working cabin, installing core equipment such as transmission cabinets, reception cabinets, and high-power onboard power supplies, setting up double-person operation positions and equipping them with dedicated communication interfaces, and conducting necessary structural openings to accommodate equipment installation. The external modification mainly involved: adding front struts, rear tail tubes, and wingtip brackets as support structures for laying the transmission coils; setting up a dedicated mounting platform on the right side of the fuselage to fix the receiving pod. All modified parts underwent strict structural strength verification and implemented targeted reinforcement measures to ensure they met the flight mechanics’ performance requirements. Figures 9a,b show the equipment layout inside the cabin: Figure 9a shows the view from the front of the aircraft towards the tail, and Figure 9b shows the view from the tail of the aircraft towards the nose. In Figure 9b, the left side is the interactive control platform, the right side is equipped with a data acquisition system, and power supply and transmitters are installed in the front. Figure 10 presents the overall view of the modified flight platform, clearly showing that the external structures such as the front struts and wingtip brackets are surrounded by the transmission coils.
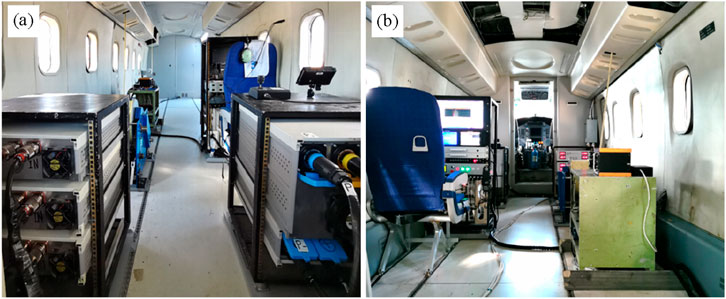
Figure 9. Interior layout of the Y12F aircraft platform after modification. (a) View from the front of the cabin, showing core equipment such as high-power power supply, launch host, and electric winch; (b) View from the rear of the cabin, presenting auxiliary units such as data collection system and human-computer interaction terminal. The integrated layout throughout the cabin takes into account functional zoning and operational space, ensuring efficient coordination of the avionics system.
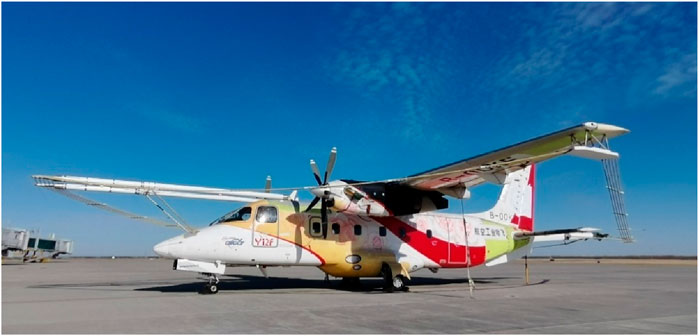
Figure 10. Schematic diagram of the external structure of the Y12F aircraft platform after modification. Five turns of transmitting coils are laid around the fuselage to generate an electromagnetic field underground; the nose, tail, and both wings have undergone structural reinforcement modifications. The receiving pod and optical positioning platform are integrated on the other side of the fuselage to achieve spatial isolation for transmission and reception and coordinated operations.
The modified flight platform underwent system verification through ground vibration tests and electromagnetic compatibility tests. A multi-point excitation modal analysis method was employed to conduct the full aircraft vibration test. A limited number of excitation devices and acceleration sensors were arranged at key positions to simulate the flight conditions in a free state. The test data indicated that the modified structure met the requirements for strength and durability, effectively avoiding fatigue risks during flight. Subsequently, the electromagnetic compatibility test evaluated the interaction between the iFTEM-II system and onboard equipment. The test covered three typical working conditions: power outage, ground power supply, and engine operation. By optimizing the system layout and shielding design, significant reduction in electromagnetic interference was achieved, ensuring the reliable operation of the flight platform’s communication and navigation system. The entire verification process provided a guarantee for the smooth implementation of subsequent flight tests.
After completing the system modification design, aerodynamic characteristic analysis, wind tunnel tests and ground tests, the iFTEM-II system smoothly entered the flight test verification stage. The joint test team composed of Hafei Aviation Industry, Hafei General Aviation and the Institute of Geophysical and Geochemical Exploration of the Chinese Academy of Geological Sciences overcame difficulties such as extreme low temperatures in winter and completed all the flight test tasks within 135 days. The test cumulatively completed 46 flights, lasting 94 h and 49 min, including 10 flights of formal measurement, successfully obtaining 2185 km of high-quality detection data, and comprehensively verified the flight safety, operational reliability and data stability of the system. Figure 11 shows the working state of the system, with the pod located at the rear bottom of the aircraft.
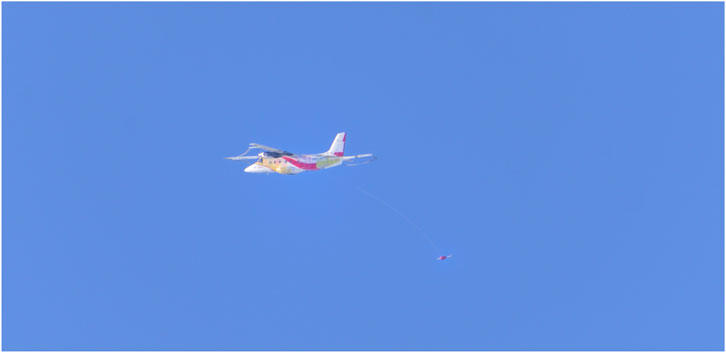
Figure 11. The aerial operation mode of the iFTEM-II system. The receiving pod is positioned behind the aircraft in a trailing manner and is used to collect the secondary field signals generated by the sensing of underground media.
2.4 Data processing
TDAEM data processing technology has advanced from the theoretical research stage to the engineering application stage. The complete data processing involves two key steps: data preprocessing and inversion interpretation. Data preprocessing mainly addresses the multi-source interference issues introduced during the original data acquisition process, enhancing data quality through techniques such as noise suppression; inversion interpretation converts the processed data into a model of underground electrical property distribution, and combines the regional geological background for comprehensive geological interpretation, ultimately achieving precise positioning of underground resource targets.
The core objective of data preprocessing lies in eliminating the impact of various interference noises on electromagnetic signals (Smith, 2001; Zhu et al., 2016; Ben et al., 2018; Zhang et al., 2019; Huang et al., 2020b; Li et al., 2020; Yu et al., 2023). Through the development of systematic data processing techniques, the team has successfully achieved precise extraction of nanovolt-level weak signals in dynamic high-interference environments. Specific measures include: effectively suppressing motion-induced noise interference using polynomial fitting methods (Huang et al., 2019; 2020a); significantly mitigating atmospheric noise through hybrid multi-window shear filtering techniques (Ben et al., 2020); and accurately eliminating power frequency interference via comb filter algorithms (Huang et al., 2023). The integrated application of these methods has substantially enhanced the system’s capability to extract signals in complex electromagnetic environments.
Figure 12a visually demonstrates the profile of raw data streams, where strong noise in dynamic interference environments is evident, overwhelming the weak electromagnetic response signals. After data preprocessing, the noise is effectively suppressed. Figure 12b clearly displays the nanovolt-level secondary field response signals. The comparative results before and after preprocessing not only validate the effectiveness of the processing method but also provide reliable profile characteristic information for interpreters, establishing a solid foundation for geological interpretation work.
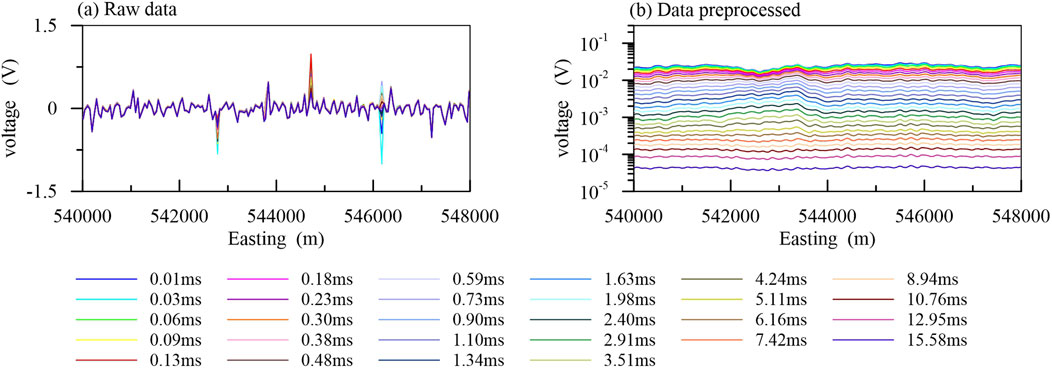
Figure 12. Comparison of profile responses before and after data preprocessing. (a) Original data profile, where the noise amplitude significantly obscures the useful signal and the response features are chaotic and irregular; (b) Profile after noise suppression, where the signals of different time traces show a clear regular distribution, effectively reflecting the electromagnetic response variation characteristics between the measurement points.
The high-quality data obtained through data preprocessing can enhance the reliability of the inversion results. Besides using the SVD (Singular Value Decomposition) algorithm of the Airbeo program (Raiche et al., 2007) and the SCI (Spatially Constrained Inversion) algorithm of the Workbench software of Aarhus University (Auken et al., 2015), the project team developed an efficient three-dimensional forward and inverse algorithm. In the forward modeling aspect, the generalized finite difference method combined with the backward Euler implicit difference scheme effectively solved the problem of early oscillation in the traditional method during the time discretization process; innovatively introduced the concept of the effective influence range of the anomaly field, reducing the calculation area from the traditional global domain to the influence range of the anomaly body, significantly reducing the number of grid divisions; at the same time, combined with the local grid multi-scale division technology and the multi-wavefront direct solver, significantly improved the computational efficiency. In the inversion aspect, based on the Gauss-Newton optimization framework, through regularization techniques, it balanced the data fitting and model smoothness; using the adjoint forward method to quickly calculate the sensitivity matrix, combined with the local grid technology to achieve independent calculation of the sensitivity of each emission source; finally, through the preprocessed conjugate gradient method, efficiently solved the inversion equations. The algorithm has been successfully validated through theoretical simulations and measured data (Ren et al., 2018). When applied to our system, the inversion results show high consistency with drilling resistivity data (as illustrated in Figure 18). As shown in Figure 13, it can be clearly observed from the figure that the lateral distribution patterns of the high-resistance layer and the low-resistance layer are as follows: as the Y coordinate increases, the distribution range of the high-resistance layer gradually expands, while the shallow low-resistance layer shows a similar distribution pattern in different slices. The resistivity distribution near the surface is uneven, with high and low resistance bodies alternating, but the deep part shows a low-resistance characteristic, reflecting the evolution characteristics of the electrical structure from shallow to deep in this area.
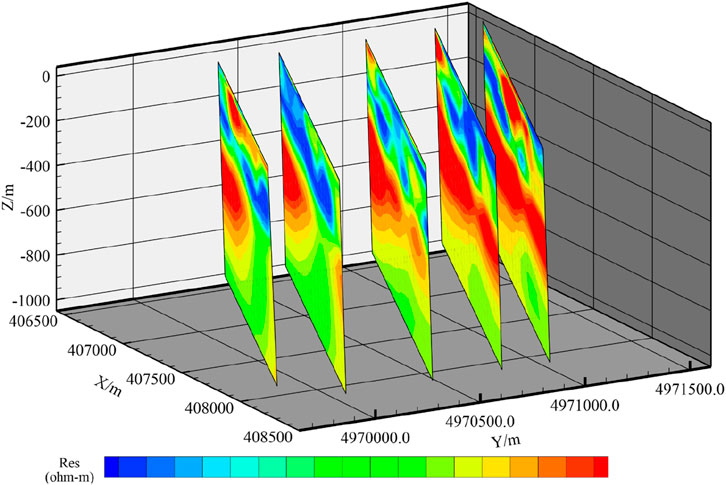
Figure 13. 3D inversion of measured data from the iFTEM-II system. The inversion profile clearly reveals the electrical characteristics of the subsurface formation in the survey area: the shallow section (above 100 m) exhibits interbedded high and low resistivity layers, the middle section (100–200 m) contains a distinct low-resistivity anomaly zone, while the interval from 200 to 500 m is characterized by a continuous high-resistivity layer.
The successful development of this 3D inversion algorithm provides a reliable technical means for characterizing subsurface electrical structures and offers critical support for deep mineral exploration.
The project team developed a fully functional FTDAEM data processing software platform (Xu et al., 2020). The platform adopts a modular architecture design, possesses the ability to handle and display massive data, and has solved the problem of unified storage management and efficient processing of massive multi-type data. The platform fully integrates the TDAEM data preprocessing function module, combined with a parallel computing architecture, effectively reduces the system data noise level, significantly improves the efficiency of processing massive data, and realizes the standardization and automation of the data processing process. In terms of visualization, as shown in Figure 14, the platform has developed advanced display technologies such as data track customization, graphic customization, and graph-number interaction, graph-graph interaction, etc., supporting multiple data display modes, greatly enhancing the intuitiveness and efficiency of data interpretation. The software can display and process large amounts of multi-parameter data, achieving unified data management, data display, and data processing, and playing an important role in data analysis and processing.
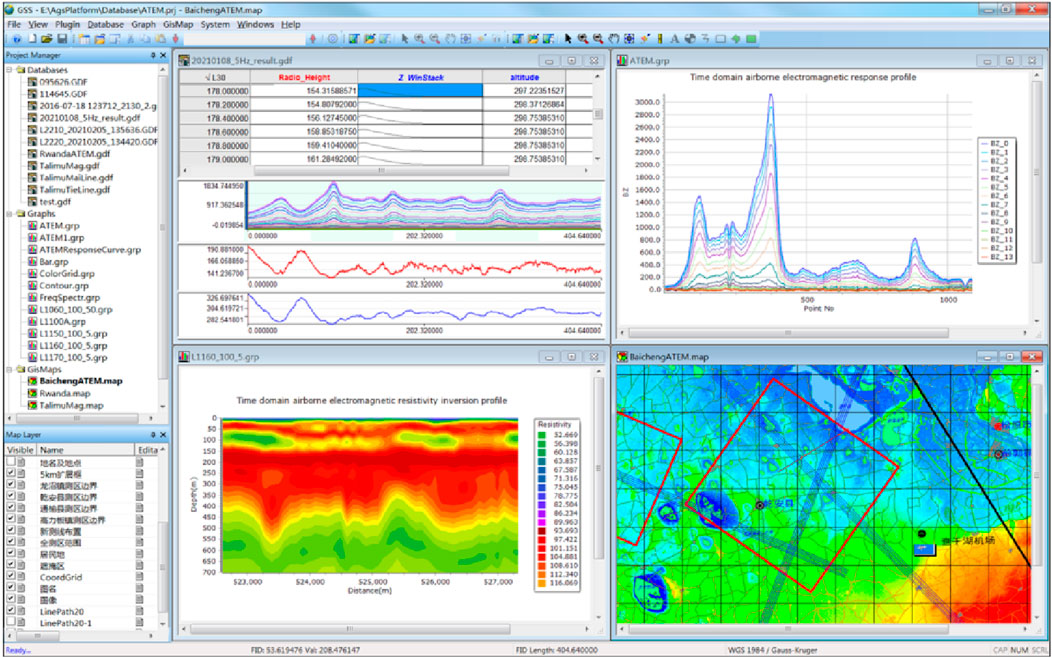
Figure 14. Time domain airborne electromagnetic data processing software. The platform adopts a modular layout: the upper part is the function toolbar, the left side integrates the project management and database display area, supporting the classified storage of data in the work area; the main interface of the working area can synchronously display multi-dimensional information such as data columns, profile curves, single-point attenuation curves, spectrum curves, *.map format mapping, inversion result mapping, and geological base maps. The system covers core functional modules such as database management, visualization analysis, and data processing.
In summary, the iFTEM-II system is an advanced airborne electromagnetic detection system built on the platform of an 8-ton Y12F aircraft. This system adopts an external-mounted design, with 5 turns of 245 m2 transmitting coils and a retractable towable receiving pod installed on the aircraft’s exterior; the cabin interior integrates a high-power power supply and a high-power transmitter, jointly forming an emission subsystem capable of generating large magnetic moment electromagnetic pulses. The system is designed with a receiving pod deployment subsystem including a direct process control electric winch, emergency protection devices, and a dedicated mounting structure, ensuring the safe and stable operation of the pod. At the same time, the system integrates modules such as data acquisition, satellite positioning, and optical positioning to form an intelligent data acquisition, collection, and control subsystem. Through high-power emission magnetic moments, flexible anti-wind coil design, low-noise pods, and efficient nanovolt-level signal processing technology, the system obtains high-quality electromagnetic data, providing advanced technical means for deep resource exploration.
3 System depth analysis for detection
By adopting a combination of theory and practice, not only can the theoretical calculation determine the detection depth, but also the measured data can be used to compare with the interpretation results and the logging resistivity information, thereby demonstrating the detection depth that the system can achieve.
3.1 Theoretical exploration depth analysis
The traditional method for calculating the electromagnetic detection depth is to use the trend formula. However, the detection target of this system is not an infinitely uniform medium, so this method is not suitable for the depth analysis of this system. Based on a one-dimensional two-layer medium as a reference, starting from the basic theory of airborne electromagnetic sounding in the time domain, under the condition of considering parameters such as the intensity of the emission source and the background noise of the receiver, the theoretical detection depth of the iFTEM-II system is determined. The emission current of the system is I = 700A, the number of turns is n = 5, the emission area is 250 m2, the emission height is 150 m, the receiving height is 100 m, and the transceiver distance is 120 m.
First, determine the relationship between the system and the separation time. For a two-layer medium model, the time at which the second layer is first detected is constant for the same device (Raiche and Spies, 1981), and the separation time formula satisfies:
In Formula 1, σ represents the conductivity of the covering layer, h is the thickness of the covering layer, and t is the separation time. The values vary for different systems, as shown in Figure 15. The responses of the system under five different conductivities and four covering layer thicknesses were calculated respectively to determine that the value of the iFTEM-II type system is 9. The specific algorithm can be found in (Han et al., 2019).
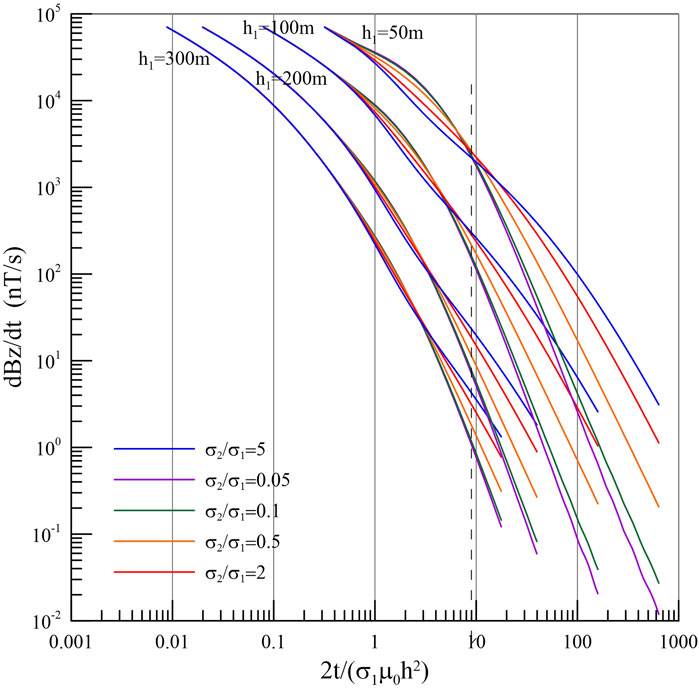
Figure 15. Schematic diagram of the determination method for the separation time of the iFTEM-II system. By establishing geoelectric models with different cover layer thicknesses and underground medium resistivities, the system response characteristics are analyzed to determine the optimal separation time, providing key parameters for subsequent calculation of the detection depth.
Secondly, the maximum detection depth of the system can be determined by using the system’s value. For a multi-layer medium model, it can be equivalently regarded as a two-layer medium model, as long as the average conductivity of the multi-layer medium is used to replace the conductivity of the overlying stratum (Prince, 1949). When the abnormal response drops to the minimum identifiable signal threshold of the system, the system can just distinguish the second layer. Currently, the separation time t = t0 corresponds to the maximum detection depth dmax:
In Formula 2, σav(z) represents the mean conductivity at depth z, calculated as the ratio of the σ integral at different depths z to the depth z itself.
Set the minimum recognizable signal threshold of the system to three times the background noise, simplify the Line 2165 inversion result to a two-layer model, and calculate the detection depth of this model. As shown in Figure 16, the intersection point of the black line and the blue line represents the maximum depth of the system. Therefore, at this point, the maximum detection depth of the iFTEM-II type system is 965 m.
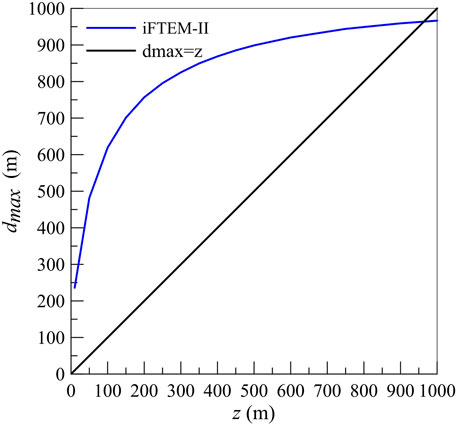
Figure 16. Theoretical detection depth of the iFTEM-II system. The theoretical detection depth (black curve) shows a continuous increasing trend as the underground depth increases, while the actual detection depth (blue curve) is constrained by factors such as noise and reaches a growth bottleneck at a certain depth. The intersection point of the two curves represents the maximum effective detection depth of this system under the current conditions.
3.2 Field-data-based detection depth analysis
Conduct quality statistics on survey area data, including flight altitude, flight speed, deviation distance, data acquisition system dropout rate, and survey grid density. Simultaneously, process repeated lines to demonstrate system repeatability. Perform inversion on two survey lines crossing GD1 borehole in the area and compare the inversion results with borehole resistivity logging data to evaluate the achievable detection depth of the system.
3.2.1 Quality statistics of survey area data
The survey area’s flight workload was 350 km. Statistical analysis showed an average flight altitude of 164.79 m, an average flight speed of 203.29 km/h, a lateral deviation of 14.9 m, and a data acquisition system dropout rate of 0.0%. The line spacing density was 42.5% for 95–100 m and 46.88% for 100–105 m. High-altitude survey line data from late time channels were selected to assess dynamic noise levels, with the Z-component dynamic noise level measured at 0.61 nT/s.
Data repeatability is a critical indicator for evaluating the stability of a measurement system and the reliability of acquired data. To demonstrate system effectiveness (i.e., repeatability), repeat lines L1101 and L1102 were selected. The repeated survey line length was 25.55 km. Figure 17 displays the flight altitude profiles of both lines, showing slight variations in altitude before and after repetition. The average flight altitude was 162 m for Line L1101 and 159 m for Line L1102. As observed in Figure 17, the flight altitudes of both lines fluctuated continuously; thus, altitude correction and displacement correction were applied to the line responses for comparison. The corrected responses are shown in Figure 18. From Figure 18, it is evident that the profile responses of the two repeat lines correlate well. Low responses occur in sections 527,500–528,000, 531,000–531,500, 532,500–535,000, and 537,000–541,000, while high responses are observed in sections 531,500–532,500, 535,000–536,000, and 542,000–544,000. These results validate the repeatability of the iFTEM-II system.
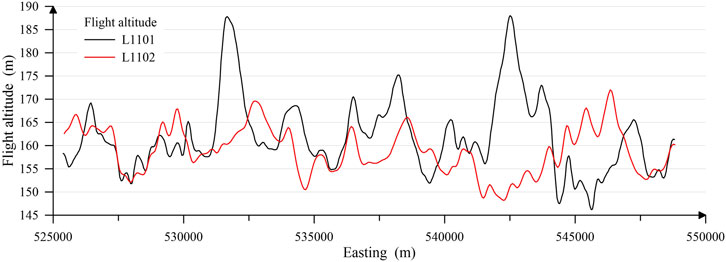
Figure 17. Record chart of repeated flight altitude. To verify the stability of the system, repeated flight measurements were conducted on the same survey line (L1101 and L1102) at different times. Since the amplitude of the observed signals in airborne geophysical exploration is closely related to the flight altitude, it is necessary to accurately record the flight altitude data, which serves as a key parameter for later data comparison analysis and altitude correction.
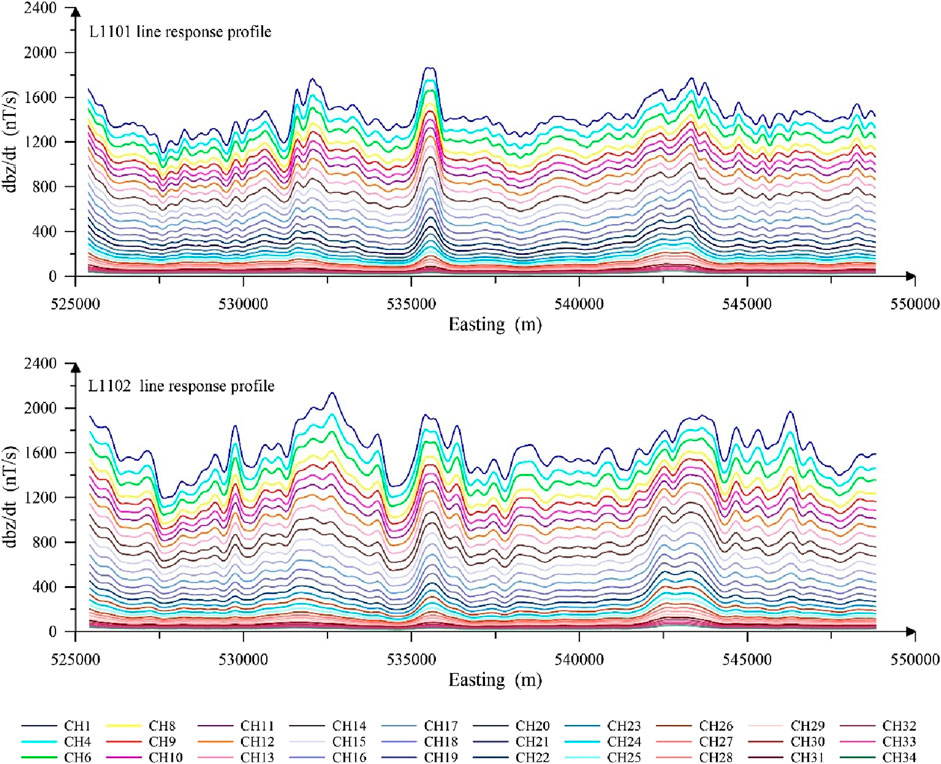
Figure 18. Comparison diagram of the response profiles of L1101 and L1102 survey lines. After data processing, by comparing the profile response characteristics of the two repeated survey lines, if the data variation range and overall trend have a very good consistency, it indicates that the measurement data of this work area is stable and reliable, and can be used for the subsequent analysis of underground structures.
3.2.2 Detection depth analysis
The theoretical detection depth calculated for the iFTEM-II system demonstrates its capability for deep exploration. To further validate the system’s detection performance, inversion results from survey lines L2165 and L10030, which intersect with borehole GD1, were compared with the borehole logging data.
The GD1 borehole is located at the intersection of the survey lines L2165 and L10030, as shown in Figure 19. The positions of some survey lines are indicated in the figure. The specific location of the GD1 borehole is clearly marked with a pentagram symbol. The resistivity value of the GD1 logging varies with depth, as shown in Figure 20. Resistivity starts to change with depth from the 180 m mark, and shows high-resistance characteristics in the ranges of 340 m–360 m, 530 m–620 m, and 750 m–760 m. In other cases, the resistivity remains at around 300 Ω·m. Among them, the 340 m–360 m and 750 m–760 m ranges represent thick layers of high-resistance, while the 530 m–620 m range represents thin layers of high-resistance.
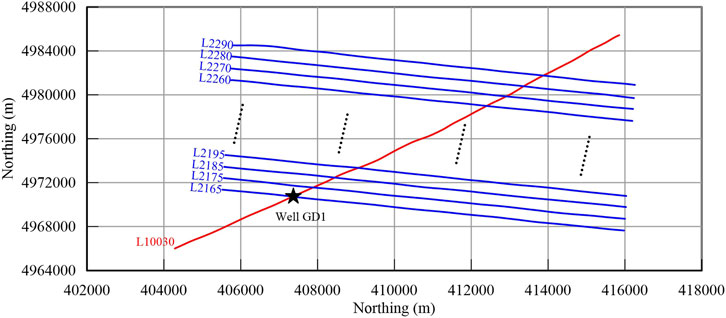
Figure 19. Distribution map of survey line trajectories in the work area. The blue line segments in the figure represent valid survey lines (the invalid data from turning sections have been excluded), and the red line segments are the cutting lines used for data verification and leveling. The five-pointed stars indicate the drilling locations. By comparing the well logging data with the electromagnetic inversion results, the accuracy of data interpretation is verified.
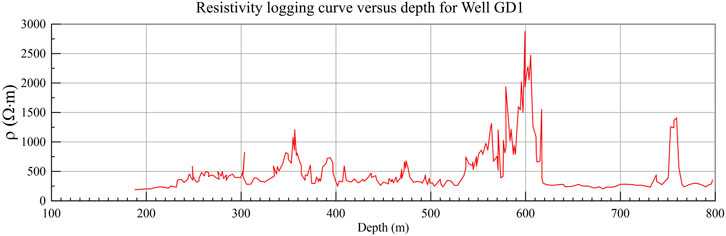
Figure 20. Resistivity logging curve versus depth for well GD1. Based on the actual drilling data, it reveals the vertical distribution characteristics of the resistivity of underground media, providing a verification basis for the results of airborne electromagnetic inversion.
The system’s measurement parameters were configured as follows: transmission current I = 700 A, number of turns n = 5, transmission area = 250 m2, transmission height = 150 m, and transmitter-receiver separation = 120 m. The field data from lines L2165 and L10030 were inverted using the one-dimensional damped characteristic parameter method (SVD). The initial inversion model assumed a layered homogeneous half-space with a resistivity of 200 Ω·m.
Figure 21 presents the inversion results for both survey lines, which were acquired in topographically flat terrain with horizontally stratified subsurface structures. The survey was conducted during winter in northeastern China, where seasonal frozen ground formation resulted in elevated near-surface resistivity values. The borehole location is marked by red lines on both inversion profiles, showing good agreement in apparent resistivity distribution patterns at the GD1 intersection between the two lines. These patterns also correlate well with the borehole resistivity log data, though the inverted resistivity values were systematically lower than the logged measurements.
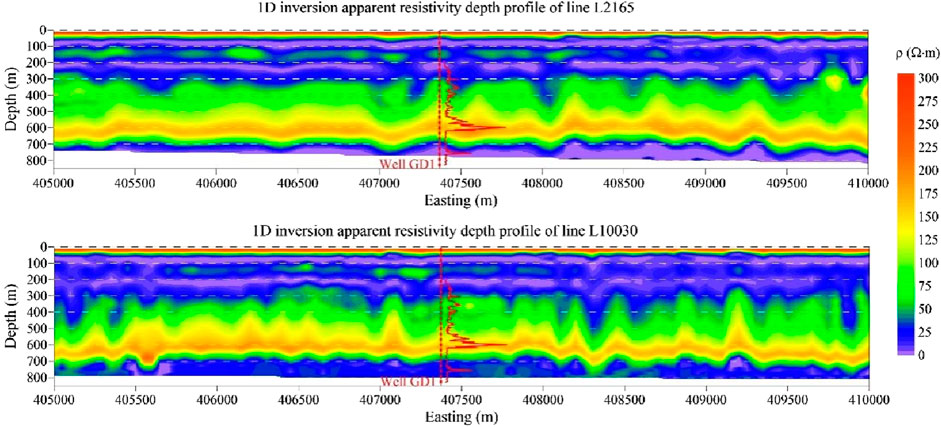
Figure 21. Vertical resistivity profile of the L2165 and L10030 survey lines in the Gaoli Ban area of Koryu Middle Banner, Inner Mongolia, China. The two survey lines intersect at the drilling location (as shown in Figure 19). The inversion results of both lines reveal the vertical variation characteristics of the underground resistivity at this location. By comparing with the measured resistivity of the drilling holes (the red curve), the effectiveness of the system’s detection depth was verified.
The inversion clearly resolved the thick high-resistivity layer at 530–620 m depth. However, the thinner high-resistivity layers at 340–360 m and 750–760 m were not well represented in the inversion results due to their limited thickness. The comparison between inversion results and borehole data confirms both the reliability of iFTEM-II system measurements and its capability to achieve detection depths exceeding 600 m. Future work will involve applying alternative inversion methodologies for enhanced data interpretation.
4 Comparison of FTDAEM systems
The major FTDAEM systems in the international community include TEMPEST, GEOTEM, MEGATEM, iFTEM-I, and the newly developed iFTEM-II by the team, as shown in Table 1.
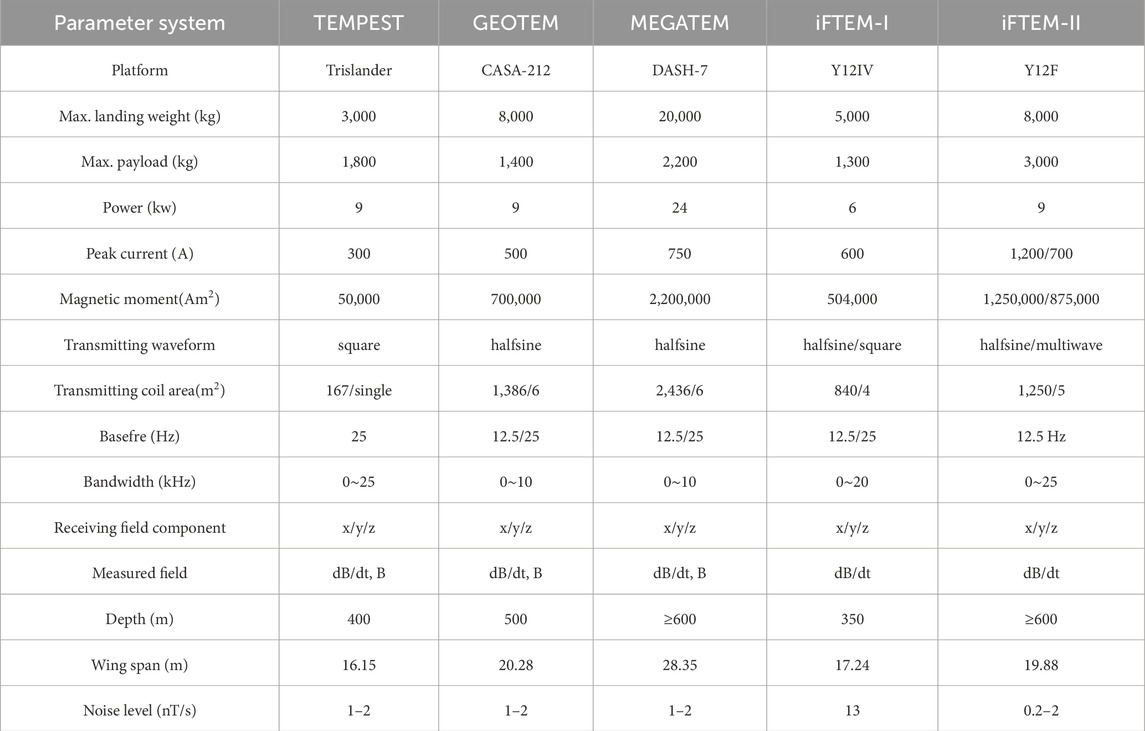
Table 1. International comparison of parameters of fixed wing AEM systems in time domain.
The TEMPEST system employs a half-sine wave transmission current, offering high signal-to-noise ratio suitable for high-resolution shallow exploration. Characterized by its lightweight design and low operational costs, the system is primarily applied in shallow mineral exploration (e.g., gold, copper) and groundwater surveys (Palamara et al., 2010). Its key advantages include: high resolution for shallow targets (<300 m), making it ideal for detailed surveys; and operational flexibility in complex terrains. However, limitations exist: restricted detection depth (typically <500 m), and insufficient sensitivity for deep targets.
The GEOTEM system utilizes a twin-engine CASA212 fixed-wing aircraft platform capable of multi-waveform transmission (e.g., square wave, half-sine wave) with a transmission magnetic moment reaching 1 million Am2. Featuring adjustable base frequencies, it enables broadband, full-time, multi-component observations. This system strikes an optimal balance between detection depth and resolution while maintaining strong versatility, making it suitable for diverse applications including metallic mineral (e.g., gold, diamond, uranium), oil-gas exploration, groundwater surveys, and geological mapping (Annan and Lockwood, 1991; Dickinson et al., 2010). However, its sophisticated design requires specialized maintenance teams, and while competent for medium-depth investigations, targets exceeding 1 km depth still necessitate deployment of the MEGATEM system.
The MEGATEM system, developed as an advanced iteration of the GEOTEM system, employs a four-engine Dash-7 fixed-wing aircraft as its operational platform. Characterized by high-power transmission and long-baseline reception capabilities, the system incorporates large-moment transmitter coils optimized for deep exploration (Smith et al., 2003). Its 140-m towed receiver coil significantly enhances deep-target signal response, making it particularly effective for investigating depth-hosted mineral deposits (e.g., porphyry copper), hydrocarbon structures, and geothermal resources.
The iFTEM-II system was developed based on iFTEM-I technology, utilizing a Y12F large aircraft platform. This advanced system was jointly developed by seven institutions led by the Institute of Geophysical and Geochemical Exploration, Chinese Academy of Geological Sciences, in collaboration with Harbin Aircraft Industry Group Co., Ltd., Jilin University, Peking University, North China Institute of Aerospace Engineering, Nanjing University of Aeronautics and Astronautics, and Chengdu University of Technology. Featuring a transmission magnetic moment reaching the million-level magnitude, the system can record full-time three-component signals in either single-waveform or multi-waveform modes. Its receiver system demonstrates strong anti-interference capability and high signal-to-noise ratio, achieving an exploration depth exceeding 600 m. Currently, the system has only been applied in water resource investigations, thus its maximum detection depth in other application fields remains undetermined. The transmission magnetic moment of this system is smaller than that of MEGATEM, yet its exploration depth has reached a level comparable to the MEGATEM system.
A comprehensive comparative analysis of mainstream international FTDAEM systems reveals distinct technical advantages and application-specific strengths across different systems. The TEMPEST system excels in shallow high-resolution investigations due to its high-sensitivity receivers and lightweight design, while the MEGATEM system demonstrates superior deep exploration capabilities through its large transmitter moment, making it particularly suitable for deep mineral resource exploration. The GEOTEM system achieves an optimal balance between detection depth and resolution via flexible multi-waveform transmission and full-time signal acquisition. The independently developed iFTEM-II system in China showcases the nation’s technological advancements in equipment and is particularly noted for its adaptability to complex terrains.
Modern FTDAEM systems are evolving toward greater depth penetration, higher resolution, smarter data processing, and more environmentally friendly platforms. The integration of superconducting sensor technology, AI-powered inversion algorithms, and novel aircraft platforms will drive future technological breakthroughs. System selection requires careful consideration of exploration objectives, budget constraints, and operational environments. The ongoing innovation in Chinese-made systems continues to expand options for the global geophysical exploration market.
5 Conclusion
This study systematically presents the research achievements in large-depth detection technology for the FTDAEM system (iFTEM-II). First, through comprehensive analysis of the system’s overall architecture, it elaborates on the technical challenges and innovative solutions for key subsystems including the transmitter system, receiver system, aircraft platform modification, and data processing. Second, regarding detection depth, the study combines theoretical calculations with field verification, deriving the system’s detection depth based on electromagnetic field propagation theory and confirming the reliability of theoretical results through measured data analysis. Inversion processing was performed on survey line data intersecting verification boreholes, with comparative analysis between inversion results and borehole resistivity data demonstrating the system’s effective detection depth reaching 600 m. Finally, through parameter comparisons with mainstream international FTDAEM systems, the study objectively evaluates each system’s technical characteristics and application ranges. The successful development of the iFTEM-II system not only provides new technology and equipment for deep mineral resource exploration but also offers important references for the advancement of airborne electromagnetic technology.
However, the current system still exhibits certain limitations in practical applications. First, due to its high operational costs, it has so far only been deployed on a trial basis in China’s Songnen Plain region. Although the system employs a high-current transmission scheme that ensures a smooth shutdown process free of oscillations or significant trailing effects, it still exhibits a shutdown delay on the order of several microseconds compared to low-current modes, which affects high-resolution shallow-depth detection to some extent. In terms of data processing, the preprocessing workflow has not yet been fully standardized and requires manual intervention and parameter adjustments based on the geological conditions of different survey areas, resulting in relatively low efficiency when processing data from large-scale survey regions. Furthermore, the computational efficiency of the system still needs improvement when handling large-scale 3D inversion calculations.
Future research will focus on addressing these current limitations. On one hand, efforts will be made to optimize the design of transmission waveforms to improve shallow-depth detection performance, develop automated preprocessing techniques to enhance data processing efficiency, and upgrade the computational performance of large-scale 3D inversion algorithms. On the other hand, plans are underway to incorporate x and y component data into the inversion process to fully leverage the potential of multi-component data and improve the reliability of geological interpretation. Additionally, capabilities for processing and analyzing very low-frequency (VLF) and extremely low-frequency (ELF) signals will be strengthened to obtain more comprehensive subsurface information. Breakthroughs in cutting-edge technologies such as the airborne application of superconducting sensors and intelligent real-time inversion are also planned. These advancements aim to further enhance the system’s detection performance and operational efficiency in complex geological conditions, thereby providing more advanced technical support for deep mineral exploration.
Data availability statement
The original contributions presented in the study are included in the article/supplementary material, further inquiries can be directed to the first author.
Author contributions
WH: Writing – original draft, Funding acquisition, Writing – review and editing. DX: Writing – review and editing, Project administration. JL: Methodology, Conceptualization, Supervision, Writing – review and editing. FB: Investigation, Writing – review and editing. FL: Writing – review and editing, Data curation. ZX: Writing – review and editing, Software. ZC: Visualization, Writing – review and editing. LL: Writing – review and editing, Validation. SW: Investigation, Writing – review and editing. HW: Writing – review and editing, Formal Analysis. ZD: Writing – review and editing, Investigation.
Funding
The author(s) declare that financial support was received for the research and/or publication of this article. This paper is jointly funded by the National Natural Science Foundation of China (42204147 and 42304154), Chinese Academy of Geological Sciences Basal Research Fund (JKYDM2025209), and the China Geological Survey Project (DD20230245).
Acknowledgments
Thanks to the teams involved in the research: Yin Changchun’s team from Jilin University, Wang Xuben’s team from Chengdu University of Technology, Harbin Aircraft Industry Group Co., Ltd., Yang Tao’s team from Peking University, Hu Hui’s team from North China University of Aeronautics and Astronautics, and Nanjing University of Aeronautics and Astronautics. The authors would like to thank the reviewers for their constructive suggestions which comprehensively improve the quality of the paper.
Conflict of interest
The authors declare that the research was conducted in the absence of any commercial or financial relationships that could be construed as a potential conflict of interest.
Generative AI statement
The author(s) declare that no Generative AI was used in the creation of this manuscript.
Any alternative text (alt text) provided alongside figures in this article has been generated by Frontiers with the support of artificial intelligence and reasonable efforts have been made to ensure accuracy, including review by the authors wherever possible. If you identify any issues, please contact us.
Publisher’s note
All claims expressed in this article are solely those of the authors and do not necessarily represent those of their affiliated organizations, or those of the publisher, the editors and the reviewers. Any product that may be evaluated in this article, or claim that may be made by its manufacturer, is not guaranteed or endorsed by the publisher.
References
Annan, A. P., and Lockwood, R. (1991). An application of airborne GEOTEM in Australian conditions. Explor. Geophys. 22 (1), 5–12. doi:10.1071/eg991005
Auken, E., Christiansen, A. V., Kirkegaard, C., Fiandaca, G., Schamper, C., Behroozmand, A., et al. (2015). An overview of a highly versatile forward and stable inverse algorithm for airborne, ground-based and borehole electromagnetic and electric data. Explor. Geophys. 46 (3), 223–235. doi:10.1071/EG13097
Ben, F., Huang, W., Wu, S., Meng, Q. M., Liu, Y. H., Liao, G. X., et al. (2018). Influence of attitude change for time domain airborne electromagnetic system. ChineseJ.Geophys. in Chin. 61 (7), 3074–3085. doi:10.6038/cig.2018L0470
Ben, F., Huang, W., Lu, N., Han, F., Zheng, H. S., Ding, Z. Q., et al. (2020). A study of sferic removal from time domain airborne electromagnetic data. Geophys. Geochem. Explor. 441 (1), 388–393. doi:10.11720/wtyht.2020.1264
Burton, B., Minsley, B., Bloss, B., and Kress, W. (2019). Airborne electromagnetic, magnetic, and radiometric survey of the Mississippi alluvial plain, November 2018-February 2019. U. S. Geol. Surv. Data Release. 2020 10. doi:10.5066/P9XBBBUU
Di, Q. Y., Zhu, R., Xue, G., Yin, C., and Li, X. (2019). New development of the electromagnetic (EM) methods for deep exploration. Chin. J. Geophys. in Chin. 62 (6), 2128–2138. doi:10.6038/cjg2019M0633
Dickinson, J. E., Pool, D. R., Groom, R. W., and Davis, L. J. (2010). Inference of lithologic distributions in an alluvial aquifer using airborne transient electromagnetic surveys. Geophysics 75 (4), WA149–WA161. doi:10.1190/1.3464325
Han, X., Yin, C. C., Ren, X. Y., Liu, Y. H., Zhang, B., and Cai, J. (2019). Research on exploration depth of time domain airborne EM system. J. Jilin Univ. Earth Sci. Ed. 49, 1448–1456. doi:10.13278/j.cnki.jjuese.20180224
Huang, W., Ben, F., Wu, S., Sun, S. Y., Liao, G. X., and Xi, Y. Z. (2019). The application of orthogonal polynomial fitting method to airborne electromagnetic motion noise removal. Geophys. Geochem. Explor. 43 (4), 892–898. doi:10.11720/wtyht.2019.0086
Huang, W., Ben, F., Sun, S. Y., Li, J. F., Xu, Z. L., Liao, G. X., et al. (2020a). Study on the removal of electromagnetic motion noise in time domain. Geol. Rev. 66 (A1). doi:10.16509/j.georeview.2020.s1.022
Huang, W., Ben, F., Li, J. F., Xu, Z. L., Yin, C. C., and Liu, J. J. (2020b). Background field removal from airborne transient electromagnetic data. Geophys. Geochem. Explor. 44 (3), 672–676. doi:10.11720/wtyht.2020.0056
Huang, W., Xiao, D., Ben, F., Li, J. F., Li, F., and Xu, Z. L. (2023). Study and removal of power frequency interference in time-domain airborne electromagnetic data. Geophys. Geochem. Explor. 47 (5), 1281–1287. doi:10.11720/wtyht.2023.1458
Ley-Cooper, Y., Roach, I., and Brodie, R. (2019). Geological insights of northern Australia’s AusAEM airborne EM survey. ASEG Ext. Abstr. 1, 1–4. doi:10.1080/22020586.2019.12073170
Li, Y., Gao, S., Zhang, S., He, H., Xian, P., and Yuan, C. (2020). The baseline wander correction based on the improved ensemble empirical mode decomposition (EEMD) algorithm for grounded electrical source airborne transient electromagnetic signals. Geoscientific Instrum. Methods Data Syst. 9 (2), 443–450. doi:10.5194/gi-9-443-2020
Lin, J., Chen, J., Liu, F., and Zhang, Y. (2021). The helicopter time-domain electromagnetic technology advances in China. Surv. Geophys. 42 (3), 585–624. doi:10.1007/s10712-021-09635-7
Palamara, D. R., Boero Rodriguez, V., Kellett, J., and Macaulay, S. (2010). Salt mapping in the lower macquarie area, Australia, using airborne electromagnetic data. Environ. Earth Sci. 61 (3), 613–623. doi:10.1007/s12665-009-0375-z
Prince, A. (1949). The induction of electric currents in non-uniform thin sheets and shells. Q. J. Mech. Appl. Math. 2 (3), 283–310. doi:10.1093/qjmam/2.3.283
Raiche, A., and Spies, B. (1981). Coincident-loop transient electromagnetic master curves for interpretation of two-layer earths. Geophysics 46 (1), 53–64. doi:10.1190/1.1441139
Raiche, A., Sugeng, F., and Wilson, G. (2007). Practical 3D EM inversion-the P223F software suite. ASEG Ext. Abstr. 2007, 1–5. doi:10.1071/ASEG2007ab114
Ren, X. Y., Yin, C. C., Macnae, J., Liu, Y. H., and Zhang, B. (2018). 3D time-domain airborne electromagnetic inversion based on secondary field finite-volume method. Geophysics 83 (4), E219–E228. doi:10.1190/geo2017-0585.1
Smith, R. (2001). On removing the primary field from fixed-wing time-domain airborne electromagnetic data: some consequences for quantitative modelling, estimating bird position and detecting perfect conductors. Geophys. Prospect. 49 (4), 405–416. doi:10.1046/j.1365-2478.2001.00266.x
Smith, R., Fountain, D., and Allard, M. (2003). The MEGATEM fixed-wing transient EM system applied to mineral exploration: a discovery case history. First Break 21. doi:10.3997/1365-2397.21.7.25570
Wang, H., Li, J. F., Liu, J. J., Wu, S., Liu, L., and Cao, Z. H. (2019). Circuit of automatic gain control for airborne transient electromagnetic receiving signal. Chin. J. Radio Sci. 34 (4), 524–530. doi:10.13443/j.cjors.2018120301
Wang, H., Li, J. F., Wu, S., Liu, L., Liu, J. J., and Cao, Z. H. (2022). The peak detection circuit of thousand-ampere emission current for aviation electromagnetic transmitter. Electron. Des. Eng. 30 (15), 66–69+75. doi:10.14022/j.issn1674-6236.2022.15.014
Xiong, S. Q., Mao, J. W., Liu, M., Zhou, X. H., Xu, X. Y., Qin, X. W., et al. (2024). Development strategy of airborne geophysical exploration technology. Eng. Sci. 26 (5), 104–116. doi:10.15302/j-sscae-2024.05.011
Xu, Z. L., Huang, W., Liu, J. J., and Li, F. (2020). Design and implementation of supporting platform for airborne geophysical exploration software system. Comput. Tech. Geophys. Geochem. Explor. 42 (1), 131–137. doi:10.3969/j.issn.1001-1749.2020.01.18
Yin, C. C., Zhang, B., Liu, Y. H., Ren, X. Y., Qi, Y. F., Pei, Y. F., et al. (2015). Review on airborne EM technology and developments. Chin. J. Geophys. in Chin. 58 (8), 2637–2653. doi:10.6038/cjg20150804
Yu, Y., Wu, S., Xiao, D., Li, F., Du, B. R., and Cao, Z. H. (2023). Application of spline fitting and interpolation method to suppress airborne electromagnetic motion noise. Comput. Tech. Geophys. Geochem. Explor. 45 (1), 93–99. doi:10.3969/j.issn.1001-1749.2023.01.12
Zhang, B. M., Dai, S. K., Jiang, Q. Y., Yan, J., and Li, G. (2019). Time-domain denoising of time-frequency electromagnetic data. Appl. Geophys. 16 (3), 378–393. doi:10.1007/s11770-019-0772-3
Zheng, H. S., Li, J. F., Huang, W., Liu, Y., Li, F., Meng, Q. M., et al. (2022). The Test flight of iFTEM-I fixed-wing airborne time-domain electromagnetic System in binxian, Heilongjiang Province, China. China. Miner. 12 (7), 890. doi:10.3390/min12070890
Keywords: time-domain airborne EM system, fixed-wing platform, AEM equipment development, large-depth detection, deep resource exploration
Citation: Huang W, Xiao D, Li J, Ben F, Li F, Xu Z, Cao Z, Liu L, Wu S, Wang H and Ding Z (2025) The successful development of a large-depth fixed-wing time-domain airborne electromagnetic survey system. Front. Earth Sci. 13:1683386. doi: 10.3389/feart.2025.1683386
Received: 11 August 2025; Accepted: 16 October 2025;
Published: 03 November 2025.
Edited by:
Xiuyan Ren, Jilin University, ChinaReviewed by:
Maofei Li, China University of Mining and Technology, ChinaXinpeng Ma, China University of Petroleum (East China), China
Copyright © 2025 Huang, Xiao, Li, Ben, Li, Xu, Cao, Liu, Wu, Wang and Ding. This is an open-access article distributed under the terms of the Creative Commons Attribution License (CC BY). The use, distribution or reproduction in other forums is permitted, provided the original author(s) and the copyright owner(s) are credited and that the original publication in this journal is cited, in accordance with accepted academic practice. No use, distribution or reproduction is permitted which does not comply with these terms.
*Correspondence: Du Xiao, eGR1QG1haWwuY2dzLmdvdi5jbg==; Fei Li, bGZlaUBtYWlsLmNncy5nb3YuY24=