Abstract
Super-shear ruptures, characterized by velocities exceeding the shear wave speed, were first predicted theoretically and later observed in laboratory experiments. While a few tectonic earthquakes have been reported as super-shear, most involve strike-slip faults, including the 2023 Mw 7.5 Kahramanmaraş earthquake (Türkiye) and transient phases of the Mw 7.8 event. However, natural ruptures propagate through complex, rough fault systems - deviating from idealized smooth interfaces - resulting in heterogeneous slip, stress drops, and rupture jumps. Additionally, the expected high-frequency spectral signature of super-shear ruptures often conflicts with observations. To reconcile these discrepancies, we propose a generalized interpretation of super-shear events, where observed super-shear velocities arise not only from continuous rupture fronts but also from dynamically triggered multi-focal ruptures along strike. We explore how fault rheology modulates rupture speed and introduce a triggering mechanism driven by P-wave perturbations. Our model also predicts Mach cones detected teleseismically during super-shear earthquakes such as the Kahramanmaraş doublet, while it suggests they should not be observed locally in the case of super-shear cascading rupture envelopes. We show that both the Kahramanmaraş 2023 events initiated cascading instabilities, with dynamic stress transfers propagating rupture across fault patches. High-frequency (>10 Hz) P-wave pulses mark transitions between patches, identified via accelerometric waveform analysis. Our findings support the idea that even minor stress perturbations can trigger near-instantaneous dynamic ruptures, posing implications for early-warning algorithms.
1 Introduction
The prevailing perspective in earthquake physics models seismic events as frictional instabilities occurring on structurally isolated, smooth planar interfaces. Consequently, the combination of fault frictional strength and stress accumulation in the adjoining volumes is considered sufficient to comprehend the spatial and temporal evolution of seismicity during the different phases of the seismic cycle. However, faults serve as the weakest geological structures, acting as guides for the stabilization of crustal volumes that accumulate energy. Moreover, faults are not isolated and smooth, instead, they are strongly interacting, rough, fractal objects characterized by significant heterogeneity.
Nowadays, strong motion recordings, high quality homogeneous seismic catalogues, GNSS time series and satellite interferometric maps allow us to discern in detail the deformation processes taking place during seismic events. In addition, inversion modelling, coupled with high-quality seismological data, provide us with deeper insights into their rupture dynamics (e.g., Chalumeau et al., 2024) and the 3D geometry of the involved fault system (e.g., Stabile et al., 2024). Thanks to these technological and monitoring advances, growing evidence has been accumulated that several seismic events deviate from the classically speculated behaviour of involving relatively simple, planar faults with a single smooth rupture kinematic. Instead, they usually showcase multi-fault activation and cascading rupture of different patches (e.g., Wyss and Brune, 1967; Zhang et al., 2012; Hamling et al., 2017; Ando and Kaneko, 2018; Quigley et al., 2019; Palgunadi et al., 2024), which are highlighted by field observations (Antoine et al., 2022), fault slip (Diederichs et al., 2019; Ross et al., 2019) and moment tensor inversion (Zaccagnino and Doglioni, 2022). Nevertheless, routinely implemented dynamic and kinematic simulations model ruptures as uniform fronts travelling along smooth or slightly rough surfaces. How far can this assumption affect our view of coseismic dynamics? What is its impact on final kinematic and dynamic outputs?
Here, we focus on the dynamics of complex faulting processes in strike-slip tectonic settings. Among their peculiarities, strike-slip faulting events are usually featured by lower double-couple components in moment tensors (Zaccagnino and Doglioni, 2022) and higher rupture velocity than observed in other tectonic styles (Wang et al., 2016). In some, although quite rare cases, “super-shear” rupture velocities have been hypothesized. Super-shear earthquakes are seismic events whose apparent rupture velocity, , exceeds the shear wave velocity, . The possibility of ruptures propagating faster than shear waves was predicted theoretically and reproduced in the laboratory (Xia et al., 2004); while just a dozen of tectonic “supershear” earthquakes have been convincingly reported so far (Bao et al., 2022). Due to the small number of observations, their dynamics is still poorly understood. Moreover, super-shear speeds have been unambiguously detected only along faults with a dominant strike-slip component.
In the case of the Mw 7.8 and 7.5 Kahramanmaraş earthquakes, on which we focus in the case analysis in this paper, a cascade triggering mechanism has been suggested to be at work in producing such a large and devastating event (Okuwaki et al., 2023) with variable rupture velocity and cumulated slip along a segmented fault patch system (Goldberg et al., 2023; Liu et al., 2023; Mai et al., 2023; Melgar et al., 2023; Wang et al., 2023; Zhang et al., 2023; Ren et al., 2024; Rosakis et al., 2025; Zhou et al., 2025). In our work, we take inspiration from the recent happening and collected information about the main events to investigate the spatial and temporal dynamics and interactions among different fault patches by highlighting cascade-triggered subevents. This is achieved by analysing the frequency content and arrival times on seismograms of accelerometric stations of KOERI and those of the stations belonging to the network is managed by the General Director of Disaster Affairs, Earthquake Research Department (AFAD).
We derive a simple model to explain fault rupture velocity in the light of rheological and geophysical properties of the fault systems and adjoining volumes. We also explain and discuss the feasibility of dynamic subevents triggering produced by P-waves perturbations. We introduce a more general interpretation of observed super-shear rupture velocity, considering dynamically triggered super-shear rupture envelopes, providing an explanation of the teleseismic Mach cones (Bao et al., 2022), i.e., S-wave cones formed behind a super-shear rupture front, which can be observed in both 2D and 3D, full space and half space, even though for actual observations in the far field, they usually refer to the Rayleigh Mach cones - a unique feature for 3D, half-space problem (Dunham and Bhat, 2008).
2 Tectonic setting and 2023 Kahramanmaraş seismicity
The eastern region of Türkiye is among the most seismically active zones in the Middle East, prone to both shallow diffuse small-to-moderate seismic activity and to large earthquakes. This tectonic setting is located at the margins of the Arabian and the Anatolian microplates (Güvercin et al., 2022) and is characterized by a transpression zone where shear deformation, with a slip rate ranging in between 10 and 15 mm/yr (Reilinger et al., 2006; Trifonov et al., 2018), is mainly accommodated by an approximately 600-km long plate boundary hosting a complex left-lateral strike-slip fault system (Arpat and Şaroğlu, 1972; Muehlberger and Gordon, 1987). The southernmost portion of this area exhibits relatively low seismic coupling with respect to the segments to north of the East Anatolian Fault (0.2–0.5, Sparacino et al., 2022), within a context of strong motion completeness over the past four centuries.
Southeastern Türkiye and its neighbouring areas of Syria have been recently experienced the largest seismic events ever reported in regional instrumental catalogues. On 6 February 2023, at 01:17:32.67 UTC (KOERI-RETMC Earthquake Catalog, 2025), a Mw 7.8 strike-slip faulting earthquake started from the Narlı fault before propagating along different patches (belonging to the Erkenek, Pazarcık, and Amanos segments) of the East Anatolian Fault (U.S. Geological Survey, 2023a). The event caused widespread devastation in the area along the180 km-long activated interface, accompanied by a slip of up to 3 m (Reitman et al., 2023), exhibiting a heterogeneous slip distribution along several fault patches (U.S. Geological Survey, 2023a; Zhang et al., 2023; Zhou et al., 2025). After an initial phase with a rupture velocity of 2.6 km/s (Zeng et al., 2025), the rupture proceeded with a velocity of at least 3.2 km/s (Melgar et al., 2023), with evidence of possible early transition to fast super-shear velocity 4.9 km/s (Rosakis et al., 2023; 2025), and up to 5.2 km/s (e.g., Zeng et al., 2025). A few hours later, the largest event was followed by a Mw 7.5 twin earthquake on the Çardak fault at 10:24:47.88 UTC about 150 km northwest (KOERI-RETMC Earthquake Catalog, 2025). Oriented with a strike E-SE W-NW, this earthquake featured a bilateral rupture involving three different macroscopic fault structures (U.S. Geological Survey, 2023b), with asymmetric rupture velocity, super-shear in the western branch and sub-shear to east (Goldberg et al., 2023; Wang et al., 2023). The doublet was followed by intense aftershock activity for weeks (Figure 1).
FIGURE 1

(A) Seismic sequence (6/2/2023–19/8/2023) in Türkiye (Tan, 2021). The yellow stars represent the epicenters of the two mainshocks, the red triangles stand for the accelerometric stations of the TK network, while the green ones belong to the KO network which compare in the figures of the article or Supplementary Material. The whole list of investigated stations is reported, for better visualization purposes, in the KMZ file attached at the Supplementary Material of this article (B) Aftershocks and time-dependent completeness magnitude (red line) Data from Tan (2021). (C) View of the region involved by the events. (D) Frequency-magnitude scaling of the sequence of aftershocks.
The occurrence of this earthquake doublet is of outstanding interest for improving our comprehension of large strike-slip faulting because of the unprecedented available data resulting from both network improvement and exceptionality of seismic occurrence.
3 Theoretical modeling
3.1 Rupture velocity in homogeneous fault patches
We model the rupture dynamics of a complex strike-slip fault composed of different patches introducing heterogeneous rheological properties represented by the shear modulus and variable stress drop along strike. We utilise the following values as reference for commonly used physical quantities such as rock density 3.0 g/cm3, P-wave velocity vp 5.5 km/s, S-wave velocity vs 3.2 km/s, Rayleigh wave velocity vR 3 km/s and shear modulus 30 GPa. We assume a spatially constant thickness for the brittle seismogenic layer, W, along strike of a fault interface with total length L, oriented along the y-axis (compare with Figure 2A). In the first part of our description, we suppose that the rupture front during the event is a concentrated, travelling strain wave with uniformly distributed velocity as a function of depth of width , i.e., pure Mode II crack.
FIGURE 2

(A) Schematic representation of the strike-slip fault considered in our model. (B) Travelling waves of strain drop at the rupture front propagating at variable velocity depending on local stress drop and shear modulus.
This initial model of a homogeneous fault patch is built upon some simplifying assumptions to grasp some fundamental understanding before introducing complexity. Such assumptions are a spatially constant brittle seismogenic layer thickness , homogeneous elastic properties, specifically a constant shear modulus and constant stress drop within the patch, a rupture front idealized as a concentrated, traveling strain wave, and a pure Mode II (in-plane) rupture mechanism. These assumptions allow us to derive analytical solutions for rupture velocity and stress interactions, providing a starting benchmark against which the effects of heterogeneity can be potentially checked.
Especially, the latter simplifying hypothesis can be relaxed including a composition of Mode II (in-plane) and Mode III (anti-plane) rupture dynamics acting along the horizontal and vertical component respectively, with outward radiation of SH and P waves, and SV waves. It is worthy to notice that our hypothesis is well acceptable if , while Mode III cracks in strike-slip faulting events play a role where close-range segmentation affects the fault system (Cambonie et al., 2019). On the reliability of such hypothesis, we will discuss again later; however, taking L 180 km and W 20 km, the condition above may be respected except for the case of a hyper-segmented fault (to be compared with Duman and Emre, 2013). In order to allow an easy dissertation for future generalization to complex multi-fault systems, we will benefit of the volume force formalism instead of the surface force one (Aki and Richards, 2002), so that the usual formula for seismic moment , where is the average coseismic slip, can be written as , with representing the strain variation in the horizontal plane in the rupture direction. So, the associated moment tensor for a strike-slip earthquake reads
We can decompose the main event (Equation 1), as well as the subsequent seismic activity, into a certain number, N, of subevents with their own seismic moment according towhere the right integral is straightforwardly obtained in the limit of a continuous rupture starting at until its arrest at (Equation 2). Hence, the coseismic strain rate variation can be written as is the time-dependent rupture length, is the half-width of the fault zone and is the slip distribution profile. Differentiating in Equation 3 with respect to time yields the moment rate by means of the chain rule, we getwhere slip velocity, , is related to the rupture velocity, , via the empirical law (Bizzarri, 2012). Here, we assume that at the rupture front (we neglect weakening effect taking place when slip occurs at the wake of rupture, Chen et al., 2021) and that the width of the slip pulse . At last, for sustained ruptures, the first term in Equation 4 provides a subdominant contribution to the strain rate being , so that we can neglect it in the calculation of the coseismic strain rate variation. Therefore, we get
The motion of the peak of the coseismic strain travelling wave-envelope (Equation 5) is constrained by the set of conditions and . By imposing such constraints, we obtain the following equations for time variations
In the limit of large, self-sustained ruptures ( dominant), for spatial gradients, we obtainrespectively. Equation 6 is in good agreement with the results suggesting a negative correlation between rupture velocity and stress drop gradients (e.g., Chounet et al., 2018), also proposing a theoretical justification to such empirical observation. So, our derivation suggests that rupture velocity increases when passing from a high to low stress drop interface and from weak to strong rheology. A visual representation of our results is in Figure 2.
We notice that the theoretical relations derived in Equations 6, 7 provide a direct prediction for accelerometric observations. Equation 7 states that a negative gradient in stress drop ) will cause a local acceleration of the rupture front (). This acceleration manifests in observed strong-motion records as a systematic increase in the amplitude and frequency content of radiated seismic waves (See Supplementary Figures S2, S4 in the Supplementary Material showing the high-pass filtered seismograms associated with the subevents nucleated along the interface of the East Anatolian Fault Zone). Therefore, we can interpret distinct pulses or elevated velocity amplitudes within the accelerograms of our studied events (see Section 3) as a possible observational signature of rupture acceleration predicted by our model in the “homogeneous limit”, occurring as the rupture front propagates across a boundary from a high-stress-drop to a low-stress-drop region. We show below that such acceleration can actually be accompanied by jumps of rupture propagation in such favourable conditions. We move towards heterogeneous rheological conditions and to include structural asperities.
3.2 Early triggering power of fault stress perturbations
We are now interested in understanding the relationship between rupture dynamics and early earthquake triggering on the light of almost instantaneous cascading destabilization of adjoining fault patches. Seismic events can be triggered by tiny stress perturbations (Zaccagnino et al., 2021; 2022b). It is also well known that surface waves have dynamic triggering power (e.g., Velasco et al., 2008; Johnson and Jia, 2005), while the effective power of almost instantaneous trigger is still source of scientific debate (e.g., Fan and Shearer, 2016) also concerning the effective impact of P-waves at regional distances (e.g., Miyazawa, 2012). For all that, earthquakes showcase, beyond a reasonable doubt, a “ripple effect” behaviour which seems to arise from their innermost nature (Marsan and Lengliné, 2008; Zaccagnino et al., 2022a). Such kind of dynamic evolution also involves the nucleation phase (Ellsworth and Beroza, 1995).
Clear mathematical evidence in support of the importance of stress perturbations in triggering coseismic ruptures along different fault patches is the exponential sensitivity of the early () aftershock seismic rate R on the additional stress amplitude according towhich represents the limit case for () of the general Dieterich’s relationship (Dieterich, 1994). This equation, formally valid for aftershocks, can be applied to seismicity under quite general conditions. Indeed, it is a population-based model where seismic sources are characterized by a state variable associated with friction; due to the linearity of the seismic moment, individual seismic events and seismic moment release during an earthquake are equivalent. So, on the base of this, even a tiny perturbation can trigger dynamically a seismic event along prone-to-failure fault interfaces. In this case, the spatial and temporal evolution of rupture velocity changes are expected to abide by the rules derived above. This means that early dynamic triggering may activate multiple cascading fault patches. For a schematic representation of this, see Figure 3.
FIGURE 3

Schematic representation of a strike-slip seismic event taking place along a fault system and producing a complex multi fault rupture composed of four sub events. Each subevent occurs along critically stressed fault segments and may be triggered by early P wave arrivals (represented by blue curved lines).
3.3 Apparent rupture velocity and multi-focal ruptures
Finally, we relate dynamic triggering during an earthquake to observed rupture kinematics. Using the simplified framework from Section 3.1 - a unilateral (Mode II) strike-slip rupture with no depth dependence - we analyse two stress contributions ahead of the crack tip.
First, we must consider the dynamic stress perturbation generated by the seismic waves radiating from the advancing rupture front. For the P-wave component, which typically dominates the initial stress perturbation due to its faster propagation speed, we can model the stress pulse as a traveling Gaussian envelope:
Here, represents the characteristic P-wave velocity of the medium, controls the spatial width of the stress pulse (typically on the order of several meters to hundreds of meters depending on rupture characteristics), and is the peak dynamic stress amplitude. The coordinate measures distance along the fault from the original hypocenter, while tracks the temporal evolution of the rupture process.
Simultaneously, and crucially for understanding the triggering of secondary ruptures, we must account for the static stress field surrounding the advancing crack tip. This field follows the classical singular solution derived from linear elastic fracture mechanics:valid for distances beyond the plastic zone boundary. This expression is the leading-order term of the Williams’ stress expansion, an eigenfunction solution that describes the self-similar stress field near a crack tip in an elastic solid. The singularity is a fundamental characteristic of sharp cracks in linear elasticity, and its amplitude is governed by the stress intensity factor KII. The plastic zone size itself emerges from the competition between the stress intensity factor (which characterizes the amplitude of the crack-tip singularity) and the material’s yield strength :
This plastic zone represents the region where inelastic processes dominate the deformation, effectively screening the true crack tip from the surrounding elastic medium. The interplay between the dynamic stress perturbation (Equation 9) and the static crack-tip field (Equation 10) creates potentially observable effects.
When these stress fields constructively interfere - particularly when the peak of the P-wave stress pulse coincides with the decaying crack-tip stress field near - they can nucleate secondary rupture fronts. The maximum triggering probability is observed when the point of maximum of and are coincidental (Figure 4A). This triggering process is not instantaneous.
FIGURE 4

Mechanism for apparent supershear rupture via cascading triggering of sub-events. (A) The dynamic triggering process for a secondary sub-event, showing the stress composition ahead of a primary rupture front. The static stress field, governed by the Williams’ expansion and characterized by the classical singularity (blue line, see Equation 10), combines with the dynamic stress perturbation from the radiated P-wave (red line, see Equation 9). Their constructive interference near the plastic zone boundary of a pre-stressed fault patch can overcome the local strength threshold needed for nucleation (horizontal orange line), initiating a secondary rupture at a point significantly ahead of the primary front. (B) An apparent supershear rupture emerges from a cascade of dynamically triggered sub-events, each propagating at (likely) sub-shear velocities . The time delay between triggering events should create a composite, high-speed rupture envelope (dashed black line with shadowed greed region) only observable at large spatial scales. This apparent front can generate Mach cone signatures in low-frequency teleseismic records, while high-frequency local observations would resolve the underlying sequence of sub-shear ruptures (see Equation 14).
The timing of this interaction is crucial for understanding secondary rupture triggering and directly links our analytical framework to the observed sequencing of subevents. The P-wave stress pulse (Equation 9) propagates at the P-wave velocity , significantly faster than the rupture front itself. Therefore, it can arrive at a heterogeneous patch and stress it adding to a static crack-tip field (Equation 10), providing the final critical stress increment needed for nucleation. This delay between the P-wave arrival and the rupture front arrival dictates the timing of the triggered subevent. Thus, the framework of Equations 9–11 provides a physical mechanism for the (small) observed time delays between subevents in our accelerometric records, connecting the kinematic rupture model to the dynamic triggering process. See Figure 4A for details and the next section for observational evidence of anelasticity-related triggering delay with respect to P-waves arrival times.
The timing of this interaction is crucial for understanding secondary rupture triggering. We define t* as the time when the P-wave pulse peak first reaches the plastic zone boundary it incorporates a characteristic delay timescale that accounts for various physical processes including plastic deformation, fault zone heterogeneity, and the finite time required for rupture nucleation (for detailed physical mechanisms see Cebry et al., 2022):
In Equation 12, represents the propagation velocity of the primary rupture front (typically in the range of 0.7–0.9 for sub-shear ruptures). The spatial separation between the primary and secondary hypocenters then leads to the emergence of an apparent rupture velocity:which, under conditions where becomes negligible compared to , asymptotically approaches . This result explains how an ensemble of sub-shear rupture segments () can produce what appears to be supershear propagation () when observed at certain scales.
At the same time, we need to acknowledge that supershear rupture speeds in large earthquakes are rare and evidence exists provided by multiple investigations that true supershear ruptures may occur at intermediate scales, for instance, within a fault patch and be hardly recordable in seismograms (e.g., Archuleta, 1984; Dunham, 2007; Huang et al., 2016; Palgunadi et al., 2024). Therefore, our investigation focuses only on one side of the problem related to the large-scale observations upon which most of the physical interpretation of the physics of seismic events are bounded to be based, while reversed effects may still play a role at small and intermediate scales.
3.4 Mach cones in supershear ruptures and rupture envelopes
The implications of the mechanism discussed above extend directly to observable seismic signatures. At teleseismic distances, where individual rupture segments cannot be resolved, the composite rupture would produce Mach cone signatures with characteristic anglematching what would be expected from a true supershear rupture. However, local observations capable of resolving the individual sub-events would reveal the underlying sub-shear propagation velocities, providing a clear discriminator between “true” and “apparent” supershear behaviour. Therefore, if our hypotheses are reliable, multifocal rupture in a heterogeneous, complex, close to failure tectonic setting, may produce apparent super-shear rupture (Figure 4B).
Real and apparent super-shear ruptures, i.e., single super-shear ruptures vs. super-shear envelopes of sub-shear ruptures, might be discriminated on the base of the observations of Mach cones at local spatial scales, where the seismological contribution of the different fault patches and subevents can be appreciated. In the first case, the Mach cone should still be observed, while in the second one, no effect is expected.
This framework not only resolves apparent contradictions in earthquake observations but also provides testable predictions about the relationship between local and teleseismic measurements of rupture velocity. The model suggests that apparent super-shear should be particularly prevalent in heterogeneous fault zones with abundant secondary structures that can serve as nucleation points for dynamically triggered rupture segments. Future work could explore how variations in the stress pulse characteristics (, ) and material properties ( ratio) influence the likelihood and characteristics of apparent vs. true super-shear behaviour.
Indeed, the apparent supershear rupture described here is an emergent property of a complex, multi-fault system. It can be interpreted as a low-resolution observation of a cascading rupture. The resulting composite rupture envelope (Figure 4B) can produce Mach cone signatures, but these are expected to appear in the long-period (low-frequency) part of seismograms. The longer wavelengths do not have sufficient resolution to provide information about the discrete, jump-like nature of the sub-event cascade. Consequently, teleseismic observations, which are inherently carrying less information about the spatial properties of seismic ruptures, might infer a supershear event, while local high-frequency arrays could potentially resolve the underlying sequence of sub-shear ruptures. Therefore, our hypothesis is based on the idea that in a heterogeneous, unstable tectonic setting, multifocal rupture driven by dynamic triggering can produce apparent supershear rupture envelopes (Figure 4B). This concept does not invalidate the existence of “true” supershear ruptures but offers an alternative and broader explanation for several observed high rupture velocities especially in strike-slip faulting regions, directly connecting them to the documented complexity of this kind of fault zones and the dynamics of sequential triggering.
4 Methods and results
We analyse accelerograms of both the Mw 7.8 and Mw 7.5 earthquakes recorded by stations of the KOERI seismic network (FDSN code: KO) and of the Turkish National Strong Motion Network run by AFAD (FDSN code: TK).
The closest station to the Mw 7.8 event is KHMN of the KO seismic network, whose recording shows a very complex rupture propagation and fault segmentation highlighted by multiple arrivals (T1-T4 picks in Figures 5A,B). At time T1, the event starts with low-amplitudes and lasts for about 2 seconds, then the amplitudes gradually increased until time T2 (see the green displacement waveform in Figure 5B), when the Pazarcık segment of the East Anatolian Fault (EAF) has been activated). This observation agrees with the activation of the Narlı fault, with a rupture front propagating toward station KHMN, and with the small initial seismic moment rate of the Mw 7.8 source time function (see U.S. Geological Survey, 2023a). We manually picked the first P-wave arrival (e.g., time T1 in Figure 5B for station KHMN) at different stations of the KO seismic network and located the event using the 1D velocity model of Türkiye proposed by Tan et al. (2011) through a non-linear probabilistic earthquake location approach implemented in the NonLinLoc code (Lomax et al., 2000). The result of the inversion provides epicentral coordinates Lat = 37.2066˚N and Lon = 37.0165˚E, and origin time 01:17:32.96 (UTC time), with RMS = 0.57 s. After time T2, a persistent high-amplitude, high-frequency signal (P-waves up to 50 Hz corresponding to the Nyquist frequency of the analysed signal) can be observed for at least 10 s (Figures 5A,B), which is compatible with complex cascading ruptures along different fault patches and apparent super-shear rupture velocity. Even if in this part of the accelerogram it is difficult to distinguish between the progressive activation of multiple ruptures, the cascading triggering of multiple fault patches can be observed 20–25 s after the first arrival (T3 and T4 picks) both looking at the spectrogram (Figure 5A), the 10 Hz high pass filtered signal (orange accelerogram in Figure 5B), and the double-integrated signal (green displacement waveform in Figure 5B).
FIGURE 5
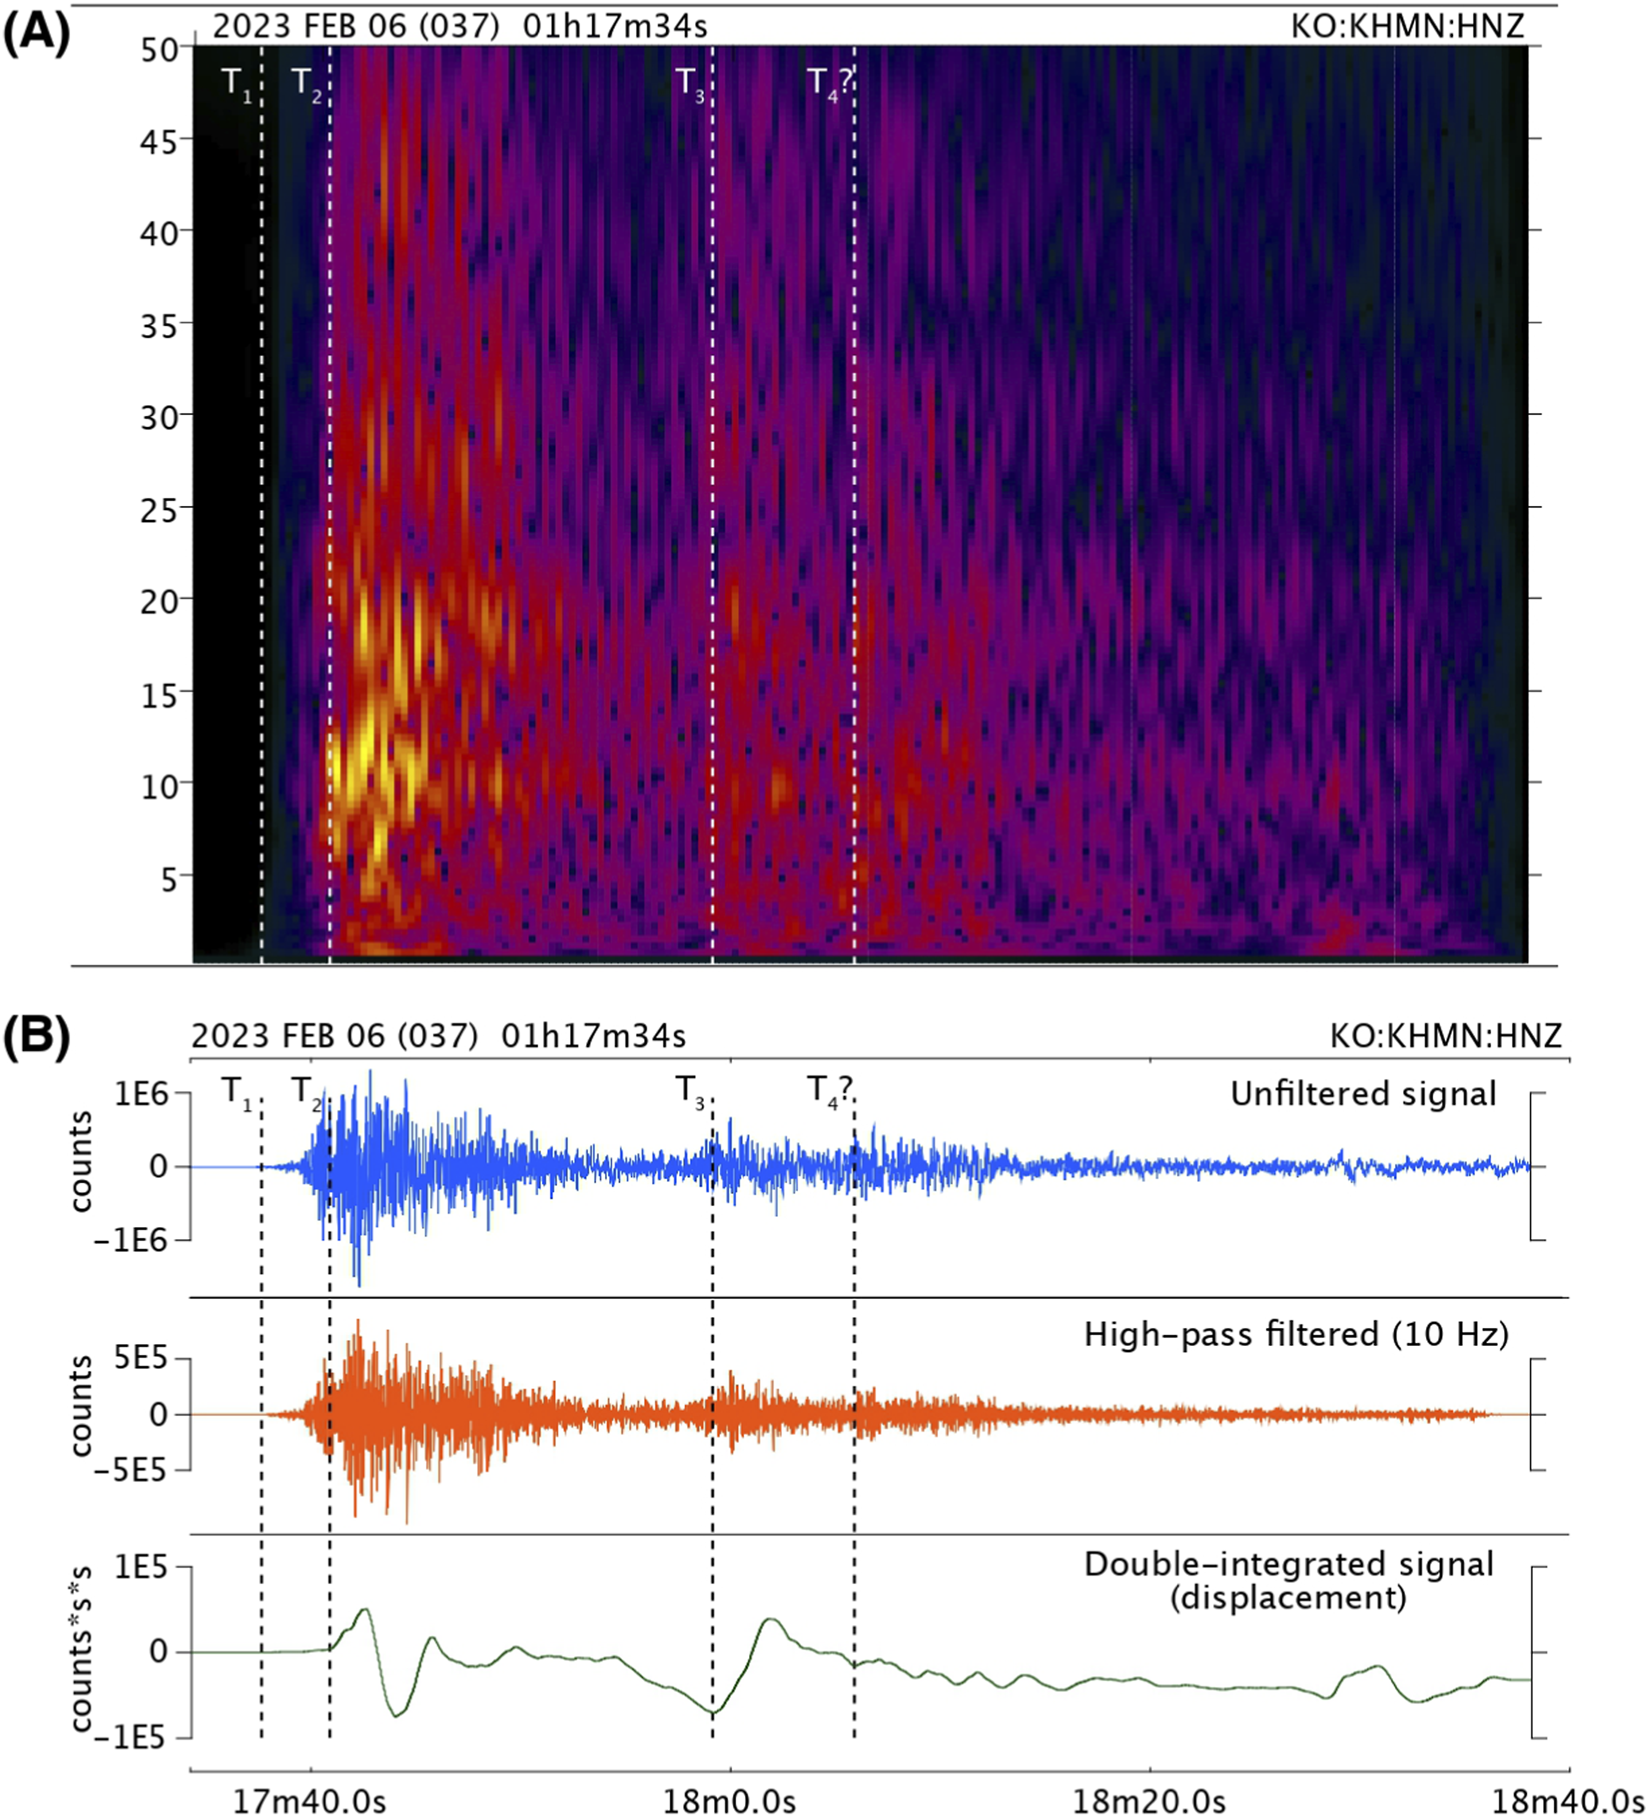
(A) Spectrogram and (B) full waveform (blue), 10 Hz high-pass filtered (orange), and double-integrated signal (green) of the Mw 7.8 6/2/2023 Kahramanmaraş event.
To investigate whether P-wave perturbations generated during the rupture of the Narlı fault could have dynamically triggered distinct patches of the Pazarcık segment of the East Anatolian Fault (EAF), we conducted a comprehensive analysis of seismic wave travel times. We estimated P- and S-wave travel times from the Narlı fault to the EAF and from the EAF to station KHMN, comparing theoretical predictions with observed arrivals to constrain the timing and location of potential triggered rupture.
Our simulations reveal that the observed arrival time T2 (∼8.0 ± 0.5 s from origin time, see Figure 5 for reference) is consistent with the activation of an EAF fault patch extending approximately from Lat 37.4372°N, Lon 36.9747°E to Lat 37.4833°N, Lon 37.0716°E (see Figure 6). This secondary rupture occurred between 4.7 ± 1.0 s and 5.7 ± 1.0 s after the origin time, precisely coinciding with the expected arrival of P-waves from the Narlı Fault epicenter at the inferred EAF patch location. In contrast, the corresponding S-wave arrival time occurs 3–4 s later, providing a clear temporal discrimination between potential triggering mechanisms.
FIGURE 6

Seismic wave arrival time analysis and probabilistic location of triggered earthquake. (A) Normalized probability distributions of theoretical arrival times for P + P (red), P + S (blue), and S + P (green) wave combinations, compared with observed P-wave (orange) and S-wave (light blue) arrivals at station KHMN. Thin lines represent individual virtual nucleation point contributions, while thick lines show mean distributions. Shaded regions indicate the probability density functions retrieved by assuming Gaussian distribution from ±2σ observational uncertainties. The observed P-wave arrival time shows compatibility with P + P arrivals from nucleation points S2-S4 and P + S arrivals, but excludes S + P combinations, demonstrating P-wave triggering. (B) Map showing the location of candidate virtual subevents’ epicenters from S0 (corresponding to the Narli-East Anatolian Fault Junction) to S5. The yellow star represents the epicenter of the Mw 7.8 Kahramanmaraş earthquake. (C) Probability density function (PDF) for the location of the triggered earthquake along the fault segment. Red circles indicate probability values at virtual subevent nucleation locations S0 through S5. The light blue shaded region represents the 68% credible interval, with the most probable nucleation region located between stations S2 and S4, most likely a few kilometers NW to S3 (corresponding to latitude 37.4593° N and longitude 37.0237° E). The secondary event was triggered by P-waves approximately 29 km from the mainshock epicenter, consistent with dynamic stress transfer from P-wave loading and their arrival time, as shown in (A).
The theoretical P + P arrival times across our virtual nucleation points (S0 through S5) range from 7.67 to 11.04 s, while S + P combinations range from 11.28 to 16.65 s. Arrivals are shown in the figures in the Supplementary Material (see Supplementary Figure S1). This temporal separation unequivocally demonstrates that S-waves from the main shock arrived too late to initiate the secondary event. Furthermore, the rupture propagation speed (typically 2–3 km/s) is substantially slower than P-wave velocities (∼6 km/s in the upper crust), making rupture-front triggering physically implausible given the observed timing.
Probabilistic location analysis confirms that the secondary earthquake nucleation most likely occurred in the region between possible nucleation points S2 and S4, with a 68% credible interval spanning approximately 26–32 km from the main epicenter. The maximum probability occurs at point S3 (28–29 km far from the M 7.8 epicenter), indicating this region as the most probable nucleation point. In addition, we underscore that, while the Narlı and Pazarcık faults form an angle close to 32°, the seismic ray path from the epicenter to the optimal virtual nucleation point of the first subevent (close to S3) forms an angle of about 45°–50° with the Pazarcık fault, hence, compatible with the peak amplitude of the P-waves radiation pattern.
These results provide good evidence that P-wave perturbations from the Narlı Fault may have dynamically triggered a segment of the EAF compatible with our theoretical expectations. They also support the critical role of dynamic stress transfer in complex earthquake sequences. Finally, the precise timing compatibility, combined with the exclusion of alternative triggering mechanisms (e.g., S or Rayleigh waves) also proves the efficiency of P-wave-induced stresses in initiating secondary ruptures on favourably oriented fault segments. See Figure 6.
Subsequent fault patches activations from 30 s to 80 s after the earthquake origin time (not dynamically triggered by P-waves) can be observed on the accelerograms recorded by stations distributed along the East Anatolian Fault. In particular, using the same velocity model and the same earthquake location procedure described above, we were able to locate a subevent occurred at 01:18:31.35 UTC time along the Amanos segment of the EAF (Lat 36.6422˚N; Lon 36.2010˚E, RMS = 1.75 s), which is clearly visible on the accelerograms of different stations of the TK seismic network installed along that segment (Supplementary Figure S2). This subevent is compatible with the small seismic moment rate peak observed at about 60 s of the source time function estimated by USGS (U.S. Geological Survey, 2023a).
We have also applied an automatic picking procedure to identify P-wave arrival of subevents which consists in finding relative minima of the following processed signal (Tape et al., 2018)where represents the velocimetric measurements, is the bandpass filter in the range of frequencies , is the Hilbert transform used to obtain the envelope of waveforms and is a n-values moving average. This technique (Equation 15) has been implemented as a further constraint with respect to manual picking which are sensitive to first arrivals but cannot provide direct information about the cumulative effect of the new subevent, which is, conversely, clearly visible when the Hilbert transform is applied.
Similar analyses have also been carried out for the Mw 7.5 earthquake. Using our manually picked first P-wave arrival times from different stations of the KO and TK seismic networks, the origin time of the event is 10:24:47.46 (UTC time) and its epicentral coordinates are Lat = 38.0582˚N and Lon = 37.2648˚E, with RMS = 0.45 s. The closest station to the Mw 7.5 event is station 4611 of the TK seismic network, whose recording does not show a clear activation of subevents and the frequency content observed on the spectrogram is below 30 Hz (Supplementary Figure S3). On the other hand, the activation of fault patches (corresponding to different segments of the main East Anatolian Fault; as a reference for detailed localization, see Ren et al., 2024) can be visible at CMRD station of the KO seismic network (Figure 7), particularly on the 10 Hz high pass filtered signal (orange accelerogram in Figure 7B), where the subevent at time T2 could be compatible with the activation of the western branch (segment two in U.S. Geological Survey, 2023b). Here a super-shear rupture velocity was estimated by Melgar et al. (2023). This subevent is also clearly visible at different stations of the TK seismic network installed nearby the western branch (Supplementary Figure S4). The events recorded at times T3 and T4 on the accelerogram of the CMRD station (Figure 7) can be instead classified as early aftershocks. This classification is because T3 and T4 occur more than 60 s after T1, which represents the first P-wave arrival of the earthquake, whereas the estimated duration of the source time function for the event is approximately 35 s (U.S. Geological Survey, 2023b).
FIGURE 7

(A) Spectrogram and (B) full waveform (blue) and 10 Hz high-pass filtered signal (orange) of the Mw 7.5 6/2/2023 Kahramanmaraş event.
Figures 8, 9 represent the envelopes obtained by integrating the three-component accelerograms of the Mw 7.8 and 7.5 Kahramanmaraş earthquakes at the KHMN and CMRD stations respectively. They are given by the formula described in the previous paragraph with . In this model, the high-frequency amplitude spectrum decays linearly on a log-linear plot. When transformed into the time domain as an envelope (as in the formula above), this shows a single peak followed by a near-linear decay in the semi-logarithmic domain. We can take advantage of this observation to identify multiple sub-events within a complex mainshock. This procedure is efficient as long as the size of the moving average is kept small, otherwise it may result in small offset in the subevent picking. Each fault patch that slips during the rupture is expected to generate a signal adding a further Brune-like pulse. Therefore, each evident and distinct peak in the time series can be interpreted as the signature of a separate sub-event occurring on a different fault patch. The vertical red dashed lines in Figures 8, 9 stand for the arrival times at which the cumulated effect of the accelerometric contribution of subevents becomes dominant in the different components of the seismogram. They are automatically picked using the procedure proposed by Tape et al. (2018).
FIGURE 8

Envelopes of the accelerometric signal of the Mw 7.8 Kahramanmaraş earthquake at the KHMN KOERI station processed in the form where F(t) represents the velocimetric measurements, is the bandpass filter in the range of frequencies , is the Hilbert transform and is a n-values moving average. The red vertical dashed lines represent the automatically found initial times of subevents.
FIGURE 9

Envelopes of the accelerometric signal of the Mw 7.5 Kahramanmaraş earthquake at the CMRD KOERI station processed in the form where F(t) represents the velocimetric measurements, is the bandpass filter in the range of frequencies , is the Hilbert transform and is a n-values moving average. The red vertical dashed lines represent the automatically found initial times of subevents.
5 Discussion
In our model, variations in rupture velocity exhibit a negative correlation with the spatial changes in coseismic stress drop and positive correlation with fault shear modulus. The amount of spatial change in rupture velocity depends on the local spatial average of stress drop: higher values correspond to lower amplitudes of the variation. Consequently, ruptures tend to accelerate at transitions from younger to more mature faults and close to the transition from less to more competent fault rocks, with the former effect typically dominating. Considering this, coseismic ruptures propagate at different speeds across patches characterized by heterogeneous stress conditions, lithology, and geometrical structures. The transition from one fault patch to another can occur smoothly; however, fault systems are usually distributed within extended crustal volumes with variable thickness and fracture network, depending on the tectonic setting and the history of the geological environment. These volumes consist of intricated, rough and fractally distributed interfaces with different stability conditions. So, dynamic stress propagation during the coseismic process can proceed through jumps and the nucleation of several subevents involving faults of various sizes and spatial orientations.
In this context, we propose that P-waves nucleated from the ongoing rupture can be enough to trigger secondary subevents along strike. This effect is demonstrated to be more effective in regions featured by elevated stress (in agreement with Equation 8).
Specifically, the idea that P-waves can dynamically trigger secondary ruptures - including, eventually, super-shear subevents - is not new and has been debated since at least the 2004 Parkfield earthquake (Ma et al., 2008; Sleep, 2018). While these studies highlighted the potential role of P-waves in transient super-shear ruptures, observational limitations and the short duration of such events made conclusive validations difficult. We propose that P-waves generated during the primary rupture can indeed trigger secondary subevents along strike, particularly in regions of elevated stress (as supported by Equation 8). While the amplitude of P-waves is limited, their efficiency as triggering agents depends critically on fault orientation and stress state. The radiation pattern of P-waves maximizes at ±45° to the fault, where dilatational stress changes may weaken the fault interface rather than directly shear it. This property could be a further element supporting the role of P-wave triggering in determining the super-shear transition during the early stages of the Mw 7.8 2023 Kahramanmaraş event which was nucleated along a splay fault forming an angle of 30° with the principal seismogenetic structure (Ding et al., 2023). Along-strike triggering, however, remains plausible if the dynamic stress field aligns favourably with the local fault geometry. A key challenge in distinguishing P-wave from S-wave triggering lies in the delayed radiation of seismic waves from secondary subevents. Nevertheless, our model demonstrates that P-wave triggering is dynamically viable, especially in heterogeneous fault zones where stress concentrations amplify triggering efficiency. By integrating analytical constraints with observations from the 2023 Kahramanmaraş sequence, we extend earlier theoretical arguments (Ma et al., 2008; Sleep, 2018) to a broader range of rupture scenarios.
Finally, we note that a Mach cone can be produced by the envelope of seismic waves nucleated by different subshear-travelling rupture envelopes along strike. However, the effect can be observed at teleseismic distances, where low-frequency signals dominate the spectral amplitude of seismograms, and the seismological contribution of subevents is not significant. This test, although requiring high quality near-field seismological investigation, may be effective to classify seismic events into real super-shear ruptures or envelopes of dynamically triggered sub-shear subevents.
It is worth noting that Mach cones have been identified only in sparse cases and mostly by analysing seismograms at teleseismic distances so far. Even in the case of the Kahramanmaraş Mw 7.8 earthquake, no complete agreement has been reached (Liu et al., 2023; Xu et al., 2023; Ren et al., 2024; Rosakis et al., 2025). Therefore, further analyses are required to understand whether some earthquakes usually considered as super-shear single ruptures are instead the result of super-shear travelling rupture envelopes.
The apparent supershear mechanism proposed here, where a cascade of dynamically triggered sub-events produces a high-velocity rupture envelope - offers a possible explanation for a subset of these observations integrating previous theoretical and modeling research.
Andrews (1976) introduced the theoretical basis for supershear transition of a single, coherent rupture front. The Andrews criterion predicts that a rupture will accelerate beyond the Rayleigh wave speed and potentially approach the P-wave velocity if the initial shear stress exceeds a critical level, a model refined by later studies (e.g., Dunham, 2007). These models are applied on a homogeneous media within which continuous fracture processes occur. Our results are consistent with this physics at the local scale; the individual sub-events in our cascading model propagate at virtually steady velocities depending on rheology and spatial stress gradient conditions on isolated patches. The key difference is that while the Andrews framework describes rupture on a single fault segment, our model operates at the scale of a fault system, where heterogeneity is the dominant control on rupture style.
The work by Kaneko and Lapusta (2010), which uses multi-cycle simulations to explore how fault zone complexity, including segmentation, geometric bends, and variable friction properties, governs rupture propagation shows that jump between segments, arrest at barriers, and re-nucleations are possible, creating a highly heterogeneous slip and rupture time distribution. Our proposed mechanism provides the dynamic explanation for one of the manifestations of this complexity: the cascading triggering of fault patches generating apparent supershear fronts. We quantitatively describe the physical process underlying these jumps observed in such numerical simulations (e.g., Kaneko and Lapusta, 2010; Venegas-Aravena et al., 2024) and observational investigations (e.g., Huang et al., 2016). In this view, our model can be seen as an analytical counterpart that captures the essential kinematics of a dynamically cascading rupture within a complex fault zone.
Therefore, we propose that macroscopic supershear rupture velocity may arise for two different reasons.
True supershear ruptures governed by the Andrews (1976) criterion, due to the physical conditions of evolution of a single rupture front propagating through a relatively homogeneous and optimally stressed medium; the signature of this phenomenon is coherent Mach cone across from near-field to teleseismic distances.
Apparent supershear ruptures governed by the dynamics of heterogeneous fault systems which are properties of rupture envelopes composed of multiple sub-events. A marker is a Mach cone evident in teleseismic data but vanishing at regional and local scales.
Additionally, we highlight the challenges of clear discrimination between 1) and 2) since the ability to observe Mach cones in near-field data is known to be sensitive to the homogeneity of the propagation medium. Therefore, the absence of a clear Mach wave observation in the near-field should not be considered as conclusive evidence against true supershear ruptures.
This framework expands the interpretive toolkit available to seismologists with a physical mechanism consistent with and likely consequence of fault zone complexity. Indeed, field observations, as well as satellite data and geodetic measurements, reveal that seismic events in strike-slip zones occur along complex networks of fractures, leading to heterogeneous slip amounts along strike. A connection between kinematic and dynamic parameters of the coseismic ruptures have been identified with geometrical properties of fault systems, such as the presence of jogs, positive/negative flower structures, and bends. Additionally, a topographic control on the properties of seismic sources has been reported.
Based on geological evidence, the concept that coseismic processes can be approximated as purely frictional phenomena consisting of strain waves travelling throughout smooth, continuous, and relatively homogeneous fault interfaces (e.g., Yue and Lay, 2020; Yang et al., 2021; Yin et al., 2023) seems to be too naive. This conclusion is supported by the evidence of systematically lower double-couple percentage components (on average with values <80% for major M5.5+ earthquakes) in the focal mechanisms of strike-slip seismic events, even in case of high-quality moment tensor inversion, with respect to seismic events hosted in different tectonic settings (Rösler and Stein, 2022; Zaccagnino and Doglioni, 2022) compatible with cascading ruptures along multi-fault segments coalescing into large seismic events.
Moreover, the self-similar nature of seismicity (Herrero and Bernard, 1994) leads to speculate that earthquakes can be described as cascades of several dynamically triggered subevents. Our model, while more complex than conventional methods, is founded on the concept that ruptures propagate through weak crustal volumes (Zaccagnino et al., 2025). In this framework, fault interfaces are not the primary energetic sources but act as passive railways that channel and stabilize the slip of adjoining rock masses. This view is not only compatible with the physical laws of seismicity but also reconciles some geological and seismological observations (e.g., Klinger, 2022). Our research does not question the classical viewpoint on super-shear ruptures but emphasizes the importance of understanding the underlying physical processes to develop more realistic models (e.g., Xia et al., 2004; Bao et al., 2019; Weng and Ampuero, 2019; Bao et al., 2022). Our results suggest that the spatial and temporal evolution of coseismic instabilities is characterized by severe variability influenced by the triggering power of previous subevents, stress criticality, spatial favourable orientation of fault patches with respect to regional stress and directivity effects. Hence, the predictability of the final size of seismic events in this framework, given the initial conditions of ruptures, is limited by the extreme variability of fault strength and detail stress distribution in the brittle crust. Our conclusion is consistent with recent research (e.g., Vavra et al., 2025) and previous observational and theoretical investigations which associate earthquake predictability to the features of the main broken asperity and energy budget considerations (Wesnousky, 2006; Münchmeyer et al., 2022; Barani et al., 2025; Venegas-Aravena and Zaccagnino, 2025). Indeed, the key role in determining the final event magnitude is played by the stability state of fault patches surrounding the nucleation point.
6 Conclusion
Large strike-slip seismic events are usually characterized by relatively low double-couple component, elevated complexity of seismograms - which show modulations of amplitudes and frequency content over time as well as of the temporal evolution of the seismic moment rate - and apparently higher rupture velocity, with some reported super-shear cases (Bao et al., 2022). The latter possibility is supported by the observation of teleseismic Mach cones.
Here, we demonstrate that such evidence is compatible with the occurrence of cascading dynamically triggered rupture envelopes. We provide theoretical and observational support to our hypothesis using analytical modelling of the expected connection between rupture velocity and dynamic and rheology properties of the fault interface, feasibility of P-wave triggering and theoretical explanation of teleseismic Mach cones. We suggest that it would be possible to discriminate between real vs. apparent super-shear seismic events (i.e., single ruptures vs. envelopes travelling faster than shear waves) by checking the local/regional evidence of Mach cones. In the first case, the Mach cone should still be observed at local scales, while in the second one no effect is expected (Figure 4B). We apply our model to the analysis of the two Mw 7.8 and 7.5 mainshocks of the 2023 Kahramanmaraş seismic sequence. Our results suggest that part of currently avowed super-shear seismic events may rather be super-shear envelopes of sub-shear cascading ruptures.
Our work has implications for earthquake physics and seismic predictability, being coseismic processes themselves cascades of dynamically triggered subevents. It has implications for the prediction horizon of large earthquakes which would be bounded within a fraction of duration of the seismic event itself. This view challenges attempts to forecast the final size of the whole seismic event beyond the extension of the asperity where the nucleation occurs.
Statements
Data availability statement
The original contributions presented in the study are included in the article/Supplementary Material, further inquiries can be directed to the corresponding author.
Author contributions
DZ: Visualization, Writing – review and editing, Data curation, Validation, Software, Methodology, Writing – original draft, Conceptualization, Investigation, Formal Analysis. TS: Validation, Conceptualization, Data curation, Methodology, Writing – review and editing, Investigation, Writing – original draft, Visualization, Software. AA: Writing – review and editing, Formal Analysis, Supervision, Writing – original draft, Investigation. AH: Conceptualization, Writing – review and editing, Supervision, Formal Analysis. OT: Writing – review and editing, Supervision, Data curation, Investigation, Methodology. LT: Methodology, Conceptualization, Supervision, Writing – review and editing. CD: Supervision, Writing – review and editing, Funding acquisition, Conceptualization.
Funding
The authors declare that financial support was received for the research and/or publication of this article. TS research activity in this work has been funded by the project FRACTURES of the PRIN 2022 - MUR program (grant n. 2022BEKFN2, financed by the European Union – Next-Generation EU).
Acknowledgments
The authors thank the editor Giovanni Martinelli, Kadek Palgunadi and two reviewers for their suggestions, and Ahmed Elbanna and Elif Oral for useful discussions.
Conflict of interest
The authors declare that the research was conducted in the absence of any commercial or financial relationships that could be construed as a potential conflict of interest.
Generative AI statement
The authors declare that no Generative AI was used in the creation of this manuscript.
Any alternative text (alt text) provided alongside figures in this article has been generated by Frontiers with the support of artificial intelligence and reasonable efforts have been made to ensure accuracy, including review by the authors wherever possible. If you identify any issues, please contact us.
Publisher’s note
All claims expressed in this article are solely those of the authors and do not necessarily represent those of their affiliated organizations, or those of the publisher, the editors and the reviewers. Any product that may be evaluated in this article, or claim that may be made by its manufacturer, is not guaranteed or endorsed by the publisher.
Supplementary material
The Supplementary Material for this article can be found online at: https://www.frontiersin.org/articles/10.3389/feart.2025.1683922/full#supplementary-material
References
1
Aki K. Richards P. G. (2002). Quantitative Seismology. 2nd Ed.Sausalito: University Science Books, 704.
2
Ando R. Kaneko Y. (2018). Dynamic rupture simulation reproduces spontaneous multifault rupture and arrest during the 2016 Mw 7.9 kaikoura earthquake. Geophys. Res. Lett.45 (23), 12–875. 10.1029/2018GL080550
3
Andrews D. J. (1976). Rupture velocity of plane strain shear cracks. J. Geophys. Res.81 (32), 5679–5687.
4
Antoine S. L. Klinger Y. Delorme A. Gold R. D. (2022). Off‐fault deformation in regions of complex fault geometries: the 2013, Mw7.7, baluchistan rupture (pakistan). J. Geophys. Res. Solid Earth127 (11), e2022JB024480. 10.1029/2022JB024480
5
Archuleta R. J. (1984). A faulting model for the 1979 imperial valley earthquake. J. Geophys. Res. Solid Earth89 (B6), 4559–4585. 10.1029/jb089ib06p04559
6
Arpat E. Şaroğlu F. (1972). The east anatolian fault system: thoughts on its development. Bull. Min. Res. Explor. Inst. Turk.78, 33–39.
7
Bao H. Ampuero J. P. Meng L. Fielding E. J. Liang C. Milliner C. W. et al (2019). Early and persistent supershear rupture of the 2018 magnitude 7.5 palu earthquake. Nat. Geosci.12 (3), 200–205. 10.1038/s41561-018-0297-z
8
Bao H. Xu L. Meng L. Ampuero J. P. Gao L. Zhang H. (2022). Global frequency of Oceanic and Continental supershear earthquakes. Nat. Geosci.15 (12), 942–949. 10.1038/s41561-022-01055-5
9
Barani S. Taroni M. Zaccagnino D. Artale Harris P. Petrillo G. (2025). A physics-informed stochastic model for the long-term correlation of earthquakes. Commun. Earth and Env.6 (1), 674. 10.1038/s43247-025-02608-3
10
Bizzarri A. (2012). Rupture speed and slip velocity: what can we learn from simulated earthquakes?Earth Planet. Sci. Lett.317–318, 196–203. 10.1016/j.epsl.2011.11.023
11
Cambonie T. Klinger Y. Lazarus V. (2019). Similarities between mode III crack growth patterns and strike-slip faults. Philos. Trans. R. Soc. A377 (2136), 20170392. 10.1098/rsta.2017.0392
12
Cebry S. B. L. Ke C. Y. Shreedharan S. Marone C. Kammer D. S. McLaskey G. C. (2022). Creep fronts and complexity in laboratory earthquake sequences illuminate delayed earthquake triggering. Nat. Commun.13 (1), 6839. 10.1038/s41467-022-34397-0
13
Chalumeau C. Agurto-Detzel H. Rietbrock A. Frietsch M. Oncken O. Segovia M. et al (2024). Seismological evidence for a multifault network at the subduction interface. Nature628, 558–562. 10.1038/s41586-024-07245-y
14
Chen X. Chitta S. S. Zu X. Reches Z. E. (2021). Dynamic fault weakening during earthquakes: rupture or friction?Earth Planet. Sci. Lett.575, 117165. 10.1016/j.epsl.2021.117165
15
Chounet A. Vallée M. Causse M. Courboulex F. (2018). Global catalog of earthquake rupture velocities shows anticorrelation between stress drop and rupture velocity. Tectonophysics733, 148–158. 10.1016/j.tecto.2017.11.005
16
Diederichs A. Nissen E. K. Lajoie L. J. Langridge R. M. Malireddi S. R. Clark K. J. et al (2019). Unusual kinematics of the papatea fault (2016 kaikōura earthquake) suggest anelastic rupture. Sci. Adv.5 (10), eaax5703. 10.1126/sciadv.aax5703
17
Dieterich J. (1994). A constitutive law for rate of earthquake production and its application to earthquake clustering. J. Geophys. Res. Solid Earth99 (B2), 2601–2618. 10.1029/93JB02581
18
Ding X. Xu S. Xie Y. Van den Ende M. Premus J. Ampuero J. P. (2023). The sharp turn: Backward rupture branching during the 2023 Mw 7.8 Kahramanmaraş (türkiye) earthquake. Seismica2 (3). 10.26443/seismica.v2i3.502
19
Duman T. Y. Emre Ö. (2013). The east anatolian fault: geometry, segmentation and jog characteristics. Geol. Soc. Lond. Spec. Publ.372 (1), 495–529. 10.1144/SP372.14
20
Dunham E. M. (2007). Conditions governing the occurrence of supershear ruptures under slip‐weakening friction. J. Geophys. Res. Solid Earth112 (B7). 10.1029/2006jb004717
21
Dunham E. M. Bhat H. S. (2008). Attenuation of radiated ground motion and stresses from three-dimensional supershear ruptures. J. Geophys. Res. Solid Earth113 (B8), B08319. 10.1029/2007JB005182
22
Ellsworth W. L. Beroza G. C. (1995). Seismic evidence for an earthquake nucleation phase. Science268 (5212), 851–855. 10.1126/science.268.5212.851
23
Fan W. Shearer P. M. (2016). Local near instantaneously dynamically triggered aftershocks of large earthquakes. Science353 (6304), 1133–1136. 10.1126/science.aag0013
24
Goldberg D. E. Taymaz T. Reitman N. G. Hatem A. E. Yolsal-Çevikbilen S. Barnhart W. D. et al (2023). Rapid characterization of the February 2023 Kahramanmaraş, Türkiye, earthquake sequence. Seism. Rec.3 (2), 156–167. 10.1785/0320230009
25
Güvercin S. E. Karabulut H. Konca A. Ö. Doğan U. Ergintav S. (2022). Active seismotectonics of the east anatolian fault. Geophys. J. Int.230 (1), 50–69. 10.1093/gji/ggac045
26
Hamling I. J. Hreinsdóttir S. Clark K. Elliott J. Liang C. Fielding E. et al (2017). Complex multifault rupture during the 2016 Mw 7.8 kaikōura earthquake, New Zealand. Science356 (6334), eaam7194. 10.1126/science.aam7194
27
Herrero A. Bernard P. (1994). A kinematic self-similar rupture process for earthquakes. Bull. Seismol. Soc. Am.84 (4), 1216–1228.
28
Huang Y. Ampuero J. P. Helmberger D. V. (2016). The potential for supershear earthquakes in damaged fault zones–theory and observations. Earth Planet. Sci. Lett.433, 109–115. 10.1016/j.epsl.2015.10.046
29
Johnson P. A. Jia X. (2005). Nonlinear dynamics, granular media and dynamic earthquake triggering. Nature437 (7060), 871–874. 10.1038/nature04015
30
Kaneko Y. Lapusta N. (2010). Supershear transition due to a free surface in 3-D simulations of spontaneous dynamic rupture on vertical strike-slip faults. Tectonophysics493 (3-4), 272–284.
31
Klinger Y. (2022). Imprint of the Continental strike-slip fault geometrical structure in geophysical data. Geophys. Res. Lett.49 (11), e2022GL098146. 10.1029/2022GL098146
32
KOERI-RETMC Earthquake Catalog (2025). Available online at: http://www.koeri.boun.edu.tr/sismo/2/earthquake-catalog/.
33
Liu C. Lay T. Wang R. Taymaz T. Xie Z. Xiong X. et al (2023). Complex multi-fault rupture and triggering during the 2023 earthquake doublet in southeastern Türkiye. Nat. Commun.14 (1), 5564. 10.1038/s41467-023-41404-5
34
Lomax A. Virieux J. Volant P. Berge C. (2000). “Probabilistic earthquake location in 3D and layered models: introduction of a metropolis-gibbs method and comparison with linear locations,” in Advances in seismic event location (Springer), 101–134. 10.1007/978-94-015-9536-0_5
35
Ma S. Custódio S. Archuleta R. J. Liu P. (2008). Dynamic modeling of the 2004 Mw 6.0 parkfield, California, earthquake. J. Geophys. Res. Solid Earth113 (B2), B02301. 10.1029/2007JB005216
36
Mai P. M. Aspiotis T. Aquib T. A. Cano E. V. Castro‐Cruz D. Espindola‐Carmona A. et al (2023). The destructive earthquake doublet of 6 February 2023 in south-central Türkiye and northwestern Syria: Initial observations and analyses. Seism. Rec.3 (2), 105–115. 10.1785/0320230007
37
Marsan D. Lengliné O. (2008). Extending earthquakes’ reach through cascading. Science319 (5866), 1076–1079. 10.1126/science.1148783
38
Melgar D. Taymaz T. Ganas A. Crowell B. Öcalan T. Kahraman M. et al (2023). Sub- and super-shear ruptures during the 2023 Mw 7.8 and Mw 7.6 earthquake doublet in SE Türkiye. Seismica2 (3). 10.26443/seismica.v2i3.387
39
Miyazawa M. (2012). Detection of seismic events triggered by P-waves from the 2011 tohoku-oki earthquake. Earth Planets Space64 (12), 1223–1229. 10.5047/eps.2012.07.003
40
Muehlberger W. R. Gordon M. B. (1987). Observations on the complexity of the east anatolian fault, Turkey. J. Struct. Geol.9 (7), 899–903. 10.1016/0191-8141(87)90091-5
41
Münchmeyer J. Leser U. Tilmann F. (2022). A probabilistic view on rupture predictability: all earthquakes evolve similarly. Geophys. Res. Lett.49 (13), e2022GL098344. 10.1029/2022GL098344
42
Okuwaki R. Yagi Y. Taymaz T. Hicks S. P. (2023). Multi‐scale rupture growth with alternating directions in a complex fault network during the 2023 south‐eastern Türkiye and Syria earthquake doublet. Geophys. Res. Lett.50 (12), e2023GL103480. 10.1029/2023gl103480
43
Palgunadi K. H. Gabriel A. A. Garagash D. I. Ulrich T. Mai P. M. (2024). Rupture dynamics of cascading earthquakes in a multiscale fracture network. J. Geophys. Res. Solid Earth129 (3), e2023JB027578. 10.1029/2023jb027578
44
Quigley M. C. Jiménez A. Duffy B. King T. R. (2019). Physical and statistical behavior of multifault earthquakes: Darfield earthquake case study, New Zealand. J. Geophys. Res. Solid Earth124 (5), 4788–4810. 10.1029/2018JB016859
45
Reilinger R. McClusky S. Vernant P. Lawrence S. Ergintav S. Cakmak R. et al (2006). GPS constraints on Continental deformation in the africa-arabia-eurasia Continental collision zone and implications for the dynamics of plate interactions. J. Geophys. Res. Solid Earth111 (B5), B05411. 10.1029/2005JB004051
46
Reitman N. G. Briggs R. W. Barnhart W. D. Thompson J. A. DuRoss C. B. Hatem A. E. et al (2023). Preliminary fault rupture mapping of the 2023 M7.8 and M7.5 Türkiye earthquakes. Moffett Field, CA: USGS Data Release. 10.5066/P985I7U2
47
Ren C. Wang Z. Taymaz T. Hu N. Luo H. Zhao Z. et al (2024). Supershear triggering and cascading fault ruptures of the 2023 Kahramanmaraş, Türkiye, earthquake doublet. Science383 (6680), 305–311. 10.1126/science.adi1519
48
Rosakis A. Abdelmeguid M. Elbanna A. (2023). Evidence of early supershear transition in the Mw 7.8 Kahramanmaraş earthquake from near-field records. arXiv:2302, 07214. 10.48550/arXiv.2302.07214
49
Rosakis A. Abdelmeguid M. Elbanna A. (2025). Near-field evidence for early supershear rupture of the Mw 7.8 Kahramanmaraş earthquake in Turkey. Nat. Geosci.18 (6), 534–541. 10.1038/s41561-025-01707-2
50
Rösler B. Stein S. (2022). Consistency of non‐double‐couple components of seismic moment tensors with earthquake magnitude and mechanism. Seismol. Soc. Am.93, 1510–1523. 10.1785/0220210188
51
Ross Z. E. Idini B. Jia Z. Stephenson O. L. Zhong M. Wang X. et al (2019). Hierarchical interlocked orthogonal faulting in the 2019 ridgecrest earthquake sequence. Science366 (6463), 346–351. 10.1126/science.aaz0109
52
Sleep N. H. (2018). Searching for spot-fire earthquakes triggered during the 2004 parkfield mainshock. SCEC Annual Meeting.
53
Sparacino F. Galuzzi B. G. Palano M. Segou M. Chiarabba C. (2022). Seismic coupling for the aegean-anatolian region. Earth-Sci. Rev.228, 103993. 10.1016/j.earscirev.2022.103993
54
Stabile T. A. Fat-Helbary E. R. Serlenga V. Panebianco S. Tizzani P. Castaldo R. et al (2024). Fault structure and earthquake clustering in Aswan region (egypt) revealed by high-precision earthquake location from 35 years of recorded natural and induced seismicity. Earth Planet. Sci. Lett.642, 118881. 10.1016/j.epsl.2024.118881
55
Tan O. (2021). A homogeneous earthquake catalogue for Turkey. Nat. Hazards Earth Syst. Sci.21 (7), 2059–2073. 10.5194/nhess-21-2059-2021
56
Tan O. Pabuçcu Z. Tapırdamaz M. C. İnan S. Ergintav S. Eyidoğan H. et al (2011). Aftershock study and seismotectonic implications of the 8 march 2010 kovancılar (elazığ, Turkey) earthquake (mw=6.1). Geophys. Res. Lett.38 (11), L11304. 10.1029/2011GL047702
57
Tape C. Holtkamp S. Silwal V. Hawthorne J. Kaneko Y. Ampuero J. P. et al (2018). Earthquake nucleation and fault slip complexity in the lower crust of central Alaska. Nat. Geosci.11 (7), 536–541. 10.1038/s41561-018-0144-2
58
Trifonov V. G. Çelik H. Simakova A. N. Bachmanov D. M. Frolov P. D. Trikhunkov Y. I. et al (2018). Pliocene–early Pleistocene history of the euphrates valley applied to late Cenozoic environment of the northern Arabian plate and its surrounding, eastern Turkey. Quat. Int.493, 137–165. 10.1016/j.quaint.2018.06.009
59
U.S. Geological Survey (2023a). Event page for the M 7.8 - central Turkey earthquake. Available online at: https://earthquake.usgs.gov/earthquakes/eventpage/us6000jllz/executive ((last accessed October 30, 2025).
60
U.S. Geological Survey (2023b). Event page for the M 7.5 - 4 km SSE of ekinözü, Turkey earthquake. Available online at: https://earthquake.usgs.gov/earthquakes/eventpage/us6000jlqa/executive ((last accessed October 30, 2025).
61
Vavra E. Fialko Y. Bulut F. Garagon A. Yalvaç S. Yaltırak C. (2025). The 2023 Mw 7.8–7.7 Kahramanmaraş earthquakes were loosely slip-predictable. Commun. Earth Environ.6 (1), 80. 10.1038/s43247-024-01969-5
62
Velasco A. A. Hernandez S. Parsons T. Pankow K. (2008). Global ubiquity of dynamic earthquake triggering. Nat. Geosci.1 (6), 375–379. 10.1038/ngeo204
63
Venegas-Aravena P. Zaccagnino D. (2025). Large earthquakes are more predictable than smaller ones. Seismica4 (1). 10.26443/seismica.v4i1.1568
64
Venegas-Aravena P. Crempien J. G. F. Archuleta R. J. (2024). Fractal spatial distributions of initial shear stress and frictional properties on faults and their impact on dynamic earthquake rupture. Bull. Seismol. Soc. Am.114 (3), 1444–1465. 10.1785/0120230123
65
Wang D. Mori J. Koketsu K. (2016). Fast rupture propagation for large strike-slip earthquakes. Earth Planet. Sci. Lett.440, 115–126. 10.1016/j.epsl.2016.02.022
66
Wang Z. Zhang W. Taymaz T. He Z. Xu T. Zhang Z. (2023). Dynamic rupture process of the 2023 Mw 7.8 Kahramanmaraş earthquake (SE Türkiye): variable rupture speed and implications for seismic hazard. Geophys. Res. Lett.50 (15), e2023GL104787. 10.1029/2023GL104787
67
Weng H. Ampuero J. P. (2019). The dynamics of elongated earthquake ruptures. J. Geophys. Res. Solid Earth124 (8), 8584–8610. 10.1029/2019JB017684
68
Wesnousky S. G. (2006). Predicting the endpoints of earthquake ruptures. Nature444 (7117), 358–360. 10.1038/nature05275
69
Wyss M. Brune J. N. (1967). The Alaska earthquake of 28 march 1964: a complex multiple rupture. Bull. Seismol. Soc. Am.57 (5), 1017–1023. 10.1785/bssa0570051017
70
Xia K. Rosakis A. J. Kanamori H. (2004). Laboratory earthquakes: the sub-rayleigh-to-supershear rupture transition. Science303 (5665), 1859–1861. 10.1126/science.1094022
71
Xu L. Mohanna S. Meng L. Ji C. Ampuero J. P. Zhang Y. et al (2023). The overall-subshear and multi-segment rupture of the 2023 Mw7.8 Kahramanmaraş, Turkey earthquake in millennia supercycle. Commun. Earth Environ.4 (1), 379. 10.1038/s43247-023-01030-x
72
Yang J. Zhu H. Lay T. Niu Y. Ye L. Lu Z. et al (2021). Multifault opposing-dip strike-slip and normal-fault rupture during the 2020 Mw 6.5 stanley, Idaho earthquake. Geophys. Res. Lett.48 (10), e2021GL092510. 10.1029/2021GL092510
73
Yin Y. Galvez P. Heimisson E. R. Wiemer S. (2023). The role of three-dimensional fault interactions in creating complex seismic sequences. Earth Planet. Sci. Lett.606, 118056. 10.1016/j.epsl.2023.118056
74
Yue H. Lay T. (2020). Resolving complicated faulting process using multi-point-source representation: iterative inversion algorithm improvement and application to recent complex earthquakes. J. Geophys. Res. Solid Earth125 (2), e2019JB018601. 10.1029/2019JB018601
75
Zaccagnino D. Doglioni C. (2022). The impact of faulting complexity and type on earthquake rupture dynamics. Commun. Earth Environ.3 (1), 258. 10.1038/s43247-022-00593-5
76
Zaccagnino D. Telesca L. Doglioni C. (2021). Different fault response to stress during the seismic cycle. Appl. Sci.11 (20), 9596. 10.3390/app11209596
77
Zaccagnino D. Telesca L. Doglioni C. (2022a). Scaling properties of seismicity and faulting. Earth Planet. Sci. Lett.584, 117511. 10.1016/j.epsl.2022.117511
78
Zaccagnino D. Telesca L. Doglioni C. (2022b). Variable seismic responsiveness to stress perturbations along the shallow section of subduction zones: the role of different slip modes and implications for the stability of fault segments. Front. Earth Sci.10, 989697. 10.3389/feart.2022.989697
79
Zaccagnino D. Bruno O. Doglioni C. (2025). Spatial scale dependence of fault physical parameters and its implications for the analysis of earthquake dynamics from the lab to fault systems. Earth Planet. Sci. Lett.666, 119481. 10.1016/j.epsl.2025.119481
80
Zeng H. Ma Z. Li C. Yin X. Jiang Y. Chen Y. et al (2025). Super‐shear and generalized rayleigh rupture of the 2023 Turkey earthquake doublet influenced by fault material contrast. J. Geophys. Res. Solid Earth130, e2025JB031560. 10.1029/2025JB031560
81
Zhang H. Chen J. Ge Z. (2012). Multi-fault rupture and successive triggering during the 2012 Mw 8.6 Sumatra offshore earthquake. Geophys. Res. Lett.39 (22), L22302. 10.1029/2012gl053805
82
Zhang Y. Tang X. Liu D. Taymaz T. Eken T. Guo R. et al (2023). Geometric controls on cascading rupture of the 2023 Kahramanmaraş earthquake doublet. Nat. Geosci.16 (11), 1054–1060. 10.1038/s41561-023-01283-3
83
Zhou J. Xu Y. Zhang Y. Feng W. Taymaz T. Chen Y. T. et al (2025). Geometric barriers impacted rupture processes and stress releases of the 2023 Kahramanmaraş, Türkiye, earthquake doublet. Commun. Earth Environ.6 (1), 56. 10.1038/s43247-025-02004-x
Summary
Keywords
seismic source, cascading rupture envelopes, rupture velocity, 2023 Türkiye seismic doublet, super-shear earthquakes
Citation
Zaccagnino D, Stabile TA, Akinci A, Herrero A, Tan O, Telesca L and Doglioni C (2025) Supershear cascading rupture envelopes: a case study from the 2023 Kahramanmaraş seismic doublet. Front. Earth Sci. 13:1683922. doi: 10.3389/feart.2025.1683922
Received
11 August 2025
Revised
22 November 2025
Accepted
24 November 2025
Published
12 December 2025
Volume
13 - 2025
Edited by
Giovanni Martinelli, National Institute of Geophysics and Volcanology, Italy
Reviewed by
Zarghaam Rizvi, GeoAnalysis Engineering GmbH, Germany
Kadek Hendrawan Palgunadi, Sepuluh Nopember Institute of Technology, Indonesia
Updates
Copyright
© 2025 Zaccagnino, Stabile, Akinci, Herrero, Tan, Telesca and Doglioni.
This is an open-access article distributed under the terms of the Creative Commons Attribution License (CC BY). The use, distribution or reproduction in other forums is permitted, provided the original author(s) and the copyright owner(s) are credited and that the original publication in this journal is cited, in accordance with accepted academic practice. No use, distribution or reproduction is permitted which does not comply with these terms.
*Correspondence: Davide Zaccagnino, zaccagnino@sustech.edu.cn
Disclaimer
All claims expressed in this article are solely those of the authors and do not necessarily represent those of their affiliated organizations, or those of the publisher, the editors and the reviewers. Any product that may be evaluated in this article or claim that may be made by its manufacturer is not guaranteed or endorsed by the publisher.