 Zhongbing Chang1
 Jiaming Wang2*
 Xin Xiong3Jun Jiang4
 Jianping Wu5Songjia Chen4Jie Li4Shuo Zhang6
 Guangxing Ji7Baowei Qian7*
- 1State Key Laboratory of Geo-Information Engineering and Key Laboratory of Surveying and Mapping Science and Geospatial Information Technology of MNR, Surveying and Mapping Institute Lands and Resource Department of Guangdong Province, Guangzhou, China
- 2International Joint Laboratory of Watershed Ecological Security for Water Source Region of Middle Route Project of South-North Water Diversion in Henan Province, College of Water Resource and Modern Agriculture, Nanyang Normal University, Nanyang, China
- 3Jiangxi Provincial Key Laboratory of Carbon Neutrality and Ecosystem Carbon Sink, Lushan Botanical Garden, Jiangxi Province and Chinese Academy of Sciences, Jiujiang, China
- 4Key Laboratory of Vegetation Restoration and Management of Degraded Ecosystems, South China Botanical Garden, Chinese Academy of Sciences, Guangzhou, China
- 5Guangdong Provincial Key Lab of Remote Sensing and Geographical Information System, Guangzhou Institute of Geography, Guangdong Academy of Sciences, Guangzhou, China
- 6Forestry Policy Research Office of Zhaoqing High level Talent Training and Development Center, Municipal Bureau of Forestry, Zhaoqing, China
- 7College of Resources and Environmental Sciences, Henan Agricultural University, Zhengzhou, China
Predicting future land-use patterns and carbon storage is essential for understanding regional terrestrial ecosystems, as regional land-use change plays a crucial role in ecosystem carbon storage variations. Using the Patch-generating Land Use Simulation Model (PLUS), we simulated the 2020 land-use types in the Yellow River Basin (YRB) based on the 2010 data. Subsequently, we predicted YRB land-use types for 2030 to 2100. Finally, based on these simulated land-use patterns, we calculated the carbon storage in the YRB from 1980 to 2100 using the InVEST model. The results showed that: (1) From 1980 to 2020, the InVEST model showed that carbon storage in the Yellow River Basin (YRB) exhibited an increasing trend of 12.10%. Rapid carbon storage increases can be observed in 2000–2020 (16.9 million tons). The largest carbon storage was found in Grassland (2487.24 million tons), which accounts for 51.03% of the total carbon storage in YRB. (2) During 2030 to 2100, the grassland area showed a decrease trend in SSP1-2.6 (−12.22%). The forest area showed an increase trend in SSP1-2.6 (3.49%). (3) Among the different scenarios, SSP1-2.6 (103.99 million tons) and current scenarios (23.07 million tons) showed the largest carbon storage gains from 2030 to 2100, primarily attributed to the cultivated land and forest, despite a major loss from grassland. SSP2-4.5 showed a carbon storage loss of 23.48 million tons, while a slight gain of 6.49 million tons was observed under SSP5-8.5. (4) Carbon storage losses were primarily observed in the grassland-dominated northern regions of the YRB. In contrast, the southernmost and eastern regions showed an increasing trend. This research provides essential scientific support for optimizing land-use structure and enhancing land management strategies across the YRB basin.
1 Introduction
In the past century, the extensive fossil fuel use has driven a significant increase in global temperatures (Sun et al., 2023). Consequently, the topic of “carbon emissions and carbon reduction” has become a major focus for scholars globally. The heightened attention stems directly from the adverse impacts of global warming (Zhang et al., 2022). In 2020, China’s total carbon emissions reached 9.899 billion tons, accounting for approximately 30.70% of the global total and making it the largest carbon emitter (BP, 2021). Carbon storage changes in terrestrial ecosystems, defined as the sum of aboveground and underground biomass organic carbon, soil organic carbon, and litter organic carbon reserves, playing an important role in regulating and mitigating greenhouse effects (Xiang et al., 2022; Li et al., 2020). Thus, quantifying these variations is critical for informing ecological security and conservation policies.
The Yellow River Basin (YRB) is ecologically significant and a pivotal region for human activities and economic development (Guo, 2022). China’s National Plan for Ecological Environmental Protection and Construction (2013–2020) formulated by the established primary tasks and objectives for advancing the YRB’s sustainability (Huang, 2019). Subsequently, the YRB Ecological Protection and High-quality Development Plan (EPHD) was officially issued for implementation from 2021 to 2025, emphasizing low-carbon development in the middle and downstream regions and requiring effective reduction of carbon emission intensity. It is evident that ecological protection and high-quality development in the YRB have become a national strategy (Li, 2023; Huo and Zhao, 2021). Consequently, extensive research has been conducted on carbon emissions and reduction in the YRB (Table 1).
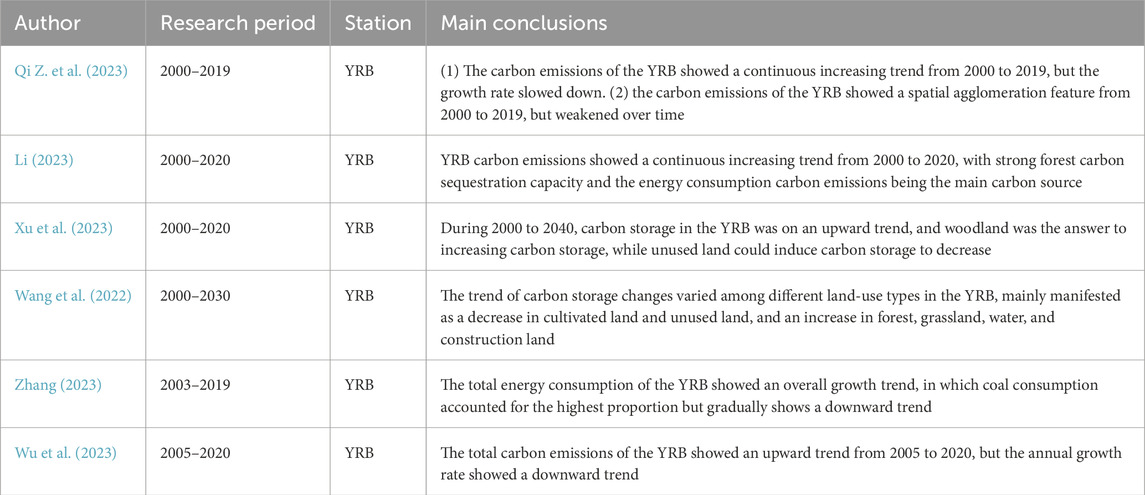
Table 1. Research on the yellow river basin.
To simulate future societal scenarios, the Shared Socio-economic Pathways (SSPs) framework was developed through parallel scenario modeling. Specifically, they describe potential development trajectories and assess capacity to adapt to future challenges (Moss et al., 2010; Van Vuuren et al., 2012; Van Vuuren et al., 2014; O’Neill et al., 2014; O’Neill et al., 2017; Wang et al., 2019). Since the introduction of SSPs scenarios, significant progress had been made in both SSPs scenarios and their applications. As a key factor connecting the natural environment and socio-economy, land-use has become a research hotspot for predicting and modelling the future land conditions under SSPs framework (Riahi et al., 2017; Sarah et al., 2018; Stehfest et al., 2019; Wong et al., 2020). The Integrated Assessment Models (IAMS), such as the Global Environmental Assessment Integrated Model (IMAGE) and the Global Change Assessment Model (GCAM), were used to integrate land-use systems with global policy assumptions. The recently released CMIP6 Land-Use Coordination Dataset (LUH2) represents land-use types in fractional form at a resolution of only 0.25° (Hurtt et al., 2016). Most existing land-use prediction used coarser spatial resolutions (e.g., 0.5 ° × 0.5 °, 0.25 ° × 0.25 °), ignoring regional and local-scale variations. This limitation neglects the significant impact of small-scale environmental variables such as soil properties, terrain, and local climate on land-use dynamics (Thomson A M et al., 2014; West T O et al., 2014; Barbier E B, 2014).
To characterize the future spatial-temporal variation of ecosystem carbon storage in the YRB, the future land-use types of YRB were first simulated. Then, future ecosystem carbon storage under different scenarios was calculated. Finally, the results were analyzed to identify the spatiotemporal variation characteristics. Specifically: 1) Land-Use change pattern and carbon storage dynamics in the YRB from 1980 to 2020 were analyzed. 2) Land-use types for 2030–2100 were simulated using the PLUS model. 3) Ecosystem carbon storage for 2030–2100 was calculated using the InVEST model. This study reveals the future spatial-temporal changes in the YRB’s ecosystem carbon storage, providing a scientific basis for adjusting the YRB’s land-use structure and informing land management decisions.
2 Materials and methods
2.1 Study area
The Yellow River Basin (YRB) covering an area of 752,443 km2, with a main stream length of 5,464 km (Figure 1). It comprises four major geomorphological units: the Tibetan Plateau, the Inner Mongolian Plateau, the Loess Plateau, and the North China Plain. The western region is predominantly mountainous, the central area is characterized by loess landforms, the eastern part of the basin is primarily composed of the Yellow River alluvial plains. The basin exhibits complex and diverse climatic conditions, transitioning from arid in the northwest to semi-arid and semi-humid in the southeast.
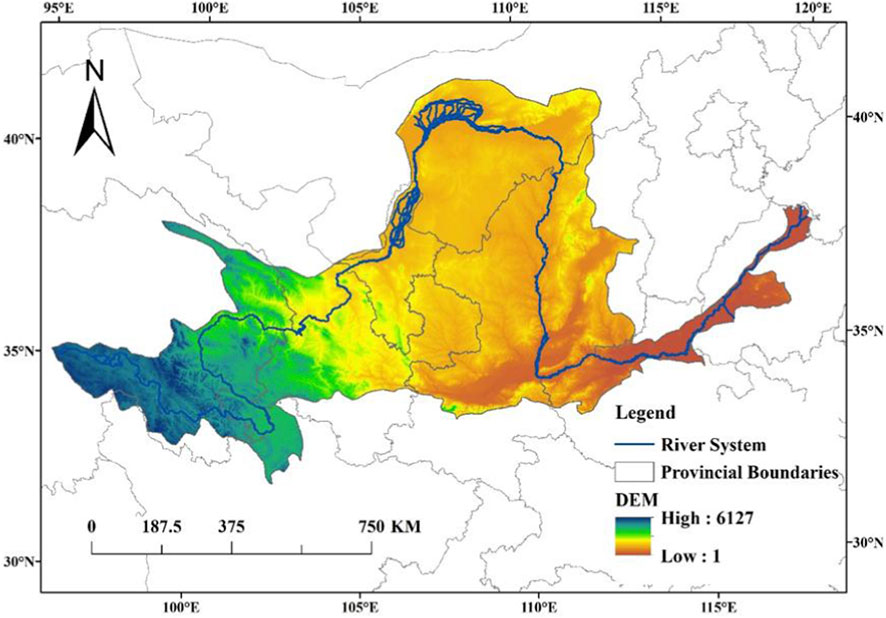
Figure 1. The Yellow River Basin research area.
2.2 Data
The land-use data were obtained from Chinese Academy of Sciences (http://www.resdc.cn/data). This dataset originally comprised of six categories and 26 subcategories: Cultivated land, forestland, grassland, water, construction, and unused land. The CMIP6 land-use harmonization dataset was obtained from the global 0.25° × 0.25° Land-Use Harmonization2 (LUH2) dataset (https://luh.umd.edu/, 1 April 2025). The Invest model was obtained from Natural Capital Project of Stanford University (https://naturalcapitalproject.stanford.edu/software/invest). The Patch-generating Land Use Simulation (PLUS) Model was obtained from the website (https://github.com/HPSCIL/Patch-generating_Land_Use_Simulation_ Model).
Since the LUH2 dataset does not project water bodies (Liao et al., 2020), we assumed that the number of water bodies in different SSP-RCP scenarios will remain unchanged from 2030 to 2100, equivalent to the 2020 baseline. Additionally, substantial discrepancies exist between the LUH2-derived areas of the five land-use types and actual observations. To mitigate these errors, we corrected LUH2 land-use areas using 2020 observational data from the Yellow River Basin (YRB) via a three-step process: (1) Replacing initial LUH2 land-use areas under all scenarios with 2020 observational data. (2) Calculating proportional changes in LUH2 land-use types from 2020 to target years under each scenario. (3) Projecting future land-use areas by multiplying 2020 observational data by the LUH2-derived proportional changes.
2.3 Methods
2.3.1 PLUS model
The PLUS model is a cellular automaton (CA) model based on grid data, which can be used for simulating patch scale land use or land cover (LULC) changes. The PLUS integrates rule mining methods by land expansion analysis and a CA model based on multi-type random seed mechanisms, which can be used to explore the driving factors of land expansion and predict the patch-level evolution of land use landscapes. It should be noted that the PLUS only supports “unsigned char” format for land-use data, and the encoded land-use categories are continuous integers starting from one. Therefore, first step is to turn 2010 and 2020 data into “unsigned char” format. The PLUS mainly includes three aspects:
1. Extracting land expansion. The “Extract Land Expansion” tool was used for processing.
2. Land expansion analysis strategy. The driving factors and the land expansion data obtained from the previous step were input, with default parameters of the random forest regression model, including a sampling rate of 0.01, a regression quantity of 20, and a maximum feature number of 16. Then the contribution rate of driving factors for all land-use types can be obtained.
3. CA by multiple random factors (CARS).
Based on initial land-use data and the contribution rate simulated in the previous step, we set the simulation parameters, including land-use demand, conversion matrix (Table 2), and neighborhood weights (0.6, 1, 1, 0.9, 1, and 0.1), then run the model. In the simulation parameters, land-use demand refers to the data of various land types for the simulated future year. The conversion matrix represents the transfer rules between different land classes, with 0 indicating land-use type cannot be converted to another, and 1 indicating conversion is allowed. The neighborhood weight parameter represents the expansion capacity, with a range of 0–1, and a value closer to 1 indicating a stronger expansion capacity for that land type.
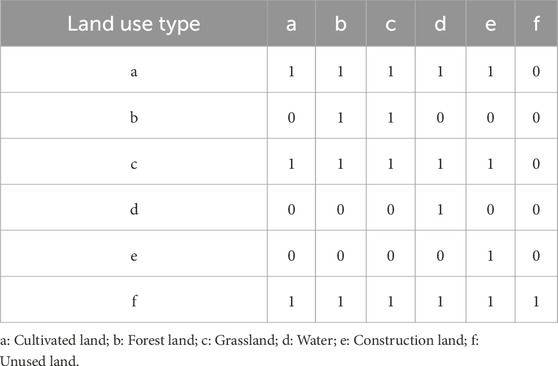
Table 2. Land-use transfer cost matrix.
To validate the applicability of the model in simulating land-use change, we employed Kappa coefficient to assess the accuracy of the simulation results. It was widely acknowledged that a higher Kappa coefficient indicates better accuracy in simulation (Hou et al., 2022).
2.3.2 Future scenario settings
The study employed three scenarios, namely, SSP1-2.6, SSP2-4.5 and SSP5-8.5, which are described below:
1. SSP1-2.6 describes a world in which global carbon dioxide emissions will be cut dramatically, but not as quickly, reaching zero after 2050. Society is undergoing a transition towards adopting more sustainable practices, wherein the emphasis is shifting from solely pursuing economic growth to prioritizing the overall wellbeing of communities. Investment in education and health is expected to increase. Inequality has decreased. It is expected that the temperature will steadily rise by about 1.8 °C by the end of this century.
2. SSP2-4.5 depicts a prospective scenario wherein carbon dioxide emissions remain stable at present levels until they commence declining in the mid-century, albeit not reaching zero by 2100. Socio-economy will continue to adhere to their historical patterns without undergoing substantial alterations. Progress towards achieving sustainability has exhibited a sluggish pace, with development and income growth displaying disparities. According to the given scenario, it is projected that temperatures will experience a rise of 2.7 °C by the end of the present century.
3. SSP 5–8.5 describes the future world as one in which production is developed at all costs and current levels of carbon dioxide emissions roughly double by 2050. The global economy is experiencing significant growth, which is primarily driven by the extraction of fossil fuels and the adoption of energy-intensive lifestyles. By the year 2100, it is projected average global temperature will increase by 4.4 °C.
Based on the PLUS model and three scenarios (SSP1-2.6, SSP2-4.5, SSP5-8.5), we simulated land use in the YRB at a 1-km resolution for the years 2030, 2040, 2050, 2060, 2070, 2080, 2090, and 2100. Corrected CMIP6 land use data was utilized in conjunction with the trained PLUS model for these simulations.
2.3.3 Carbon module of INVEST model
The Carbon module of INVEST model was selected for this study. This module divides ecosystem carbon storage into four basic carbon pools: aboveground, belowground, soil and dead biomass carbon. Based on land-use classification, average carbon densities of four different land types of carbon reservoirs (
In above equation, i represents average carbon density for each land-use; Ai represents area of that land-use.
Carbon density serves as a crucial input parameter in accurately evaluating carbon storage, and it is influenced by factors like climate, soil properties, and land-use (Fu et al., 2019), necessitating the need for revision (Qi Q. et al., 2023). Carbon density values of various land-use types in the YRB, as adjusted by Yang (2021) for annual precipitation and mean annual temperature, are presented in Table 3.
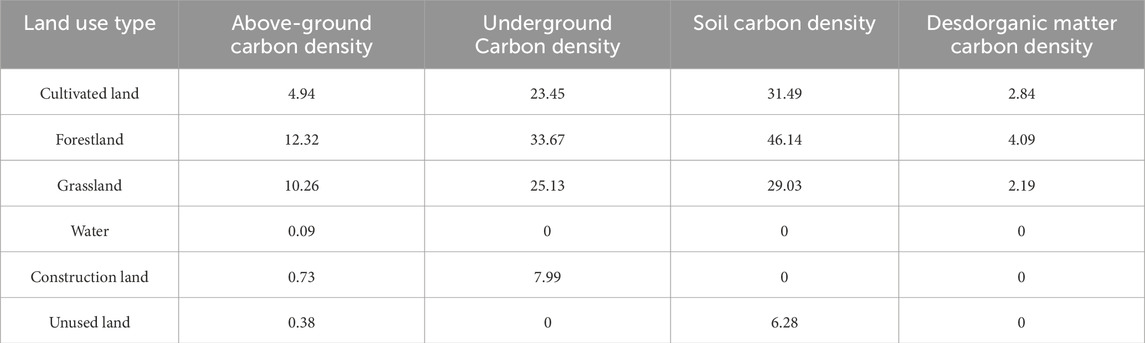
Table 3. Carbon density values of different land types in the YRB as revised by annual precipitation and annual temperature (Yang J et al., 2021).
3 Results
3.1 Spatial-temporal change characteristics of carbon storage
The land-use types and carbon storage within the YRB spanning years 1980–2020 were presented in Table 4. Grassland constituted the predominant land-use type in the YRB between 1980 and 2020, encompassing over 46% of total basin area. It was followed by cultivated land, forest land, unused land, construction land, and water, in descending order of coverage. The proportion of grassland declined between 1990 and 2010 but increased by 2020, primarily due to the implementation of the “Returning Farmland to Forest and Grassland” (RFFG) policy. The total area of cultivated land has experienced an increase from 219,770 km2 to 222,835 km2 between 1980 and 2020, resulting in an increase of 3,065 km2. The unused land had decreased by 1,190 km2 during the same time frame. The forest land experienced a decline by 40 km2 between 1980 and 2020. Over the course of the 40-year period from 1980 to 2020, there has been a consistent increase in construction land. Specifically, construction land has showed a significant upward trend, increasing significantly by 1,790 km2. Although Water area in the YRB constitutes a relatively small portion, and it decreased by 1,583 km2 between 1980 and 2020.
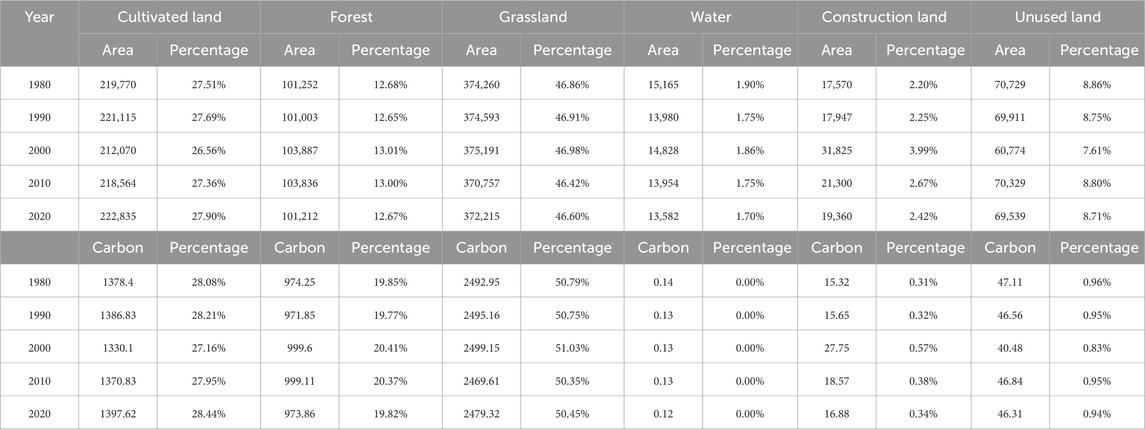
Table 4. Land-use Types (km2) and Carbon storage (million tons) in the YRB.
From 1980 to 2000, there was a decline in overall carbon storage in the YRB, amounting to a reduction of 10.96 million tons (Figure 2). Specifically, carbon storage in cultivated land decreased by 48.3 million tons, representing a percentage decrease of 0.92%. Carbon storage in forest land increased by 25.35 million tons, with a percentage increase of 0.56%. Additionally, carbon storage in grassland increased by 6.2 million tons, reflecting a percentage increase of 0.24%. Furthermore, carbon storage in constructed land increased by 12.43 million tons, indicating a percentage increase of 0.25%. Lastly, carbon storage in unused land decreased by 6.63 million tons, resulting in a percentage decrease of 0.13%. However, the total carbon storage of the YRB showed a significant upward trend, increasing by 9.02 million tons from 2000 to 2020. From a quantitative standpoint, it can be observed that the grassland area within the YRB exhibited the highest carbon storage levels between 1980 and 2020, which accounted for more than 50% of overall carbon storage within the YRB. It was followed by cultivated land, forest land, unused land, construction land, and water, which aligns with the distributions of land-use types in the YRB. Grassland carbon storage exhibited variability in accordance with fluctuations in grassland area, primarily influenced by RFFG.
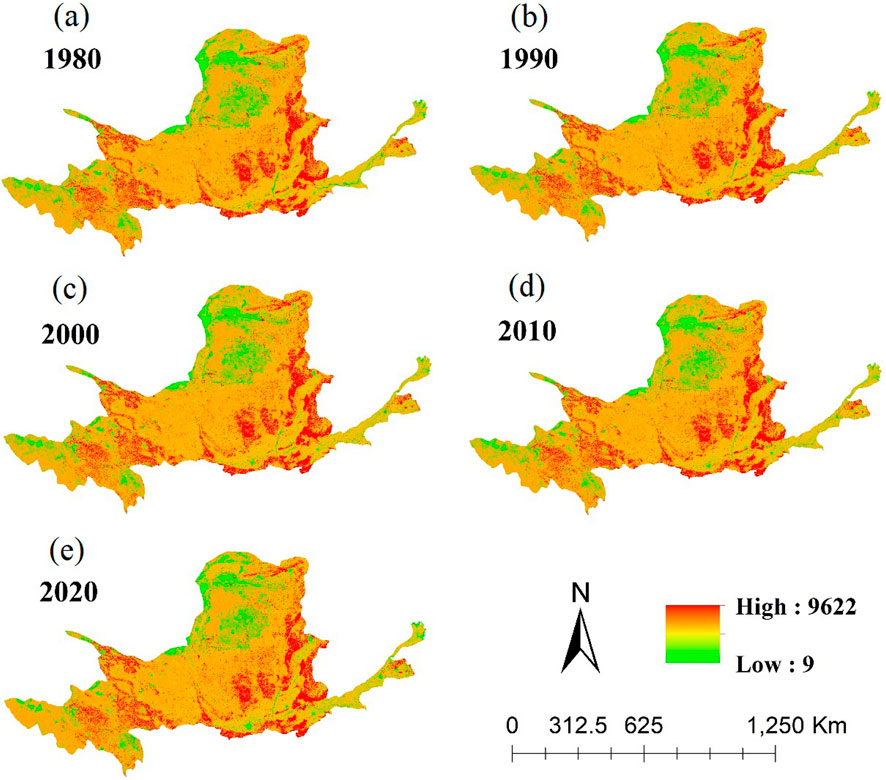
Figure 2. The spatial-temporal distribution of YRB’s carbon storage in 1980 (a), 1990 (b), 2000 (c), 2010 (d), and 2020 (e).
Based on the analysis of carbon storage in the YRB between 1980 and 2020 (Figure 3). In relation to the changes that occurred between 1980 and 1990, the regions experiencing alterations in carbon storage is primarily situated in the northern Hetao Plain of the YRB and Ordos Plateau. The majority of these areas exhibited an increase in carbon storage, while a few sporadic regions demonstrated a decrease in carbon storage. From period of 1990–2000, the changes in carbon storage values in the YRB exhibited a similar pattern to that of the previous decade (1980–1990). However, the areas experiencing increased carbon storage were primarily located in the northeastern region of Ordos Basin and Luo River. As depicted in Figure 3, carbon storage fluctuations in YRB during the period of 2000–2010 were minimal, with only sporadic changes observed in the central region of the basin. During the period from 2010 to 2020, significant changes had been observed in the carbon storage within the YRB. The analysis revealed there had been an increase in carbon storage primarily in the northern region of Ba Yan Ka La Mountain and the western part of the Hetao Plain. Conversely, a decrease in carbon storage had been observed in scattered areas within the northern part of the Hetao Plain and Ordos Basin. Overall, carbon storage in the northern and western parts of the YRB was highly variable, mainly in Hetao Plain and Ordos Plateau.
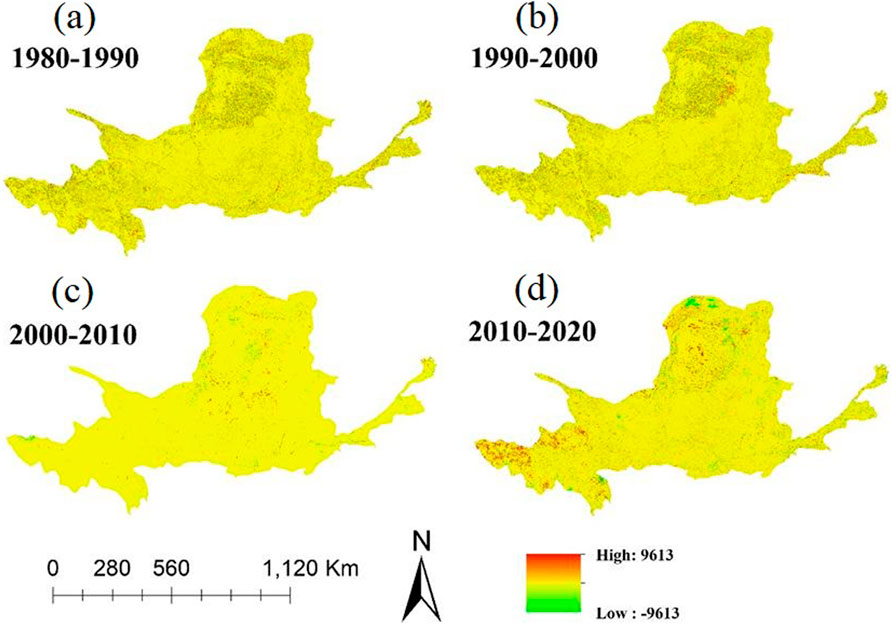
Figure 3. Variations in carbon storage of the YRB from 1980 to 1990 (a), 1990 to 2000 (b), 2000 to 2010 (c), 2010 to 2020 (d).
3.2 Land-use change simulation in the YRB under different scenarios
The predicted land-use data of the YRB in 2020 was compared with actual land-use data (Figure 4). The resulting Kappa coefficient is 0.71, indicating a substantial level of agreement and demonstrating the predictions were sufficiently precise for the requirements of this research.
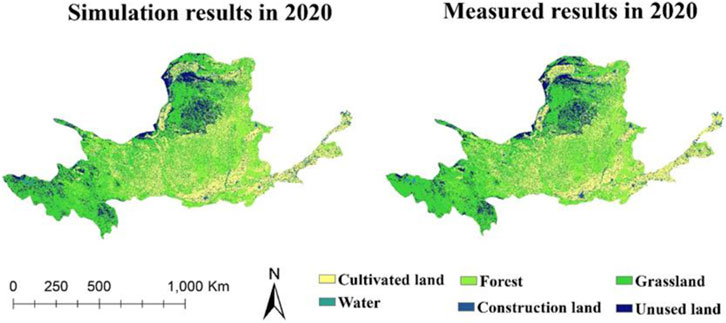
Figure 4. Simulated and measured land-use of the YRB in 2020.
The simulations depict the spatial distribution of land-use in the YRB for SSP1-2.6, SSP2-4.5, and SSP5-8.5 (Figure 5). From 2030 to 2100, it was projected that cultivated land and constructed land will be predominantly located in the southeastern part of the basin. Forest land was mainly distributed in northern and western regions. Grassland was concentrated in central and southwestern parts. Additionally, water was along the northern edge of the basin in a block-like pattern. Unused land mainly located in the central and northern parts of the YRB, specifically in Ordos Basin and southern part of Hetao Plain. In general, there is no significant change in the spatial distribution of land-use types of the YRB between 2030 and 2100.
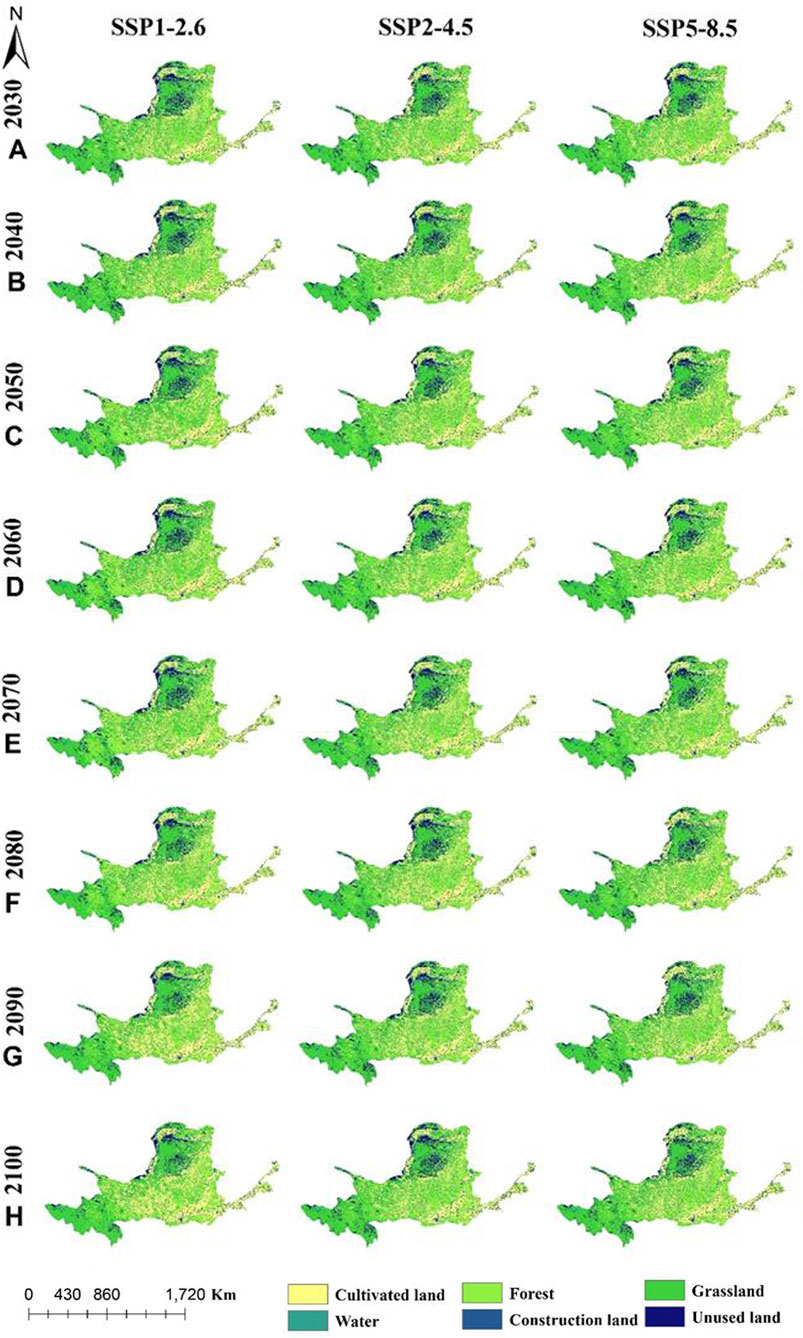
Figure 5. Land-use simulation map of the YRB in 2030 (A), 2040 (B), 2050 (C), 2060 (D), 2070 (E), 2080 (F), 2090 (G) and 2100 (H) under three scenarios.
The proportion of different land-use types in the YRB under three different scenarios was shown in Figure 6. Under various scenarios, the simulations indicated land-use types ranked from largest to smallest are grassland, cultivated land, forest land, unused land, constructed land, and water. Under SSP1-2.6, the proportion of grassland and unused land was decreasing steadily, while the proportion of cultivated land is increasing year by year. The proportion of construction land and water area remained almost unchanged in SSP1-2.6. The proportion of cultivated land area in SSP2-4.5 and SSP5-8.5 had always remained at 25%–30%, while in SSP1-2.6, the proportion of cultivated land area exceeded 30% in 2100. At the same time, the proportion of grassland area in SSP2-4.5, and SSP5-8.5 had remained at 45%–50%, while in SSP1-2.6, the proportion of grassland area was less than 45% in 2100. This indicated that in the SSP1-2.6 scenario, grassland area was shifting towards cultivated land.
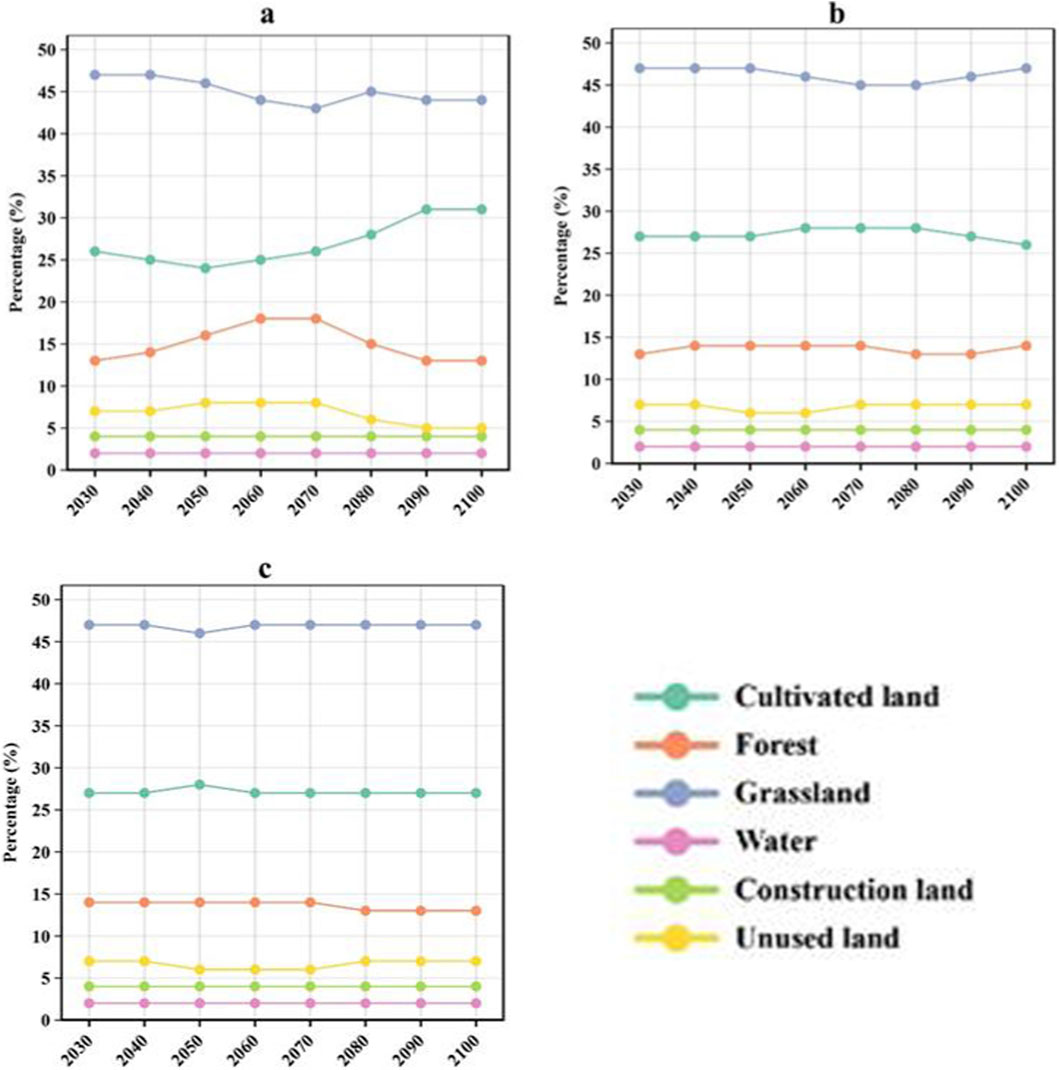
Figure 6. The proportion of different land-use types in the YRB under SSP1-2.6 (a), SSP2-4.5 (b), SSP5-8.5 (c).
3.3 Spatial-temporal variation characteristics of carbon storage changes in the YRB under different scenarios
Based on various scenarios of future land-use in the YRB, we calculated the projected carbon storages (Figure 7). The carbon storage in the YRB exhibited a decreasing trend from southeast to the northwest during the period of 2030–2100.
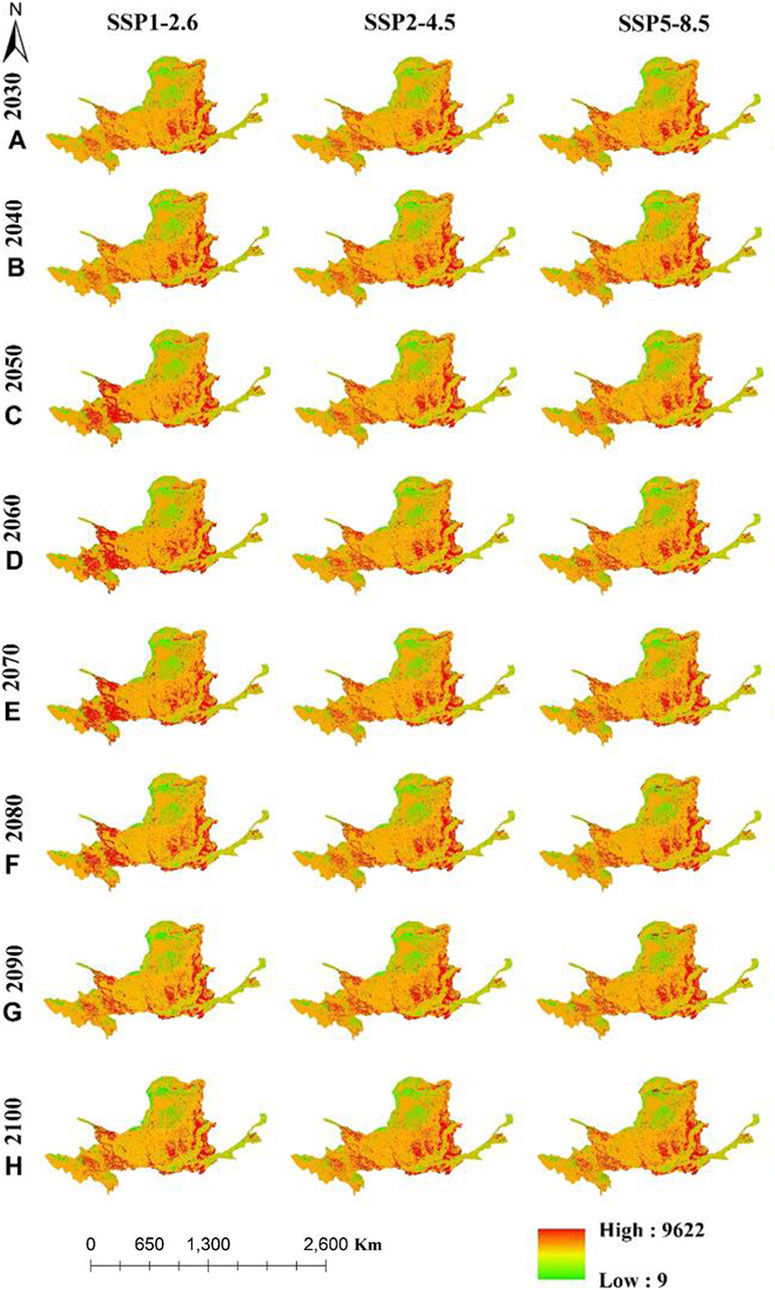
Figure 7. Temporal-spatial distribution of the YRB’s carbon storage in 2030 (A), 2040 (B), 2050 (C), 2060 (D), 2070 (E), 2080 (F), 2090 (G) and 2100 (H) under three scenarios.
The spatial-temporal distribution of carbon storages in the YRB during the period of 2030–2100, as depicted in Figure 7, exhibited a relatively consistent pattern across various scenarios. Most of the regions within the YRB exhibited values that surpass the median. The majority of low carbon storage areas were located in the northwest region, specifically in the Ordos Plateau region. The primary reason for the limited carbon sequestration capacity in this region was attributed to the presence of land types like sandy land and other unused land, which possessed a weak capacity for carbon sequestration. The regions with high-value carbon storage were situated in the southeastern part. The spatial-temporal distribution of carbon storage in the YRB remained relatively consistent across the three scenarios, yet there were also differences. In the simulated spatial-temporal distribution of carbon storage in the YRB under SSP1-2.6, the high-value carbon storage area was wider than that simulated under the SSP2-4.5 and SSP5-8.5, particularly near the Tao River in the southwestern direction.
The variations in carbon storage of the YRB under various scenarios from 2030 to 2100 were shown in Figure 8. Carbon storage under SSP1-2.6 experienced a notable increase starting from 2040 and reached its peak in 2080. Among all scenarios, SSP1-2.6 exhibited the highest carbon storage levels during 2050–2100. In contrast, carbon storage under SSP2-4.5 exhibited a gradual increase from 2030 to 2060, followed by a pronounced decline from 2060 to 2080. After 2080, the decline slowed, reaching its lowest point by 2100. Similarly, under SSP5-8.5 scenario, the pattern of carbon storage fluctuations in the YRB aligned with that observed under SSP2-4.5. Specifically, there was a gradual rise in carbon storage from 2030 to 2070, followed by a sharp decline from 2070 to 2080, and a subsequent gradual increase at a slower pace.
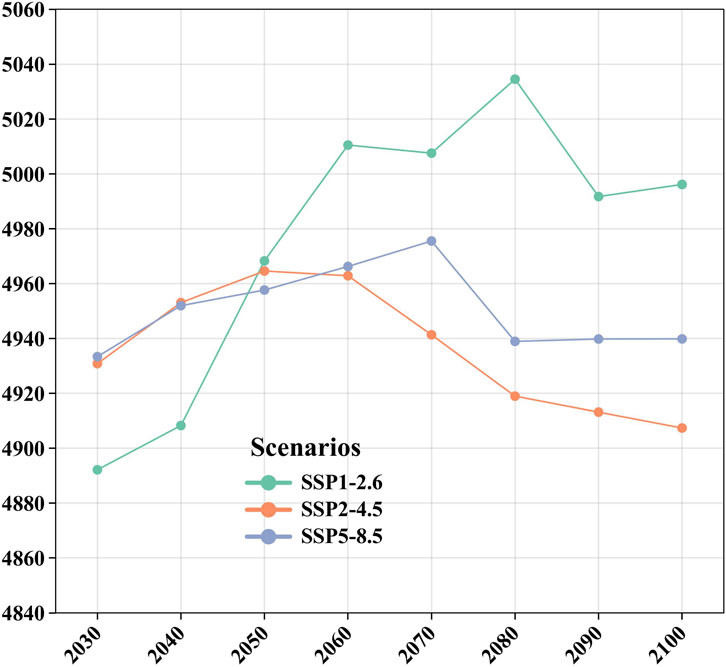
Figure 8. Variations in carbon storage in YRB under different scenarios (2030–2100).
In SSP1-2.6, carbon storage in the YRB declined by 5.07 million tons from 2020 to 2030, followed by a subsequent increase of 103.99 million tons from 2030 to 2100 (Table 5). In SSP2-4.5, carbon storage increased by 33.62 million tons during 2020–2030 and decreased by 23.48 million tons during 2030–2100. In SSP5-8.5, Carbon storage increased by 36.16 million tons during 2020–2030 and 6.49 million tons during 2030–2100. As shown in Table 3, the net change in carbon storage during 2030–2100 under SSP2-4.5 (−23.48 million tons) was significantly lower than under SSP5-8.5 (+6.49 million tons). This disparity primarily stems from differences in carbon dynamics within cultivated and forest land. These findings suggest that enhancing land-use efficiency for both cultivated and forest ecosystems is critical for advancing global sustainable development goals.
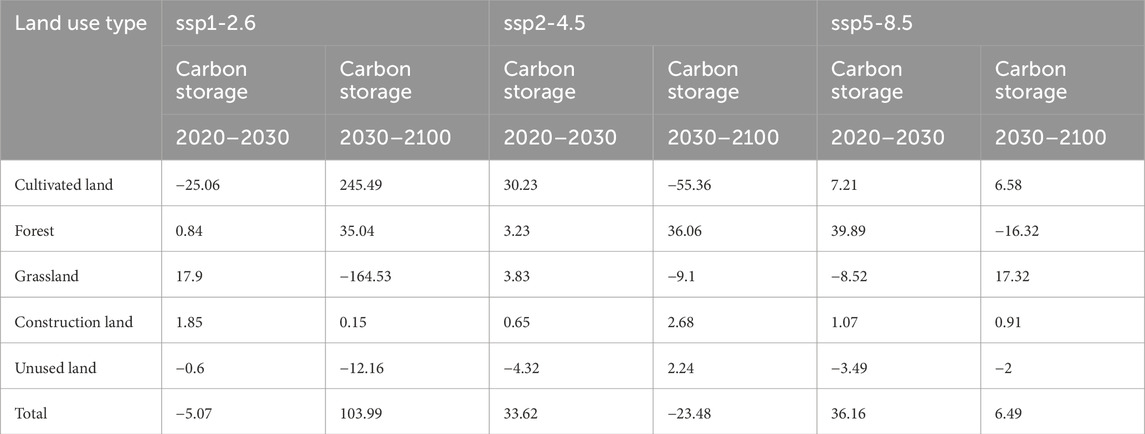
Table 5. Variations in carbon storage in the YRB in 2020–2030 and 2030–2100 under different scenarios (million tons).
Based on carbon storage analysis of the variations during 2020–2030 and 2030–2100, the results illustrate carbon storage changes under both SSPs-RCPs scenarios (Figure 9). Changes during 2020–2030 were notably smaller than those in 2030–2100. Regions with increasing carbon storage were concentrated primarily in the Ordos Basin and western Hetao Plain, while the Qinghai-Tibet Plateau showed declines. Under SSP2-4.5, carbon storage changes occurred mainly north of the Helan Mountains, increasing from 2020 to 2030 but decreasing from 2030 to 2100. Under SSP5-8.5, basin-wide carbon storage increased in both periods; however, changes during 2020–2030 were spatially sporadic, whereas those during 2030–2100 were predominantly concentrated north of the Helan Mountains.
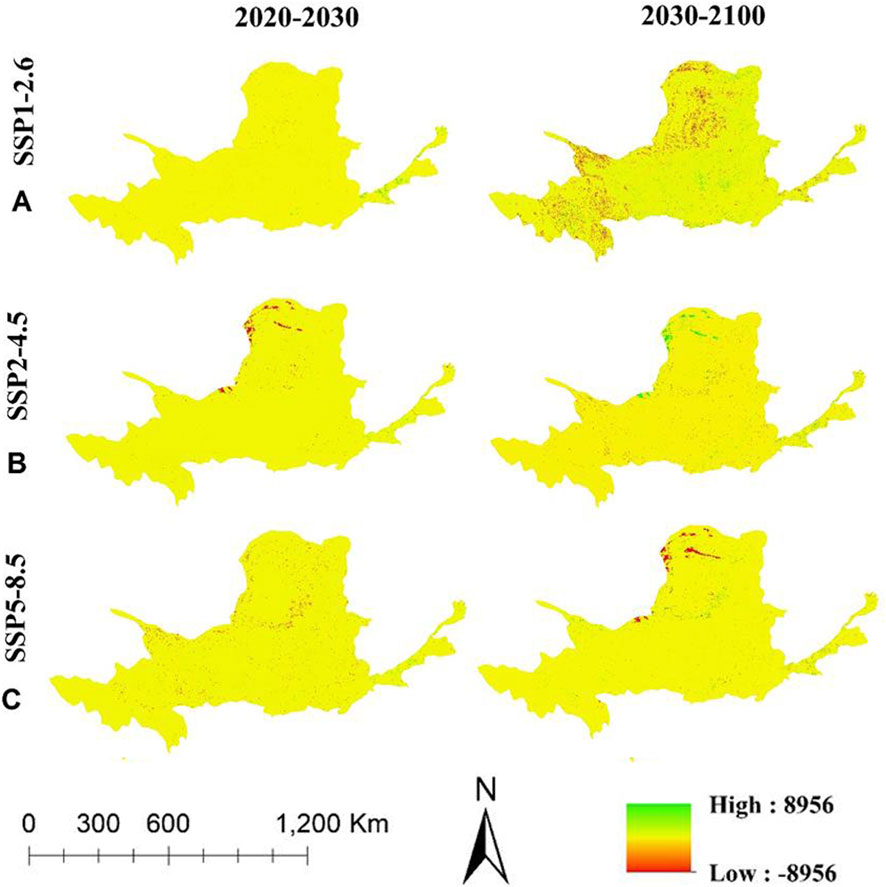
Figure 9. Variations in carbon storage of YR from 2020–2030 and 2030–2100 under SSP1-2.6 (A), SSP2-4.5 (B), SSP5-8.5 (C).
4 Discussion
The investigation of spatial-temporal variations in carbon storage within terrestrial ecosystems has become a hot topic. Due to the different carbon densities associated with different land-use types, variations in carbon storage across land-use patterns are inevitable. By integrating PLUS and INVEST models, we used the future land-use projections to evaluate carbon storage and its variations under multiple scenarios. The main innovation of this study lies in the integrated application of the PLUS and InVEST models to simulate and assess the spatiotemporal dynamics of carbon storage in the Yellow River Basin from 1980 to 2100 under multiple SSP-RCP scenarios. This long-term, multi-scenario, and spatially explicit approach provides a scientific basis for formulating targeted land-use policies and carbon sink enhancement strategies in the basin. A trend of initial decline followed by an increase in the total carbon storage of the YRB was observed from 1980 to 2020, with the transition point identified in 2000, which is alignment with the research of Tian et al. (2022). The results also showed that the total carbon storage value of the YRB was the highest under SSP1-2.6. This indicated that ecological protection measures contributed to increased carbon storage and enhanced regional carbon balance, aligning with the findings of Yang et al. (2021). It is because terrestrial ecosystems are the world‘s largest carbon pools (KROGH et al., 2003), including forests, wetlands, and grasslands, which have greater storage capacity than other ecosystems (PAGIOLA, 2008). Therefore, in order to implement land-use controls for regional low-carbon development and ecological environment protection, the YRB should prioritize increasing the coverage area of forest land, and grassland. This can be achieved through measures such as developing underutilized land and restoring degraded ecological land.
Although we concluded that the future YRB reached the highest value of carbon storage under SSP1-2.6, sustainable societal development necessitates a balance between ecological sustainability and productivity under policy regulation. The SSP2-4.5 scenario resulted in a net carbon storage loss, whereas a slight net gain was observed under the SSP5-8.5 scenario. Under the competitive land-use conditions of SSP5-8.5, the net carbon gain is primarily attributable to the expansion of grassland and cropland, which collectively form the dominant land classes (over 73% of the basin area) and major carbon pools in the region. Modelling the future carbon storage in the basin heavily relied on the accuracy of the projected land-use data of the YRB. However, there was a great deal of uncertainty in the land-use data due to the very large number of factors including not only the natural and anthropogenic influences, but also their interactions. Furthermore, since the models and scenarios for predicting future land data were based on global-scale, the process of downscaling to the Chinese region would also increase the uncertainty of land change risk assessment. There is a situation where the water body area remains unchanged in the LUH2 data, and we cannot solve this problem. However, since the impact of water body area on carbon storage is very small, we believe that the research results are still reliable. Subsequently, the Global Change Analysis Model will be adopted to simulate the land use status of different SSP scenarios.
The carbon density utilized in this research was derived by adjusting the previous research, using research area-specific meteorological data (Yang J et al., 2021). This region-specific adjustment significantly improved the accuracy of carbon storage estimates compared to the use of national-level averages, providing a more reliable basis for spatial-temporal analysis. Additionally, the long-term projection from 1980 to 2100 under multiple scenarios represents a substantial temporal extension beyond most existing studies, offering deeper insights into the historical and future carbon dynamics of the basin. It is important to note that the InVEST model calculates carbon storage as static stocks based on land cover classes and does not simulate dynamic processes such as net sequestration fluxes, age structure, disturbances (e.g., fires), land management practices, or productivity. While these factors influence carbon dynamics, the primary aim of this study was to project long-term, multi-scenario changes in carbon storage at the basin scale rather than to quantify the drivers behind these changes. This study did not include a formal sensitivity analysis of the model parameters (e.g., neighbourhood weights, conversion rules) or a comparison with other simulation models (e.g., CA-Markov, FLUS).
We analyzed spatial-temporal distribution of land-use types in the YRB during 2030–2100 and, more importantly, simulated the future carbon storage using InVEST model, conducting spatiotemporal analyses of the results. In terms of modelling, carbon storage was estimated based on land-use types, which simplifying the specific process of carbon cycle and introducing inherent uncertainties (Yue et al., 2023). Furthermore, the InVEST model’s estimation of carbon storage relied on the analysis of extensive land-use changes, ignoring some crucial indicators for carbon sequestration, such as photosynthetic rate and soil microbial activity, etc. Its carbon module failed to account for variations in carbon sequestration capacity resulting from differences in land-use internal structure and vegetation cover age. This oversight introduced to errors in the spatial distribution of carbon storage, leading to uncertainty in obtained results (Yang et al., 2021). Additionally, the carbon density parameters applied are mean values, and confidence intervals or probabilistic uncertainty analyses were not conducted. Future studies would benefit from incorporating such uncertainty quantification. In the follow-up study, we will also consider the interactions among different factors, along with the effects of the internal structure of land-use and age of vegetation on the model.
5 Conclusion
In this study, LUH2 and historical land-use data (1980–2020) were utilized to simulate future land use in the Yellow River Basin (YRB) for 2030–2100 using the PLUS model. Subsequently, the InVEST model was applied to calculate the carbon storage of the YRB from 1980 to 2100. The spatial-temporal characteristics of both land-use change and carbon storage in the YRB under different scenarios were analyzed for the historical (1980–2020) and future (2030–2100) periods.
1. Carbon storage in the YRB decreased spatially from the southeast to northwest between 1980 and 2020. Specifically, carbon storage value in the Ordos Basin and its western regions was comparatively lower.
2. In the simulation results of land-use change in the YRB from 2030 to 2100 under different scenarios, the land-use types in descending order were grassland, cultivated land, forest land, unused land, construction land, and water. However, the proportional distribution of these land-use types varied significantly between scenarios.
3. Carbon storage in SSP1-2.6 was projected to increase by 103.99 million tons between 2030 and 2100. Similarly, carbon storage in SSP5-8.5 was projected to increase by 6.49 million tons during the same period. In contrast, a loss of 23.48 million tons was projected under the SSP2-4.5 scenario.
4. Spatial-temporal distribution of carbon storage in the YRB from 2030 to 2100, as projected under various scenarios, exhibited a relatively consistent pattern, with a general decrease observed from the southeast to the northwest.
In summary, our research revealed the spatiotemporal variation of the YRB’s carbon storage from 1980 to 2100. The extended temporal scale and basin-wide perspective provide a scientific basis for optimizing land-use structure and informing macro-level land management policies within the basin.
Data availability statement
The raw data supporting the conclusions of this article will be made available by the authors, without undue reservation.
Author contributions
ZC: Conceptualization, Writing – original draft, Writing – review and editing. JW: Conceptualization, Writing – original draft, Writing – review and editing. XX: Data curation, Formal Analysis, Writing – original draft, Writing – review and editing. JJ: Data curation, Formal Analysis, Writing – original draft, Writing – review and editing. JW: Data curation, Formal Analysis, Writing – original draft, Writing – review and editing. SC: Data curation, Formal Analysis, Writing – original draft, Writing – review and editing. JL: Data curation, Formal Analysis, Writing – original draft, Writing – review and editing. SZ: Data curation, Formal Analysis, Writing – original draft, Writing – review and editing. GJ: Data curation, Formal Analysis, Writing – original draft, Writing – review and editing. BQ: Conceptualization, Writing – original draft, Writing – review and editing.
Funding
The authors declare that financial support was received for the research and/or publication of this article. This research was funded by Key Laboratory of Surveying and Mapping Science and Geospatial Information Technology of MNR (20230505), Jiujiang Municipal Science and Technology Program (2025_001334), Young Talent Project of GDAS (2023GDASQNRC-0217), GDAS’ Project of Science and Technology Development (2024GDASZH-2024010102), Science and Technology Program of Guangdong Province (2021B1212100003), Natural Science Research Funds of Nanyang Normal University (2025ZX004), and Nanyang Science and Technology Plan Project (24JCQY022).
Conflict of interest
The authors declare that the research was conducted in the absence of any commercial or financial relationships that could be construed as a potential conflict of interest.
Generative AI statement
The authors declare that no Generative AI was used in the creation of this manuscript.
Any alternative text (alt text) provided alongside figures in this article has been generated by Frontiers with the support of artificial intelligence and reasonable efforts have been made to ensure accuracy, including review by the authors wherever possible. If you identify any issues, please contact us.
Publisher’s note
All claims expressed in this article are solely those of the authors and do not necessarily represent those of their affiliated organizations, or those of the publisher, the editors and the reviewers. Any product that may be evaluated in this article, or claim that may be made by its manufacturer, is not guaranteed or endorsed by the publisher.
References
Barbier, E. B. (2014). Climate change mitigation policies and poverty. Wiley Interdiscip. Rev. Clim. Change 5 (4), 483–491. doi:10.1002/wcc.281
BP (2021). BP statistical review of world energy (2021). Available online at: https://www.bp.com/en/global/corporate/energy-economics/statistical-review-of-world-energy.html.
Fu, Q., Xu, L. L., Zheng, H. Y., and Chen, J. (2019). Spatiotemporal dynamics of carbon storage in response to urbanization: a case study in the su-xi-chang region, China. Processes 7 (11), 836. doi:10.3390/pr7110836
Guo, S. (2022). Research on the coupling and coordination of ecosystem health and urbanization in the Yellow River Basin. Jiangsu: China University of Mining and Technology. doi:10.27623/d.cnki.gzkyu.2022.000106
Hou, J., Ceng, J., and Zhang, K. (2022). Temporal and spatial variation characteristics of carbon storage in the source region of the Yellow River based on InVEST and GeoSoS-FLUS models and its response to different future scenarios. Environ. Sci. 43 (11), 5253–5262. doi:10.13227/j.hjkx.202201267
Huang, F. (2019). Expert interpretation and seminar on ecological protection and high-quality development of the yellow river basin. People's Yellow River 41 (12), 2.
Huo, J., and Zhao, W. (2021). Suggestions on the green and low-carbon development of modern coal chemical industry in the yellow river basin. Sci. Technol. China (8), 22–24.
Hurtt, G., Zheng, H. Y., and Chen, J. (2016). Harmonization of global land-use change and management for the period 850--2100. Available online at: http://luh.umd.edu/.
Krogh, L., Noergaard, A., Hermansen, M., Greve, M. H., Balstroem, T., and Breuning-Madsen, H. (2003). Preliminary estimates of contemporary soil organic carbon stocks in Denmark using multiple datasets and four scaling-up methods. Agric. Ecosyst. and Environ. 96 (1/3), 19–28. doi:10.1016/s0167-8809(03)00016-1
Li, M. (2023). Research on the impact of urban development on carbon emissions in the Yellow River Basin under the background of Double Carbon policy. Shandong: Shandong Normal University. doi:10.27280/d.cnki.gsdsu.2023.000002
Li, J., Xia, S., and Yu, X. (2020). Evaluation of carbon storage on terrestrial ecosystem in Hebei Province based on InVEST model. J. Ecol. Rural Environ. 36 (7), 854–861. doi:10.19741/j.issn.1673-4831.2019.0918
Liao, W., Liu, X., Xu, X., Chen, G., Liang, X., Zhang, H., et al. (2020). Projections of land use changes under the plant functional type classification in different SSP-RCP scenarios in China. Sci. Bull. 65 (22), 1935–1947. doi:10.1016/j.scib.2020.07.014
Moss, R. H., Edmonds, J. A., Hibbard, K. A., Manning, M. R., Rose, S. K., van Vuuren, D. P., et al. (2010). The next generation of scenarios for climate change research and assessment. Nature 463 (7282), 747–756. doi:10.1038/nature08823
O’Neill, B. C., Kriegler, E., Riahi, K., Ebi, K. L., Hallegatte, S., Carter, T. R., et al. (2014). A new scenario framework for climate change research: the concept of shared socioeconomic pathways. Clim. Change 122, 387–400. doi:10.1007/s10584-013-0905-2
O’Neill, C., Brian, C., Kriegler, E., Ebi, K. L., Riahi, K., Rothman, D. S., et al. (2017). The roads ahead: narratives for shared socioeconomic pathways describing world futures in the 21st century. Glob. Environ. Change 42, 169–180. doi:10.1016/j.gloenvcha.2015.01.004
Pagiola, S. (2008). Payments for environmental services in Costa Rica. Ecol. Econ. 65 (4), 712–724. doi:10.1016/j.ecolecon.2007.07.033
Qi, Z., Guanshi, Z., Xiu, Z., Liu, D., Fang, R., Dong, N., et al. (2023). Future of carbon storage in the yangtze river basin, China under alternative climate and land-use pathways. Ecosyst. Health Sustain 9, 0085. doi:10.34133/ehs.0085
Qi, Q., Xu, Z., and Li, N. (2023). Spatio-temporal distribution pattern and influencing factors of carbon emission in the Yellow River Basin. Environ. Pollut. Prev. 45 (04), 577–582. doi:10.15985/j.cnki.1001-3865.2023.04.023
Riahi, K., Van Vuuren, D. P., Kriegler, E., Edmonds, J., O’Neill, B. C., Fujimori, S., et al. (2017). The shared socioeconomic pathways and their energy, land use, and greenhouse gas emissions implications: an overview. Glob. Environ. Change 42, 153–168. doi:10.1016/j.gloenvcha.2016.05.009
Sarah, W., Schrammeijer, E. A., Schulp, C. J. E., and Verburg, P. H. (2018). Meeting global land restoration and protection targets: what would the world look like in 2050. Glob. Environ. Change 52, 259–272. doi:10.1016/j.gloenvcha.2018.08.002
Stehfest, E., Jan van Zeist, W., Valin, H., Havlik, P., Popp, A., Kyle, P., et al. (2019). Key determinants of global land-use projections. Nat. Commun. 10, 2166. doi:10.1038/s41467-019-09945-w
Sun, B., Du, J., Chong, F., Li, L., Zhu, X., Zhai, G., et al. (2023). Spatio-temporal variation and prediction of carbon storage in terrestrial ecosystems in the yellow river basin. Remote Sens. 15, 3866. doi:10.3390/rs15153866
Thomson, A. M., Kyle, G. P., Zhang, X., Bandaru, V., Wise, M., et al. (2014). The contribution of future agricultural trends in the US midwest to global climate change mitigation. Glob. Environ. Change 24, 143–154. doi:10.1016/j.gloenvcha.2013.11.019
Tian, M., Chen, Z., Wang, W., Chen, T., and Cui, H. (2022). Land-use carbon emissions in the yellow river basin from 2000 to 2020: spatio-temporal patterns and driving mechanisms. Int. J. Environ. Res. Public Health 19 (24), 16507. doi:10.3390/ijerph192416507
Van Vuuren, D., Riahi, K., Moss, R., Edmonds, J., Thomson, A., Nakicenovic, N., et al. (2012). A proposal for a new scenario framework to support research and assessment in different climate research communities. Glob. Environ. Change 22 (1), 21–35. doi:10.1016/j.gloenvcha.2011.08.002
Van Vuuren, D. P., Kriegler, E., O’Neill, B. C., Ebi, K. L., Riahi, K., Carter, T. R., et al. (2014). A new scenario framework for climate change research: scenario matrix architecture. Clim. Change 122, 373–386. doi:10.1007/s10584-013-0906-1
Wang, Y., Wang, A., Zhai, J., Tao, H., Jiang, T., Su, B., et al. (2019). Tens of thousands additional deaths annually in cities of China between 1.5 °C and 2.0 °C warming. Nat. Commun. 10, 3376. doi:10.1038/s41467-019-11283-w
Wang, J., Li, L., Li, Q., Wang, S., Liu, X., and Li, Y. (2022). The spatiotemporal evolution and prediction of carbon storage in the yellow river basin based on the major function-oriented zone planning. Sustainability 14 (13), 7963. doi:10.3390/su14137963
West, T. O., Le Page, Y., Huang, M., Wolf, J., and Thomson, A. M. (2014). Downscaling global land cover projections from an integrated assessment model for use in regional analyses: results and evaluation for the US from 2005 to 2095. Environ. Res. Lett. 9 (6), 064004. doi:10.1088/1748-9326/9/6/064004
Wu, H., Yang, Y., and Li, W. (2023). Analysis of spatiotemporal evolution characteristics and peak forecast of provincial carbon emissions under the dual carbon goal: considering nine provinces in the yellow river basin of China as an example. Atmos. Pollut. Res. 14, 101828. doi:10.1016/j.apr.2023.101828
Xiang, S., Zhang, Q., Wang, D., Wang, S., Wang, Z. F., Xie, Y. Q., et al. (2022). Response and vulnerability analysis of carbon storage to LUCC in the main urban area of chongqing during 2000-2020. J. Nat. Resour. 37 (5), 1198–1213. doi:10.31497/zrzyxb.20220507
Xu, C., Zhang, Q., Yu, Q., Wang, J., Wang, F., Qiu, S., et al. (2023). Effects of land use/cover change on carbon storage between 2000 and 2040 in the yellow river basin, China. Ecol. Indic. 151, 110345. doi:10.1016/j.ecolind.2023.110345
Yang, J., Xie, B., and Zhang, D. (2021). Spatio-temporal evolution of carbon stocks in the Yellow River Basin based on InVEST and CA-Markov models. Chin. J. Ecol. Agric. 29 (06), 1018–1029. doi:10.13930/j.cnki.cjea.200746
Yue, S., Ji, G., Chen, W., Huang, J., Guo, Y., and Cheng, M. (2023). Spatial and temporal variability characteristics of future carbon stocks in Anhui province under different SSP scenarios based on PLUS and InVEST models. Land 12 (9), 1668. doi:10.3390/land12091668
Zhang, J. (2023). Spatiotemporal variations, influencing factors and peak prediction of carbon emissions in 9 provinces (regions) of the Yellow River Basin. Shanxi: Shanxi University of Finance and Economics. doi:10.27283/d.cnki.gsxcc.2023.001300
Keywords: carbon storage, PLUS model, InVEST model, Yellow River Basin, terrestrial ecosystem
Citation: Chang Z, Wang J, Xiong X, Jiang J, Wu J, Chen S, Li J, Zhang S, Ji G and Qian B (2025) Integrating PLUS and InVEST model to project carbon dynamics in China’s yellow river basin under multi-scenarios (1980–2100). Front. Earth Sci. 13:1684333. doi: 10.3389/feart.2025.1684333
Received: 12 August 2025; Accepted: 31 October 2025;
Published: 17 November 2025.
Edited by:
Cicheng Zhang, Hunan Normal University, ChinaReviewed by:
Raul Manuel Costa Alves, Camra Municipal de Machico, PortugalFangzhong Shi, Beijing Normal University, China
Copyright © 2025 Chang, Wang, Xiong, Jiang, Wu, Chen, Li, Zhang, Ji and Qian. This is an open-access article distributed under the terms of the Creative Commons Attribution License (CC BY). The use, distribution or reproduction in other forums is permitted, provided the original author(s) and the copyright owner(s) are credited and that the original publication in this journal is cited, in accordance with accepted academic practice. No use, distribution or reproduction is permitted which does not comply with these terms.
*Correspondence: Jiaming Wang, d2FuZ2ptZWNvbG9neUAxNjMuY29t; Baowei Qian, cWlhbmJhb3dlaTIwMjJAMTYzLmNvbQ==