 Lanying Huang
 Yuhao Jin1*
 Shuo Yang
- 1School of Civil Engineering, Xuzhou University of Technology, Xuzhou, China
- 2College of Geoexploration Science and Technology, Jilin University, Changchun, China
Conventional seismic advanced detection methods suffer from relatively low lateral resolution and symmetry artifacts in imaging results due to their narrow-azimuth observation systems. To fundamentally solve this problem, starting from a wide-azimuth perspective, constructing a reasonable wide-azimuth observation system is crucial for breaking through the bottleneck of traditional methods. Accordingly, this research investigates wide-azimuth detection utilizing a CO2-concentrated source through theoretical analysis, three-dimensional numerical simulation, and physical analysis. The research results indicate that: (1) Studies establish that the dominant excitation direction for channel wave advanced detection using concentrated force sources is horizontal and perpendicular to the tunnel axis (typically designated the Y direction). The CO2 source controls the excitation direction by adjusting the outlet of the pressure relief head, achieving directional excitation of the concentrated force source. To further identify the seismic wavefield characteristics of this Y-direction concentrated force source, mechanical mechanisms and three-dimensional numerical simulations were adopted. These analyses examined amplitude differences of multi-component P-waves, S-waves, and channel waves across various directions under Y-direction excitation in both homogeneous models and coal-rock-coal models, thereby uncovering the developmental mechanism of channel waves at coal seam interfaces. (2) Based on the Y-direction concentrated force source, a study was conducted on the characteristics of a wide-azimuth three-dimensional three-component seismic wavefield. The reflected trough waves had a large time interval and clear wavefronts compared to other wavefronts in the time domain. The signal-to-noise ratio of seismic records in the Y component is higher than that in the X and Z components, and the reflected trough wave is a characteristic wave for fault detection. (3) The migration processing is carried out using fault characteristic waves. Compared with the narrow-azimuth observation systems, the wide-azimuth observation systems can effectively eliminate symmetry artifacts, further verifying the effectiveness of the method. Comparative experiments were conducted between CO2 seismic sources and explosive seismic sources to further assess the effectiveness of the CO2 source. The frequency spectrum of the CO2 source closely resembles that of the explosive source, with the CO2 source richly exciting high-frequency seismic signals.
1 Introduction
The tunnel serves as the critical pathway for both production and safety in mining operations. Annually, newly excavated tunnels in China’s coal mines cumulatively exceed a staggering length of 12,000 km. However, the coal tunnel excavation stage is a high-risk area for accidents, where faults constitute key hidden disaster triggers (Wang et al., 2022; Zeng et al., 2023). Mine seismic detection offers significant advantages, including proximity to the target and reduced interference along seismic wave propagation paths, alongside characteristics such as seismic wave energy and high-frequency component attenuation, and high resolution (Cheng et al., 2014; Wang et al., 2020). Therefore, the advanced detection of coal roadway faults often uses seismic waves. Intelligent and precise mining of coal safety is a development trend (Peng, 2020); therefore, advanced fault detection is a major requirement to ensure the basic energy mining of coal.
Seismic advanced detection methods mainly include reflection body wave (Li et al., 2017; Liu et al., 2018), reflection channel wave (Yang et al., 2016), among others (Wang et al., 2020). Reflected body wave advanced detection boasts a long detection range and is well-suited for identifying large-scale fault structures (Zhang et al., 2023; Li et al., 2014), having demonstrated successful application in tunnel engineering (Lu et al., 2020; Wang and Huang, 2022). However, the advanced detection of coal roadway is affected by the channel wave of coal seam, which leads to the poor applicability of the relatively mature tunnel reflector wave advanced detection technology in roadway (Cheng et al., 2014). Reflected in-seam wave advanced detection involves deploying the excitation-receiving system within a single roadway and utilizing reflected signals carried by channel waves propagating along the coal seam to detect faults ahead of the working face. Essen et al. (2007) analyzed the characteristics of in-seam waves in the front geological structure under roadway conditions through numerical simulation. Ji et al. (2012) studied the dispersion characteristics of channel waves under the condition of advanced detection in the roadway. Yang and Cheng (2012), Yang et al. (2016) numerically simulated the seismic wave field of faults in coal roadway, and they found that the reflected in-seam wave is the characteristic wave of faults in front. Jiang et al. (2018) verified the feasibility of the TVSP advanced detection method based on channel waves through theoretical and numerical simulations. Ji et al. (2018) studied the polarization characteristics of fault three-component in-seam wave through numerical simulation, proposing an in-seam wave polarization migration method. However, these conventional seismic advanced detection techniques are constrained by the limitations of narrow-azimuth observation systems. This narrow-azimuth configuration inherently causes a loss of directional resolution in reflected wave imaging, resulting in symmetrical artifacts within migration imaging results.
Constructing a well-designed wide-azimuth observation system holds promise for overcoming this technical bottleneck. While increasing explosive excitation drilling depth is theoretically feasible, its implementation severely disrupts roadway excavation, rendering it impractical. The explosive source is subject to strict explosive control and high gas mine conditions. In addition, common mine seismic sources include hammering seismic source, detonator seismic source, tamping seismic source, shearer seismic source, Tunnel boring machine seismic source (Li et al., 2023), CO2 phase change seismic source (Wang et al., 2020), belt conveyor seismic source, etc. Among them, it is a feasible way to use the horizontal deep hole of CO2 phase change fracturing in a permeability-increasing coal seam for seismic detection (Wang et al., 2022). Li et al. (2019) performed a surface comparative test of CO2 sources versus explosive sources. Li et al. (2020) conducted CO2 source excitation and reception experiments, comparing results with an explosive source. CO2 sources can provide a novel artificial excitation source for seismic detection in coalfield high-gas zones. Wang et al. (2021) applied an X-direction CO2 concentrated source for in-plane transmitted channel wave exploration, achieving favorable transmission imaging results. This contrasts with pressure sources (Wu et al., 2017), shear sources, dipole sources, double-couple sources (Vladimir, 2020), and moment tensor sources (Chen, 2015). The seismic wave field excited by the concentrated force source is less disturbed by the roadway, and it is easier to identify the characteristic wave (Jiang et al., 2018). Research indicates that the dominant excitation direction for a concentrated force source in channel wave transmission exploration is parallel to the roadway, whereas in channel wave advanced detection, it is horizontal and perpendicular to the roadway direction (Wang et al., 2021). However, the wide-azimuth seismic advanced detection method based on Y-direction concentrated force source excitation has not been studied, and the wide-azimuth excitation is expected to break through the technical bottleneck of the narrow-azimuth observation system.
Based on this, this paper studies the wide-azimuth detection method based on a CO2 concentrated force source from theoretical analysis, numerical simulation, physical analysis, and field test. First, the response relationship between wide-azimuth observation system parameters and fault dip angle parameters is examined. Second, mechanical mechanisms are applied to analyze amplitude difference characteristics of multi-component P-waves, S-waves, and channel waves in various directions under Y-direction concentrated force excitation, revealing the influence mechanism of the coal seam interface on seismic wave propagation. Subsequently, three-component seismic records and three-dimensional wavefield characteristics under large lateral offset conditions are studied, followed by imaging research employing reflected in-seam waves under different wide-azimuth parameters. Finally, a comparative field study between the CO2 source and an explosive source is conducted.
2 Principles
2.1 Characteristics of the CO2 source system
During roadway tunneling, gas drainage boreholes (30–120 m) are typically drilled into side walls to enhance coal seam permeability via fracturing. CO2 seismic source and roadway geophones form a wide-azimuth observation system, as Figure 1. When the CO2 seismic source is working, liquid CO2 in the tube is quickly converted into high-pressure gaseous CO2. Once the gaseous CO2 pressure surpasses the shearing plate’s control threshold (100–270 MPa), it ruptures the shearing plate and ejects through the outlet of the adjustable pressure relief valve, releasing blasting force that concentrates energy onto the coal seam (Wang et al., 2021). CO2 seismic source meets the need for underground seismic exploration, offering intrinsic safety, wide-azimuth excitation capability, and the advantage of utilizing pre-existing gas drainage boreholes without extra blast hole preparation.
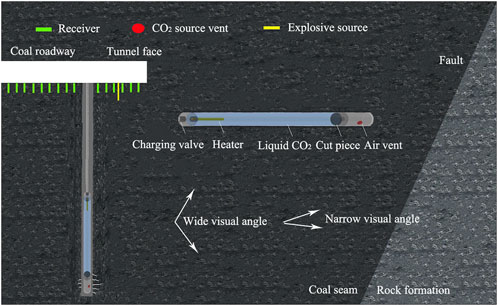
Figure 1. The schematic diagram of deep hole excitation and shallow hole excitation.
2.2 Principle of earthquake advance detection in a wide-azimuth observation system
Figure 2 is a schematic diagram of the detection range under wide-azimuth conditions. When the dip angle of the fault is 90° (as shown in Figure 2A), the effective detection range gradually increases with the increase of lateral offset; the lateral offset distance between the virtual seismic source and the tunnel detection gradually increases, and the effective detection range gradually expands; when the dip angle of the fault is 60° (as shown in Figure 2B), the effective detection range gradually increases with the increase of lateral offset. At a dip angle of 45° (as shown in Figure 2C), the effective detection range undergoes minimal variation despite a continuous lateral offset increase. Conversely, for a 30° dip angle (as shown in Figure 2D), the effective detection range progressively contracts with increasing lateral offset. At 0° dip (as shown in Figure 2E), the effective detection range consistently diminishes as lateral offset distance rises. Comparative analysis reveals that for fault dip angles between 0° and 45°, the effective detection range decreases progressively with lateral offset increase; conversely, for dip angles between 45° and 90°, it increases progressively with lateral offset increase.
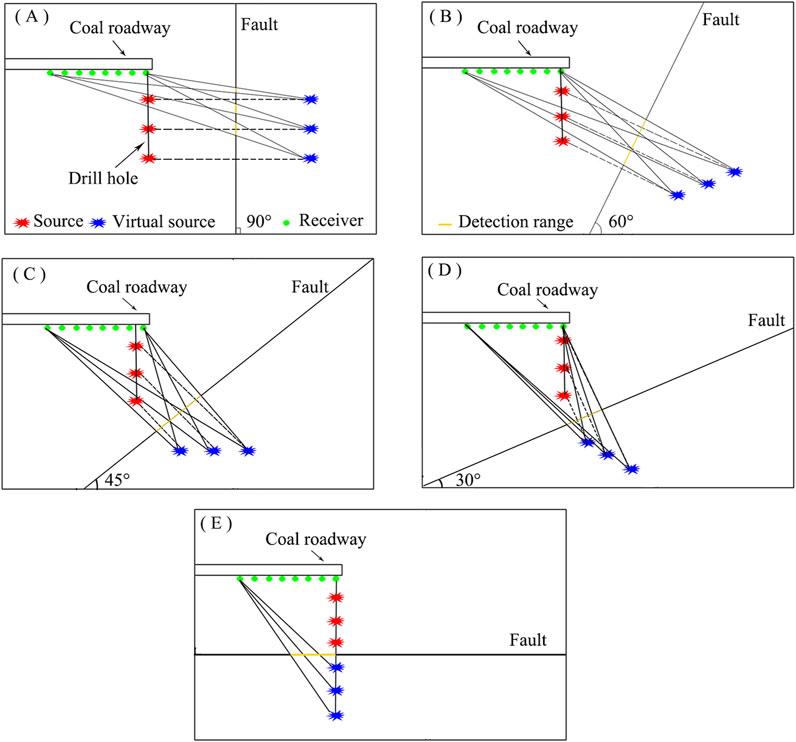
Figure 2. Schematic diagram of the detection range under a wide-azimuth condition; (A) The dip angle of the fault is 90°; (B) The dip angle of the fault is 60°; (C) The dip angle of the fault is 45°; (D) The dip angle of the fault is 30°; (E) The dip angle of the fault is 0°.
2.3 Characteristics of the CO2 source system
Figure 3 is a plan view of wide-azimuth advanced detection. CD is a fault in front of the tunnel, with a dip angle of φ between the fault and the direction of tunnel excavation. BO is a horizontal borehole with a depth of h. We placed the seismic source at point O at the bottom of the horizontal borehole. Place the seismic source at point O and the detector at point S to receive seismic wave signals. Consequently, the reflected wave propagation path traverses from point O, reflects at fault point M, and arrives at detector S.
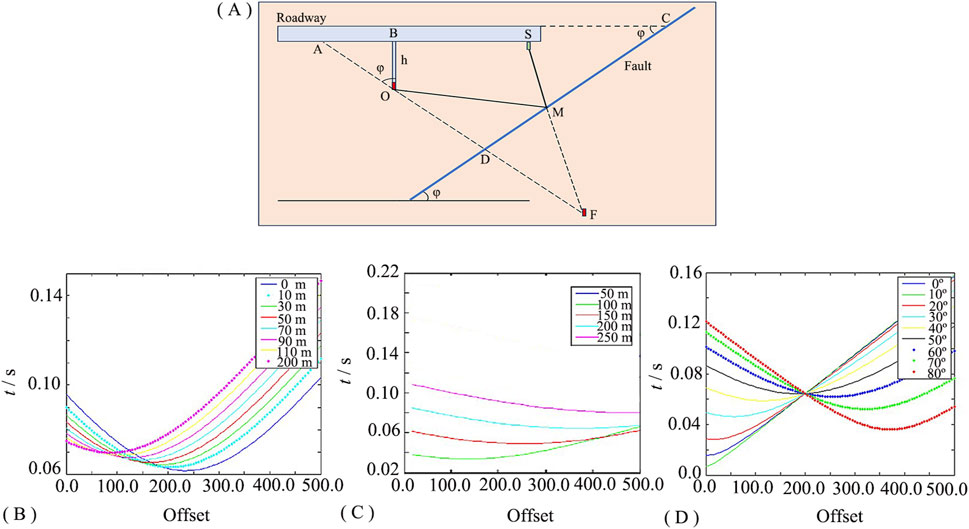
Figure 3. Time distance curve of wide-azimuth observation system; (A) Plan view of wide-azimuth advanced detection; (B) Time distance curves of reflected waves with different lateral offset distances (
BS is the horizontal offset in the direction of tunnel excavation in Figure 3A, with a distance of x, the horizontal distance between BC is L, and the velocity of the surrounding rock is x. Using point O as an auxiliary line, AF is perpendicular to the fault, with a vertical foot of D and M as the reflection point on the fault. According to geometric principles, point F is the mirror point of point O about the fault interface. Therefore, the reflection path OM + SM = SF. According to the cosine theorem, in △ASF:
From geometric relationships, the SF, AS, OD, AF can be written as:
Substituting AS, AF, and SF into Equation 1 yields the travel-time-distance curve equation for the reflected wave:
Analysis of Equation 6 indicates a nonlinear relationship between seismic wave travel time t and surrounding rock velocity v, the dip angle φ of the formation, the lateral offset h, the offset x, and the distance L between the fault and the borehole in the horizontal direction. Firstly, assuming that the angle between the tunnel and the fault interface is 50°, and the distance between the fault location and the deep hole in the horizontal direction of the tunnel is 200 m, the time distance curves for different lateral offset distances are shown in Figure 3B, with offset distances set to 0 m, 10 m, 30 m, 50 m, 70 m, 90 m, and 110 m, respectively. The figure demonstrates that under constant conditions, larger lateral offsets correspond to smaller time intervals on the curve, effectively mitigating symmetry artifacts. Second, assuming a tunnel-fault angle of 50° and lateral offset of 50 m, Figure 3C illustrates time-distance curves for horizontal fault-blast hole distances of 50 m, 100 m, 150 m, 200 m, and 250 m, respectively. As can be seen from the figure, under other constant conditions, the farther the horizontal distance between the detector and the fault, the greater the difference in time on the time distance curve; finally, the distance between the fault and the borehole in the direction of the tunnel is set to 200 m, with a lateral offset of 50 m. The time distance curves at different inclinations are shown in Figure 3D, with inclinations set to 0°, 10°, 20°, 30°, 40°, 50°, 60°, 70°, and 80°, respectively. These curves intersect at a point where offset x equals the horizontal tunnel-direction fault-borehole distance L. Structures with larger dip angles exhibit more pronounced hyperbolic time characteristics, significantly enhancing lateral resolution.
The time distance curve of the wide azimuth observation system does not have the same value in time under high inclination angles (angles greater than 50 degrees); therefore, this observation system can fundamentally eliminate the problem of pile-up artifacts under narrow azimuth conditions. The research results in Chapter 2.2 indicate that when the fault dip angle is between 45 ° and 90 °, the effective detection range gradually increases with the increase of lateral offset. Given that faults ahead of coal roadways typically exhibit high-dip characteristics, wide-azimuth advanced detection is theoretically well-suited for identifying high-dip faults.
3 Mechanical mechanism analysis and three-dimensional wave field characteristics of the Y-direction concentrated force source
Research has established that the dominant excitation direction for trough wave transmission exploration of concentrated force sources is parallel to the tunnel direction (X direction), while for advanced detection, it is horizontal and perpendicular (Y direction) (Wang et al., 2021). Therefore, we analyzed the mechanical mechanism and three-dimensional wave field characteristics of the Y-direction concentrated force source.
3.1 Wavefield snapshot and mechanical mechanism analysis under uniform medium conditions
To simulate the seismic wavefield characteristics excited by CO2 sources, a concentrated force source serves as an approximation. A uniform medium model was employed with P-wave velocity 35.00 m/s and S-wave velocity 1700 m/s. The three-dimensional model was a cube with a side length of 300 m, and the model grid size was 0.2 m. We used the spatiotemporal high-order finite difference method for research (as shown in Supplementary Appendix A), with a source frequency of 150 Hz, excitation positions at (150 m, 150 m, 150 m), and a sampling frequency of 10 kHz.
Figure 4 shows a wavefield snapshot of the Y-direction concentrated force source under uniform medium conditions at 40 ms. Figures 4A–C show snapshots of the wavefield for the X, Y, and Z components, respectively. Wavefront 1 represents the P-wave; Wavefront 2 represents the S-wave. Observations indicate P-wave and S-wave energy on the XOZ and YOZ planes perpendicular to the center in the X-component. In the Y-component, the P-wave lacks energy on the XOZ plane, while the S-wave lacks energy along the Y-direction on the XOY and YOZ planes. The Z-component exhibits P-wave and S-wave energy absence on the XOY and XOZ planes.
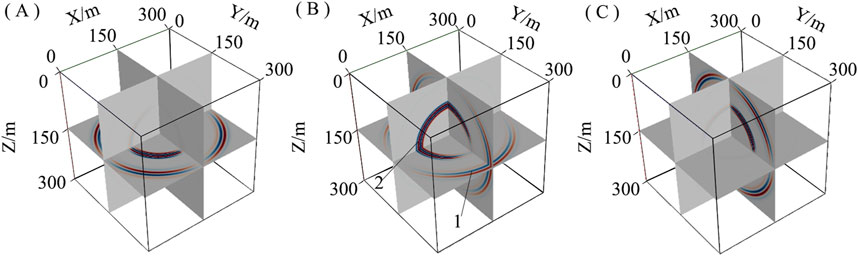
Figure 4. A snapshot of a three-dimensional three-component wavefield: (A) X component; (B) Y component; (C) Z component.
Based on the loading method of the seismic source force, a physical analysis is conducted using a uniform model as the background condition to analyze the mechanical characteristics of the Y-direction concentrated force source. Figure 5A illustrates the mechanism: P-waves (longitudinal) have particle vibration parallel to propagation; S-waves (transverse) have perpendicular vibration, further classified in 3D as SV-waves (vibration in plane perpendicular to propagation) and SH-waves (vibration in plane parallel to propagation).
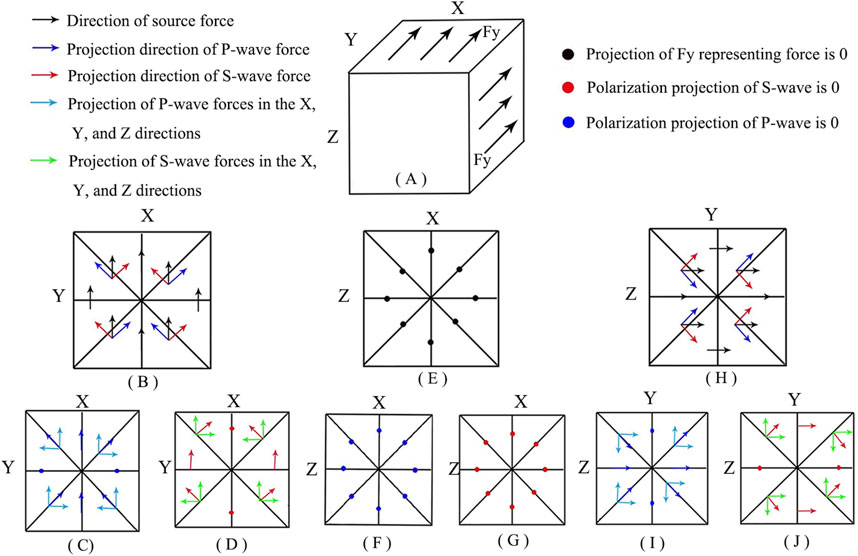
Figure 5. Physical analysis diagram of unidirectional concentrated force source in the Y direction; (A) Schematic diagram of mechanical model; (B) Schematic diagram of mechanical decomposition on XOY surface; (C) The polarization direction of longitudinal waves is decomposed along the X and Y components; (D) The polarization direction of transverse waves is decomposed along the X and Y components; (E) Schematic diagram of mechanical decomposition on XOZ surface; (F) The polarization direction of longitudinal waves is decomposed along the X and Z components; (G) The polarization direction of transverse waves is decomposed along the X and Z components; (H) Schematic diagram of mechanical decomposition on YOZ surface; (I) The polarization direction of longitudinal waves is decomposed along the Y and Z components; (J) The polarization direction of transverse waves is decomposed along the Y and Z components.
On the XOY plane, the source force is decomposed along the polarization direction of longitudinal waves and transverse waves according to the propagation direction of seismic waves (as shown in Figure 5B). The P-wave polarization force is projected onto X and Y components (Figure 5C); simultaneously, the S-wave polarization force is projected onto X and Y components (Figure 5D). On the X-component’s XOY plane, force projections along seismic propagation and vertical directions at the source position are 0 in X and Y, resulting in absent P-wave and S-wave amplitudes along these directions at the source; non-0 projections elsewhere yield non-0 amplitudes. On the XOY plane of the Y component, the projection value of the force perpendicular to the source position in the Y direction along the direction of seismic wave propagation is the highest, resulting in the strongest amplitude for longitudinal waves in this direction. Conversely, the projection value of the force along the propagation direction in the Y direction is zero, leading to the absence of longitudinal wave amplitude in that direction. However, the projection values of the force along the propagation direction in other directions are not zero, which means the longitudinal wave amplitude is not absent, but it is weaker compared to that in the Y direction. On the other hand, in the X direction, the projection value of the force perpendicular to the propagation direction is the largest, which results in the transverse wave having the strongest amplitude in that direction. The projection value of the force perpendicular to the propagation direction in the Y direction is zero, leading to the absence of transverse wave amplitude in that direction. Nevertheless, the projection values of the force perpendicular to the propagation direction in other directions are non-zero, meaning the transverse wave amplitude is not absent, but it is weaker than the transverse wave amplitude in the X direction. On the XOZ plane of the Z component, due to the zero projection values of the Z component along the direction of seismic wave propagation and vertical force on the XOY plane, the seismic wave amplitude on the XOY plane of the Z component is missing.
On the XOZ plane, the projection value of the force along the direction of seismic wave propagation is 0 (Figures 5E–G), therefore the longitudinal wave amplitudes on both the X and Z components are missing; The projection of force on the X and Z components along the direction perpendicular to the propagation of seismic waves is 0. Therefore, the amplitude of the X and Z components is missing on the XOZ plane perpendicular to the source position. However, equivalent to shear force loading on XOZ, the Y-component exhibits a strong S-wave amplitude without directional absence.
On the YOZ plane, decompose the source force along the polarization direction of longitudinal waves and transverse waves (as shown in Figure 5H); Then project the force in the longitudinal polarization direction along the Y and Z components, as shown in Figure 5I; Simultaneously project the force in the transverse wave polarization direction along the Y and Z components, as shown in Figure 5J.On the YOZ plane of the X component, because the projection values of the X component along the direction of seismic wave propagation and vertical force on the YOZ plane are 0, the amplitude of seismic waves on the YOZ plane of the X component is missing; on the Y-component’s YOZ plane, the force projection along propagation in Y at the source is maximal, producing the strongest P-wave amplitude; the projection along Z is 0, causing absent P-wave amplitude (weaker non-0 elsewhere). The force projection perpendicular to propagation along Z is maximal, generating the strongest S-wave amplitude along Z; the projection along X is 0, causing an absent S-wave amplitude (weaker non-0 elsewhere).
3.2 Three-dimensional wavefield characteristics of concentrated force source in the Y direction
To further reveal the channel wave development mechanism of the concentrated force source in the coal-rock-coal model, a layered three-dimensional model of “rock-coal-rock” was designed, and a three-dimensional spatial coordinate system was established as shown in Figure 6A. Figure 6B is a sectional view, and the cubic model (side 300 m, grid 0.2 m) features a coal seam center at Z = 150 m (thickness 5 m). Table 1 lists elastic parameters. The source was positioned at (150 m, 150 m, 150 m) within the coal seam. Two receiver lines were deployed in the seam: Line 1 of 15 detectors, with the first detector located at (80 m, 80 m, 150 m) and the 15th detector located at (220 m, 80 m, 150 m), with a track spacing of 10 m; Line 2 from 80 m, 80 m, 150 m–80 m, 220 m, 150 m, both perpendicular to each other. The schematic diagram is shown in Figure 6C, with a source frequency of 150 Hz and a sampling frequency of 10 kHz.
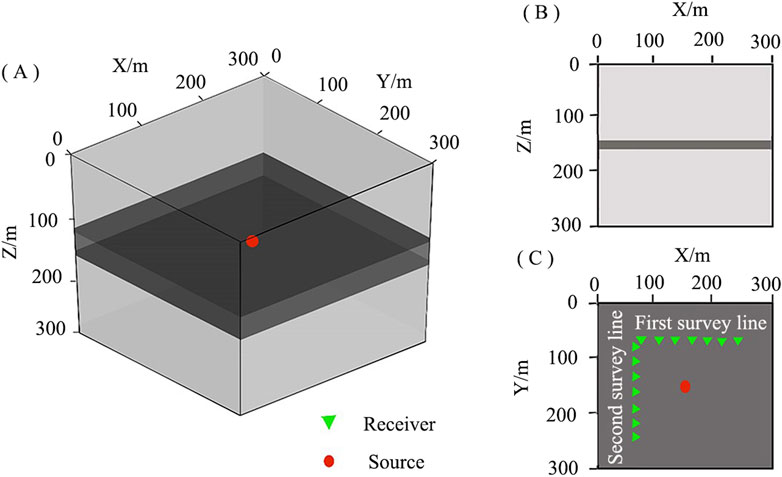
Figure 6. Schematic diagram of the model; (A) 3D model; (B) Sectional view; (C) Plan view.
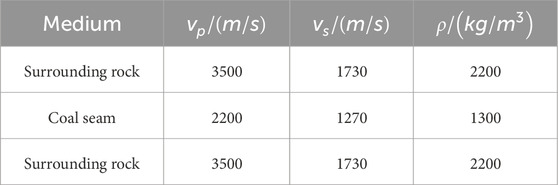
Table 1. Model parameters.
Figure 7 shows a three-component wavefield snapshot and seismic records of the concentrated force source in the Y direction. Figures 7A–C are wavefield snapshots of the X, Y, and Z components at a time of 40 ms, respectively. Among them, the wavefront 1 is a refracted longitudinal wave, the wavefront 2 is a mixed wave train of refracted transverse waves and converted refracted transverse waves, the wavefront 3 is a channel wave, the wavefront 4 is a transmitted longitudinal wave, the wavefront 5 is a transmitted converted transverse wave, and the wavefront 6 is a mixed wave train formed by the transmission converted transverse waves and the transmission transverse waves mixed at the coal seam interface. From the figure, it can be seen that in the X component, the energy of longitudinal and transverse waves is missing on the XOZ and YOZ planes perpendicular to the center position. These waves are missing due to the absence of wave conversion along the source position. Therefore, under coal seam conditions, various types of longitudinal and transverse waves are missing in amplitude and cannot interfere to form channel waves. As a result, the amplitude of slot waves is absent in both planes. In the Y component, longitudinal waves exhibit energy attenuation in the XOZ plane perpendicular to the center position, while transverse waves exhibit energy attenuation along the X direction in the XOY and YOZ planes perpendicular to the center position; the amplitude of refracted transverse waves along the Y direction of the earthquake source is not missing, because the refracted longitudinal waves convert at the top and bottom plate interfaces to produce converted refracted transverse waves, which compensate for the amplitude loss under uniform medium conditions; strongest refracted S-wave energy along X produces the strongest channel wave energy via interference, establishing it as the source’s dominant component direction. In the Z-component, weak seismic amplitudes are present on XOY due to coal seam wave confinement, but P/S-wave energy is absent on XOY/XOZ.
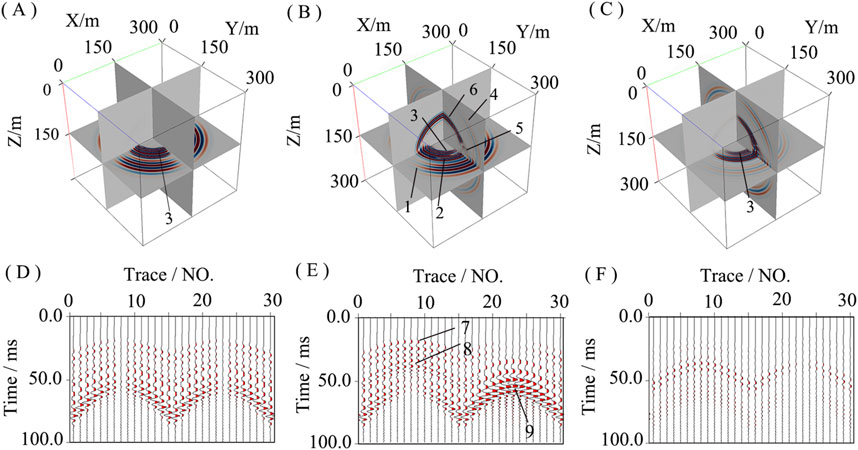
Figure 7. A snapshot of a three-dimensional three-component wavefield and a Three-dimensional three-component seismic record; (A) X-component wavefield; (B) Y-component wavefield; (C) Z-component wavefield; (D) X-component seismic record; (E) Y-component seismic record; (F) Z-component seismic record.
Figures 7D–F are seismic records of X, Y, and Z components, respectively. The in-phase axis 7 is a refracted longitudinal wave (P-wave), the in-phase axis 8 is a mixed wave train of refracted transverse wave and converted transverse wave (S-wave), and the in-phase axis 9 is a channel wave. From the diagram, the dominant energy is concentrated in the X-component and Y-component. In the X-component seismic record, the P-wave, S-wave, and channel wave energy of the two lines are missing. Y-component records show relatively weak energy at the center for Line 1 but strong energy for Line 2. Comparative analysis confirms that channel wave energy along the X-axis in the Y-component is strongest, affirming it as the dominant direction for the Y-direction source. Consequently, the Y-direction concentrated force source is highly suitable as an excitation source for advanced detection.
4 Analysis and migration of wide-azimuth advanced detection wavefield with an air tunnel
4.1 3D model and observation system
To further study the effectiveness of the wide-azimuth observation system, a classic three-dimensional fault model of “rock-coal-rock” with air containing tunnels was designed. The schematic diagram of the model is shown in Figure 8A. In the model, the head-on position is located at X = 120 m, while the tunnel center is situated at Y = 50 m, the width of the tunnel is 4 m, the height is 4 m, and the coal thickness is 4 m. A normal fault is set at Y = 200 m, with a dip angle of 75° and a drop of 5 m. A single shot is used to excite 25 three-component detectors to simultaneously receive the observation system (as shown in Figure 8B) and Figure 8C is section diagram. Horizontally arranged, with S1 located at (110 m, 65 m, 50 m), and the remaining sources (S2, S3, S4, and S5) arranged sequentially. The detection distance along the Y-axis is 15 m. The detectors are positioned on the right side of the roadway, opposite the excavation direction of the coal tunnel, with detector position 1 at (118 m, 55 m, 50 m) and detector spacing at 3 m.
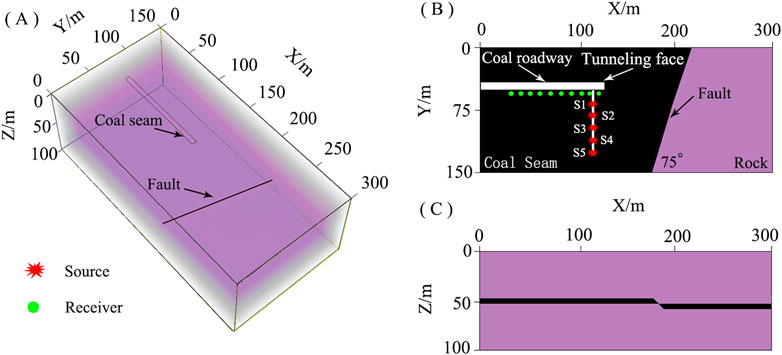
Figure 8. 3D model; (A) 3D model; (B) Plan view; (C) Section diagram.
4.2 Characteristics of transverse wide-azimuth three-dimensional wavefield and seismic records
Figures 9–11 show the seismic records of the X, Y, and Z components with a fault dip angle of 75° detected in advance under the condition of a large lateral offset. The signal-to-noise ratio of the Y component seismic record is higher than that of the X and Z components. The first wavefront (in-phase axis 1) corresponds to refracted longitudinal waves; the second wavefront (in-phase axis 2) is a mixed wave train of refracted transverse and converted transverse waves, while the third (in-phase axis 3) represents the direct channel wave. The seismic velocities for in-phase axes 1, 2, and 3 are 3500 m/s, 1800 m/s, and 1200 m/s, respectively. When local seismic waves propagate head-on, diffraction waves are generated. The fourth (in-phase axis 4) is the diffracted transverse wave, and the fifth (in-phase axis 5) is the diffracted trough wave. Diffraction longitudinal waves, due to their fast velocity, are mixed with direct waves and cannot be identified in seismic records. Comparison shows that the larger the offset, the more pronounced the diffraction wave at the head-on position, while the smaller the offset, the less developed the diffraction wave at the head-on position. After encountering a fault interface, seismic waves propagating ahead generate reflected waves. The in-phase axis 6 signal, the in-phase axis 7 signal, and the in-phase axis 8 signal correspond to reflected longitudinal, transverse, and trough waves, respectively. The reflection trough wave, with a large time interval from other wave trains in the time domain, presents a clear wave train, making it a characteristic wave for fault detection.
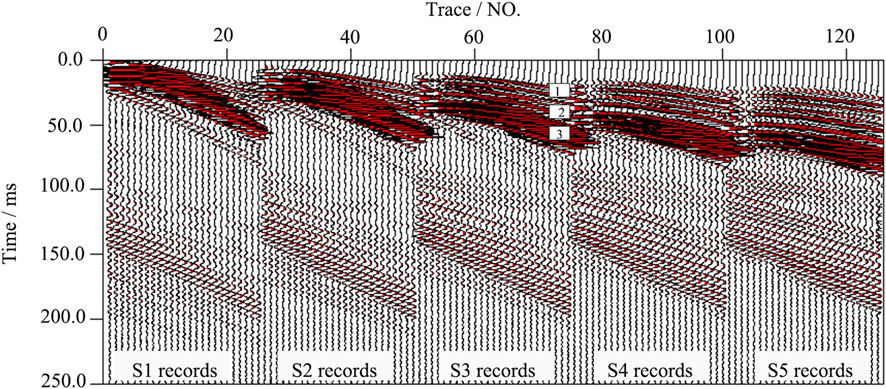
Figure 9. X-component seismic record.
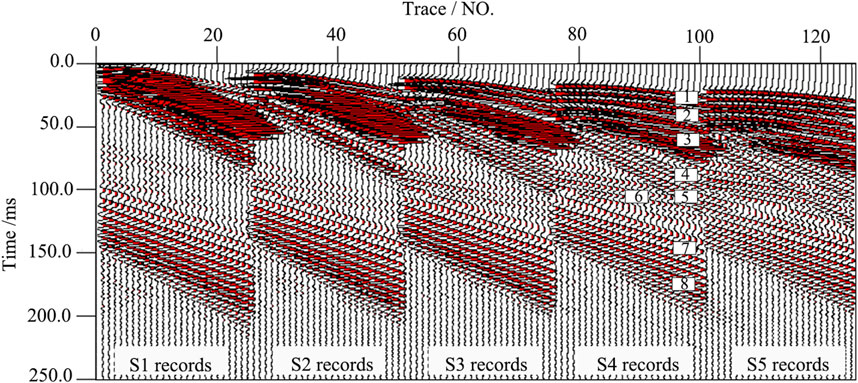
Figure 10. Y-component seismic record.
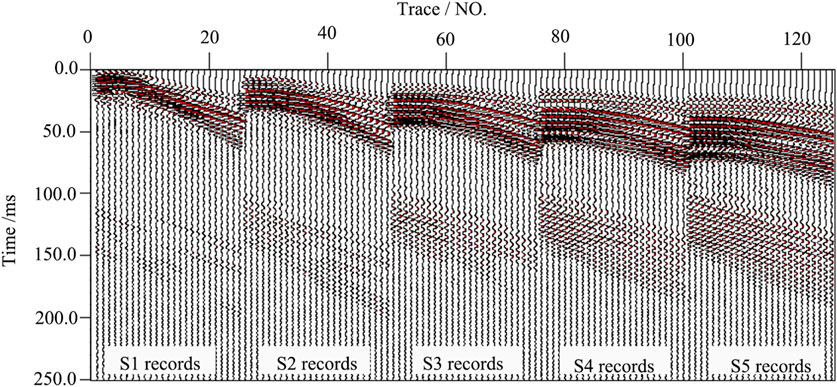
Figure 11. Z-component seismic record.
We selected the Y-component wavefield snapshot of the S4 seismic source with a clear wave train for analysis. Figure 12 shows the three-dimensional wavefield snapshot. Figures 12A–D are the Y-component wavefield snapshot at 30 ms, 40 ms, 50 ms, and 60 ms, respectively. When the seismic wave propagates to 30 ms after the source is excited, the wavefront 1 is the direct refracted longitudinal wave, the wavefront 2 is the mixed wave train of direct refracted transverse wave and converted transverse wave, and the wavefront 3 is the direct trough wave. At 40 ms, when the seismic wave reaches the tunnel interface, wavefront 4 is a reflected longitudinal wave. At 50 ms, when the direct transverse wave reaches the tunnel interface, wavefront 5 is a reflected transverse wave. At 60 ms, when the direct channel wave reaches the tunnel interface, wavefront 6 is a reflected channel wave.
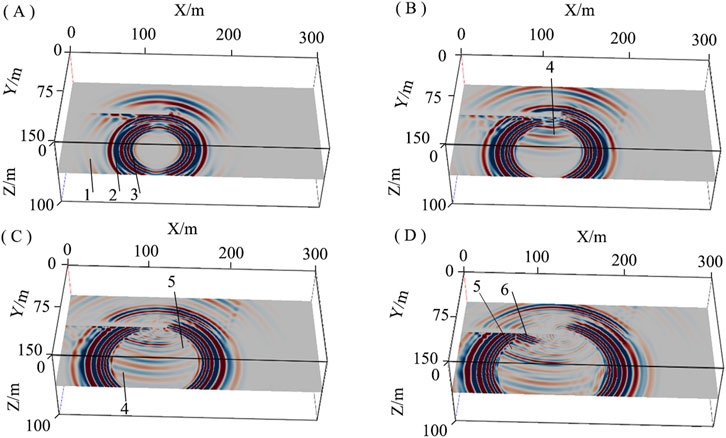
Figure 12. 3D snapshots of Y-component: (A) T = 30 ms; (B) T = 40 ms; (C) T = 50 ms; (D) T = 60 m.
Figures 13A–D are the Y-component wavefield snapshots at 70 ms, 90 ms, 100 ms, and 120 ms, respectively. At the moment when the local seismic wave propagates to 70 ms, the wavefront 7 of the wave is the diffracted transverse wave generated by the direct transverse wave at the head-on position, and the wavefront 8 of the wave is the diffracted channel wave generated by the direct channel wave at the head-on position; at the moment when the local seismic waves propagate to 80 ms, the seismic waves propagating in the leading direction encounter the fault interface and produce various types of reflected and transmitted waves. Wavefront 13 is the reflected longitudinal wave, wavefront 11 is the reflected transverse wave, and wavefront 9 is the transmitted transverse wave. Due to the fault’s disruption of the coal seam’s continuity, when channel waves encounter the wave impedance interface, part of the seismic waves transmitted through the fault interface cannot propagate and are converted into transverse waves, as shown in wavefront 10. Another part of the channel waves produces reflected channel waves as wavefront 12.
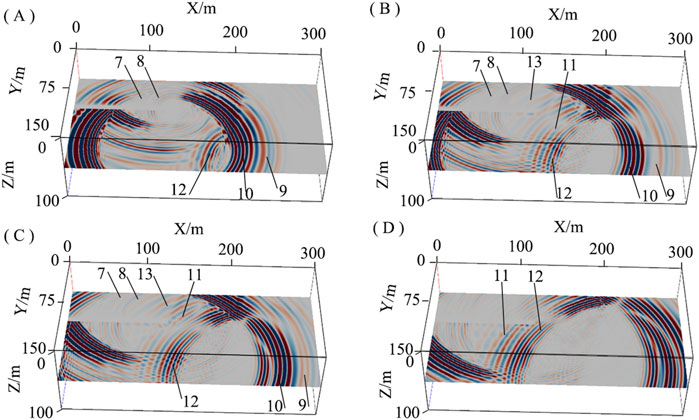
Figure 13. 3D snapshots of Y-component: (A) T = 70 ms; (B) T = 90 ms; (C) T = 100 ms; (D) T = 120 ms.
4.3 Wide-azimuth migration
Figures 14A,B are S1 and S2 migration images with a fault dip of 75 degrees under the lateral wide-azimuth observation system (The imaging principle can be found in Supplementary Appendix B (Shen et al., 2009)), respectively. Upon comparison, it is found that at excitation hole depths of 15 m and 30 m, migration images exhibit a symmetrical illusion due to weak directional resolution under these offset conditions. Figures 14C–E present migration images for S3, S4, and S5 under the same system. The symmetry illusion disappears in the post-migration imaging, indicating that increasing the lateral offset effectively resolves this issue.
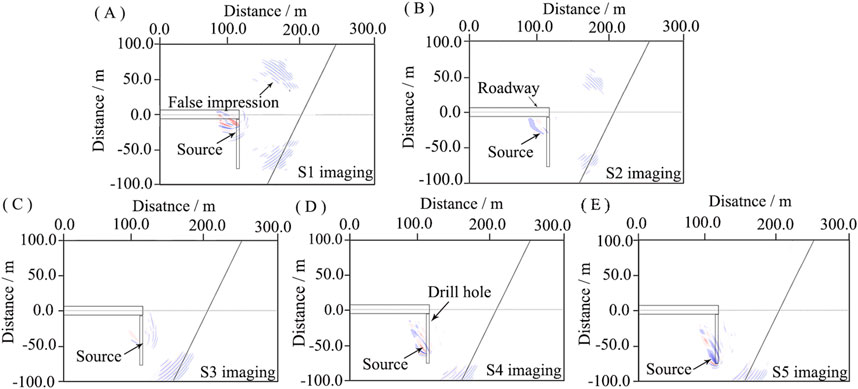
Figure 14. Imaging results; (A) S1 imaging results; (B) S2 imaging results; (C) S3 imaging results; (D) S4 imaging results; (E) S5 imaging results.
To further obtain the optimal excitation hole depth, combined with seismic records and wave field snapshot analysis, it is found that when the offset is less than 30 m, the imaging has a symmetrical illusion problem, and when it is greater than 45 m, the symmetrical illusion disappears. Furthermore, as the offset distance increases, diffraction waves become more pronounced. With increasing detection distance, the time interval between direct and reflected waves in the time domain decreases, causing diffraction waves to blend with reflected waves. At 75 m offset, the interval between diffracted in-seam waves and reflected in-seam waves is relatively small in the time domain. Consequently, the optimal lateral excitation hole depth, under the 75° fault dip, lies between 45 and 60 m.
5 Discussion
5.1 Comparison of explosive source and CO2 seismic source
To further carry out the trials of CO2 seismic source-based wide-azimuth advanced detection, this paper analyzed the properties of the CO2 seismic source, and trials showing a comparison with the traditional explosive source were conducted in a mining area. Firstly, the energy generated by the CO2 seismic source and explosive source was calculated by using the model of a compressed gas and water vapor container blasting. The amplitude (W) calculation formula (Wang et al., 2020) for CO2 seismic source is as follows:
where W is the excitation energy (kJ); P signifies the ultimate pressure of the shearing plate (usually ranging from 100 MPa to 270 MPa); V is the reservoir volume (m3); K represents the adiabatic index of CO2 (equivalent to 1.295).
The pressure adopted in this experiment is 120 MPa, and the energy generated by the CO2 seismic source is equivalent to 140 g of TNT. After a calculation, the TNT equivalent of the explosive source is about 185 g (the TNT equivalent coefficient of the emulsion explosive is 0.76 (Wang et al., 2020)). Seismic records after actual excitation are shown in Figures 15A,B. Upon comparative analysis, the findings reveal that the seismic records generated by the explosive source and the CO2 source are generally similar and exhibit three characteristic seismic wave types (Feng et al., 2018). The first arrival is P-wave, with a velocity of 3,500 m/s; the second arrival is S-wave, with a velocity of 1,800 m/s; the third arrival is channel wave, which is the Airy phase of the channel wave, with a velocity of about 900 m/s. Notably, in the case of the CO2 seismic source, channel waves are more prominent, while body waves are relatively weaker. In contrast with the traditional explosive source, body waves are more prominent, and channel waves are comparatively weaker.
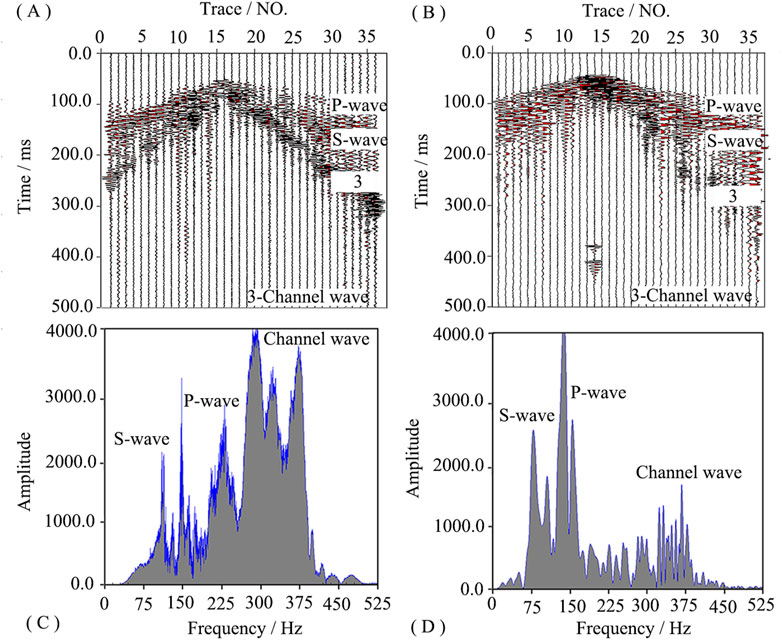
Figure 15. Seismic records and comparative analysis; (A) CO2 source seismic records; (B) Explosive source seismic records; (C) CO2 source spectrum; (D) Explosive source spectrum.
To further analyze the characteristics of seismic records in the case of these two sources, frequency spectral analysis for seismic records was conducted, as shown in Figures 15C,D. The comparative analysis found that the characteristics of the frequency spectrum of the CO2 seismic source were similar to those of an explosive source. According to the frequency spectrum of the explosive source, the amplitude of the high-frequency channel wave signals is weaker than that of body waves. However, the channel wave signals excited by the CO2 seismic source are abundant and of higher frequency, with both amplitude and energy levels stronger than those of body waves. Additionally, the CO2 seismic source produces more abundant channel wave signals on one side of the roadway. This phenomenon occurs because the deep-hole excitation method avoids the adverse effects of the loose circle of surrounding rock and roadways. By targeting excitation, the CO2 seismic source efficiently concentrates energy on the coal seams, reducing the leakage of seismic wave energy. Furthermore, in the case of the explosive source, excitation near a roadway, coupled with the short distance and the presence of an air roadway, results in relatively weak channel waves.
5.2 Analysis of the advantages of wide-azimuth directional excitation of the CO2 source
The advanced seismic detection technology for tunnels has been a topic for geophysical workers, with advantages such as being close to the target body and rich in information. However, due to the limited space of coal tunnels, there is a technical bottleneck in the precise advance detection of faults. The reason for this is that the existing explosive excitation hole depth is 1.5–2 m, resulting in a very small lateral offset perpendicular to the direction of advance detection of coal tunnels, and only narrow azimuth observation can be used. Due to the limited range of excitation and reception, surface waves, channel waves, diffraction waves, and so on, are mixed, which makes it difficult to separate the characteristic waves of the fault in front of the coal roadway, and the directional resolution of the fault imaging is low. Increasing the depth of explosive excitation holes is one way to solve narrow orientations. However, specialized construction to stimulate deep holes affects excavation, making it difficult to be feasible, and even some fully mechanized mines without explosives. We usually use explosive sources to achieve the traditional narrow directional excitation by exciting the side walls of the tunnel. This excitation method is influenced by the loose zone of the tunnel and the surrounding rock, and the explosive sources’ excitation direction is uncertain. At the same time, traditional excitation methods may have blind spots at the front of the tunnel during the collection process.
The earthquake source is the source of seismic signals and an important component of the wide azimuth earthquake advance observation system. The CO2 source originates from liquid CO2 phase change-induced fracturing. This technology is used in the field of coal mine gas prevention and control by installing a CO2 fracturing system into horizontal boreholes in the coal seam, causing the formation of a fracture circle in the fractured coal seam and increasing the permeability of the coal seam, thereby improving gas extraction efficiency. The principle and working process of CO2 blasting is as follows: we place the liquid CO2 in a storage pipe, and when the detonator ignites the heater, the liquid CO2 inside the pipe quickly converts into high-pressure gas. The gas volume expands by more than 600 times, causing the gas pressure inside the pipe to rapidly increase. When the gas pressure reaches the control pressure threshold of the shear plate (100–270 MPa), it breaks through the shear plate and sprays out from the outlet hole of the adjustable pressure relief head, releasing the explosive force and concentrating energy on the coal seam.
Compared to traditional seismic sources, CO2 seismic sources have the following advantages: (1) deep hole CO2 seismic sources avoid the influence of surrounding rock loosening zones and tunnels during excitation, effectively reducing energy leakage during the seismic source excitation process; Effectively overcoming the surface wave interference caused by the tunnel interface and head-on interface, directly avoiding the blind spot problem of traditional advanced detection at the head-on position. (2) CO2 seismic sources have the characteristic of directional excitation, which is manifested in the conversion of liquid CO2 inside the pipe into high-pressure gas that penetrates the shear plate and is ejected from the outlet through the pressure relief head, thereby releasing explosive force on the coal seam. By changing the structure of the pressure relief head, the excitation direction of the seismic source can be controlled, thereby achieving directional excitation and concentrating energy on the coal seam. According to different detection directions and geological structures with different orientations, the direction of energy gathering of the seismic source can be controlled in a targeted manner, and the optimal direction can be used for refined detection; (3) By utilizing liquid CO2 phase change induced deep hole, a hole tunnel wide azimuth observation system is constructed to overcome the limitations of traditional narrow azimuth, without the need for specialized construction of excitation holes and seismic sources, and without affecting tunnel excavation. (4) CO2 seismic sources have the advantages of safety, non-pollution, and reusability, eliminating the dependence on seismic explosives for advanced detection.
6 Conclusion
To overcome the problems of relatively low lateral resolution and symmetry artifacts in imaging results of narrow azimuth observation systems. This paper adopts a wide-azimuth perspective and utilizes the deep excitation characteristics of CO2 sources to investigate the wide-azimuth detection method based on CO2-concentrated sources through theoretical analysis, three-dimensional numerical simulation, and physical analysis. The research results indicate that:
1. Theoretical research and time distance curve studies have shown that when the fault dip angle is between 0° and 45°, the effective detection range gradually decreases with the increase of lateral offset. Conversely, when the dip angle of the fault is between 45° and 90°, the effective detection range gradually increases as the lateral offset increases. Given that faults in front of coal tunnels generally exhibit high dip characteristics, wide-azimuth advanced detection is suitable for detecting large dip faults in front of coal tunnels.
2. Research has shown that the dominant excitation direction for channel wave advanced detection of concentrated force sources is horizontally perpendicular to the tunnel direction, typically defined as the Y-direction. The CO2 source controls the excitation direction by adjusting the outlet of the pressure relief head, achieving directional excitation of the concentrated force source. To further study the seismic wave field characteristics of the Y-direction concentrated force source, the mechanical mechanism and three-dimensional numerical simulation method were used to analyze the amplitude differences of multi-component longitudinal and transverse waves in different directions under the Y-direction concentrated force source of the uniform model and coal rock coal model. This analysis revealed the development mechanism of channel waves in the coal seam interface.
3. Based on the Y-direction concentrated force source, a study was conducted on the characteristics of a wide-azimuth three-dimensional three-component seismic wavefield. It was found that the reflected trough waves had a significant time interval and clear wavefronts compared to other wavefronts in the time domain. Additionally, the signal-to-noise ratio of seismic records in the Y-component was higher than in the X and Z components, and the reflected trough wave was identified as a characteristic wave for fault detection.
4. The migration processing was carried out using fault characteristic waves. Compared with narrow-azimuth observation systems, wide-azimuth observation systems can effectively eliminate symmetry artifacts, further verifying the effectiveness of the method.
To further analyze the effectiveness of CO2 seismic sources, we conducted comparative experiments between CO2 seismic sources and explosive seismic sources. The frequency spectrum of CO2 seismic sources was found to be similar to that of the explosive seismic source, with CO2 sources excelling in exciting high-frequency seismic waves. CO2 seismic sources offer advantages such as wide-azimuth excitation and intrinsic safety. The CO2 seismic advance detection method holds significant promise in coal mines, particularly in modern mines where explosives are restricted and safety regulations are stringent. The next step should focus on conducting advanced detection field experiments to study the background seismic wavefield and the response characteristics of different fault orientations under CO2 source wide-azimuth excitation, providing basic support for fine processing of fault advanced detection.
Data availability statement
The raw data supporting the conclusions of this article will be made available by the authors, without undue reservation.
Author contributions
LH: Conceptualization, Data curation, Visualization, Writing – original draft, Writing – review and editing. YJ: Data curation, Visualization, Writing – original draft, Writing – review and editing. SW: Writing – original draft. SY: Writing – review and editing. HS: Writing – review and editing.
Funding
The author(s) declare that financial support was received for the research and/or publication of this article. This research was supported by the National Natural Science Foundation of China Youth Program (grant number 42404148) and the Natural Science Foundation of Jiangsu Province (grant numbers BK20230197 and BK20220234).
Conflict of interest
The authors declare that the research was conducted in the absence of any commercial or financial relationships that could be construed as a potential conflict of interest.
Generative AI statement
The author(s) declare that no Generative AI was used in the creation of this manuscript.
Any alternative text (alt text) provided alongside figures in this article has been generated by Frontiers with the support of artificial intelligence and reasonable efforts have been made to ensure accuracy, including review by the authors wherever possible. If you identify any issues, please contact us.
Publisher’s note
All claims expressed in this article are solely those of the authors and do not necessarily represent those of their affiliated organizations, or those of the publisher, the editors and the reviewers. Any product that may be evaluated in this article, or claim that may be made by its manufacturer, is not guaranteed or endorsed by the publisher.
Supplementary material
The Supplementary Material for this article can be found online at: https://www.frontiersin.org/articles/10.3389/feart.2025.1684959/full#supplementary-material
References
Chen, J.-F. (2015). Moment tensor inversion of the 2012 jinta, Gansu MS5.4 earthquake. China Earthq. Eng. J. 37, 1124–1128. doi:10.3969/j.issn.1000-0844.2015.04.1124
Cheng, J.-L., Li, F., Peng, S.-P., and Sun, X.-Y. (2014). Research progress and development direction on advanced detection in mine roadway working face using geophysical methods. J. China Coal Soc. 39, 1742–1750. doi:10.13225/i.cnki,iccs.2014.9007
Essen, K., Bohlen, T., Friederich, W., and Meier, T. (2007). Modelling of Rayleigh-type seam waves in disturbed coal seams and around a coal mine roadway. Geophys. J. Int. 170, 511–526. doi:10.1111/j.1365-246X.2007.03436.x
Feng, L., Du, Y.-Y., Li, S.-Y., Yao, X.-S., and Yang, Y.-J. (2018). Wavefield analysis of typical in-seam seismic data by transmission method. Prog. Geophys. 33, 590–595. doi:10.6038/pg2018BB0067
Ji, G.-Z., Cheng, J.-Y., and Zhu, P.-M. (2012). 3-D numerical simulation and dispersion analysis of in-seam wave in underground coal mine. Chin. J. Geophys. 2, 645–654. doi:10.6038/j.issn.0001-5733.2012.02.028
Ji, G.-Z., Wei, J.-C., Yang, S.-T., Li, X.-F., Bai, J.-L., and Su, Y.-G. (2018). Three-component polarization migration of channel waves for prediction ahead of coal roadway. J. Appl. Geophys. 159, 475–483. doi:10.1016/j.jappgeo.2018.09.028
Jiang, J.-P., He, L., Zhu, P.-M., Zhang, Q., and Teng, J.-W. (2018). The method of small structure prediction ahead with rayleigh channel wave in coal roadway and seismic wave field numerical simulation. Chin. J. Geophys. (in Chinese) 55, 655–662. doi:10.6038/cjg2018L0146
Li, S.-C., Liu, B., Sun, H.-F., Nie, L.-C., Zhong, S.-H., Su, M.-X., et al. (2014). State of art and trends of advanced geological prediction in tunnel construction. Chinese Journal of Rock Mechanics and Engineering 33, 1090–1113. doi:10.13722/j.cnki.jrme.2014.06.003
Li, S.-C., Liu, B., Xu, X.-J., Nie, L.-C., Liu, Z.-Y., Song, J., et al. (2017). An overview of ahead geological prospecting in tunneling. Tunnelling and Underground Space Technology 63, 69–94. doi:10.1016/j.tust.2016.12.011
Li, H.-J., Gao, B., Shi, Y., Dai, L.-L, and Yan, H. (2019). Application of super-critical CO2 source in seismic exploration. Equipment for Geophysical Prospecting1, 67–70.
Li, W., Chen, Y., Wang, F.-Y., Cao, Y.-X., Wang, H.-Z., Tian, L., et al. (2020). Feasibility study of developing one new type of seismic source via carbon dioxide phase transition. Chinese Journal of Geophysics (in Chinese) 63, 2605–2616. doi:10.6038/cjg2020N0335
Li, Z., Qi, Q.-M., Hei, C., Jiang, C., and Wang, X.-J. (2023). Elastic-wave radiation, scattering, and reception of a dipole acoustic logging-while-drilling source in unconsolidated formations. Front. Earth Sci. 10, 879345. doi:10.3389/feart.2022.879345
Liu, B., Cheng, J.-Y., and Hu, J.-W. (2018). Seismic features of vibration induced by mining machines and feasibility to be seismic sources. Procedia Earth and Planetary Science 3, 76–85. doi:10.1016/j.proeps.2011.09.068
Lu, G.-Y., Luo, S., Zhu, Z.-Q., Shi, K.-L., and Xia, C.-Z. (2020). Full wave filed numerical simulation and analysis of tunnel space based on cylindrical coordinate system. Journal of Railway Science and Engineering 17, 388–395. doi:10.19713/j.cnki.43-1423/u.T20190267
Peng, S.-P. (2020). Current status and prospects of research on geological assurance system for coal mine safe and high efficient mining. Journal of China Coal Society 45, 2331–2345. doi:10.13225/j.cnki.jccs.DZ20.1089
Shen, H.-Y., Li, Q.-C., and Feng, H. (2009). Migration imaging for tunnel reflected waves seismic prediction ahead. Journal of China Coal Society 34, 1–7. doi:10.3321/j.issn:0253-9993.2009.03.003
Vladimir, G. (2020). Moment tensors of double-couple microseismic sources in anisotropic formations. Geophysics 85, S1–S11. doi:10.1190/geo2019-0471.1
Wang, B., and Huang, L.-Y. (2022). A polarization migration velocity model building method for geological prediction ahead of the tunnel face. Frontiers in Earth Science 10, 857984. doi:10.3389/feart.2022.857984
Wang, B., Liu, S.-D., Sun, H.-C., Xing, S.-Y., Zhang, J., Ding, X., et al. (2022). Field experiment and prospect discussion of in seam seismic survey for CO2 source. Journal of China Coal Society 47, 906–914. doi:10.13225/j.cnki.jccs.2020.1420
Wang, B., Sun, H.-C., Huang, L.-Y., Liu, S.-D., Jin, B., Zhang, H., et al. (2020). Wave field characteristics of small faults around the loose circle of rock surrounding a coal roadway. Journal of Environmental and Engineering Geophysics 25, 245–254. doi:10.2113/JEEG19-073
Wang, B., Qiu, W.-Y., Liu, S.-D., Sun, H.-C., Ding, X., Jin, B., et al. (2020). Supercritical CO2 source for underground seismic exploration. Journal of King Saud University - Science 32, 1731–1737. doi:10.1016/j.jksus.2020.01.010
Wang, B., Sun, H.-C., Li, X.-X., Xing, S.-Y., and Ding, X. (2021). Seismic wave field characteristics and application of CO2 concentrated force source. Journal of China Coal Society 46, 556–565. doi:10.13225/j.cnki.jccs.XR20.1875
Wu, S.-J., Luo, B., Chen, Y.-Y., Wu, J.-T., Zhang, W., Zhang, X.-Q., et al. (2017). Joint inversion of up-going SS-wave and PP-wave in land zero offset VSP with P-wave source and a tentative exploration of their application. Geophysical Prospecting for Petroleum 56, 589. doi:10.3969/j.issn.1000-1441.2017.04.016
Yang, S.-T., and Cheng, J.-L. (2012). The method of small structure prediction ahead with rayleigh channel wave in coal roadway and seismic wave field numerical simulation. Chinese Journal of Geophysics (in Chinese) 55, 655–662. doi:10.6038/j.issn.0001-5733.2012.02.029
Yang, S.-T., Wei, J.-Q., Cheng, J.-L., Shi, L.-Q., and Wen, Z. J. (2016). Numerical simulations of full-wave fields and analysis of channel wave characteristics in 3-D coal mine roadway models. Applied Geophysics 13, 621–630. doi:10.1007/s11770-016-0582-9
Zeng, L.-F., Wang, B., Xin, G.-X., Li, Y.-C., Shen, Z.-L., Shen, S.-H.-R., et al. (2023). A fault location method based on polarization analysis for coal mine. Frontiers in Earth Science 11, 1097314. doi:10.3389/feart.2023.1097314
Keywords: advanced detection, CO2-concentration source, wide-azimuth observation system, large offset distance, characteristics of seismic wavefield
Citation: Huang L, Jin Y, Wang S, Yang S and Sun H (2025) Research on wide-azimuth seismic advanced detection based on a CO2-concentrated source. Front. Earth Sci. 13:1684959. doi: 10.3389/feart.2025.1684959
Received: 13 August 2025; Accepted: 28 August 2025;
Published: 17 September 2025.
Edited by:
Zhuangcai Tian, China University of Mining and Technology, ChinaReviewed by:
Hu Zean, Anhui University of Science and Technology Affiliated Fengxian Hospital, ChinaFei Cheng, China University of Geosciences (Wu Han), China
Copyright © 2025 Huang, Jin, Wang, Yang and Sun. This is an open-access article distributed under the terms of the Creative Commons Attribution License (CC BY). The use, distribution or reproduction in other forums is permitted, provided the original author(s) and the copyright owner(s) are credited and that the original publication in this journal is cited, in accordance with accepted academic practice. No use, distribution or reproduction is permitted which does not comply with these terms.
*Correspondence: Lanying Huang, aGx5bWFzdGVyQDEyNi5jb20=; Yuhao Jin, amlueXVoYW9AeHppdC5lZHUuY24=