Abstract
In recent years, extreme rainfall events have become more frequent, leading to a significant increase in shallow landslide disasters, which trigger debris flows and increase the risk of subsequent chain disasters. Therefore, conducting research on the identification and spatial distribution patterns of shallow landslides is crucial for mitigating and preventing geological disasters induced by rainfall. In this study, we utilized high-resolution remote sensing imagery and introduced deep learning methods to develop a rapid identification approach for shallow landslides. We constructed a shallow landslide dataset using high-resolution optical satellite data from the Beijing-3(BJ-3) satellite. A Mask Region-based Convolutional Neural Network (Mask R-CNN) deep learning model was employed to train an automatic landslide identification model, generating a landslide inventory. For the identified shallow landslides, we conducted a correlation analysis between rainfall and landslide occurrence. Spatial statistical analysis was used to examine the spatial distribution patterns, while and an Information value method coupling support vector machine (I-SVM) model was applied to assess the susceptibility of shallow landslides to extreme rainfall. The study area was selected in Puwa Township, Fangshan District, Beijing. Using the automatic landslide identification model, we identified 1,237 landslides with a precision of 88.04%, a recall rate of 69.40%, and a processing time of 303 s. After manual screening, 13 landslide susceptibility evaluation factors were selected for further spatial statistical analysis and susceptibility assessment. The results indicate that landslides primarily occur on concave steep slopes at elevations ranging from 540 to 1,080 m. Under given rainfall conditions, the probability of shallow landslide occurrence is higher in Dong Village, Anzigang Village, and Dongniwa villages. The Area Under Curve(AUC) of the landslide susceptibility model is 97%, indicating a high evaluation precision. The research conducted in this paper provides valuable references and recommendations for the rapid identification and disaster prevention of shallow landslides.
1 Introduction
Shallow landslides are one of the most common types of natural disasters in China, usually triggered by extremely heavy rainfall, earthquakes, and so forth. On 29 July 2023, the residual circulation of super typhoon Doksuri and the combined effects of subtropical high pressure, super typhoon Khanon water vapor transport, and terrain were observed in Beijing. Extremely heavy rainstorm occurred in the western mountain area of Beijing, with the maximum rainfall intensity of 126.6 mm/h and the maximum accumulated rainfall of 1,025 mm. Due to heavy rainfall, a large-scale shallow landslide occurred in the western part of Beijing, posing a giant threat to the personal and property safety of the local people. Emergency interpretation of remote sensing data plays a critical role in emergency rescue operations, as it is essential for determining the disaster-affected area and evaluating the safety of disaster-stricken areas. However, conventional manual visual interpretation techniques impose significant limitations on disaster identification efficiency, particularly in time-sensitive emergency scenarios where rapid response is critical (Liu et al., 2024; Cheng et al., 2020; Guo et al., 2023).
Deep learning methods have been widely developed in recent years, and more and more scholars combine remote sensing images with deep learning models to automatically identify landslides using landslide identification models (e.g., Chen et al., 2022; Mao et al., 2023; Deng et al., 2024). In 2022, Wu used the dual attention mechanism of the Convolutional Neural Network (CNN) model to identify the landslide dataset in Jiangxi Province. By focusing on the boundary features of landslides through spatial and channel attention, relatively accurate landslide boundaries were obtained (Wu et al., 2022a); In 2022, Chen used the Squeeze-and-Excitation networks (SENet) optimized Deeplabv3+ algorithm to identify the geohazards in power line corridors of western Sichuan, avoiding the manpower and material resources consumed by the traditional identification methods, and realizing the intelligent screening of landslide areas (Chen et al., 2022); In 2023, Mao used the improved DeepLabV3+ algorithm for training and prediction of landslide dataset, and achieved better improvement in model recognition precision. This demonstrates the ability of deep models to capture the boundaries of fragmented landslides (Mao et al., 2023); In 2024, Wang conducted a study on the unbalanced sample situation in Yunnan Province and concluded that adopting a deeper network structure and improving the quality of difficult samples are conducive to improving the precision of landslide identification (Wang H et al., 2024); In 2024, Deng used the Swin Transformer model to identify soil landslides in the Three Gorges Reservoir area, which the deep learning method can still obtain identification results with high precision in the area with high vegetation cover, breaking through the performance bottleneck of traditional CNN under complex surface coverage conditions.
Shallow landslides in high-resolution remote sensing images exhibit the characteristics of discrete distribution and blurred boundaries; the study area is dominated by small-scale landslides, which are often interfered with vegetation and shadows, posing dual requirements for identification methods: accurate localization of individual landslide bodies and precise segmentation of their contours. Existing models have obvious limitations: traditional machine learning models (such as Support Vector Machines and Random Forests) can only achieve pixel-level classification and cannot simultaneously complete target localization; semantic segmentation models like U-Net and Pyramid Scene Parsing Network (PSPNet), although capable of generating pixel-level masks, lack sufficient positioning precision for discretely distributed small-scale landslides. In contrast, the Mask R-CNN model, through its architecture consisting of Region Proposal Network (RPN), Region of Interest (ROI) and mask branch, can simultaneously output bounding boxes and pixel-level masks in a single forward propagation, meeting both localization and segmentation needs. Its integrated Feature Pyramid Network (FPN) effectively retains detailed information of small-scale targets (such as microtopography of landslide scarps and vegetation disturbance traces) through top-down feature fusion, and the introduced mask loss function adds pixel-level mask constraints beyond classification and bounding box regression, enabling effective differentiation between landslides and interfering ground objects (such as bare land and construction areas), thus effectively adapting to research requirements.
According to previous studies, current landslide identification methods based on deep learning are mainly developed using medium-to-low resolution imagery such as Sentinel-2 (10 m) and Landsat-8 (30 m), with insufficient utilization of texture details from high-resolution optical data, such as 0.3 m imagery from the BJ-3 satellite (Qin et al., 2021; Yu et al., 2020). Since shallow landslides in the Beijing area are characterized by high vegetation coverage and small individual area, high-resolution satellites—compared with medium- and low-resolution ones—provide clearer delineation of landslide boundaries and result in higher accuracy in landslide identification. Although high-resolution imagery can capture fine features such as microtopography of landslide scarps and vegetation disturbances, it also introduces the risk of overfitting due to increased complexity of ground objects. There is an urgent need for targeted techniques for feature dimensionality reduction and scale fusion. With the development of China’s optical satellite technology, high-resolution optical images are more popular. It is necessary to establish an identification model based on high-resolution optical images. Most existing datasets are derived from landslides caused by conventional rainfall conditions or seismic impacts, lacking effective training samples for shallow landslides induced by short-duration heavy rainfall (such as the supersaturated soil landslides in Beijing’s “23·7″event). These landslides often exhibit the form of debris flows without obvious scarps. Furthermore, research on shallow landslides triggered by extreme rainfall in the Beijing area remains critically understudied. Shallow landslides typically occur under extreme rainfall conditions and can easily trigger debris flows, posing a threat to the safety of down-stream mountain communities. Efficient and accurate identification of these disasters is the key to the application of remote sensing technology in disaster relief and rescue efforts (Huang et al., 2021; Liu et al., 2023; Chen et al., 2023).
To accurately quantify the relationship between causative factors and shallow landslide occurrence probability, researchers have developed a range of landslide susceptibility assessment methods and models (e.g., Du et al., 2024; Li H et al., 2024; Shu et al., 2024). In 2024, Li used an informative model to analyze the susceptibility of landslides in Shijiazhuang, Hebei Province, and proved the reliability of the model (Li C et al., 2024). In 2024, Du used a random forest model to analyze landslide susceptibility in Southeast Tibet, and the model results were verified to be accurate in the field (Du et al., 2024). In 2024, Su used migration-based component analysis to analyze the susceptibility of the Kushan area, and compared to traditional machine models, it has higher prediction and stronger generalization ability in cross regional prediction (Shu et al., 2024).
Although previous studies have informed landslide susceptibility assessments, prevailing methodologies generally ignores the abrupt weight change effect of disaster-causing factors under extreme rainfall scenarios. Taking Beijing’s mountainous areas as an example, Normalized Difference Vegetation Index (NDVI) significantly inhibits landslides during regular rainy seasons. However, during extreme rainfall, short-duration intense infiltration leads to rapid soil saturation, weakening the soil-reinforcing effect of vegetation roots and causing the influence weight of NDVI to drop sharply. Additionally, notable variations in geological backgrounds exist across different regions—for instance, residual soil is dominant in the northern mountainous areas, whereas fractured rocks prevail in the southwestern regions. These differences give rise to complex and variable interaction mechanisms among landslide-influencing factors, ultimately rendering traditional fixed-weight models poorly adaptable to dynamic scenarios. How to construct a data-driven dynamic factor screening mechanism by integrating real-time rainfall data remains an unsolved key problem (Guo et al., 2023; Yu et al., 2022).
Taking the “23–7” extreme rainfall event in Puwa Township, Fangshan District, Beijing as an empirical case, this study aims to construct a technical system for rapid identification and susceptibility analysis of shallow landslides applicable to high-resolution remote sensing data. The specific objectives are as follows:
First, Methodological Innovation focuses on developing a Mask R-CNN recognition model based on high-resolution optical imagery—this addresses the limitations of low-resolution imagery in capturing fine details, thereby enabling precise detection of landslides triggered by extreme rainfall.
Second, Model Optimization centers on proposing a susceptibility assessment framework that integrates spatial statistics and an I-SVM model. This framework specifically tackles the challenges of dynamically screening landslide-influencing factors and constructing non-linear models for landslide assessment.
Finally, Emergency Application: Validate the practicality of the technical system in disaster emergencies, realize fully automated processes of “disaster identification - risk assessment - decision support”, and provide technical and data references for the prevention and control of extreme rainfall disasters in northern earth-rock mountainous areas.
2 Materials and methods
The overall methodological framework of this study encompasses the following sequential stages: first, data acquisition and preprocessing involves the collection of BJ-3 high-resolution remote sensing imagery, digital elevation model (DEM) data, and rainfall datasets, followed by systematic preprocessing and enhancement to ensure data quality and suitability for subsequent analyses; subsequently, sample annotation and dataset construction entails manual delineation of landslide boundaries using professional annotation tools, enabling the creation of training, validation, and testing datasets with pixel-level precision; next, Mask R-CNN model training and optimization is conducted by leveraging the annotated datasets to train the Mask R-CNN architecture, with iterative parameter tuning to enhance model convergence and predictive performance; following model training, automatic landslide identification is implemented, wherein the trained model is applied to the study area to generate preliminary landslide list through automated detection of potential landslide features; to refine the identification results, manual verification and correction is performed, involving expert review to rectify misclassifications, omissions, and boundary inaccuracies, thereby producing final validated landslide inventories; landslide characteristics analysis is then carried out, utilizing statistical methods to examine the final inventories and characterize landslide properties such as size distribution, spatial clustering patterns, and topographic associations; in parallel, inducing factor analysis quantifies the contribution of each environmental variable to landslide occurrence via the information value model, identifying key drivers of slope instability; subsequently, susceptibility assessment employs the integrated I-SVM model to map the spatial distribution of shallow landslide susceptibility across the study area. Finally, result verification and analysis validates the susceptibility assessment outcomes against independent observations and analyzes the spatial attributes of high-risk zones to derive actionable insights for disaster management (Figure 1).
FIGURE 1
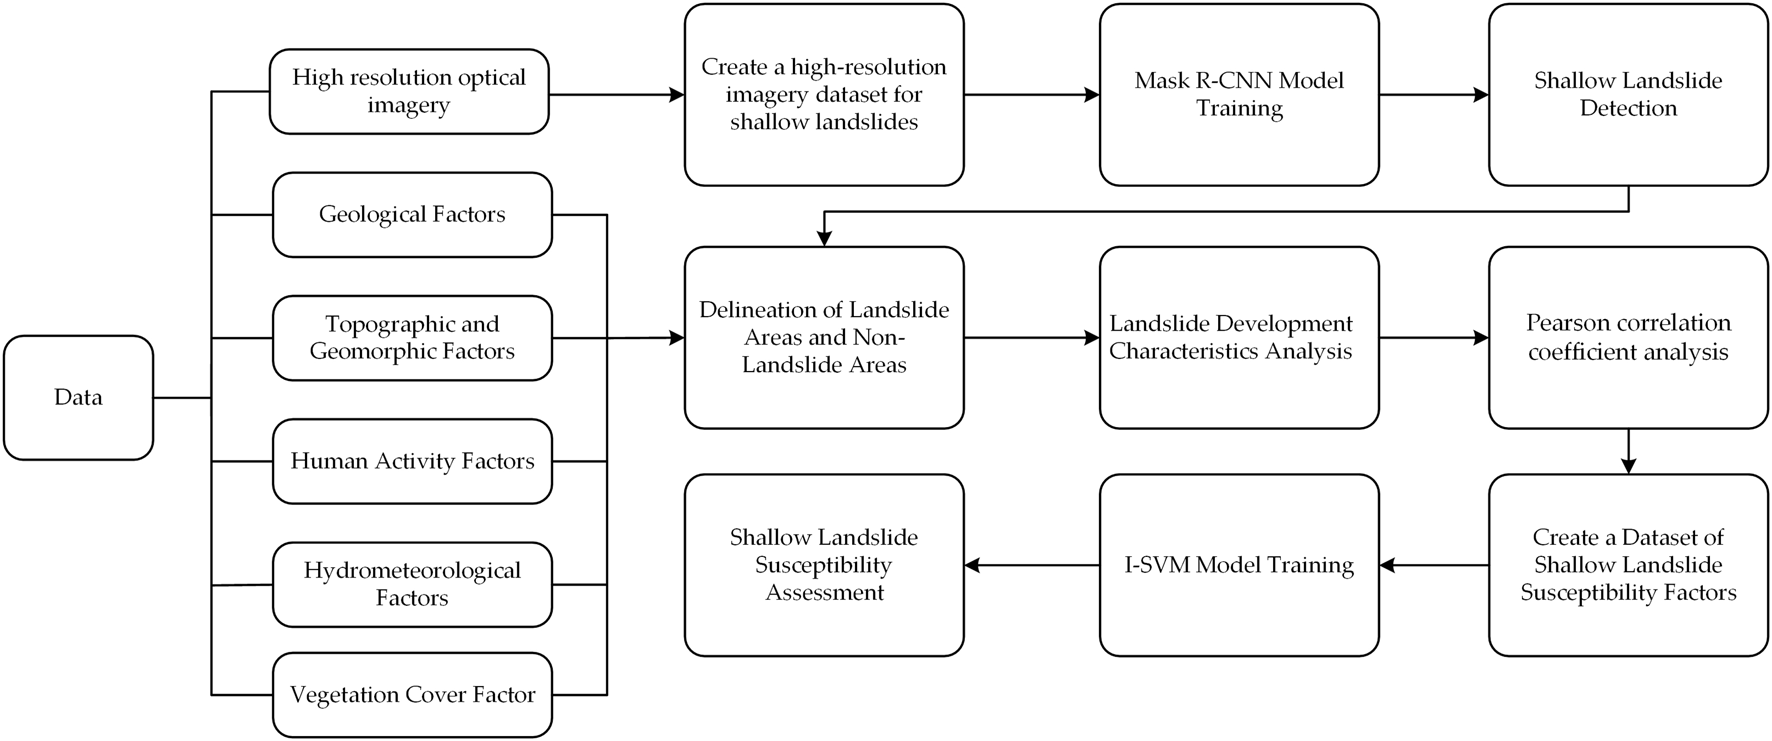
Flowchart of the methodology used in this study.
2.1 Study area overview
The study area for this research is Puwa Township, located in the western part of Fangshan District, Beijing. The township covers approximately 85.85 km2 (excluding the area of cloud cover) and has a population of around 4,500 residents. The terrain is characterized by a high northwest and a low southeast, with a maximum eleva-tion of about 1,534 m and a maximum elevation difference of approximately 1,200 m. The remote sensing image and digital elevation model (DEM) of the study area are illustrated in Figure 2. The remote sensing image was captured from high-resolution optical data from the BJ-3 satellite on 14 August 2023, with an image resolution of 0.3 m. The remote sensing data is of four bands. In this study, three bands of RGB were selected for sample production. This image contains approximately 10% cloud cover. The DEM was acquired using Light Detection and Ranging (LiDAR) technology, with a spatial resolution of 2.5 m. Rainfall data were collected using rain gauges, with measurements recorded at 10 min intervals.
FIGURE 2
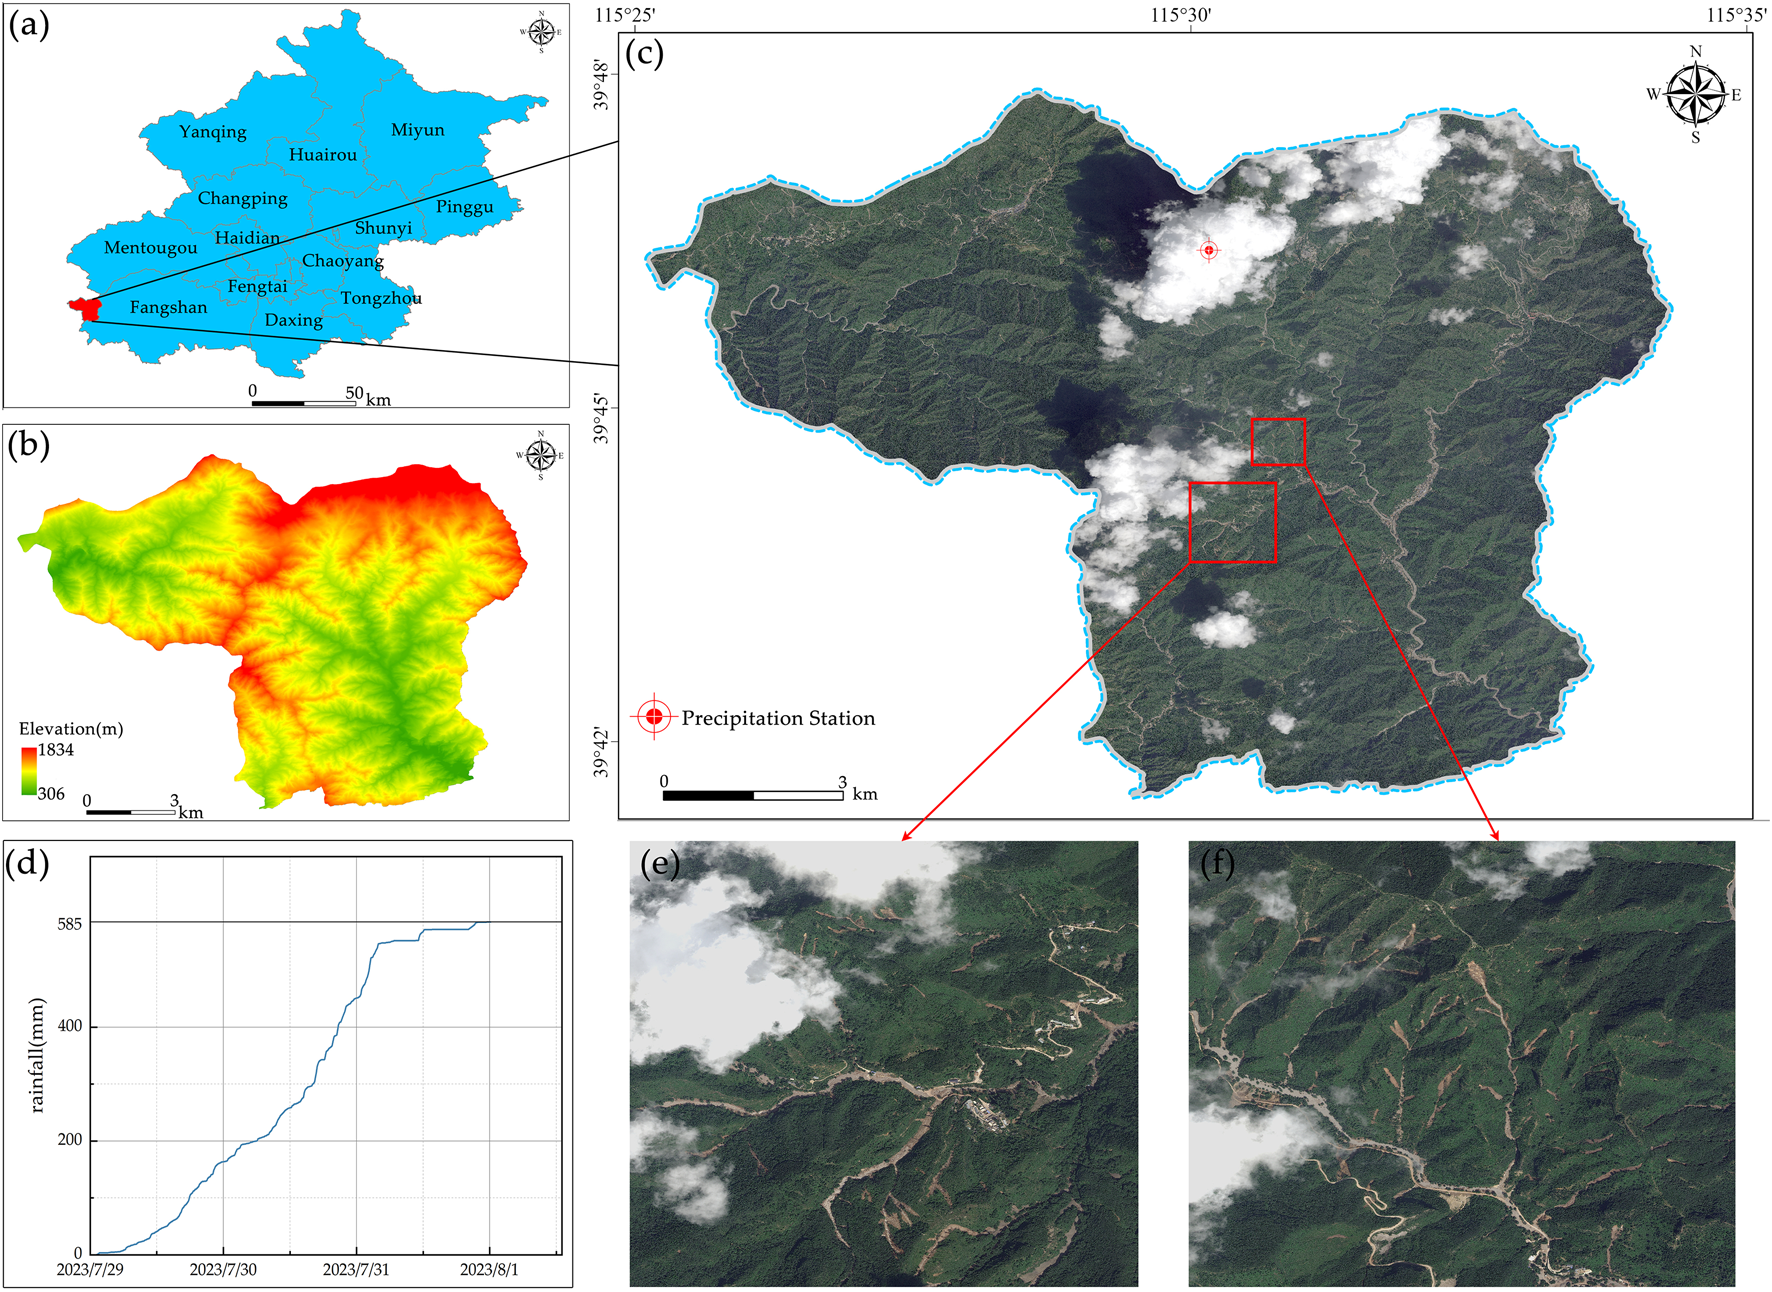
Optical image and digital elevation model of the study area. (a) The location of the research area in Beijing. (b) Digital elevation model. (c) Optical image. (d) Accumulated rainfall profile of Yudouquan Village, Puwa Township. (e) Enlarged image of local area 1. (f) Enlarged image of local area 2.
From July 29 to 1 August 2023, affected by the residual circulation of super typhoon “Doksuri,” the mountainous areas of western Beijing experienced extreme rainfall. The study area, Puwa Township, recorded a total rainfall of 585 mm from July 29 to August 2, with the main rainfall concentrated from July 30 to August 1, accumulating 584.5 mm, as shown in Figure 2d. This short-duration intense rainfall triggered a large number of shallow landslides in the study area, forming dense landslide clusters. These landslides appear on remote sensing images as disturbed vegetation cover areas, exposed soil areas, and debris flow deposits in river channels. The geological conditions in the study area are dominated by Quaternary sediments, with overlying strata of dolomitic tuff and relatively stable geological conditions (Figures 2e,f).
2.2 Data acquisition and preprocessing
Currently, there are no publicly available high-resolution shallow landslide datasets or annotated files. Therefore, this study utilizes BJ-3 satellite data from the “23·7” heavy rainfall event in Beijing to create a shallow landslide sample database for the concentrated landslide areas in Mentougou District. Beyond selecting the study area, we employed a grid division method to partition the entire image into segments using a 1,024 × 1,024 window size and saved in 8-bit RGB format. Through the identification of morphological features, texture features, vegetation features, and other features of the optical image, the pixel-level labels are manually labeled in the labelme sample labeling software to delineate the boundary range of the landslides, which is used for the final model training. Training and labeling results are shown in Figure 3 (Liu et al., 2022; Wu et al., 2022b). The landslide dataset was divided into a training set, a validation set, and a test set, with a random split ratio of 7:1:2.
FIGURE 3
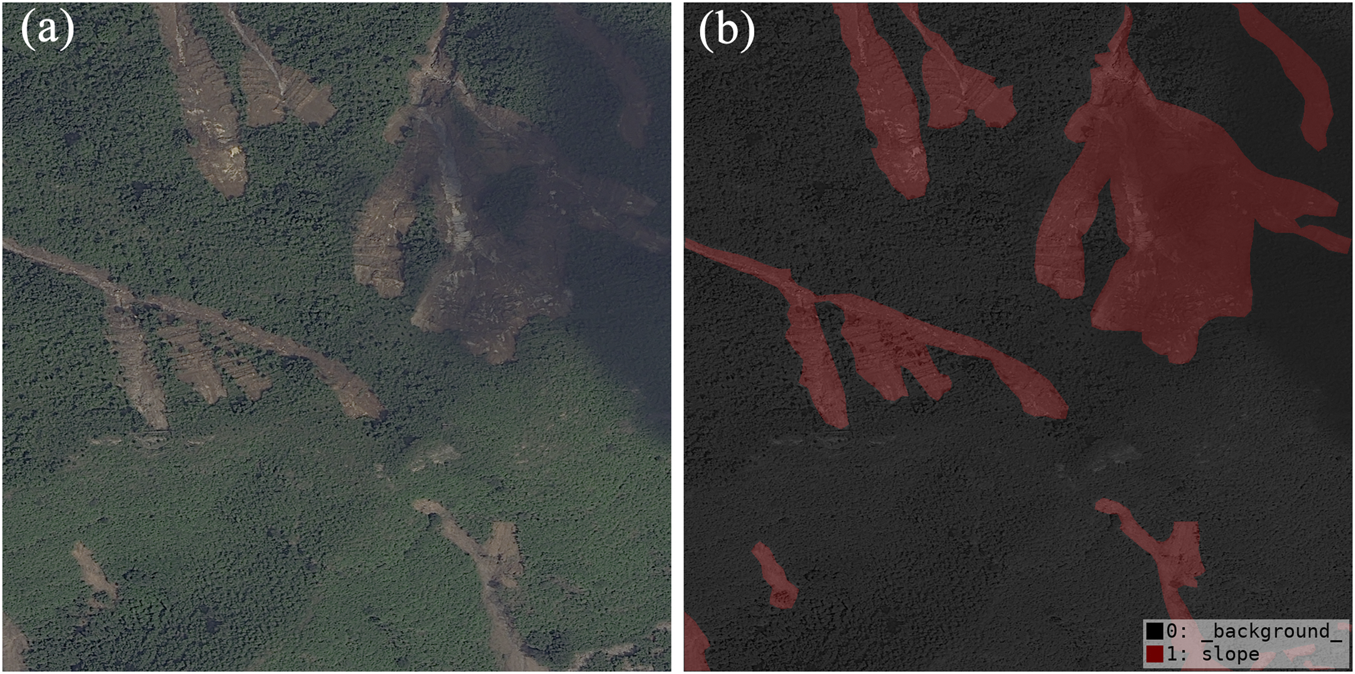
Visualization of dataset annotation. (a) Optical image (b) Sample labeling.
During the data preprocessing phase, we adopted the following steps:
First, image enhancement. Apply contrast-limited adaptive histogram equalization processing to the original remote sensing image to enhance the local contrast of the image and improve the distinguishability between landslides and the background. Second, normalization: Normalize image pixel values to the [0, 1] range to meet the input requirements of deep learning models. Finally, data augmentation. To increase the diversity of training samples and improve the generalization ability of the model, we applied various data augmentation techniques to the training data, including random rotation (−15°–15°), horizontal flipping, vertical flipping, random cropping, and brightness adjustment.
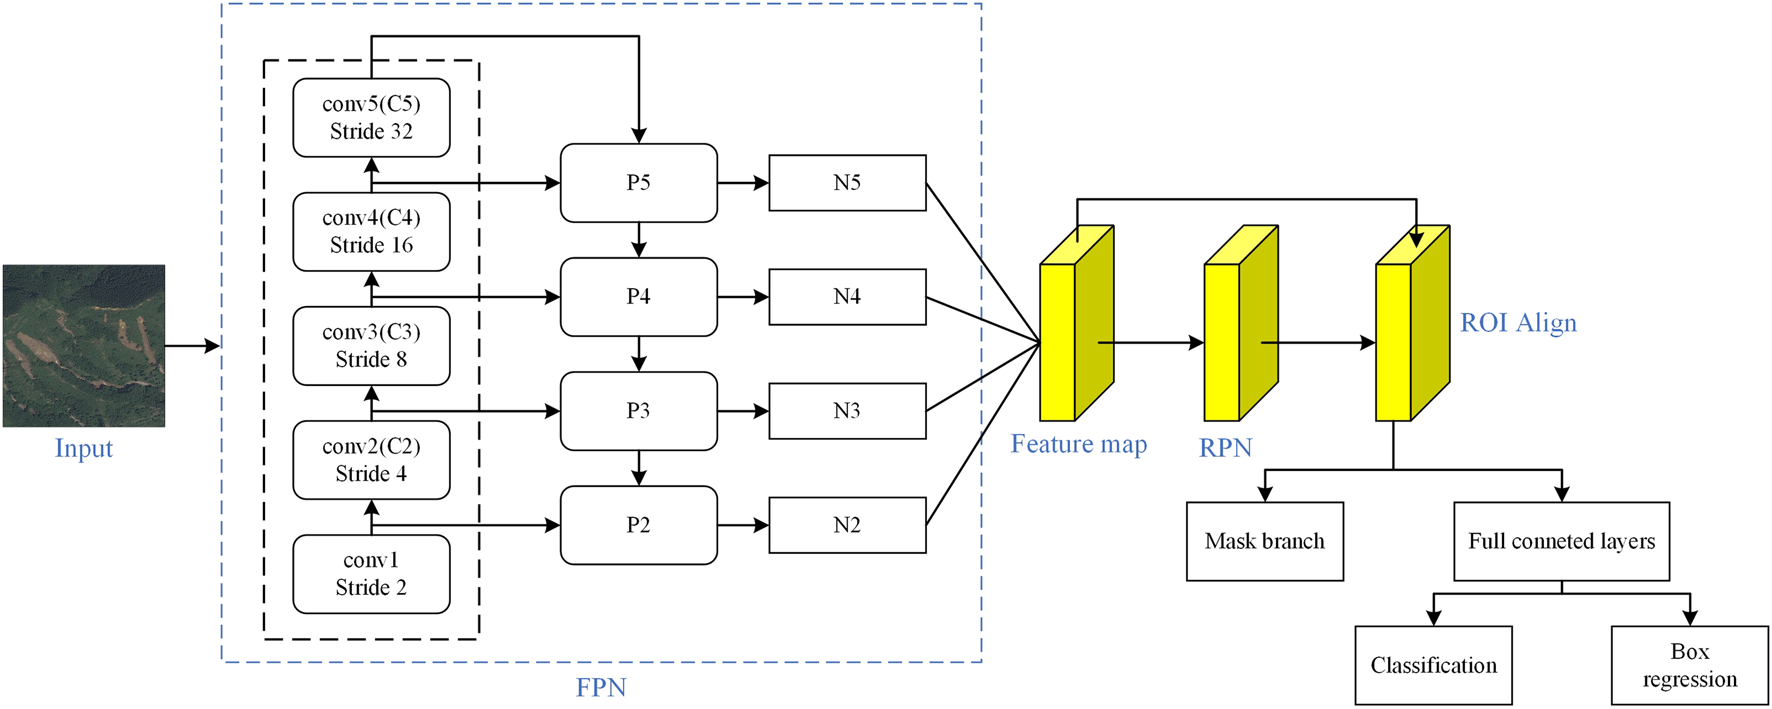
2.3 Landslide automatic identification model based on Mask R-CNN
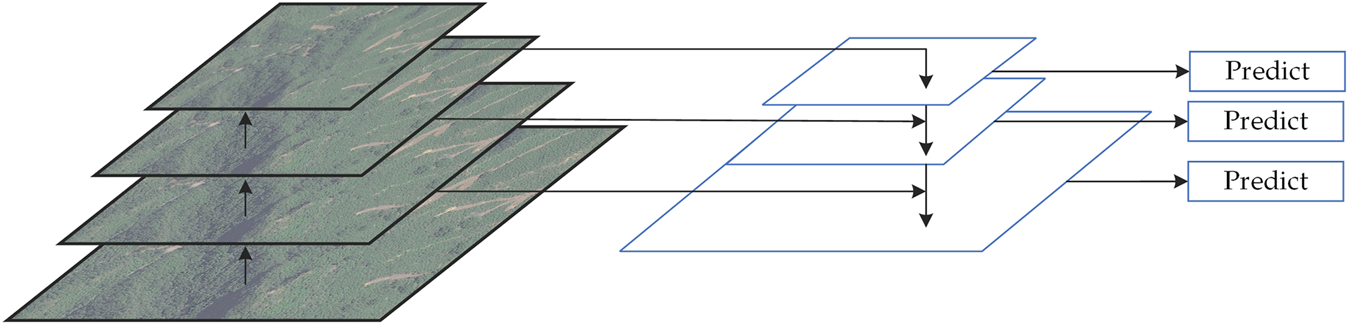
Mask R-CNN is an advanced deep learning model renowned for its simple training process, fast running speed, and superior performance in various applications. As shown in Figure 4, its basic architecture mainly includes a backbone network, an RPN, an ROI alignment module, and a mask segmentation network. (Fan B. S. et al., 2022; He et al., 2020).
FIGURE 4
Mask R-CNN network structure.
As depicted in Figure 5, the FPN layer primarily consists of a longitudinal path for bottom-up extraction of input image features by the ResNet network, a transverse path for feature fusion, and a top-down path. The ResNet network, serving as the feature extraction backbone, produces four stages of outputs in the FPN, denoted as (C2, C3, C4, and C5). These correspond to the four levels of the feature pyramid, representing the original image at resolutions of (1/4, 1/8, 1/16, and 1/32). The FPN layer integrates the low-resolution, high-semantic information from high-level features with the high-resolution, low-semantic information from low-level features through lateral connections, thereby leveraging rich semantic information across multiple scales (Lin et al., 2017).
FIGURE 5
FPN network structure.
The RPN layer receives the multi-scale features provided by the FPN layer and generates candidate regions, or proposals, according to predefined rules and through model training. The parameters of the trained model are then used to select the ROIs for the model, which in this experiment corresponds to potential shallow landslide areas. The selected ROIs are fed into the alignment network to more precisely adjust their positions to match the exact extent of the target. To accurately align the ROI with the precise spatial extent of the target, bilinear interpolation is first employed to derive values at multiple sampling points within the ROI. Max pooling is then applied to these sampled values to retain the most representative features, refining the ROI boundaries to better match the target’s geometric characteristics. Subsequently, the adjusted ROI is fed into a fully convolutional network (FCN) architecture, which constructs an end-to-end learning framework through alternating convolutional and deconvolutional layers. This network performs pixel-wise classification on the refined ROI, enabling the precise identification of all pixels belonging to shallow landslide targets. This process achieves end-to-end automatic identification of shallow landslides with high positional precision (Cai et al., 2022).
Mask R-CNN is a multitasking working network, and its loss function is weighted by the loss function of multiple branches as shown in the following Equation 1:
Where denotes the category loss function, denotes the regression frame loss function, and denotes the mask loss function. Where the specific expression of the loss function is as follows (Zhang and Chen, 2024):
The above equation indicates that the Sigmoid calculation is performed for each pixel to obtain the average of the cross-entropy of all pixels on the ROI as a loss function , where k denotes the class of the mask.
For each ROI, the mask branch generates an output with a dimensionality of k × m × m, where k denotes the number of target classes and m × m represents the spatial resolution of the masks. This output produces binary-encoded masks for k classes, each corresponding to an m × m-size segmentation map tailored to the ROIs semantic category. Specifically, as outlined in Equation 2, the loss function is computed by applying a sigmoid activation to each pixel within the ROI and calculating the average cross-entropy value across all pixels (Casagli et al., 2023; Canming et al., 2023; Ghorbanzadeh et al., 2022).
To better verify the recognition precision of the model, four precision evaluation methods, precision, recall, F1 score and mean intersection over union (mIoU), are used to evaluate the precision of the model. Among these metrics, Precision measures the overall correctness of the model’s identifications, while Recall focuses on addressing the issue of missed identifications of landslide areas by the model; the F1 score is used to balance Precision and Recall to avoid biases arising from a single metric, and mIoU—a core metric for evaluating the performance of semantic segmentation models. These four metrics are jointly employed to ensure the scientific rigor and accuracy of shallow landslide identification results, preventing the invalidation of evaluations caused by biases from relying on a single metric (Yuanzhen et al., 2020). The calculation method is as following Equation 3:
Where TP (true positive) represents the number of pixels correctly predicted to be positive, TN (true negative) represents the number of pixels correctly predicted to be negative, FP(false positive) represents the number of pixels misjudged to be positive by negative samples, and FN(false negative) represents the number of pixels missed by positive samples.
The experiment constructs a Mask R-CNN deep learning model using the PyTorch 1.14 framework and the MMdetection toolkit. The computational environment runs on a Windows 11 system equipped with a GTX 1660 6 GB GPU and an I9-12900 KS CPU, supported by 128 GB of Random Access Memory (RAM). During the model training phase, the input image resolution is set to 1,024 × 1,024 pixels, and Stochastic Gradient Descent (SGD) is utilized as the optimizer (Wu et al., 2022a; Wang L et al., 2024). To enhance the model’s learning capability, a stepwise learning rate adjustment algorithm is employed, which gradually reduces the learning rate over time. Hyperparameters are crucial for model training; specifically, the learning rate is set to 0.008, and the total number of training epochs is 1,000. The initial parameter sizes of the model are determined prior to training. Figure 6 displays the model’s training loss curve, showing a gradual convergence towards zero, which indicates a good fit between the validation set and the training outcomes. Upon completion of the training, the model’s precision can be assessed using standard evaluation metrics, including Recall and mean Average Precision (mAP) (Wang et al., 2022).
FIGURE 6
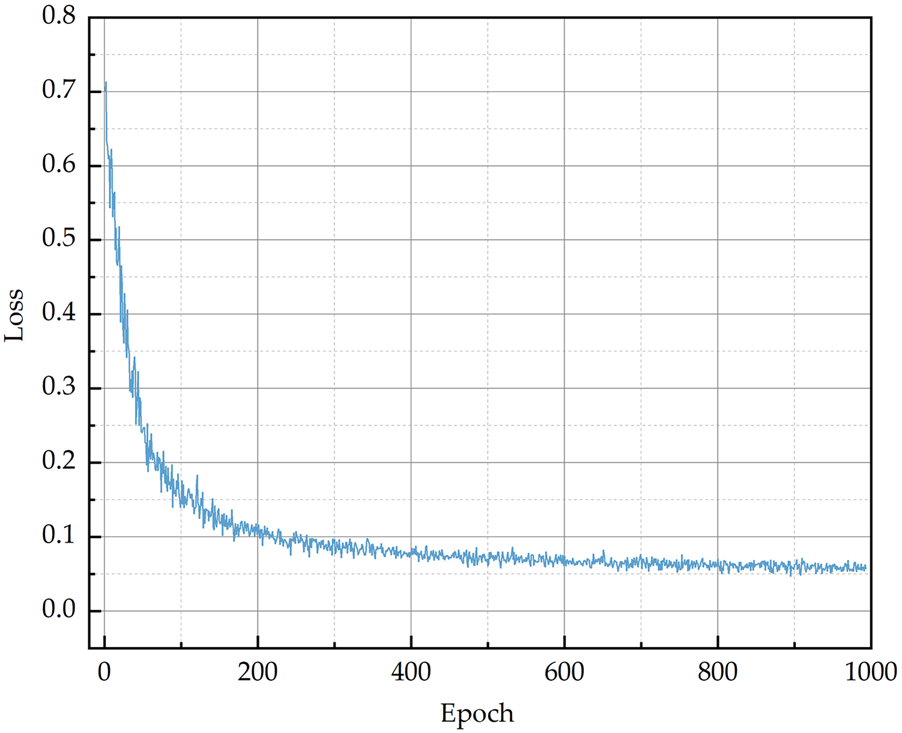
Regression error curve of the model during the training process.
2.4 Landslide characteristics and formation condition analysis
2.4.1 Landslide development characteristics analysis
The analysis of landslide developmental characteristics is grounded in the stratigraphic information of the study area, the disaster zones affected by landslides, and To give the statistical distribution of landslide areas, a probability density function is defined according to Equation 4 (Li J et al., 2024; Malamud et al., 2004):
Where, is the landslide disaster area, is the area increment, is the total number of landslide disasters, and is the number of all landslide disasters in the interval . After obtaining the scale-probability density of landslide disasters, a scale-probability density curve is plotted on a double logarithmic coordinate axis. The turning point of this curve serves as a threshold for classifying the scale of the current group-onset shallow landslides. Landslide areas exceeding this turning point are categorized as medium-to-large-scale landslides for the current event, while those below it are classified as small-scale landslides.
2.4.2 Spatial distribution pattern analysis
In the analysis of the spatial distribution pattern of landslides, a Geographic Information System (GIS)-based spatial statistical analysis method is employed (Lv et al., 2024). This method involves counting parameters such as slope, slope direction, elevation, profile curvature, plan curvature, and point density information for each landslide body, thereby facilitating a comprehensive analysis of the spatial distribution pattern within the study area.
The development of shallow landslides is a very complex process controlled by internal and external dynamic factors. Internal factors determine the development and development status of landslides, including geological structure, slope structure, stratigraphic lithology, etc., which are the basis for the development of shallow landslides; External factors can trigger landslides, including rainfall, road damage to the mountain, and so on. When selecting landslide evaluation factors, the geological structural conditions and climatic factors of the study area were taken into account. The elevation serves as the starting condition for landslides, providing potential energy for slope sliding; Different slope orientations can lead to variations in rainfall and vegetation, which in turn can affect the initiation of landslides; The slope mainly affects the internal stress distribution of the landslide body; Topographic Wetness Index (TWI) is used to describe surface moisture conditions, while Topographic Roughness Index (TRI) is used to describe surface roughness, both of which play a role in the occurrence of landslides to a certain extent. Plane curvature and section curvature are used to describe the steepness of landslide bodies, which in turn affects their initiation; The geological characteristics of the study area are determined by the geological basis of faults and stratigraphic lithology; NDVI reflects the type of Quaternary cover layer, which is also a major component of shallow landslides (Zhang et al., 2021); Precipitation, as the main initiating factor of landslides, directly affects the occurrence of landslides. Analogous CFD-based flow simulations in subsurface systems (Haroon et al., 2017) highlight the importance of accurately representing fluid–structure interactions for landslide triggering analysis.
An information-degree random forest model was used to analyze the geomorphic formation conditions of landslides and evaluate landslide susceptibility. The information-degree model quantifies landslide inducing conditions into information-degree values by measuring the scope of observed shallow landslides. These inducing conditions include multiple factors such as altitude, precipitation, and NDVI. First, reclassification is performed, then the information values of various categories of each factor are calculated, exploring the relationships between various factors and the information degree values of various factors. This process can comprehensively analyze the formation conditions of shallow landslide disasters and help reveal their potential relationships. The following method was used to calculate the evaluation of factor information as following Equation 5:
Where, I is the total information of the evaluation factor, Ni is the number of landslides of the factor within a category, N is the total number of shallow landslides in the study area, Si is the area of landslides of the factor within a category, S is the total area of shallow landslides in the study area. When the value of information is higher, it means that the factor is more favorable for landslide occurrence.
2.4.3 Landslide susceptibility analysis
Landslide susceptibility analysis using the SVM model. SVM can map data into a high-dimensional space via a kernel function, transforming data that is originally linearly inseparable into linearly separable data in this new high-dimensional space. This capability enables SVM to handle a wide range of complex classification tasks. The development of the law of landslide disaster is the result of a number of factors, its complex occurrence mechanism through the SVM model to analyze the more effective.
To address the scenario where the SVM model fails to correctly classify some sample data, a slack variable is introduced, and its constraint equation is as following Equation 6:
Where, X represents the sample, denotes the corresponding class. Meanwhile, a penalty factor c is introduced to adjust the degree of penalty for misclassified samples. The minimum value of is obtained through the following method, as shown in the Equation 7 below:
To solve the above equation, the Lagrange method can be employed. By solving the Lagrange dual problem, non-zero Lagrange multipliers in the suwhose mathematical expression is asbset of samples can be obtained, and thus the support vectors are derived. These support vectors are then used to construct the decision function expression for the generalized optimal hyperplane, which is used for classification. This expression is shown in the following Equation 8:
Where, denotes the Lagrange multiplier for each data sample, with .
For nonlinearly separable problems, SVM maps the original low-dimensional feature space to a high-dimensional feature space via a kernel function, enabling the data to become linearly separable in the high-dimensional space. The radial basis function (RBF) kernel can capture complex relationships in data and involves relatively straightforward parameter adjustment. Therefore, the RBF kernel was adopted as the kernel function for SVM, whose mathematical expression is as following Equation 9:
After introducing the kernel function, the SVM decision function for nonlinear sample data can be expressed as following Equation 10:
By combining the information amount model with the support vector machine model, the factors affecting the occurrence of landslide disasters are first calculated through information amount values. Determine the types of data to be input into the SVM model, then collect relevant data from areas affected by landslide disasters. Filter the data using Pearson correlation coefficient analysis. Correlations less than 0.2 are considered irrelevant, while those between 0.2 and 0.4 are considered weakly correlated. Factors with correlations greater than 0.4 are removed and considered to have high correlation. Then, determine the same number of areas where landslide disasters have not occurred and extract the same data from these areas. The Pearson correlation coefficient r is calculated as following Equation 11, where and represent two sets of variables respectively.
Use the two groups of data as a dataset to input into the SVM model, randomly dividing them into training and validation sets at a 7:3 ratio. The radial basis function (RBF) was selected as the kernel function of the model, with a kernel function cache of 200. The probability estimation method was adopted, and no iteration number was set, while the tolerance for stopping training was 0.001. Adjust the model parameters accordingly and train the model to obtain the final result of group sudden shallow landslide susceptibility.
The AUC metric is frequently used to measure the discriminative ability of binary classification models; therefore, it was selected as the performance evaluation metric for the I-SVM model in this study. The value range of AUC is [0.5, 1], where different values correspond to different levels of the model’s discriminative ability. The closer AUC is to 1, the better the model’s classification performance; when AUC equals 0.5, the model’s classification performance is the lowest, with no practical application value. In this study, the Wilcoxon-Mann-Whitney statistical method was employed to calculate the AUC metric, and the formula is as following Equation 12:
Where, denotes the number of landslide samples; enotes the number of non-landslide samples; I (·) is the indicator function; represents the predicted probability that the ith landslide sample is classified as a landslide; represents the predicted probability that the jth non-landslide sample is classified as a non-landslide. For the indicator function I (·), the assignment rule is defined as follows: I = 1, if , I = 0.5, if , I = 0, if .
3 Results and analysis
3.1 Mask R-CNN model identification results
Applying the Mask R-CNN model to the 95 km2 study area, a total of 1,406 shallow landslides were detected, predominantly distributed across the Luzishui-Puwa-Senshui corridor in Puwa Township. After comparison and verification with manual interpretation results, 1,237 of them were confirmed as correct identifications, with an identification precision of 88.04%, recall rate of 69.40%, F1 score of 77.79%, and mIoU of 64.37%. The model processing time for the entire study area was 303 s, with an average processing time of approximately 3.53 s/km2, indicating that the model has high processing efficiency.
Table 1 shows the performance comparison of Mask R-CNN model with several other commonly used deep learning models on the same dataset. Results show that Mask R-CNN performs best in terms of precision, recall rate, and F1 score, especially having obvious advantages in small-scale landslide identification. Compared with U-Net, PSPNet, and FCN, the mIoU of Mask R-CNN is 2.17%, 7.07%, and 10.06% higher respectively, indicating its superiority in boundary positioning and detail capture.
TABLE 1
| Method | Precision/% | Recall/% | F1 score/% | MIoU/% |
|---|---|---|---|---|
| FCN | 76.51 | 58.32 | 66.28 | 54.31 |
| PSPNet | 80.12 | 64.31 | 71.47 | 57.30 |
| U-Net | 82.35 | 65.23 | 73.02 | 62.10 |
| Mask RCNN | 88.04 | 69.40 | 77.79 | 64.37 |
Performance comparison of different deep learning models in landslide identification.
The model successfully detected the majority of landslides, with some omissions attributed to the lack of distinct features and the influence of vegetation coverage. The overall distribution pattern of the landslides shows a dense clustering. As shown in Figure 7, fewer landslides were detected in the central and upper parts of the study area, likely due to cloud cover interference.
FIGURE 7
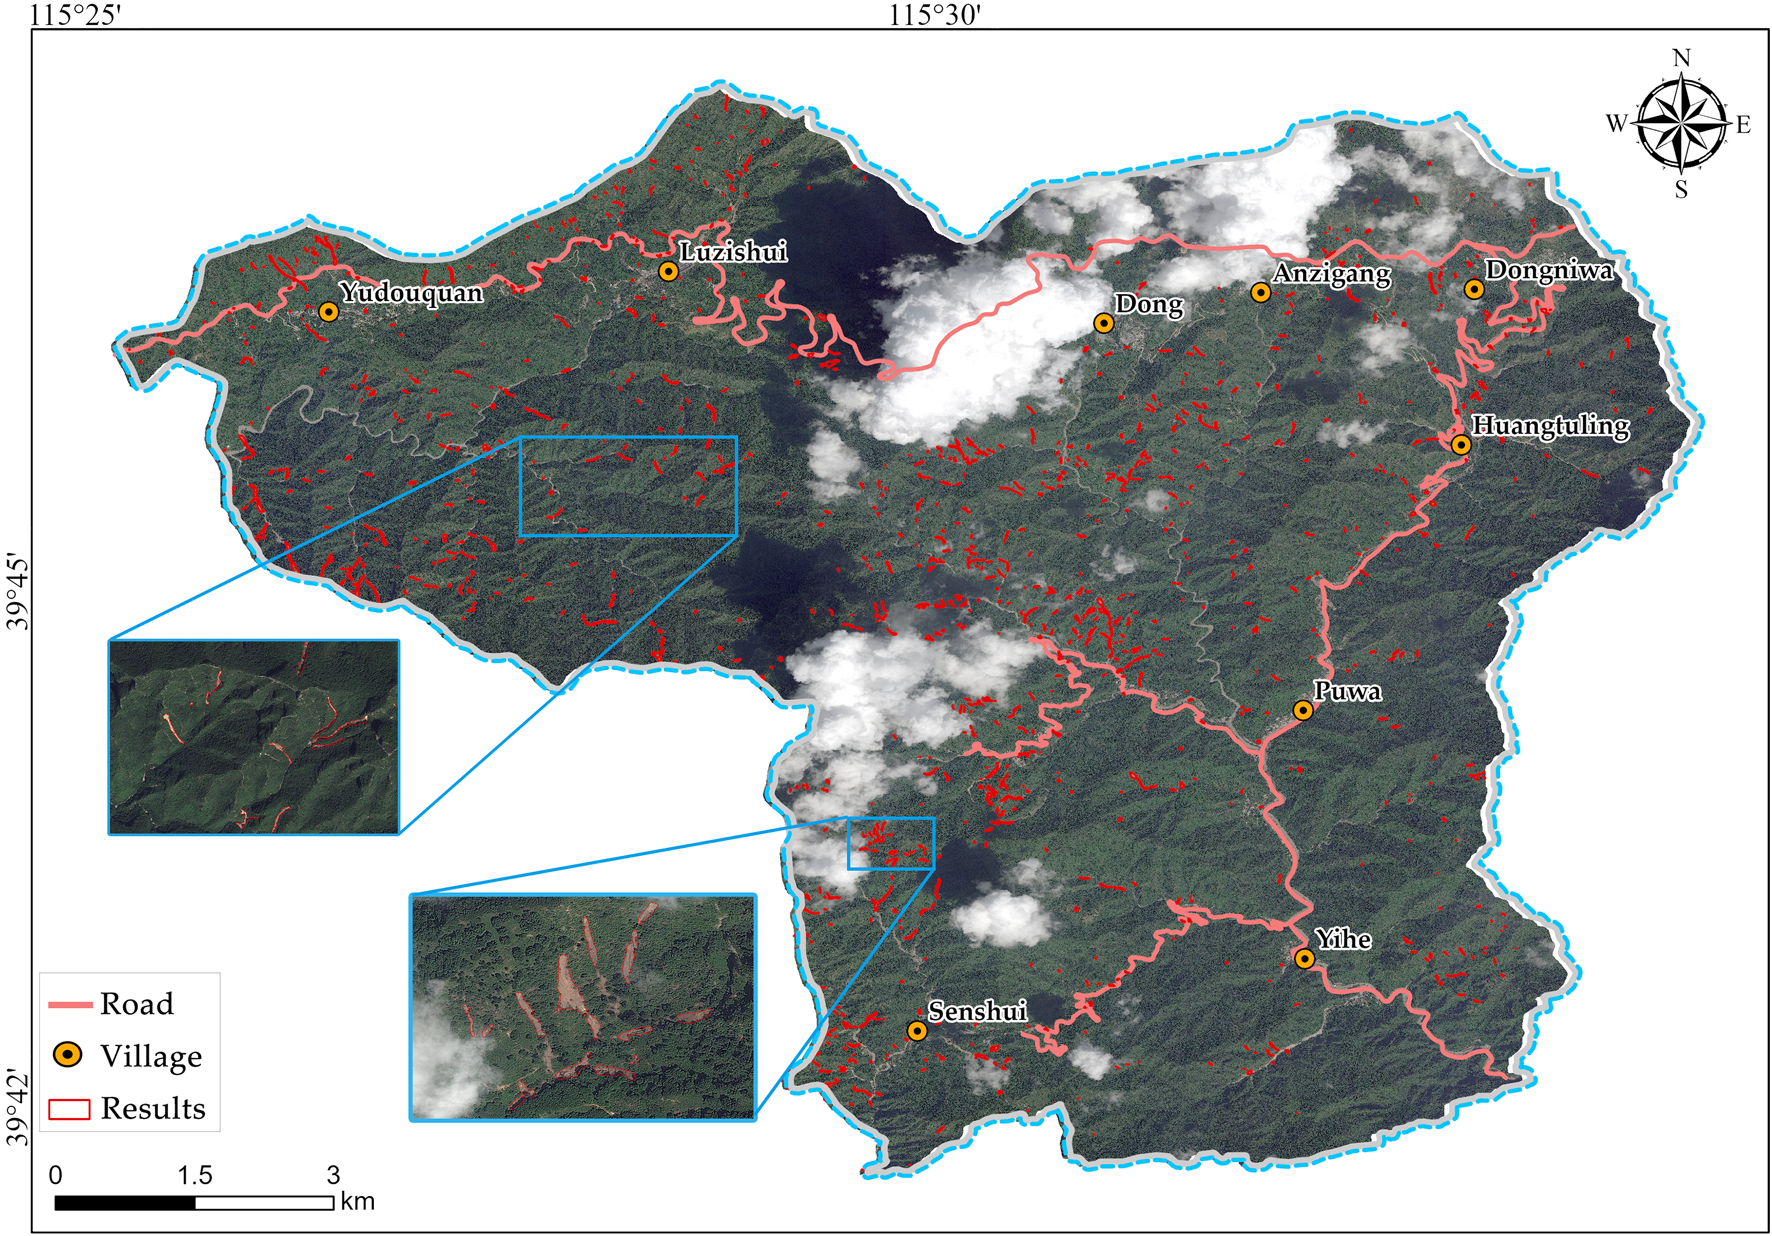
Model identification results.
To better demonstrate the model’s recognition performance, a close-up visualization of the results is presented in the following Figure 8.
FIGURE 8
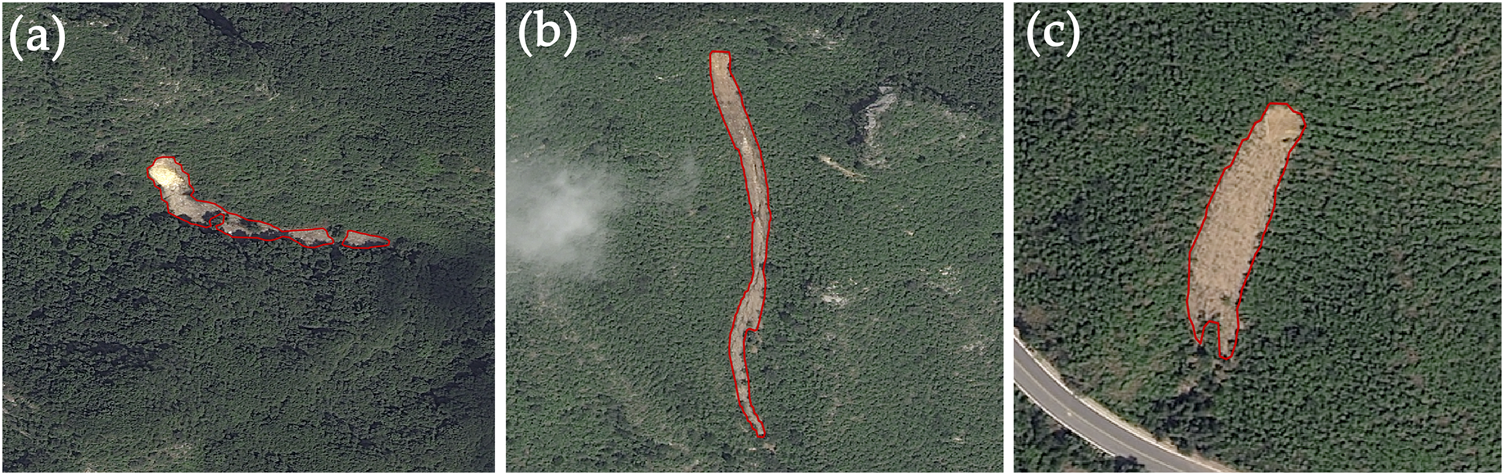
Local magnification results. (a) Landslide 1. (b) Landslide 2. (c) Landslide 3.
3.2 Landslide development characteristics analysis
According to the landslide area statistical analysis, the shallow landslide areas in the study area are mainly concentrated between 30 and 1,000 m2, accounting for approximately 91.7% of the total number of landslides. The probability density function of landslide area distribution is shown in Figure 9, and the landslide area probability density basically conforms to the inverse gamma distribution. On the double logarithmic coordinate, the landslide area and probability density show obvious segmented characteristics, with the inflection point appearing at approximately 800 m2. This inflection point divides landslides into small landslides (less than 800 m2) and medium to large landslides (greater than or equal to 800 m2). Small landslides account for 99.3% of the study area, while medium to large landslides only account for 0.7%, indicating that the study area is dominated by small shallow landslides.
FIGURE 9
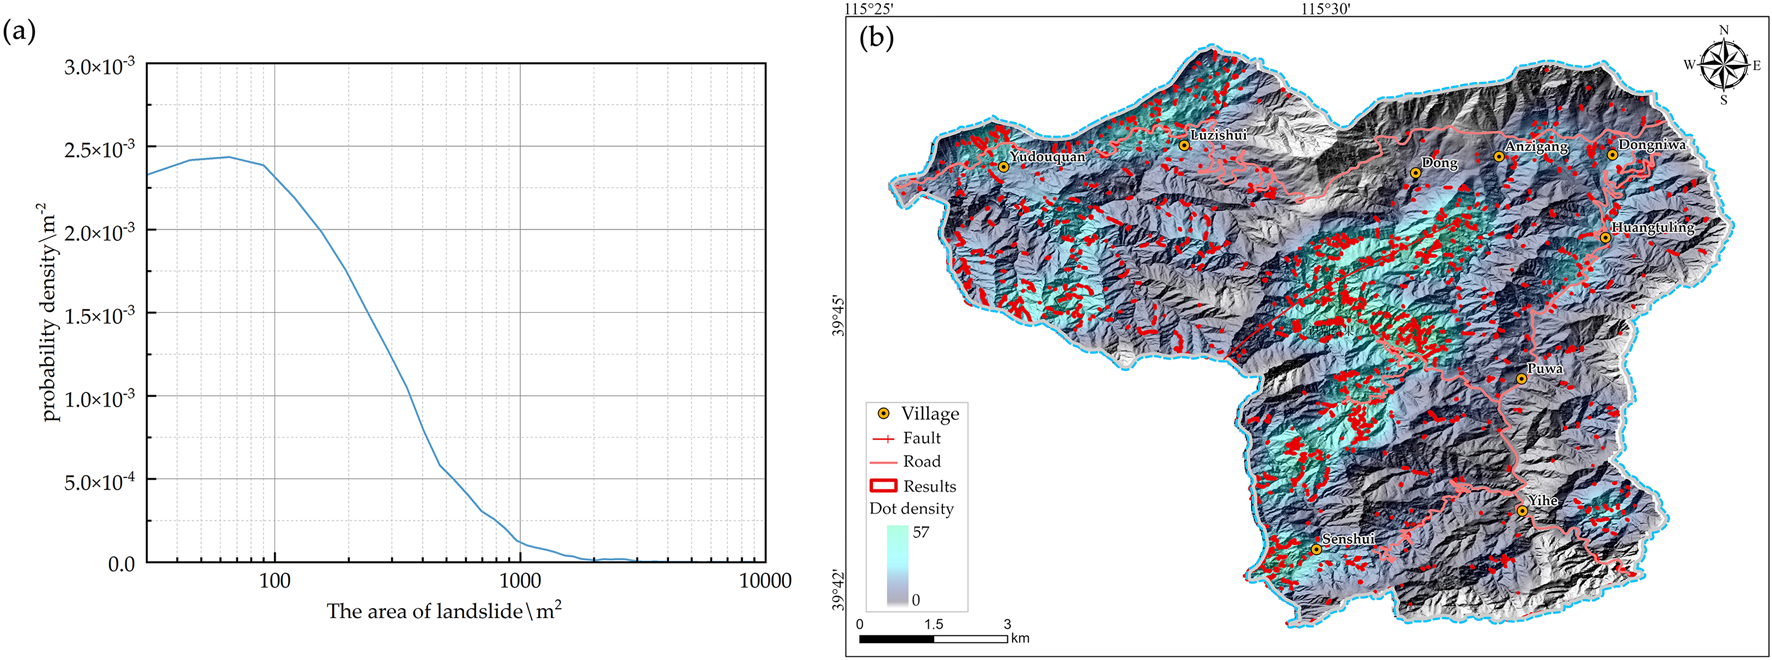
(a) Landslide area-probability density distribution map. (b) Point density map.
The landslide area is small compared to the scale of other occurrence-intensive landslides. The total area of landslides is about 5.111 km2, accounting for about 5.52% of the area of the study area, and the characteristics of landslides in the study area are typical. According to the analysis of landslide scale, landslides are mainly small landslides, accounting for 99.3%, and the number of mdium-scale landslides is relatively small, accounting for 0.7%. According to the scale probability density formula for statistics, the scale-probability density of landslide hazards in the study area basically conforms to the inverse gamma distribution. After taking the double logarithm of the scale and probability density of landslides, it is as shown in Figure 9. After the landslide area reaches the turning point, the landslide conforms to the power law distribution characteristics, and the probability density gradually decreases with the increasing landslide area (Xu et al., 2024; Fan X. M. et al., 2022; Ji et al., 2020).
Spatial analysis of the landslide occurrence area using the point density method, as shown in Figure 9, the distribution of landslide area has a certain spatial distribution characteristic, on both sides of the river, shallow landslides are more concentrated, with the highest point density of 57/km2, at the same time, there is a fracture zone passing through the study area, and the landslides near the fracture zone are also more developed.
3.3 Spatial distribution pattern analysis
GIS-based spatial statistical analysis (Figure 10) shows that shallow landslides in the study area show obvious regularity in spatial distribution. Landslides are mainly distributed in the elevation range of 540–1,080 m, accounting for 82.6% of the total number of landslides. This elevation interval corresponds to the middle and high mountainous areas of the study area, where the terrain fluctuates greatly and the slope is steep, making it a high-incidence area for debris flows and shallow landslides.
FIGURE 10
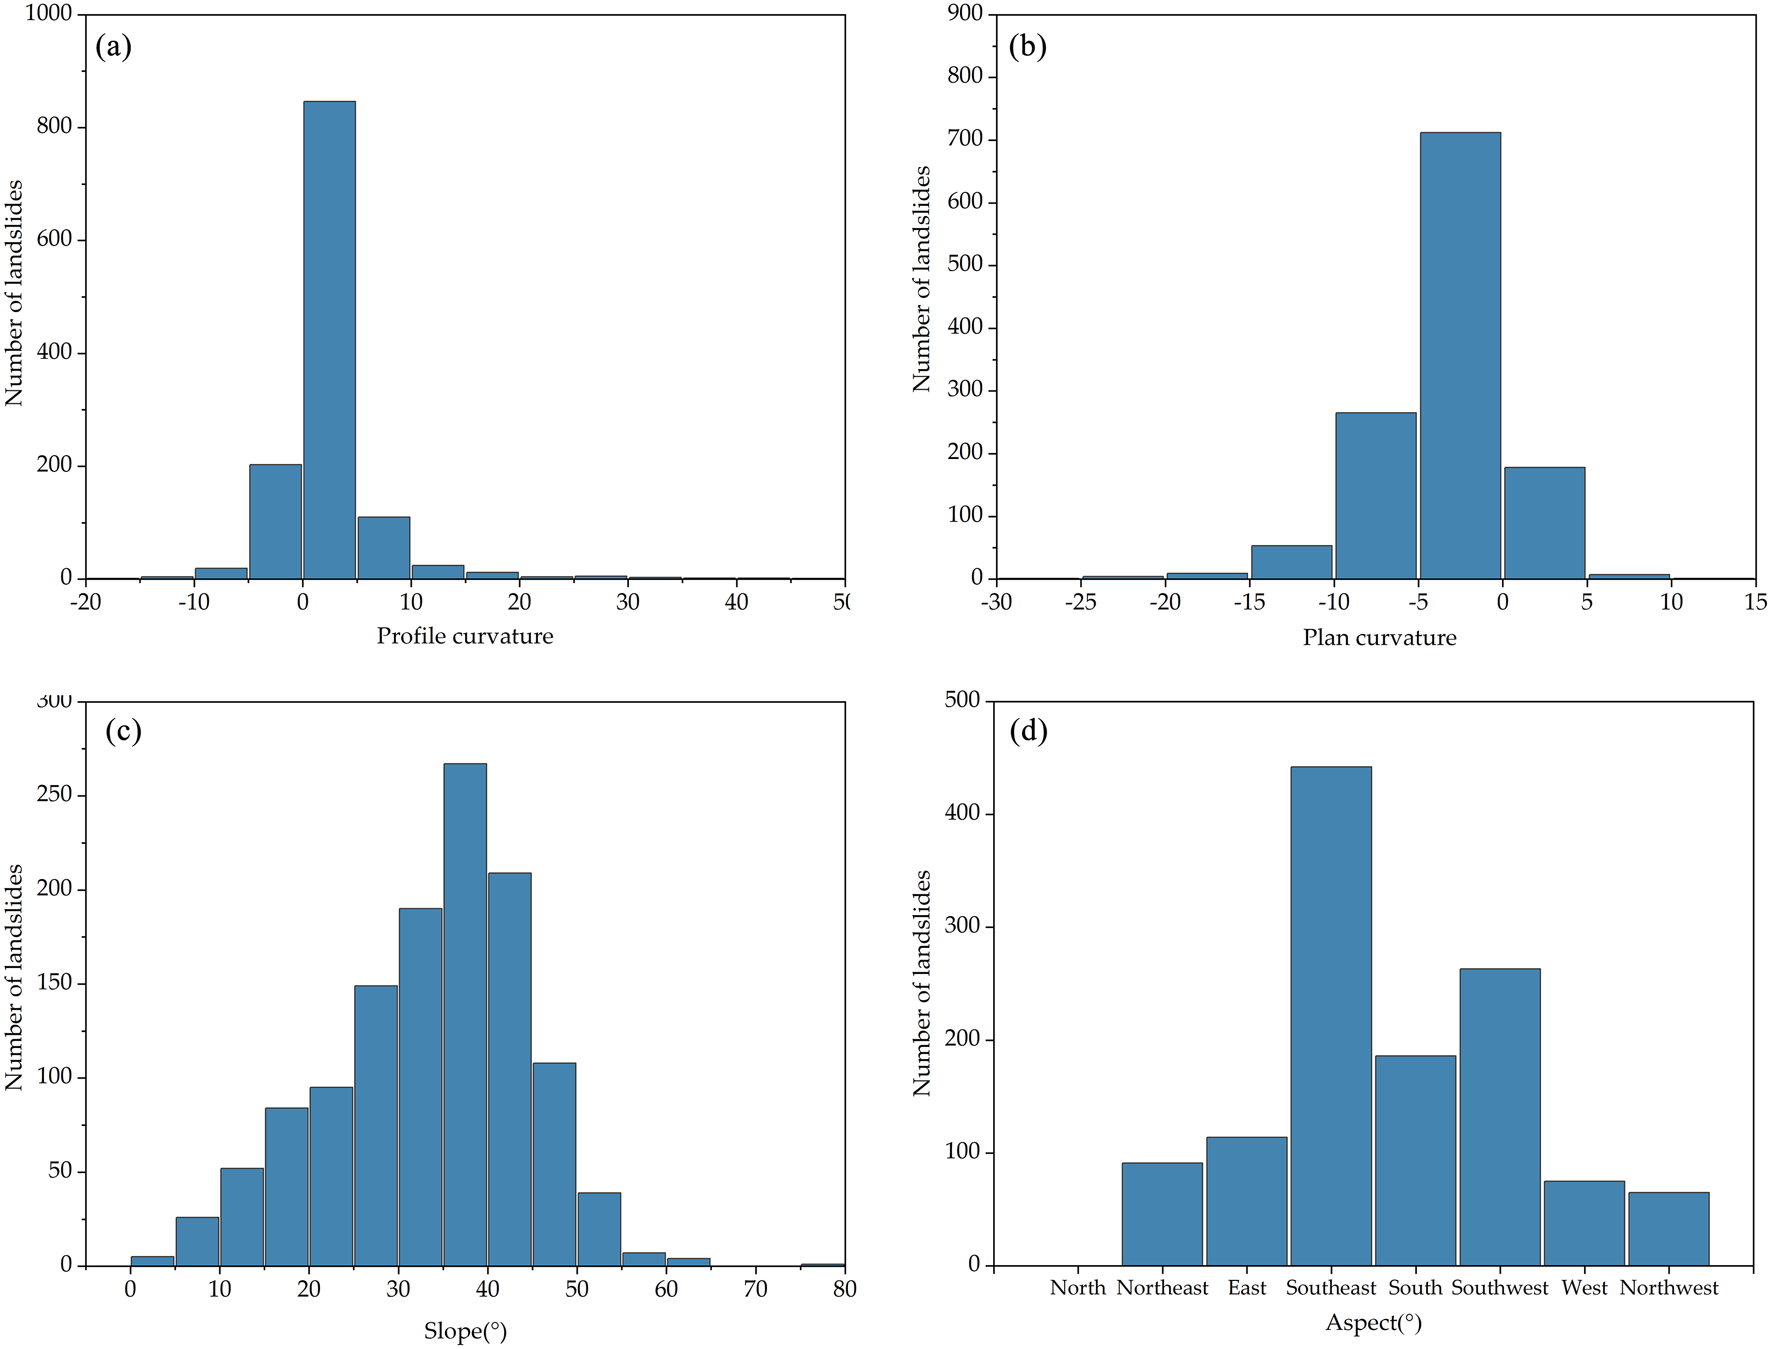
(a) Histogram of vertical curvature distribution; (b) Histogram of horizontal curvature distribution; (c) Histogram of slope distribution; (d) Histogram of slope direction distribution.
The distribution of landslides in different aspects also shows obvious differences. As shown in Figure 10, landslides are mainly distributed in southeast, south, and southwest aspects, with the largest number of landslides in the southeast aspect, accounting for 36% of the total. This phenomenon is related to the climate characteristics of the Beijing area. The southeast aspect is more affected by the southeast monsoon in summer, with more concentrated precipitation and longer sunshine duration, which may lead to differences in vegetation coverage and soil characteristics.
Slope analysis shows that landslides in the study area mainly occur in the slope range of 25°–55°, accounting for 73.5% of the total number of landslides. Among them, the slope interval of 30°–40° has the most concentrated landslides, accounting for 44% of the total. This is consistent with theoretical analysis because within this slope range, the gravitational force and rainwater scouring effect reach equilibrium, making it most prone to shallow landslides.
Plan curvature and profile curvature analysis show that landslides are mainly distributed in areas with negative plan curvature (concave slopes) and positive profile curvature (convex slopes). Specifically, landslides are most concentrated in areas with plan curvature between −20 and 10 and profile curvature between −5 and 10. This indicates that landslides tend to occur in areas with obvious topographic changes, such as gully sources, near ridge lines, and slope change points.
Point density analysis shows that landslides show obvious aggregation characteristics in space, mainly concentrated in the northwestern and central parts of the study area. The landslide density along both sides of river channels and near fault zones is the highest, reaching 57/km2, while the landslide density far from these areas decreases significantly. This indicates that hydrological conditions and geological structures have important influences on the spatial distribution of landslides.
3.4 Landslide formation condition analysis
The method of reclassifying the factors was used to calculate the information content of each factor in different classification situations using the information content method (Dai et al., 2017), as shown in Figure 11; Table 2. By analyzing 13 potential landslide influencing factors through the information value model (Table 2), the information values of each factor were obtained, with results showing significant differences in their contribution to landslide occurrence: among topographic factors, the slope >40° has an information value of 0.239, indicating that steep slopes are conducive to landslide occurrence; elevation at 1,300–1,500 m and >1,500 m has information values of 1.553 and 1.872 respectively, suggesting higher landslide risk in high-altitude areas; plan curvature >0 has an information value of 1.113, meaning concave slopes are more prone to landslides; and profile curvature <0 has an information value of 1.21, indicating that convex terrain promotes landslides; for meteorological factors, rainfall in the 200–450 mm range has the highest information value of 0.703 among all factors, showing a high correlation with landslide occurrence, while rainfall >700 mm has an information value of −0.047, implying that extremely high-intensity rainfall may lead to different disaster types (such as mudslide); regarding vegetation factors, NDVI in the 0 to 0.069 range has an information value of 0.410, indicating that areas with low vegetation coverage are more prone to landslides, and as NDVI increases, the information value gradually decreases, with NDVI >0.373 having an information value of −0.340, showing that dense vegetation inhibits landslides; in terms of geological factors, the distance from faults within 0–1,500 m has an information value of 0.068, indicating slightly higher landslide risk in areas near faults, and relatively hard rock lithology has an information value of 0.50, meaning areas covered with relatively hard rock are more prone to landslides; for human activity factors, the distance from roads within 0–750 m has an information value of 0.004, indicating that areas near roads have slightly higher landslide risk, though the impact is not significant.
FIGURE 11
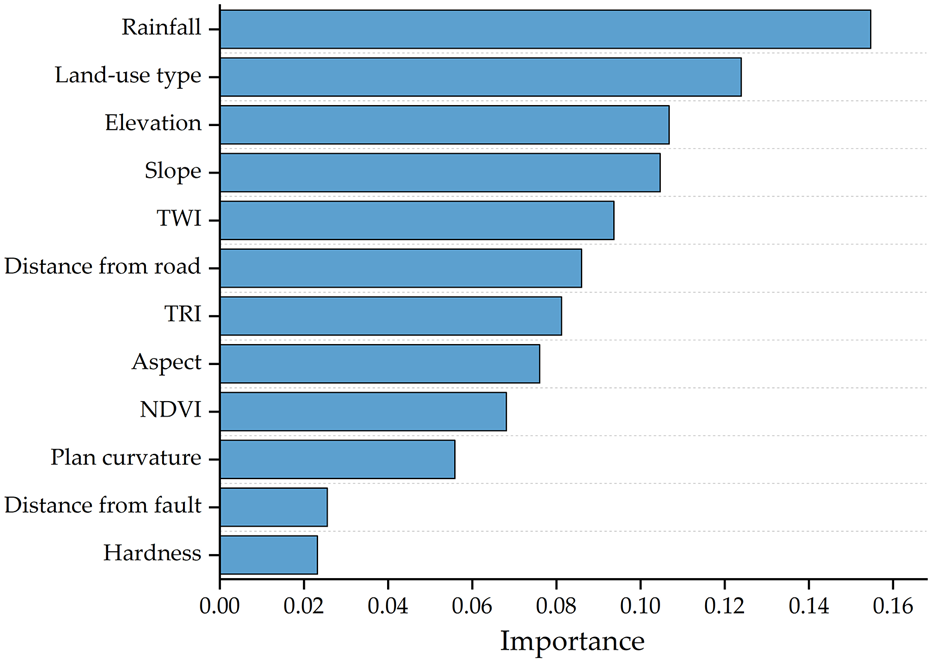
Importance ranking chart of influencing factors.
TABLE 2
| Factor | Category | Proportion/% | Proportion of area/% | I-value | Factor | Category | Proportion/% | Proportion of area/% | I-value |
|---|---|---|---|---|---|---|---|---|---|
| Elevation/m | 300∼500 500∼700 700∼900 900∼1,100 1,100∼1,300 1,300∼1,500 >1,500 |
1.46 27.08 46.00 21.42 3.72 0.08 0.16 |
1.62 25.97 48.53 21.32 2.41 0.02 0.12 |
−0.108 0.042 −0.054 0.005 0.433 1.553 1.872 |
Rainfall/mm | 0∼200 200∼450 450∼700 >700 |
11.72 0.08 21.58 66.61 |
10.05 0.04 20.06 69.85 |
0.154 0.703 0.073 −0.047 |
| Slope (°) | 0∼10 10∼20 20∼30 30∼40 40∼90 |
2.39 13.07 22.66 45.07 16.81 |
2.91 11.24 20.94 43.57 21.34 |
0.196 −0.151 −0.079 −0.034 0.239 |
Plan curvature | <0 0 >0 |
35.08 60.79 4.12 |
29.13 69.51 1.35 |
0.186 −0.134 1.113 |
| Aspect (°) | Northeast East Southeast South Southwest West Northwest |
7.36 9.22 35.73 15.04 21.26 6.06 5.25 |
5.40 10.43 30.93 19.16 19.90 9.04 5.12 |
0.308 −0.123 0.144 −0.242 0.066 −0.400 0.026 |
Profile curvature | <0 0 >0 |
3.96 86.01 10.02 |
1.19 91.48 7.33 |
1.21 −0.06 0.31 |
| TWI | −1.181∼5.184 5.184∼10.348 10.348∼15.872 15.872∼23.078 |
54.89 40.34 4.61 0.16 |
50.01 46.30 3.60 0.08 |
0.093 −0.138 0.246 0.649 |
Hardness | Hard rock Harder rock |
99.27 0.73 |
99.56 0.44 |
0.00 0.50 |
| TRI | 0.1∼1 1∼2 2∼3 >3 |
35.97 58.77 4.77 0.40 |
37.15 59.55 3.24 0.04 |
−0.032 −0.013 0.387 2.211 |
NDVI | 0∼0.069 0.069∼0.19 0.19∼0.287 0.287∼.373 0.373∼0.55 |
8.16 29.10 35.33 19.73 7.68 |
5.42 28.09 33.14 22.56 10.79 |
0.410 0.036 0.064 −0.134 −0.340 |
| Land-use type | Cultivated land Shrub Woodland Grass |
2.10 1.62 53.35 42.93 |
4.64 1.07 53.46 40.83 |
−0.791 0.416 −0.002 0.050 |
Distance from road | 0∼750 750∼1,250 1,250∼2,250 2,250∼3,250 3,250∼4,000 |
37.03 20.05 34.28 6.55 2.10 |
36.89 17.42 32.21 10.65 2.83 |
0.004 0.140 0.062 −0.486 −0.297 |
| Distance from fault | 0–1,500 1,500–2,500 2,500–3,500 3,500–6,000 6,000–8,000 |
20.53 15.84 22.47 32.58 8.57 |
19.19 16.18 24.19 33.12 7.31 |
0.068 −0.021 −0.074 −0.016 0.159 |
Landslide indicator factor grading and informative values.
To better illustrate the degree of importance of the influencing factors, the factors were sorted in descending order of their importance based on the amount of information they carry, and the histogram presented below was plotted (Figure 12).
FIGURE 12
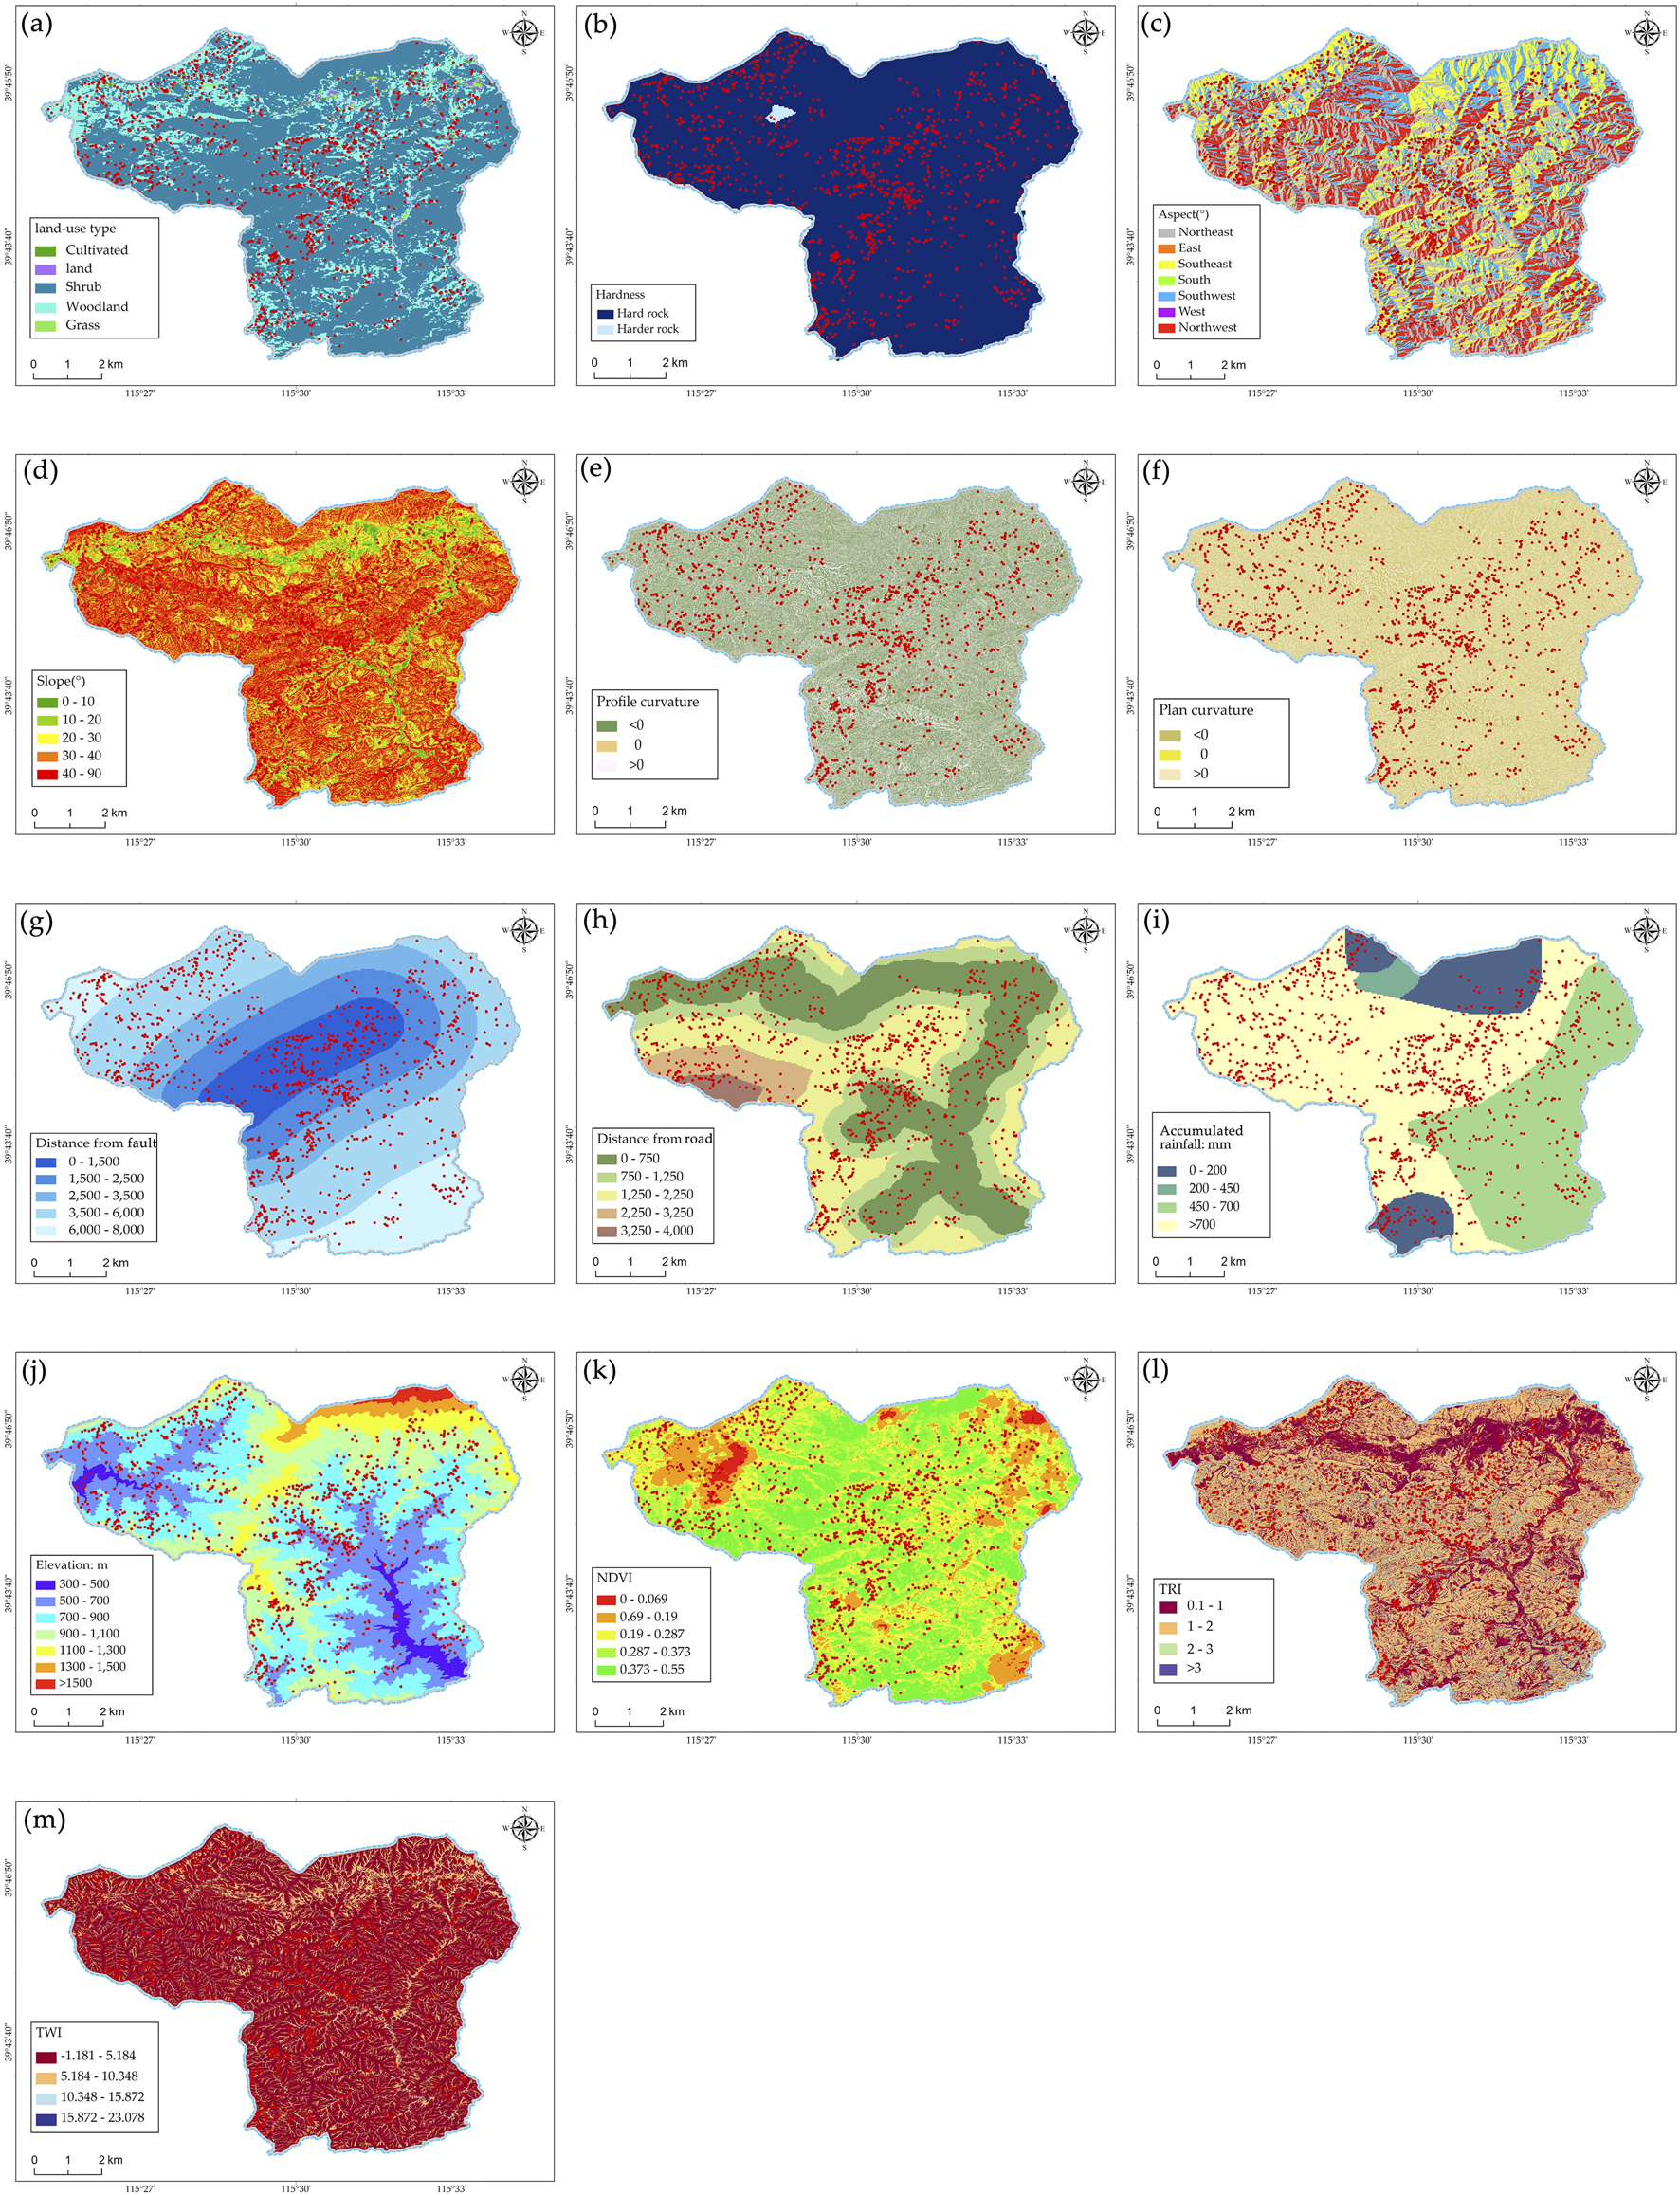
Plan of evaluation factors. (a) Land-use type; (b) Hardness; (c) Aspect; (d) Slope; (e) Profile curvature; (f) Plan curvature; (g) Distance from fault; (h) Distance from road; (i) Accumulated rainfall; (j) Elevation (k) NDVI; (l) TRI; (m) TWI.
Using pearson correlation coefficient to analyze the correlation between factors (Figure 13), it was found that there is a high correlation (r = 0.72, p < 0.01) between TRI and TWI. In the I-SVM model, influencing factors are mapped into a high-dimensional feature space by means of a kernel function, and an optimal hyperplane is then identified to distinguish between landslide areas and non-landslide areas. The rationality of the model’s parameters directly depends on the independent information value of these influencing factors; strong correlation among factors undermines this foundation and increases the risk of overfitting. Therefore, in subsequent analyses, the two factor was excluded to avoid multicollinearity issues. The correlation between other factors is low (r < 0.4), indicating that they can be independently used for landslide susceptibility analysis.
FIGURE 13
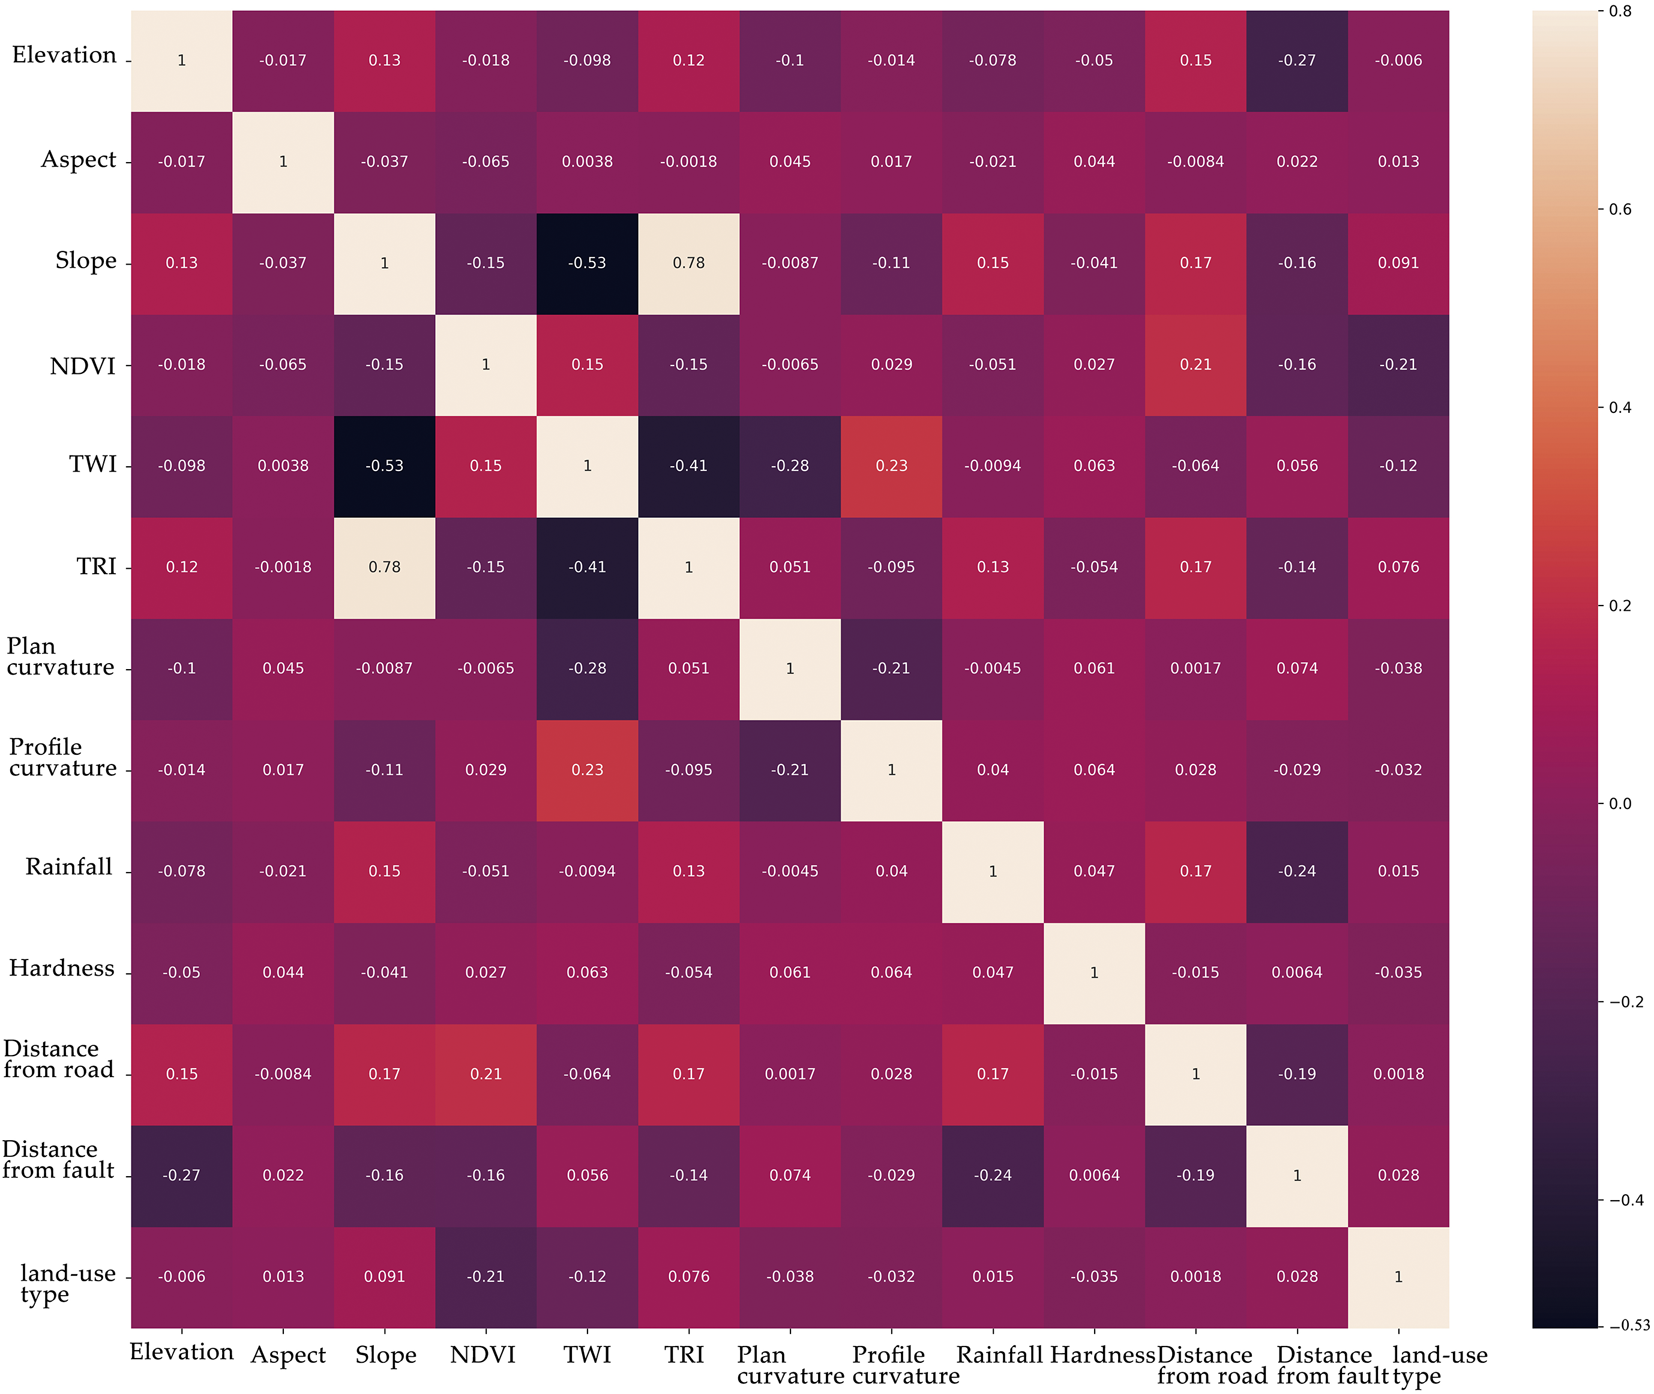
Correlation of contributing factors.
3.5 Landslide susceptibility assessment
An I-SVM landslide susceptibility model was constructed by combining the information value model with SVM, wherein 12 landslide influencing factors were first weighted using information values, and the weighted factors were then used as input to the SVM model. Model performance was evaluated using Receiver Operating Characteristic (ROC) curves and AUC indicators, with results showing the I-SVM model achieved an AUC value of 0.97 (Figure 14), indicating high prediction precision.
FIGURE 14
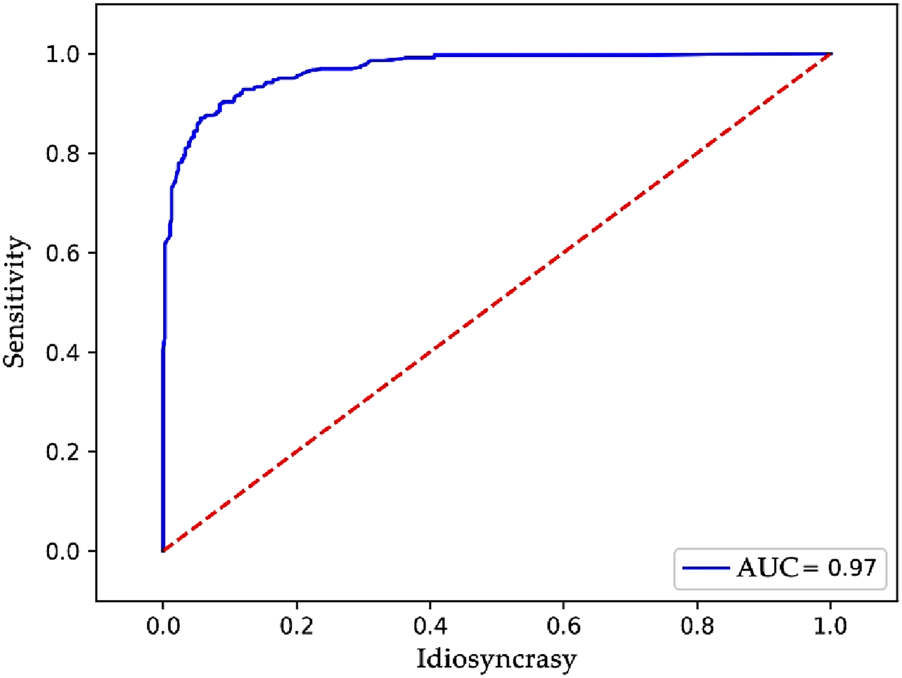
ROC curve Diagram.
Because the resolutions of each factor are different, factor extraction should be performed at the same resolu-tion for each factor. We use an optical resolution of 0.3 m as the minimum analysis unit. Input the extracted factors into the I-SVM model for landslide susceptibility under extreme rainfall conditions. We used the I-SVM model to analyze the landslide susceptibility under extreme rainfall conditions in the study area. We obtained the distribu-tion map of landslide susceptibility in the study area through the analysis, as shown in Figure 15. Using the natural breakpoint method, landslide susceptibility is classified into four levels: low, medium, high, and very high, by search-ing for crack points within the landslide probability dataset. Through the analysis, it can be seen that the landslide disaster susceptibility area is mainly concentrated in the vicinity of the villages of Dong, Anzigang, and Dongniwa. Attention should be paid to evacuation and relocation planning for these villages under the conditions of extreme rainfall. The rainy season should be cleared of mudslide material sources in the river channel to avoid mudslides and other disasters that threaten the safety of the villagers. When the rainy season comes, the source of mudslide materials in the river should be cleared in time to avoid rainfall-triggering mudslides and other disasters that threaten the safety of villagers.
FIGURE 15
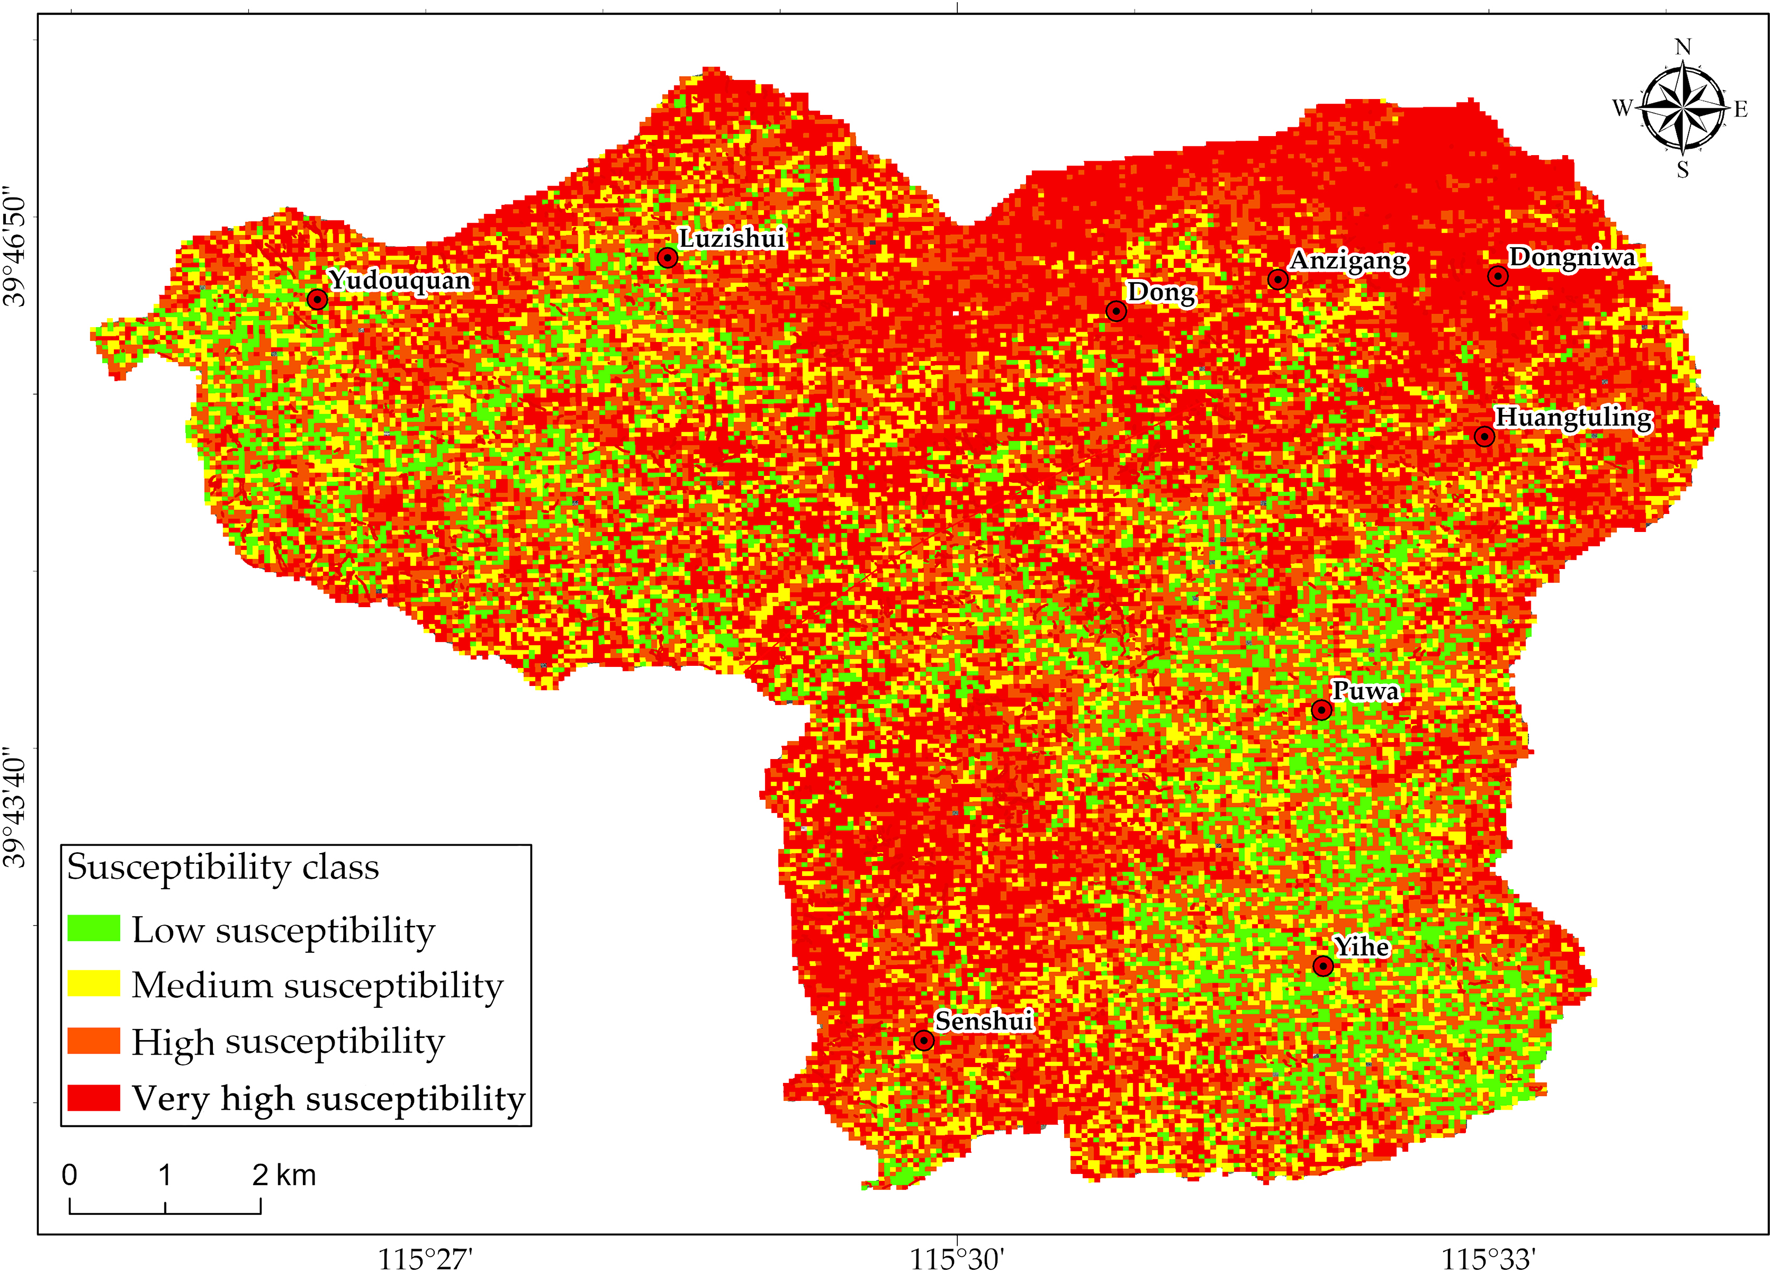
Evaluation of shallow landslide susceptibility under extreme rainfall conditions in Puwa Township.
4 Conclusion
In July 2023, extreme rainfall in Beijing triggered a mass of shallow landslides in the western mountainous area. In this study, we chose Puwa Township, Fangshan District, as the interesting area for the study of automatic identi-fication and triggering analysis of shallow landslide hazards. In this study, we first applied the Mask R-CNN deep learning model to automatically identify shallow landslides in Puwa Township, compiled a landslide inventory, and performed spatial and susceptibility analyses for both occurred and potential shallow landslides in the study area.
1. Against the scarcity of public high-resolution datasets for extreme rainfall-induced shallow landslides, this study, for the first time, constructed a region-specific shallow landslide dataset targeting the July 2023 extreme rainfall event in Beijing. The dataset was developed based on high-precision optical images from the Chinese-developed BJ-3 satellite. After applying the Mask R-CNN model to automatic landslide identification, the study achieved a precision of 88.04%, a recall rate of 69.40%, and a total processing time of merely 303 s. This approach outperforms traditional manual interpretation significantly in terms of efficiency and surpasses low-resolution image-based identification methods in terms of precision. From the identification results, shallow landslides in the study area cover a total area of 5.11 km2, accounting for 5.52% of the study area’s total extent, and exhibit a distinct clustering pattern. This outcome provides a robust data foundation for subsequent analytical work.
2. Through spatial statistical analysis, this study for the first time revealed that the scale-probability density of shallow landslides in Puwa Township conforms to an inverse gamma distribution. Specifically, shallow landslides in the study area are predominantly small-to-medium-sized, with their probability density decreasing as their area increases. To further refine the analysis, the study integrated multi-dimensional spatial analysis to precisely delineate the core landslide distribution zones: elevations ranging from 540 to 1,080 m, steep slopes, concave slope profiles, along riverbanks, and in the vicinity of fault zones. This finding advances the understanding of topographic controlling factors for shallow landslides in the northern mountainous regions of China.
3. The I-SVM landslide susceptibility model was used to analyze the susceptibility of the study area, and the probability of shallow landslides in Dong, Anzigang, and Dongniwa villages was very high under extreme rainfall conditions. The AUC metric of the landslide susceptibility model was 0.97, which proved to a certain extent that the I-SVM coupled model has a higher precision in the evaluation of the susceptibility to landslides in the region. In light of the spatial distribution characteristics of the landslide-prone areas (Dong Village, Anzigang Village, and Dongniwa Village), it is proposed to construct a hierarchical monitoring system integrating satellite remote sensing and ground-based monitoring. Specifically, equipment such as automatic rainfall stations and Global Navigation Satellite System (GNSS) should be deployed to realize real-time data transmission to the early warning platform. Furthermore, quarterly unmanned aerial vehicle (UAV) inspections combined with Interferometric Synthetic Aperture Radar (InSAR) monitoring are recommended to achieve early identification of potential disasters.The evaluation results of this paper can provide certain reference and suggestions for landslide disaster prevention and control in Puwa Township.
However, this study also has limitation. Model performance is highly dependent on the quality and quantity of training data. Due to the lack of public high-resolution landslide data set, the data set constructed in this study is mainly based on the “23–7″ event in Beijing, and limited by the problem of obtaining high-resolution data, it has not been applied to other regions. The next step is to carry out the extraction experiment of shallow landslide in other areas to verify the robustness of the model.
While this study provides valuable insights for landslide prevention and mitigation, it has the following limitations that require improvement.
1. Limitations in Data Coverage and Dimensions. First, the constructed dataset is highly dependent on a specific event—namely, the July 2023 extreme rainfall event in Beijing—and lacks support from data corresponding to other rainfall scenarios or different disaster seasons. Additionally, the dataset is deficient in key soil mechanical parameters and high-resolution human activity data. The absence of such information may weaken the model’s ability to capture the physical mechanisms underlying landslide initiation and the impacts of anthropogenic disturbances.
2. Limitations in Regional Generalizability. This study was conducted exclusively in Puwa Township, which is located in North China, China, and features specific geological and topographic contexts. Its applicability in other geomorphic regions—such as Southwest China—remains to be explored.
To address the aforementioned limitations, future research will focus on: integrating data from multiple regions and rainfall events; supplementing in-situ soil mechanical parameters and high-resolution human activity data to establish a multi-scenario, multi-dimensional shallow landslide dataset covering mountainous areas across China; and conducting validation of the optimized model in regions like the Yunnan-Tibet Plateau and the Yunnan-Guizhou Plateau, with parameter adjustments to adapt to the characteristics of different regions.
Statements
Data availability statement
The raw data supporting the conclusions of this article will be made available by the authors, without undue reservation.
Author contributions
WZ: Writing – original draft, Writing – review and editing. JH: Writing – review and editing, Methodology. RJ: Data curation, Writing – review and editing. ML: Writing – review and editing, Funding acquisition. WG: Writing – review and editing, Validation. CM: Validation, Writing – review and editing.
Funding
The author(s) declare that financial support was received for the research and/or publication of this article. This research was funded by the Beijing Natural Science Foundation (8244062); the Key Technology Research Project for Comprehensive Remote Sensing Identification and Monitoring of Sudden Geological Hazard Risks in Megacities (2023ZRBSHZ046); the early identification and early warning of typical geological disasters in Xishan, Beijing Demonstration Study (11000022T000001362678); Research Project on Intelligent Early Recognition Methods and Prevention Strategies for Typical Collapse and Landslide Hazards in Beijing (bjkx202311); Operation of the Beijing Sudden Geological Disaster Monitoring and Early Warning System Project (11000023T000002124048).
Acknowledgments
We are very grateful for the free access to GLC_FCS30-2020 land-cover products provided by professor Liu (https://doi.org/10.5281/zenodo.3986872).
Conflict of interest
The authors declare that the research was conducted in the absence of any commercial or financial relationships that could be construed as a potential conflict of interest.
Generative AI statement
The author(s) declare that no Generative AI was used in the creation of this manuscript.
Any alternative text (alt text) provided alongside figures in this article has been generated by Frontiers with the support of artificial intelligence and reasonable efforts have been made to ensure accuracy, including review by the authors wherever possible. If you identify any issues, please contact us.
Publisher’s note
All claims expressed in this article are solely those of the authors and do not necessarily represent those of their affiliated organizations, or those of the publisher, the editors and the reviewers. Any product that may be evaluated in this article, or claim that may be made by its manufacturer, is not guaranteed or endorsed by the publisher.
References
1
Canming Y. Qihang L. Wen N. Chunyang Y. (2023). A depth information-based method to enhance rainfall-induced landslide deformation area identification. Measurement219, 113288. 10.1016/j.measurement.2023.113288
2
Cai H. J. Han H. H. Zhang Y. L. Wang L. S. (2022). Convolutional neural network landslide recognition based on terrain feature fusion. J. Earth Sci. Environ.44, 568–579. 10.19814/j.jese.2021.12016
3
Casagli N. Intrieri E. Tofani V. Gigli G. Raspini F. (2023). Landslide detection, monitoring and prediction with remote-sensing techniques. Nat. Rev. Earth and Environ.4, 51–64. 10.1038/s43017-022-00373-x
4
Chen Z. Lu S. K. Tan Z. J. Zhang Q. (2022). SENet-optimized Deeplabv3+Landslide detection. Sci. Technol. Eng.22, 14635–14643. 10.3969/j.issn.1671-1815.2022.33.011
5
Chen W. H. Yu B. Liu K. Ye L. Z. Ma Y. (2023). Fast recognition method for debris flows caused by shallow landslides. Yangtz River.54, 152–158. 10.1007/s11069-023-06229-x
6
Cheng G. Xie X. Han J. Guo L. Xia G. S. (2020). Remote sensing image scene classification meets deep learning: challenges, methods, benchmarks, and opportunities. Ieee J.-Stars13, 3735–3756. 10.11834/jrs.20210597
7
Dai L. X. Xu Q. Fan X. M. Chang M. Yang Q. Yang F. et al (2017). A preliminary study on spatial distribution patterns of landslides triggered by JiuZhaiGou earthquake in SiChuan on August 8TH, 2017 and their susceptibility assessment. J. Eng. Geol.25, 14. 10.13544/j.cnki.jeg.2017.04.030
8
Deng Z. F. Huang H. F. Li Q. Q. Zhou H. Zhang R. Liu Q. et al (2024). Identification of soil landslides at the head of the three GorgesReservoir based onswin transformer target panoramic segmentation. WaterResources Hydropower Eng.55, 176–185. 10.13928/j.cnki.wrahe.2024.04.016
9
Du P. Chen N. S. Wu K. L. Li Z. Zhang Y. Y. L. (2024). Evaluation of landslide susceptibility in southeast Tibet based on a random forest model. J. Chengdu Univ. Technology(Science&TechnologyE dition).51, 328–344. 10.3969/j.issn.1671-9727.2024.02.12
10
Fan B. S. Zuo Y. B. Xu X. L. Wang L. F. (2022). Road information detection algorithm based on improved Mask RCNN. J. Beijing Inf. Science & Technology Univ.37, 88–95. 10.16508/j.cnki.11-5866/n.2022.03.015
11
Fan X. M. Wang X. Dai F. X. Fang C. Y. Deng Y. Zhou C. B. et al (2022). Characteristics and spatial distribution pattern of MS6.8 Luding Earthquake occurred on September 5, 2022. J. Eng. Geol.,30, 1504–1516. 10.13544/j.cnki.jeg.2022-0665
12
Ghorbanzadeh O. Shahabi H. Crivellari A. Homayouni S. Blaschke T. Ghamisi P. (2022). Landslide detection using deep learning and object-based image analysis. Landslides19, 929–939. 10.1007/s10346-021-01843-x
13
Guo Z. Z. He J. Huang D. Zhou Y. Q. Zhu Y. H. (2023). Fast assessment model for rainfall-induced shallow landslide hazard and application. Chin. J. Rock Mech. Eng.42, 1188–1201. 10.13722/j.cnki.jrme.2022.0605
14
Haroon A. Ahmad S. Hussain A. (2017). “CFD prediction of loss coefficient in straight pipes,” in Development of water resources in India. Editors GargV.SinghV.RajV. (Cham: Springer), Vol. 75, 477–485. 10.1007/978-3-319-55125-8_41
15
He K. Gkioxari G. Dollar P. Girshick R. (2020). Mask R-CNN. IEEE Trans. Pattern Anal. Mach. Intell.42, 386–397. 10.1109/tpami.2018.2844175
16
Huang S. Chui S. L. Xing P. Wang T. Liang C. Y. (2021). Study on rainfall threshold and spatial distribution of clustered shallowlandslides in Tianshui City on July 25. J. Nat. Disasters.30, 181–190. 10.13577/j.jnd.2021.0320
17
Ji S. Yu D. Shen C. Li W.-le Xu Q. (2020). Landslide detection from an open satellite imagery and digital elevation model dataset using attention boosted convolutional neural networks. Landslides17, 1337–1352. 10.1007/s10346-020-01353-2
18
Jiao Q. J. Zhang B. Liu L. Y. Li Z. W. Yue Y. M. Hu Y. (2014). Assessment of spatio-temporal variations in vegetation recovery after the Wenchuan earthquake using landsat data. Nat. Hazards70, 1309–1326. 10.1007/s11069-013-0875-8
19
Li C. L. Liu Y. S. Lai S. H. Wang D. He X. H. Liu Q. (2024). Landslide susceptibility analysis based on the coupling model of logistic regression and support vector machine. J. Nat. Disasters33, 75–86. 10.13577/j.jnd.2024.0208
20
Li H. Li T. X. Zai X. Gao M. H. Wan X. Z. Zhang W. X. et al (2024). Study on multi_model comparative analysis of landslide vulnerability in mountainous areas of West Shijiazhuang based on informative approach. Nonferrous Met. Metall., 63–73. 10.3969/j.issn.1007-7545.2024.04.008
21
Li J. Y. Guan Y. L. Xu Y. B. Pu X. K. Tang M. H. (2024). Reginal landslide susceptibility evaluation based on I-SVM coupled model. J. Geol. Hazards Environ. Preserv.35, 19–25. 10.3969/j.issn.1006-4362.2024.01.004
22
Liang J. Pei X. J. Wen Y. Luo L. G. Jian D. J. (2019). Research on development and distribution rules of geohazardsin jiuzhaigou earthquake in 2017. J. Nat. Disasters.28, 181–188. 10.13577/j.jnd.2019.0520
23
Liu J. Wu Y. M. Gao X. Si W. T. (2022). Image recognition of Co-seismic landslide based on GEE and U-net neural network. J. Geo-information Sci.24, 1275–1285. 10.12082/dqxxkx.2022.210704
24
Liu X. H. Yao X. Yang B. Tang W. K. Zhou Z. K. (2023). InSAR-based indentification and spatial distribution analysis of active landslides in the Western Sichuan Plateau. J. Geomechanics29, 111–126. 10.12090/j.issn.1006-6616.2022024
25
Liu Y. Yang H. Jiao R. Wang Z. Wang L. Zeng W. et al (2024). A new deformation enhancement method based on multitemporal InSAR for landslide surface stability assessment. Ieee J.-Stars, 17. 10.1109/JSTARS.2024.3409376
26
Lv J. He X. Bao Y. Li H. (2024). Spatiotemporal pattern of post-earthquake vegetation recovery in a mountainous catchment in southwestern China. Nat. Hazards121, 3023–3046. 10.1007/s11069-024-06918-1
27
Ma Y. Yu B. He Y. X. Ma X. Y. Wu Y. F. Wu Y. Y. et al (2019). Rainfall threshold and development characteristics of shallow landslides induced by rainfall: a case study of the disaster in the Dajishan area, Quannan County, Jiangxi Province. Geol. Explor.2023 (59), 1065–1073. 10.12134/j.dzykt.2023.05.012
28
Malamud B. D. Turcotte D. L. Guzzetti F. Reichenbach P. (2004). Landslides, earthquakes, and erosion. Earth and Planet. Sci. Lett.229, 45–59. 10.1016/j.epsl.2004.10.018
29
Mao J. Q. He J. Liu G. Fu R. (2023). Landslide recognition based on improved DeepLabV3+ algorithm. J. Nat. Disasters32, 227–234. 10.13577/j.jnd.2023.0224
30
Qin S. Guo Xu Sun J. Qiao S. Zhang L. Yao J. et al (2021). Landslide detection from open satellite imagery using distant domain transfer learning. Remote. Sens.13, 3383. 10.3390/rs13173383
31
Shu Y. Huang S. X. Lai X. H. Chen Y. X. Yang L. Y. Lin C. et al (2024). Evaluation of trans regional landslide susceptibility of Reservoir Bank based on transfer component analysis. Earth Sci.49, 1636–1653. 10.3799/dqkx.2022.453
32
Wan Y. Guo J. Ma F. S. Liu J. Song Y. W. (2022). Landslide susceptibility assessment based on MaxEnt model of along Sino-Nepal traffic corridor. Chin. J. Geol. Hazard Control.33, 88–95. 10.16031/j.cnki.issn.1003-8035.2022.02-11
33
Wang Y. Zhang P. Sun K. Y. Sun X. H. Liu L. P. (2022). Remote sensing landslide target recognition based on attention fusion. Chin. J. Liq. Cryst. Displays37, 1498–1506. 10.37188/cjlcd.2022-0133
34
Wang H. F. Zhou C. J. Chen X. F. Yang Y. (2024). Detection of earthquake-damaged buildings via UAV high-resolution remote sensing images. J. Remote Sens.28, 911–916. 10.11834/jrs.20221569
35
Wang L. X. Xi Y. F. Shi Z. T. Zhao Z. L. Qian T. H. Zhao L. et al (2024). Study on sample unbalance in landslide recognition algorithm based on depth learning. Bull. Surv. Mapp., 12–18. 10.13474/j.cnki.11-2246.2024.0503
36
Wu Q. Ge D. Q. Yu J. C. Zhang L. Li M. Liu Y. et al (2022a). Deep learning identification technology of InSAR significant deformation zone of potential landslide hazard at large scale. Acta Geod. Cartogr. Sinica51, 2046–2055. 10.11947/j.AGCS.2022.20220303
37
Wu Q. Zhou C. B. Huang F. M. Yao C. (2022b). Optimization of the landslide identification method based on a dual attention mechanism. Bull. Geol. Sci. Technol.41, 246–253. 10.19509/j.cnki.dzkq.2022.0053
38
Xu Q. Xu F. S. Pu C. H. Li W. L. Fan X. M. Dong X. J. et al (2024). Preliminary analysis of extreme rainfall-induced cluster landslides in Jiangwan Township, Shaoguan. Geomatics Inf. Sci. Wuhan Univ.49, 1264–1274. 10.13203/j.whugis20240202
39
Yan J. K. Huang J. B. Li H. L. Chen L. Zhang Y. L. (2020). Study on instability mechanism of shallow landslide caused by typhoon and heary rain. J. Geomechanics26, 481–491. 10.12090/j.issn.1006-6616.2020.26.04.041
40
Yu B. Chen F. Xu C. (2020). Landslide detection based on contour-based deep learning framework in case of national scale of Nepal in 2015. Comput. Geosci.135, 104388. 10.1016/j.cageo.2019.104388
41
Yu Z. W. Liu K. Ying J. Yu B. (2022). A grid-scale division method applicable to logistic regression models for evaluating the susceptibility of shallow landslides—taking the 2019 cluster of shallow landslides in Sanming, Fujian as example. Mt. Res.40, 106–119. 10.16089/j.cnki.1008-2786.000659
42
Yuanzhen J. Qiang X. Shichao J. Weile L. Xiujun D. Qinghua G. (2020). Automatic object detection of loess landslide based on deep learning. Geomatics Inf. Sci. Wuhan Univ., 45 (11). 10.13203/j.whugis20200132
43
Zhang X. Y. Chen B. (2024). Generation method of hand-drawn feature sketch virtual terrain based on improved generative adversarial network. Natl. Remote Sens. Bull.28, 1–12. 10.11834/jrs.20233090
44
Zhang X. Liu L. Chen X. Gao Y. Xie S. Mi J. (2021). GLC_FCS30: global land-cover product with fine classification system at 30 m using time-series Landsat imagery. Earth Syst. Sci. Data13, 2753–2776. 10.5194/essd-13-2753-2021
Summary
Keywords
shallow landslides, Mask R-CNN, spatial statistical analysis, landslide susceptibility, predisposing factors
Citation
Zeng W, Han J, Jiao R, Li M-L, Gui W and Ma C (2025) Intelligent identification and susceptibility analysis of rainfall-induced shallow landslides in mountainous areas based on high-resolution remote sensing and deep learning. Front. Earth Sci. 13:1685773. doi: 10.3389/feart.2025.1685773
Received
14 August 2025
Accepted
22 September 2025
Published
16 October 2025
Volume
13 - 2025
Edited by
Zikang Xiao, Ministry of Emergency Management of China, China
Reviewed by
Zarghaam Rizvi, GeoAnalysis Engineering GmbH, Germany
Wensong Wang, Chengdu University of Technology, China
Updates
Copyright
© 2025 Zeng, Han, Jiao, Li, Gui and Ma.
This is an open-access article distributed under the terms of the Creative Commons Attribution License (CC BY). The use, distribution or reproduction in other forums is permitted, provided the original author(s) and the copyright owner(s) are credited and that the original publication in this journal is cited, in accordance with accepted academic practice. No use, distribution or reproduction is permitted which does not comply with these terms.
*Correspondence: Jianfeng Han, 2012190023@email.cugb.edu.cn
Disclaimer
All claims expressed in this article are solely those of the authors and do not necessarily represent those of their affiliated organizations, or those of the publisher, the editors and the reviewers. Any product that may be evaluated in this article or claim that may be made by its manufacturer is not guaranteed or endorsed by the publisher.