 Shaojie Wen
 Dongfeng Li3*
- 1School of Civil Engineering and Architecture, Hunan University of Arts and Science, Changde, China
- 2School of Civil Engineering, Qinghai University, Xining, China
- 3School of Road and Bridge Engineering, Jilin Communications Polytechnic, Changchun, China
To deeply investigate the anisotropic mechanical properties of intact loess under static and dynamic loads, static and dynamic triaxial tests were conducted on samples with different deposition directions (0°, 30°, 45°, 60°, 90°). Combining macroscopic mechanical tests with microstructural analysis, the anisotropic response mechanisms were systematically revealed. The study results indicate that under both static and dynamic loads, the stress-strain relationship curves of intact loess at different sampling angles exhibit significant anisotropy. Both the deviatoric stress at failure and the initial dynamic elastic modulus display anisotropy. The nonlinear pattern with varying angles is as follows: the maximum value occurs at 0°, followed by sequential decreases at 30°, 60° (slightly lower than 30° in some cases), and 45°, with the minimum value appearing at 90°. The consolidation effect of confining pressure weakens the original structural strength of loess, leading to a decrease in the initial dynamic elastic modulus as confining pressure increases, but the anisotropic characteristics remain pronounced. After the tests, the pore structure of loess changed from a large-pore, weakly cemented open structure to a fine and dense interlocking structure. The particle morphology transformed from single-grain and angular to flocculent and ellipsoidal. These microstructural evolutions constitute the intrinsic mechanism of the macroscopic mechanical responses. The findings of this study provide important experimental evidence and theoretical support for the design, construction, and disaster prevention of complex engineering projects in loess regions.
1 Introduction
Under the combined influence of natural sedimentation processes, geological structural movements, and the long-term history of anisotropic stress, soil has developed notable characteristics of structural anisotropy (Zarei et al., 2019; Yang et al., 2020; Zhou and Chen, 2021). This anisotropy is evident not only in the orientation of particle arrangements and the spatial heterogeneity of pore structures but also affects key engineering properties such as soil strength and permeability (Graham and Houlsby, 1983; Cai et al., 2018; Hong et al., 2019; Li et al., 2025). In engineering practice, the influence brought by anisotropy is particularly prominent: in the analysis of slope stability, anisotropy can lead to spatial reorientation of potential slip surfaces, and traditional two-dimensional limit equilibrium analysis methods may significantly underestimate the sliding risk along sedimentary bedding planes (Soroush and Soltani-Jigheh, 2001). In underground engineering, anisotropic permeability induces asymmetric seepage fields, thereby affecting the pore water pressure distribution around excavation surfaces (Bobet, 2010). In light of this, there is a pressing need to evaluate the effect of soil anisotropy in engineering projects with complex stress conditions, securing their safety and stability (Yang et al., 2020; Zhang et al., 2022; Yu et al., 2025).
In recent years, the anisotropic characteristics of loess and other special soils, along with their effects on mechanical and hydraulic behavior, have attracted significant attention. Research indicates that the heterogeneity of pore structures and the non-uniform particle arrangement formed during natural deposition and consolidation processes play a decisive role in soil permeability and mechanical anisotropy (Hong et al., 2019; Zhang et al., 2022; Li et al., 2023; Zhang et al., 2025). A series of studies by Xu et al. (2019), Xu et al. (2020), Xu et al. (2021) systematically established that intact loess exhibits higher spatial variability in vertical permeability, primarily controlled by macro-pore distribution and cementation degree. Hao et al. (2022) found that the horizontal saturated permeability coefficient generally exceeds the vertical one and proposed that unsaturated permeability anisotropy can be predicted using pore connectivity tortuosity parameters. Hong et al. (2019) further demonstrated that permeability anisotropy decays with seepage duration, a behavior closely linked to deposition history-induced particle orientation. In terms of microstructure characterization, Wang et al. (2021) employed X-ray CT scanning to quantify the macro-pore structure of remolded loess, revealing a strong correlation between permeability anisotropy and pore distribution uniformity. They further characterized hydraulic conductivity anisotropy using a modified Kozeny-Carman equation. Li et al. (2023), Li et al. (2024) utilized CT imaging to elucidate preferential flow patterns in loess, demonstrating that pore connectivity and anisotropy jointly govern water migration pathways. In terms of mechanical properties, Liu et al. (2023) declared that the inherent cementation structures induce pronounced strength anisotropy, which diminishes upon remolding, thereby corroborating the crucial role of structural history. Zhang et al. (2022) and Zuo et al. (2022) conducted direct shear tests revealing that the shear strength of loess is generally higher in the vertical direction than in the horizontal direction, with small-strain stiffness anisotropy being significantly influenced by its inherent structure and stress history. Shrivastava and Sachan (2023) investigated the anisotropic behavior of shear modulus in coal ash fillers under cyclic loading, demonstrating that both deviatoric stress and mean effective stress collectively govern small-strain stiffness anisotropy. He et al. (2020) and Wang et al. (2024) elucidated the evolution mechanisms of meso-scale anisotropy in coarse-grained soils subjected to cyclic loading, particularly highlighting the stress-path dependency of coordination number and contact fabric. In the field of numerical simulation and constitutive theory, Karimzadeh et al. (2024) developed a root-reinforced soil constitutive model based on microstructural fabric tensors, demonstrating that the alignment between root orientation and loading path determines reinforcement efficiency. Their findings indicate that the primary root system contributes most significantly under tensile loading conditions. Hu et al. (2021) proposed an elastoplastic constitutive framework integrating hyperelasticity with the Drucker-Prager criterion, capable of simultaneously accounting for both inherent and stress-induced anisotropy. Jiang et al. (2019) identified a critical threshold for fabric anisotropy in sands under cyclic loading, revealing coaxial evolution between strong contact fabric and stress tensor. Zhu et al. (2024) further advanced discrete element method analysis by quantifying the influence of loess particle morphology, demonstrating that non-spherical particles amplify both fabric anisotropy and mechanical performance.
Loess is widely distributed in the northwest of China (Wen et al., 2023a) and can be easily obtained locally as an engineering material. Due to its unique micro-pore structure (large pores, weak cementation, and well-developed vertical joints) and engineering mechanical properties (collapsibility, water sensitivity, and anisotropy). Therefore, in-depth research on its anisotropy under static and dynamic loads is of great significance for the construction of slopes, tunnels, and other projects. Moreover, current studies on the anisotropy of loess mainly focus on the response under a single load, while there is a lack of research on the static and dynamic load response mechanisms of intact loess under strain control. To further address the research gap, the objectives of this study are: (1) to compare the mechanical responses under static and dynamic loads at different angles, (2) to investigate the microstructure changes before and after loading at different sampling angles, and (3) to reveal the microscopic response mechanisms of anisotropy of intact loess under static and dynamic loads.
2 Materials and methods
2.1 Materials
The loess applied to the present work was taken from a range of 3–4 m deep from Xining County, Qinghai Province, China. According to ASTM D7928-21e1 and D6913-04e1 (ASTM, 2010; ASTM, 2021), the physical properties of the loess were tested. The loess mainly contains 9.8% sand, 85.5% silt, and 4.7% clay. Its liquid limit ωL and plasticity index PI are also supplemented in Figure 1 and Table 1.
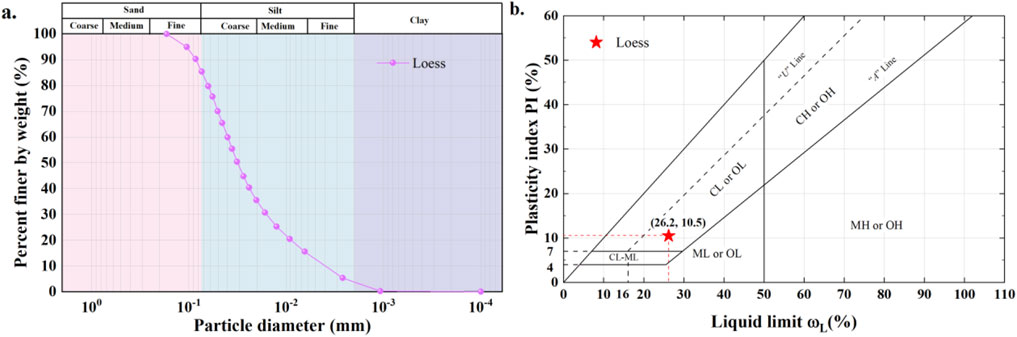
Figure 1. (a) Particle size distribution curve and (b) liquid limit and plasticity index.

Table 1. Physical properties of the intact loess.
2.2 Specimen preparation
To preserve the structural characteristics of intact loess, this study employed a specially designed soil-cutting disc (39.1 mm) to prepare intact loess samples measuring 39.1 mm × 80 mm (diameter × height). To investigate anisotropy, samples were cut along directions forming θ angles (θ = 0°, 30°, 45°, 60°, 90°) with the natural deposition plane of the soil during preparation, as shown in Figure 2. Additionally, all samples were collected from the same stratigraphic depth (about 3.5 m deep) to control the influence of factors such as dry density on experimental results. Dry density tests were conducted before experimental measurements, ensuring variations remained within 0.02 g/cm3. To control the single variable of moisture content in the experiment, the intact sample was placed in a mold after preparation, and the soil moisture content was adjusted to a uniform target value using the water injection titration method (natural moisture content). Then, the sample was sealed and stored for 3–4 days.
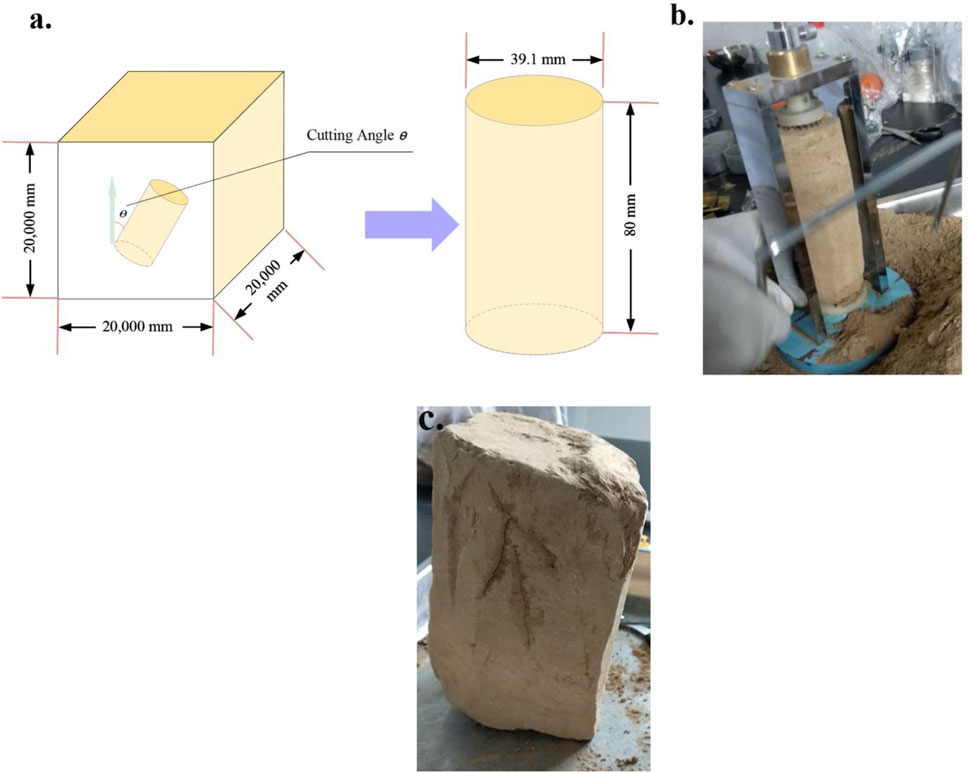
Figure 2. Schematic illustration of intact samples preparation: (a) at different angles to the deposition direction, (b) soil-cutting disc, and (c) angle marking.
2.3 Methods
2.3.1 Testing apparatus
The present work used a bidirectional dynamic triaxial testing system manufactured by the UK-based GDS company (see Figure 3). Key technical specifications of the equipment include: a maximum confining pressure of 2 MPa, axial load capacity of 20 kN, frequency response range of 0–5 Hz, and precise implementation of both static and dynamic loading under stress or strain control modes.
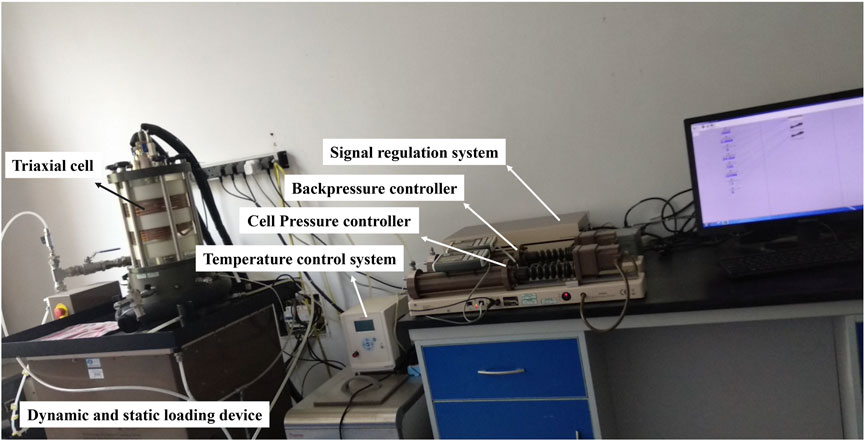
Figure 3. The GDS dynamic triaxial device.
2.3.2 Static and dynamic testing procedures
This study employed a combined experimental method of static loading and strain-controlled equivalent cyclic graded dynamic loading to conduct dynamic and static triaxial comparison tests. The test procedure was divided into two stages: consolidation and loading. Firstly, an axial force of 5 kPa was applied using the loading device to ensure proper contact between the sample and the axial sensor. After opening the drain valve, confining pressures of 80 kPa, 120 kPa, and 160 kPa were applied to the respective specimens by the cell pressure controller for isotropic consolidation. Axial deformation was monitored in real-time using high-precision sensors, and consolidation was considered complete when the axial deformation rate stabilized below 0.01 mm/h for one consecutive hour. The loading stage was conducted under undrained conditions. For static loading, specimens were continuously loaded at an axial displacement rate of 0.8 mm/min until shear failure at 15% axial strain (see Table 2) (Liu et al., 2022). For dynamic loading, graded loading was implemented based on a 1.0 Hz sine wave fundamental frequency, with the strain amplitude incrementally increased by 0.25% per level, totaling 20 loading levels. Each level involved 50 cycles of loading, and the test was terminated when the cumulative dynamic strain of the specimen reached 5% (see Figure 4; Table 2) (Liao et al., 2011). In addition, parallel tests were conducted for each group of experiments to ensure the accuracy of the tests.
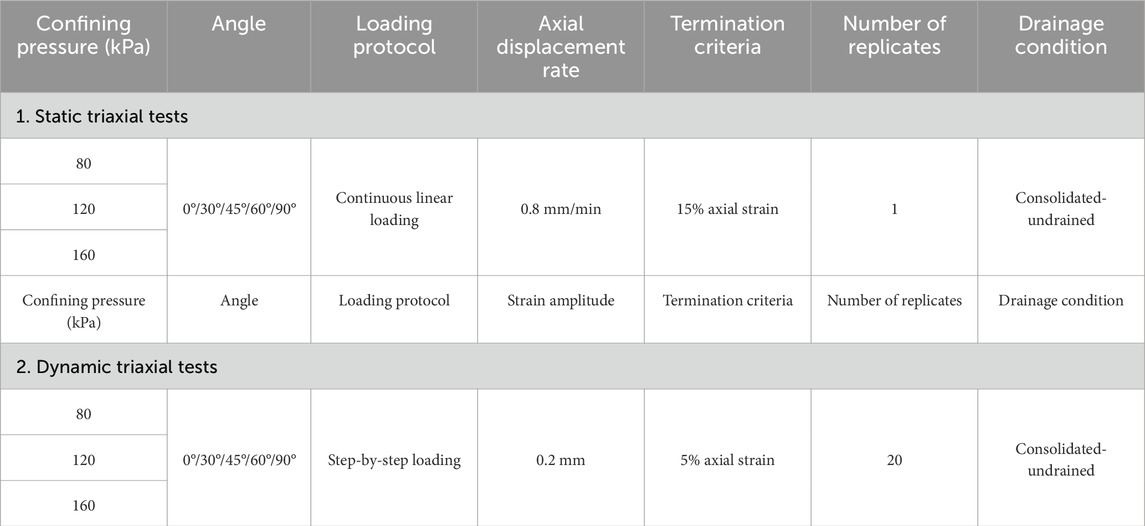
Table 2. Parameters of the test.
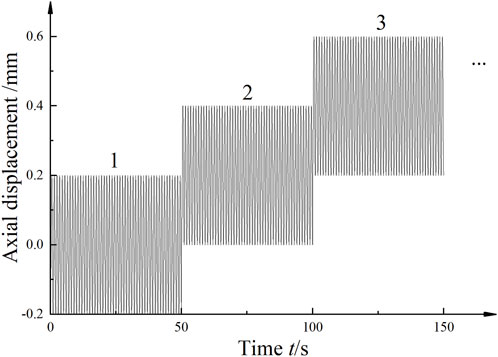
Figure 4. Schematic illustration of cyclic strain amplitude.
2.3.3 Constitutive modelling
Because the shear modulus and damping of soil change with the number of load cycles, Hardin and Drnevich (1972) enhanced the Hardin-Drnevich (H-D) model (see Equation 1) using extensive experimental data and theoretical derivations to accurately represent the cyclic softening characteristics of soil. Additionally, Liao et al. (2011) and assert that the backbone curve of loess aligns with the H-D model and indicate that the modified H-D model (see Equation 2) can be utilized when the hyperbolic model is inadequate. Yu et al. (2018) and Zhang et al. (2022) also believe that the modified H-D model is more suitable for describing the backbone curve under dynamic loads.
H-D model:
Modified H-D model:
The dynamic elastic modulus primarily characterizes the stress-strain relationship of soil during elastic deformation under dynamic loads, and its expression is Equation 3:
It can be known from the modified H-D model that the dynamic elastic modulus is:
where a, b, and c are the parameters of the H-D hyperbolic model. It can be known from Equation 4 that when εd approaches 0, the dynamic elastic modulus Ed = Emax = 1/a, and at this time Emax = Ed0. Where Ed0 is initial dynamic elastic module.
2.3.4 Scanning electron microscopy (SEM) tests
By conducting SEM tests and analyzing particle fractures on intact loess samples before and after the tests, the internal microstructural changes of the loess were obtained and analyzed. The preparation of microscopic specimens involves three core steps: fabrication, drying, and gold coating. First, a 10 mm × 10 mm×20 mm cuboid specimen was cut from the middle section of the cylindrical sample along the direction of the intact soil. Then, a groove was carved in the center of the cuboid specimen to facilitate the preparation of the cross-section (see Figure 5). Subsequently, the freeze-vacuum drying method was employed to preserve the microstructure. After drying, the cross-section was fractured, and loose particles were removed. The specimen was then fixed on the sample stage and subjected to gold coating using a sputtering coater to enhance the conductivity of the weakly conductive loess, meeting the requirements for electron microscopy scanning (Wen et al., 2023b). The SEM images were quantitatively analyzed using the PCAS software to obtain parameters of pores (particles) within the loess, followed by classification statistics of the pores (particles) to generate statistical parameters.
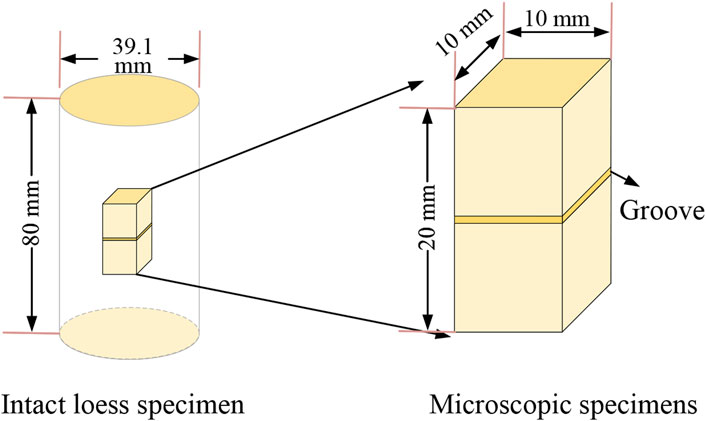
Figure 5. Schematic diagram of the preparation process for intact loess microscopic specimens.
3 Results
3.1 Static strength
3.1.1 Deviatoric stress-strain relationship curves
The deviatoric stress-strain curves under different confining pressures and sampling angles exhibit distinct characteristic differences (Figure 6). During the initial loading stage (<3%), deviatoric stress demonstrates a rapid ascending trend with increasing strain, showing low sensitivity to sampling angles in terms of specimen strength and anisotropic characteristics. When strain progresses to intermediate and advanced stages (>5%), the incremental rate of deviatoric stress decreases significantly compared to the initial phase, accompanied by strain hardening phenomena. The influence of sampling angle on deviatoric stress becomes pronounced during this period, manifesting as marked differentiation in deviatoric stress values under equivalent strain conditions with varying sampling angles, with the failure deviatoric stress ranked from highest to lowest as: 0° > 30° > 60° (60° > 30°) > 45° > 90°. Moreover, under a confining pressure of 160 kPa, the maximum difference between the horizontal (90°) and vertical (0°) deviatoric stresses is 85.6 kPa. Similarly, Li (2017) also found that the vertical plane (0°) has a greater shear strength than the horizontal plane (90°). Notably, during experimental testing, the specimens predominantly displayed typical bulging failure patterns at 15% strain (see Figure 7a), with only a small number exhibiting shear slip bands (see Figure 7b). Comparative analysis of test results from Figures 6a–c reveals that under identical strain conditions, increased confining pressure significantly enhances deviatoric stress response values. This strengthening effect demonstrates non-linear amplification trends with increasing confining pressure gradients.
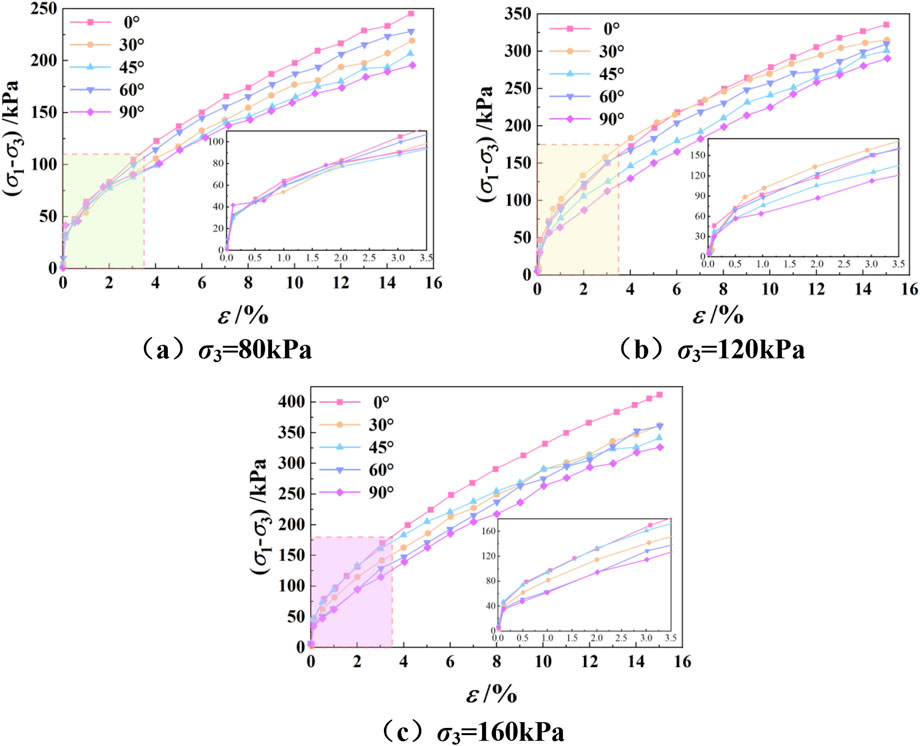
Figure 6. Deviatoric stress-strain curves at different sampling angles. (a) σ3 = 80 kPa. (b) σ3 = 120 kPa. (c) σ3 = 160 kPa.
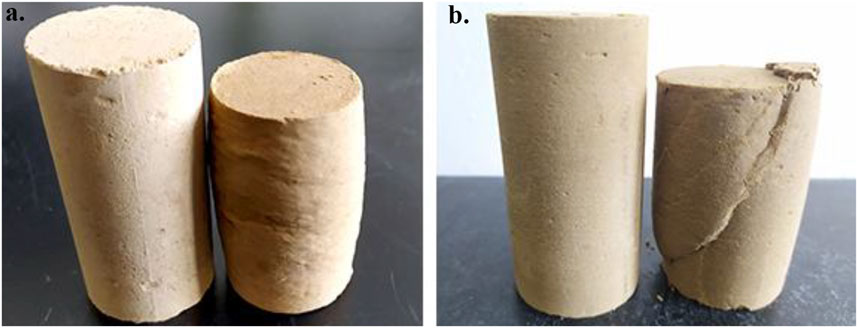
Figure 7. Comparison pictures of the samples before and after the test (a) bulging failure patterns and (b) shear slip bands failure patterns.
3.1.2 Anisotropy of intact loess under static loading
The relationship between deviator stress and sampling angle under varying strain levels is shown in Figure 8. Under the same strain conditions, the deviator stress generally decreases with increasing sampling angle. The deviator stress is highest and the shear strength is greatest when the sampling direction is 0° relative to the natural deposition direction. Conversely, the deviator stress is lowest and the shear strength is weaker at 90°. The deviator stress at 45° is less than that at 30° and 60°. Notably, this angle effect fluctuates in the low strain stage (<5%), but after the strain exceeds the critical value of 5%, the correlation between sampling angle and deviator stress tends to stabilize. This suggests that the particle rearrangement process enhances the anisotropic characteristics of the mechanical response.
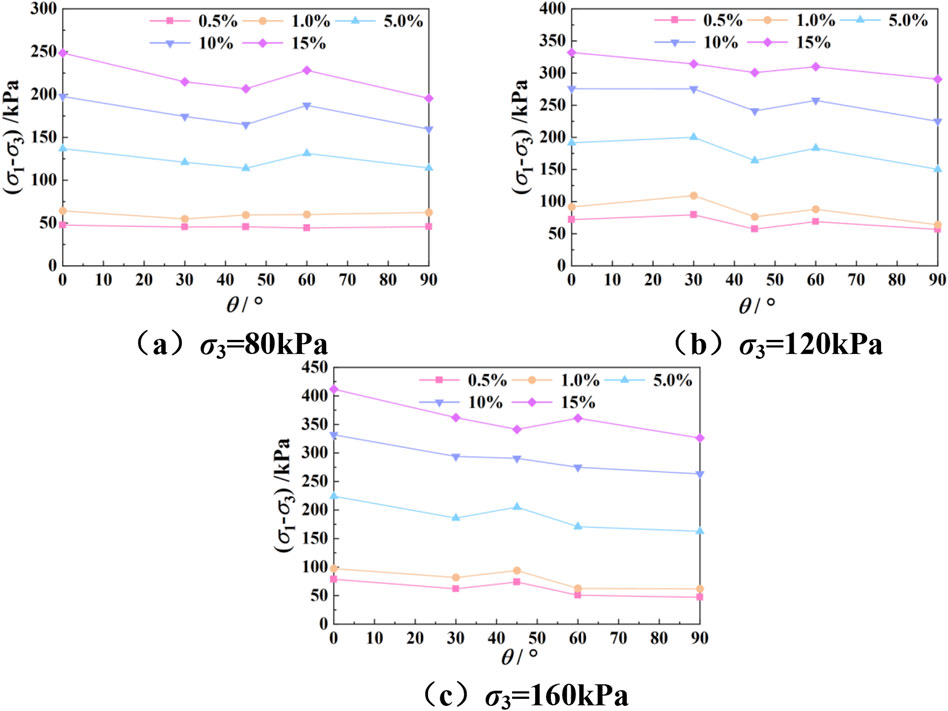
Figure 8. Relationship curve between deviatoric stress and angle under different strains. (a) σ3 = 80 kPa. (b) σ3 = 120 kPa. (c) σ3 = 160 kPa.
3.2 Dynamic strength
3.2.1 Dynamic stress-strain relationship curves
Figure 9 shows the dynamic stress-strain relationship curves of intact loess at different sampling angles. With the increase of dynamic shear strain, the dynamic shear stress shows obvious two-stage variation characteristics: it rises rapidly in the early stage and the growth rate slows down in the later stage, presenting a typical strain hardening phenomenon. Notably, the curve shows a significant turning point when the dynamic strain reaches approximately 0.5%. When the dynamic strain is 5%, the order of dynamic stress of the specimens at different sampling angles from high to low is: 0° > 30° > 60° (60° > 30°) > 45° > 90°. Moreover, under a confining pressure of 80 kPa, the maximum difference between the horizontal (90°) and vertical (0°) deviatoric stresses is 52.2 kPa.
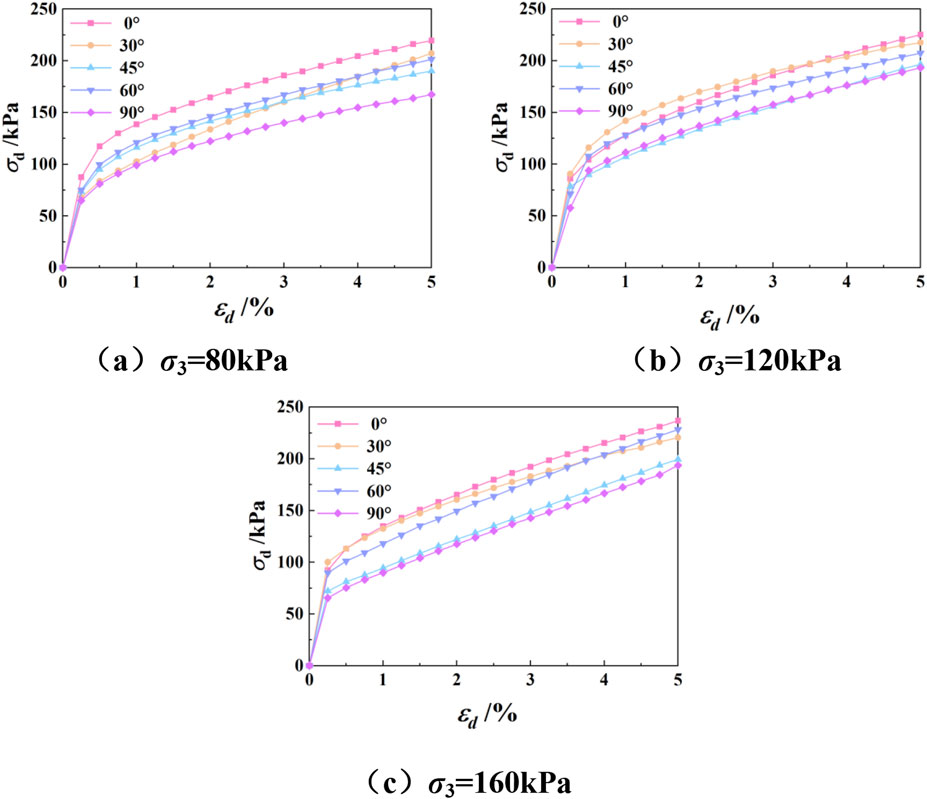
Figure 9. Dynamic stress-strain curves at different sampling angles. (a) σ3 = 80 kPa. (b) σ3 = 120 kPa. (c) σ3 = 160 kPa.
3.2.2 The initial dynamic elastic modulus Ed0
As shown in Figure 10, under a confining pressure of σ3 = 80 kPa, the typical curves of the dynamic elastic modulus (Ed) of soil at different sampling angles vary with the dynamic strain εd. It can be observed that as the εe increases, the Ed exhibits a clear decay trend, demonstrating a significant nonlinear negative correlation between the two. In the small-strain stage (εd < 1%), the decay rate of Ed is relatively rapid. When the strain enters the medium range (1% < εd < 3%), Ed decreases more slowly. In the large-strain stage (εd > 3%), Ed gradually stabilizes.
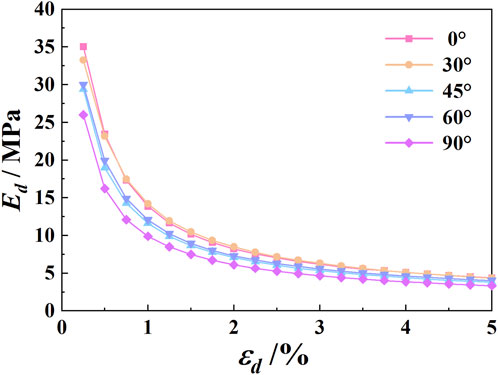
Figure 10. The Ed-εd curves at different angles under σ3 = 80 kPa.
Since the initial dynamic elastic modulus (Ed0) of the soil cannot be directly obtained from the Ed-εd curve, this study employs the modified H-D model to fit the Ed-1-εd curve and then extrapolates the fitted curve to determine Ed0. The fitting results under a confining pressure of σ3 = 80 kPa are shown in Figure 11. The parameters of the modified H-D model and the initial elastic modulus under different confining pressures are listed in Table 3. The modified H-D model provides a better description of the Ed-εd curve of intact loess, with all fitting coefficients (R2) exceeding 0.99. Similarly, in the study by Yu et al. (2025), it was also found that the modified H-D model is more suitable for describing the relationship curve between dynamic elastic modulus and dynamic strain. There are notable differences in the modified H-D model parameters obtained at different sampling angles. The initial elastic modulus follows this order from largest to smallest: 0° > 30° > 60° (60° > 30°) > 45° > 90°. When the sampling direction aligns with the natural deposition direction (0°), the soil exhibits stronger resistance to vibration-induced deformation, whereas at 90°, its resistance is the weakest. Therefore, in complex engineering applications, the anisotropic nature of loess cannot be ignored, and loading conditions at 45° and 90° should be avoided whenever possible. So that, during the construction of slopes, tunnels or underground structures in loess areas, the retaining structures in the 45° and 90° load directions should be strengthened to ensure the stability of the slopes, tunnels or underground structures.
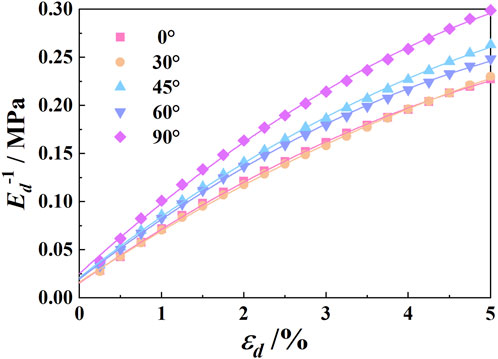
Figure 11. The Ed-1-εd curves at different angles under σ3 = 80 kPa.
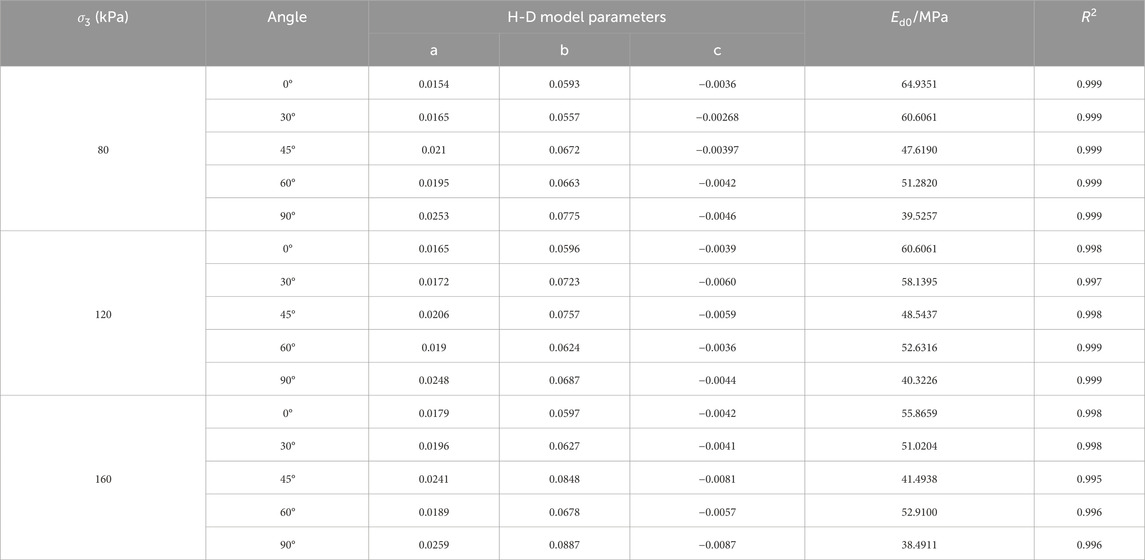
Table 3. Corrects H-D model parameters and initial elastic modulus.
3.3 The results of SEM tests
The microstructure of intact loess shows significant differences based on variations in the angle relative to its natural deposition direction, as illustrated in Figure 12. The soil particles are generally single-grained and well-defined. At the 0° angle, the particles are larger in area, primarily round or elliptical, and possess relatively flat surfaces. As the angle increases, more small particles emerge, their shapes become sharper, the void structure becomes more pronounced, and the particle arrangement becomes increasingly disordered. Additionally, some cementing components emerge. This indicates that the apparent morphology of loess particles is anisotropic. Figure 13 shows the microstructure of the intact loess after the experiment under σ3 = 80 kPa. Following loading, the angular soil particles transform into elliptical or rounded shapes. Small particles filling the pores cause macropores to shrink or disappear, destroying honeycomb structures. Particles demonstrate increased flocculation and aggregation, appearing cemented. The boundaries between soil particles become indistinct, and more small particles at contact surfaces increase, often in direct face-to-face contact. This change in contact mode promotes a transition in the state between particles from weakly cemented to interlocked cemented.
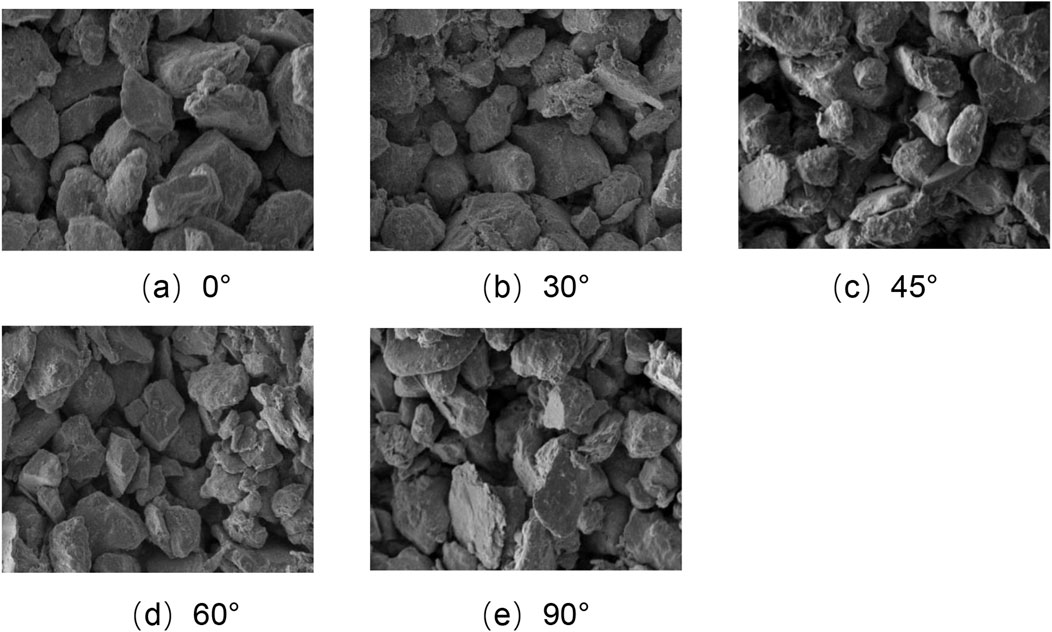
Figure 12. SEM images of intact loess before testing (×500 magnification). (a) 0°. (b) 30°. (c) 45°. (d) 60°. (e) 90°.
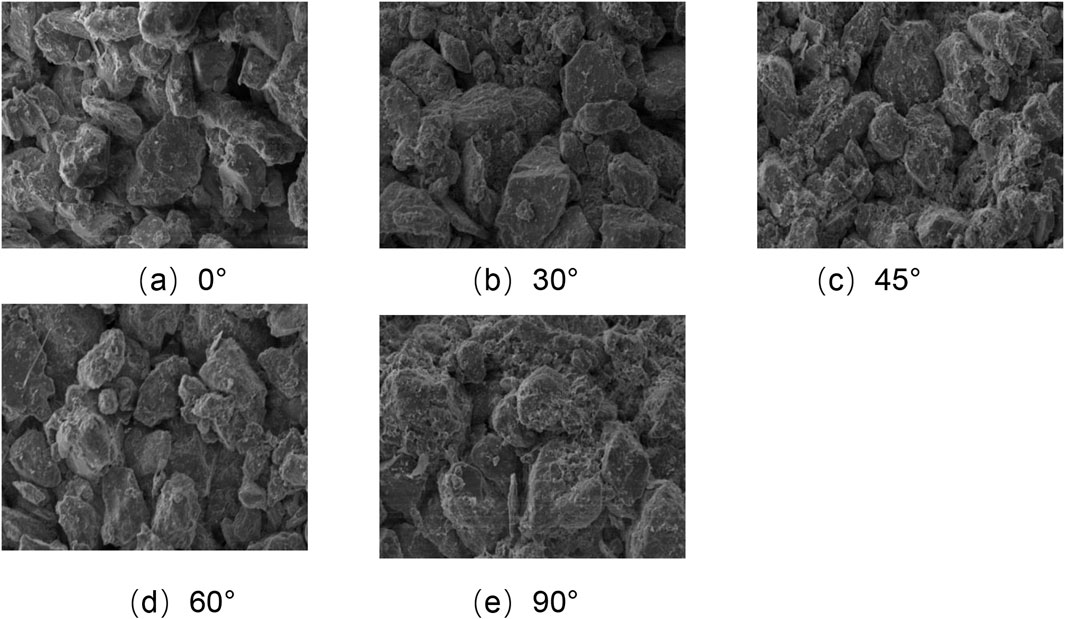
Figure 13. SEM images of intact loess after testing (×500 magnification). (a) 0°. (b) 30°. (c) 45°. (d) 60°. (e) 90°.
The quantitative statistics of microstructure parameters are shown in Table 4. The proportion of pore area increases with the increase of sampling angle, indicating that soil particles are more densely arranged in the vertical direction, demonstrating significant anisotropy in the intact loess. After testing, this ratio decreased overall, but anisotropy still exists. This indicates that under loading, large pores in the soil gradually shrink or disappear, the overarching structure is damaged, and soil particles move towards a more stable and denser state. Before testing, the probability entropy values of the samples were all around 0.9 and showed an increasing trend with sampling angle, suggesting a gradual decrease in the ordering of soil particles. After testing, the probability entropy values of the samples were approximately 0.99, indicating that when subjected to external forces, the soil primarily relies on its soil particles to bear the load, and internal pores are a passive consequence of their movement. This suggests that soil particles move towards pore spaces under external forces. Before testing, the average pore shape coefficient was 0.38 and was not significantly affected by sampling angle, indicating relatively weak anisotropy in pore morphology. After testing, this coefficient decreased overall in samples taken at different angles, suggesting that under loading, soil pores changed from smooth to narrow and elongated, reflecting the gradual disappearance of the large-pore structure. Overall, the loess microstructure exhibits anisotropy, but the anisotropic characteristics related to pore ordering are not pronounced. The microscopic anisotropy of intact loess is mainly reflected in the shape, arrangement mode, area quantity, and complexity of soil particles. Figure 14 displays rose diagrams of particle inclination angles for the 0° and 90° samples, both before and after testing. Before testing, the 0° sample showed concentration within the 90°–100° and 170°–180° ranges. In contrast, the 90° sample exhibited a more distributed pattern, with notable concentrations not only in the 90°–100° and 170°–180° ranges but also in the 0°–50° range. This distinct angular distribution demonstrates deposition-induced anisotropy between the two samples. After testing, the dispersion of particle inclination angles significantly decreased in both samples, indicating that the applied load induced reorientation and reorganization of the soil particles.
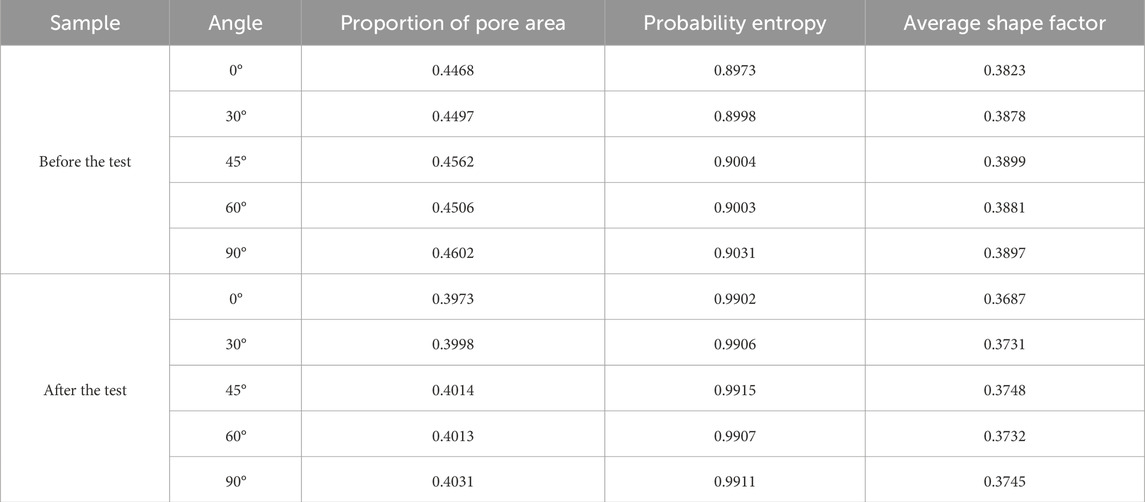
Table 4. Statistics of microscopic quantitative parameters of intact loess.
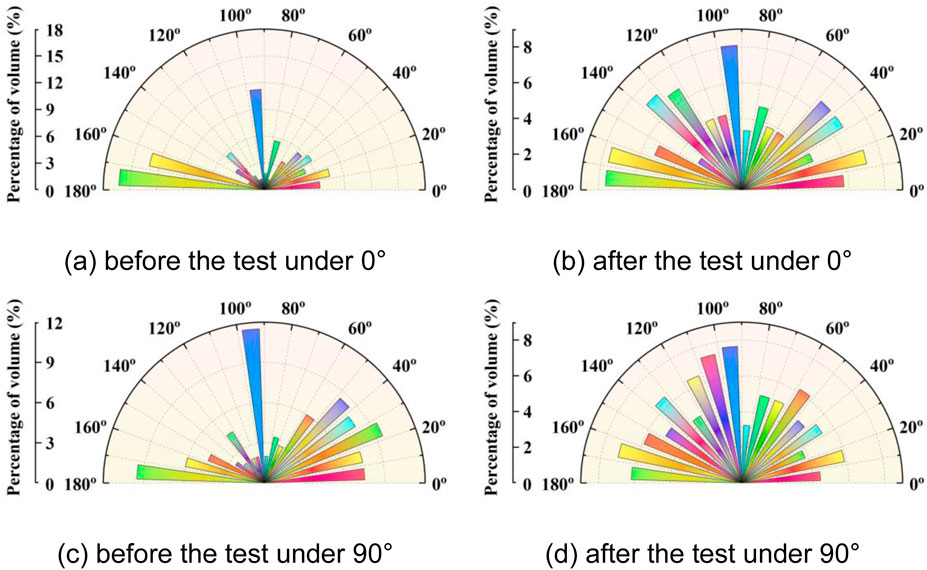
Figure 14. Anisotropy of particle orientation is represented. (a) before the test under 0°. (b) after the test under 0°. (c) before the test under 90°. (d) after the test under 90°.
4 Discussion
During the long-term geological history, the soil undergoes sedimentation and consolidation processes, and the resulting original skeletal structure forms the basis of its intrinsic mechanical properties, endowing the soil with excellent initial resistance to deformation (Zhou and Chen, 2021). This inherent structural advantage is particularly prominent in the initial loading stage: the original skeletal structure can effectively bear and transmit externally applied loads, leading to a rapid initial rise in shear stress under both dynamic and static conditions (Figures 6, 9). However, as the external strain (whether static or dynamic) continues to increase, the original skeletal structure inevitably undergoes progressive failure. During this process, soil particles experience significant displacement and rearrangement, gradually filling the original large pore spaces (Zhang et al., 2022). The microstructure evolution is manifested by a significant reduction in macropores (Table 4) and a change in the direction and angle of soil particle arrangement (Figure 14). The particle contact mode shifts toward a more compactly interlocked state, and the soil as a whole shows a trend of densification and reconstruction (Figures 12, 13). In addition, the consolidation process destroys the primary structure, which will reduce anisotropy. As a result, anisotropy is relatively weak at the initial loading stage (Figure 8). Similarly, Chen et al. (2023) also reported a negative correlation between consolidation stress and anisotropy. It is noteworthy that, as the strain increases, the original skeletal structure becomes damaged. Particle rearrangement and tight interlocking produce a strengthening effect. This effect causes the soil’s static and dynamic stress responses to continue growing in the subsequent stage of strain development (see Figures 6, 9). Additionally, the proportional distribution of particle orientations changes significantly before and after samples failure (Figure 14). This confirms that, compared with the initial stage, significant anisotropy develops in the later loading phase (see Figure 8).
Further analysis reveals significant anisotropy in the soil’s mechanical behavior, rooted in the oriented arrangement of its microstructure (Li et al., 2023). Along the original deposition direction (0°), soil particles tend to exhibit a dense, layered arrangement, with face-to-face contact as the dominant interaction mode. This highly oriented and compact structure results in relatively low porosity in this direction. When loading is applied along this orientation, the load transfer within the soil sample primarily relies on the efficient transmission of interparticle forces (mainly through contact surfaces), leading to notably higher shear strength at the macroscopic level. As the sampling angle increases, the dominant contact mode between particles gradually shifts from face-to-face to point-to-point interactions. Concurrently, microstructural data indicate an approximately 2% increase in porosity in the 90° sampling direction (see Table 4). Moreover, the increase in particle inclination within the 0°–50° range further illustrates the anisotropy manifested in the mechanical properties (Riyahikhoo et al., 2025). This microstructural alteration-characterized by increased point contacts and larger pores-directly reduces the effective stress-transfer area along load transmission paths, thereby weakening the soil’s resistance to deformation. Macroscopically, this manifests as a relative decline in deformation resistance. The above microstructural analysis clearly explains the anisotropy in the mechanical behavior of intact loess (see Figures 8, 9).
Anisotropy under static loading is primarily controlled by natural sedimentary fabric. Along the deposition direction (0°), particles exhibit a dense, layered arrangement (dominated by face-to-face contacts) (see Figure 12), resulting in low porosity and high shear strength. As the sampling angle increases, porosity rises (see Table 4), reducing the effective stress-transfer area and weakening deformation resistance. In the early strain stage (<3%), structural anisotropy is not yet pronounced, with deformation mainly provided by the compression of large pores. When strain exceeds 5%, particle realignment maintains high strength in the 0° direction, while higher-angle directions experience strength degradation due to particle instability. Under confining pressure, particles are in tighter contact, enhancing interlocking forces, cohesion, and frictional resistance. Thus, higher confining pressure imposes greater constraints, making particle slippage more difficult and requiring higher shear stress to achieve the same strain. The high confining pressure maintains the specimen in an overconsolidated state, leading to a bulge during shear (see Figure 7A). This dilatancy occurs because soil particles ride over and displace each other from their densely packed arrangement to undergo bulging failure patterns. Anisotropy under dynamic loading stems from the coupling of cumulative dynamic damage and structural reorganization (Wang et al., 2024). In the initial stage (strain <0.5%), the 0° direction can sustain 20% higher stress than the 90° direction (see Figure 9) due to the relatively high proportion of soil particle arrangement angles within the range of 90°–100° and 170°–180° (see Figure 14), resulting in a higher initial dynamic shear modulus (see Table 3). As dynamic strain increases, the original structure disintegrates and undergoes a three-stage reorganization: (1) coarse particle breakage filling large pores, (2) fine particle rotation and reorientation, and (3) formation of a stable secondary structure. Confining pressure enhances particle interlocking via constraints, improving strain resistance and effectively suppressing particle slippage. The phenomenon was also described in the article by Zhang et al. (2022). However, since confining pressure is applied before dynamic loading, it partially disrupts the soil’s original structure, leading to varying degrees of reduction in the initial dynamic elastic modulus with increasing confining pressure (see Table 3).
5 Conclusion
This paper explored the mechanical response of anisotropy in intact loess through macro and micro tests. Based on the results and discussion, some main conclusions can be drawn as follows:
1.The stress-strain curves of intact loess samples taken at different angles to the depositional direction exhibit significant anisotropy under both static and dynamic loading conditions. The failure deviatoric stress ranked from highest to lowest as: 0° > 30° > 60° (60° > 30°) > 45° > 90°.
2.The consolidation effect induced by confining pressure disrupts the original structure of intact loess. With increasing confining pressure, the initial dynamic elastic modulus exhibits a decreasing trend. Although the confining pressure compromises the intact structure, its anisotropic characteristics remain pronounced. The initial elastic modulus follows this order from largest to smallest: 0° > 30° > 60° (60° > 30°) > 45° > 90°.
3.The microstructure of intact loess transitions from a large-pore, weakly-cemented overhead structure to a small-pore inlay structure before and after testing, while particle morphology shifts from single-grain and angular forms to flocculent and elliptical shapes. These microstructural changes perfectly explain the phenomena observed in macroscopic mechanical tests. Furthermore, the anisotropy of undisturbed loess is primarily attributed to variations in soil porosity, particle morphology, arrangement patterns, and effective contact area.
4.These findings provide a theoretical and data-driven foundation for understanding anisotropy in intact loess. However, it is important to note that the use of isotropic overconsolidation in this study inherently diminishes the anisotropic effects. Future research should therefore prioritize investigating the evolution of anisotropy under K0 consolidation conditions to better represent in-situ stress states.
Data availability statement
The original contributions presented in the study are included in the article/supplementary material, further inquiries can be directed to the corresponding author.
Author contributions
SW: Writing – original draft, Funding acquisition, Writing – review and editing. DL: Writing – review and editing, Funding acquisition, Data curation. ZY: Writing – review and editing. WZ: Writing – review and editing.
Funding
The author(s) declare that financial support was received for the research and/or publication of this article. This paper is based upon work supported by the Scientific Research Startup Project of Hunan University of Arts and Science (24BSQD46), Jilin Provincial Department of Education Scientific Research Project (JJKH20251786K), and the Hunan Provincial Natural Science Foundation of China (2024JJ7299).
Conflict of interest
The authors declare that the research was conducted in the absence of any commercial or financial relationships that could be construed as a potential conflict of interest.
Generative AI statement
The author(s) declare that no Generative AI was used in the creation of this manuscript.
Any alternative text (alt text) provided alongside figures in this article has been generated by Frontiers with the support of artificial intelligence and reasonable efforts have been made to ensure accuracy, including review by the authors wherever possible. If you identify any issues, please contact us.
Publisher’s note
All claims expressed in this article are solely those of the authors and do not necessarily represent those of their affiliated organizations, or those of the publisher, the editors and the reviewers. Any product that may be evaluated in this article, or claim that may be made by its manufacturer, is not guaranteed or endorsed by the publisher.
References
ASTM (2010). “Standard test methods for particle-size distribution (Gradation) of soils using sieve analysis,” in ASTM standard D6913-04e1. West Conshohocken, Pa: American Society for Testing and Materials.
ASTM (2021). Standard Test method for particle-size distribution (Gradation) of fine-grained soils using the sedimentation (Hydrometer) analysis. ASTM standard D7928-21e1. West Conshohocken, Pa: American Society for Testing and Materials.
Bobet, A. (2010). Drained and undrained response of deep tunnels subjected to far-field shear loading. Tunn. Undergr. Space Technol. 25 (1), 21–31. doi:10.1016/j.tust.2009.08.001
Cai, Y., Hao, B., Gu, C., Wang, J., and Pan, L. (2018). Effect of anisotropic consolidation stress paths on the undrained shear behavior of reconstituted Wenzhou clay. Eng. Geol. 242, 23–33. doi:10.1016/j.enggeo.2018.05.016
Chen, T., Hu, Z., Yang, Z., and Zhang, Y. (2023). A resolved CFD–DEM investigation into the onset of suffusion: effect of confining pressure and stress anisotropy. Int. J. Numer. Anal. Methods Geomechanics 47 (16), 3018–3043. doi:10.1002/nag.3611
Graham, J., and Houlsby, G. T. (1983). Anisotropic elasticity of a natural clay. Géotechnique 33 (2), 354–180. doi:10.1680/geot.1983.33.3.354a
Hao, Y. Z., Cheng, L., and Xiao, W. F. (2022). Experimental study on permeability anisotropy of unsaturated compacted loess. Adv. Civ. Eng. 2022, 9348604. doi:10.1155/2022/9348604
Hardin, B. O., and Drnevich, V. P. (1972). “Shear modulus and damping in soils: design equations and curves,” J. Soil Mech. Found. Div, 98, 667–692. doi:10.1061/jsfeaq.0001760
He, Z. M., Xiang, D., Liu, Y. X., Gao, Q. F., and Bian, H. B. (2020). Deformation behavior of coarse-grained soil as an embankment filler under cyclic loading. Adv. Civ. Eng. 2020 (3), 4629105–4629113. doi:10.1155/2020/4629105
Hong, B., Li, X. A., Wang, L., and Liu, L. (2019). Temporal variation in the permeability anisotropy behavior of the Malan loess in northern Shaanxi Province, China: an experimental study. Environ. Geol. 78 (15), 447. doi:10.1007/s12665-019-8449-z
Houlsby, G. T., and Graham, J. (1983). Anisotropic elasticity of a natural clay. Geotechnique 33 (2), 165–180. doi:10.1680/geot.1983.33.2.165
Hu, L. X., Prunier, F., and Daouadji, A. (2021). Influence of elastic anisotropy on the mechanical behavior of soils. Eur. J. Environ. Civ. Eng., 1481035. doi:10.1080/19648189.2020.1841035
Jiang, M., Zhang, A., and Li, T. (2019). Distinct element analysis of the microstructure evolution in granular soils under cyclic loading. Granul. Matter 21 (2), 39. doi:10.1007/s10035-019-0892-8
Karimzadeh, A., Leung, A. K., and Gao, Z. (2024). Maximum shear modulus anisotropy of rooted soils. Géotechnique 23, 00496. doi:10.1680/jgeot.22.00103
Li, Y. (2017). A review of shear and tensile strengths of the Malan Loess in China. Eng. Geol. 236, 4–10. doi:10.1016/j.enggeo.2017.02.023
Li, X., Li, Y., Li, Q., Zhang, X., Shi, X., Lu, Y., et al. (2023). The seepage evolution characteristics in undisturbed loess under dynamic preferential flow: new insights from x-ray computed tomography. Water 15 (16), 2963. doi:10.3390/w15162963
Li, S., Lu, T., Zhou, K., Gu, Y., Wang, B., and Lu, Y. (2024). Modeling and application of the Hydrus-2D model for simulating preferential flow in loess soil under various scenarios. Water 16, 3653. doi:10.3390/w16243653
Li, L., Zhou, P., Li, J., Huang, L., and Shao, W. (2025). Numerical simulation of time-dependent performance of jacked piles in marine clays: considering anisotropy and destructuration. Ocean. Eng. 322, 120461. doi:10.1016/j.oceaneng.2025.120461
Liao, H., Xiao, Z., and Liu, J. (2011). Study of variation of backbone curve of saturated remolded loess under dynamic loading. Rock Soil Mech. 32 (2), 375–379. (In Chinese). doi:10.16285/j.rsm.2011.02.023
Liu, X., Zhang, X., Kong, L., Yin, S., and Xu, Y. (2022). Shear strength anisotropy of natural granite residual soil. J. Geotechnical Geoenvironmental Eng. 148 (1), 04021168. doi:10.1061/(asce)gt.1943-5606.0002709
Liu, X., Zhang, X., Kong, L., Wang, G., and Li, C. (2023). Multiscale structural characterizations of anisotropic natural granite residual soil. Can. Geotechnical J. 60 (9), 1383–1400. doi:10.1139/cgj-2022-0188
Riyahikhoo, A., Akhtarpour, A., and Salari, M. (2025). Experimental investigation of stress-induced anisotropy on the yield surface of mine tailings. Transp. Infrastruct. Geotechnol. 12 (1), 64. doi:10.1007/s40515-024-00523-2
Shrivastava, A., and Sachan, A. (2023). Effect of stress-induced anisotropy on shear modulus response of compacted coal ash under small-strain dynamic loading conditions. Soil Dyn. Earthq. Eng. 170, 107898. doi:10.1016/j.soildyn.2023.107898
Soroush, A., and Soltani-Jigheh, H. (2001). “Effects of shear strength anisotropy on stability of earth structure,” in 54th Canadian geotechnical conference, 1110–1114.
Wang, H., Qian, H., and Gao, Y. (2021). Characterization of macropore structure of remolded loess and analysis of hydraulic conductivity anisotropy using X-ray computed tomography technology. Environ. Earth Sci. 80, 197. doi:10.1007/s12665-021-09405-z
Wang, X., Xu, C., Liang, K., and Iqbal, K. (2024). Mechanical characteristics and microstructure of saturated sand under monotonic and cyclic loading conditions. Soil Dyn. Earthq. Eng. 176, 108283. doi:10.1016/j.soildyn.2023.108283
Wen, S. J., Cheng, W. C., Li, D. F., and Hu, W. L. (2023a). Evaluating gas breakthrough pressure and gas permeability in a landfill cover layer for mitigation of hazardous gas emissions. J. Environ. Manag. 336, 117617. doi:10.1016/j.jenvman.2023.117617
Wen, S. J., Cheng, W. C., Li, D. F., and Hu, W. L. (2023b). Immobilizing lead using loess and nanoscale zerovalent iron (nZVI)-amended loess: insights from macroscopic and microscopic tests. Environ. Technol. and Innovation 31, 103228. doi:10.1016/j.eti.2023.103228
Xu, L., Gao, Y. C., and Wei, X. (2019). Anisotropic behavior of a saturated clayey loess. Géotechnique Lett. 9 (1), 1–26. doi:10.1680/jgele.18.00125
Xu, P., Zhang, Q., Qian, H., and Hou, K. (2020). Investigation into microscopic mechanisms of anisotropic saturated permeability of undisturbed Q2 loess. Environ. Earth Sci. 79 (18), 412. doi:10.1007/s12665-020-09152-7
Xu, P., Lin, T., Qian, H., and Zhang, Q. (2021). Anisotropic microstructure of loess-paleosol sequence and its significance for engineering and paleoclimate: a case study from Xiushidu (XSD) profile, southern Chinese Loess Plateau. Eng. Geol. 286 (1), 106092. doi:10.1016/j.enggeo.2021.106092
Yang, L. T., Li, X., Yu, H. S., and Wanatowski, D. (2016). A laboratory study of anisotropic geomaterials incorporating recent micromechanical understanding. Acta Geotech. 11 (5), 1111–1129. doi:10.1007/s11440-015-0423-7
Yang, X., Wang, Y., and Sun, Z. (2020). The shearing anisotropy characteristics on the interface of loess with bedrock. Bull. Eng. Geol. Environ. 79 (10), 5205–5212. doi:10.1007/s10064-020-01887-8
Yu, X., Liu, H., Sun, R., and Yuan, X. (2018). Improved Hardin-Drnevich model for the dynamic modulus and damping ratio of frozen soil. Cold Regions Sci. Technol. 153, 64–77. doi:10.1016/j.coldregions.2018.05.004
Yu, J., Cao, J., Chen, Z., Zhu, J., Zhang, Y., and Yu, P. (2025). Hypoplastic modeling of soil–structure contact surface considering initial anisotropy and roughness. Appl. Sci. 15, 244. doi:10.3390/app15010244
Zarei, C., Soltani-Jigheh, H., and Badv, K. (2019). Effect of inherent anisotropy on the behavior of fine-grained cohesive soils. Int. J. Civ. Eng. 17 (6), 687–697. doi:10.1007/s40999-018-0292-1
Zhang, Q., Qian, H., Xu, P., Hou, K., Zhang, Y., Qu, W., et al. (2022). Microscale evidence for and formation mechanisms of shear-strength anisotropy of a loess-paleosol sequence since the late early Pleistocene: the case study of the Xiushidu profile, southern Chinese Loess Plateau. Catena 213, 106228. doi:10.1016/j.catena.2022.106228
Zhang, B., Shao, S., Shao, S., Yang, L., Wu, J., and Qi, L. (2025). Experimental study on the deformation of anisotropic loess under cyclic spherical stress. Int. J. Geomechanics 25 (7), 04025111. doi:10.1061/ijgnai.gmeng-10903
Zhou, C., and Chen, R. (2021). Modelling the water retention behaviour of anisotropic soils. J. Hydrology 599, 126361. doi:10.1016/j.jhydrol.2021.126361
Zhu, Y., Fan, W., and Liang, J. (2024). Effects of realistic particle morphology on mechanical behaviors of loess with discrete element analyses. Environ. Earth Sci. 83 (18), 544. doi:10.1007/s12665-024-11848-z
Keywords: intact loess, anisotropy, stress-strain relationship, initial dynamicelastic modulus, microstructure
Citation: Wen S, Li D, Yin Z and Zhang W (2025) Anisotropy of intact loess under dynamic and static loads: insights from macroscopic and microscopic tests. Front. Earth Sci. 13:1687402. doi: 10.3389/feart.2025.1687402
Received: 17 August 2025; Accepted: 30 September 2025;
Published: 15 October 2025.
Edited by:
Binbin Yang, Xuchang University, ChinaReviewed by:
Hui Yang, Northwest University, ChinaAmirabbas Riyahikhoo, Ferdowsi University of Mashhad, Iran
Copyright © 2025 Wen, Li, Yin and Zhang. This is an open-access article distributed under the terms of the Creative Commons Attribution License (CC BY). The use, distribution or reproduction in other forums is permitted, provided the original author(s) and the copyright owner(s) are credited and that the original publication in this journal is cited, in accordance with accepted academic practice. No use, distribution or reproduction is permitted which does not comply with these terms.
*Correspondence: Dongfeng Li, bGRvbmdmZW5nQGpsankuZWR1LmNu