 Chonglin Yin
 Yong Xia1
- 1POWERCHINA Chengdu Engineering Corporation Limited, Chengdu, China
- 2The School of Civil Engineering and Transportation, Hohai University, Nanjing, China
Hydraulic tunnels are subjected to both internal and external water pressures, which further complicates the contact behavior between the surrounding rock and the lining. Currently, analyses addressing this issue remain insufficiently thorough, and this phenomenon is particularly prominent in engineering applications. For this purpose, this study established a unified analytical framework, integrating adhesive, smooth and frictional slip contact, then compared and analyzed the interaction mechanism between the surrounding rock and the lining using numerical and analytical methods. The research results show that a critical friction threshold governs contact behavior, below which interfacial slip reduces lining tensile stress by 9.5% through stress redistribution; Elastic modulus ratio E2/E1 dominates stress sensitivity, an increase from 2 to 5 elevates crown tension by 80.3%—far exceeding thickness effects; The lateral pressure coefficient and the displacement release coefficient have significant impacts on both the distribution pattern and the magnitude of stresses. Appropriately delaying the timing of lining installation can effectively reduce the stresses in the lining. The new variable reduction algorithm proposed in this paper accelerates computation by 75% and improves accuracy by 2.2%, which is highly feasible. This mechanics-based framework transforms lining design from empirical practice to quantified optimization, delivering actionable protocols for the safety and economy of hydropower infrastructure.
1 Introduction
Cascade development in river basins has been widely adopted to harness abundant hydropower resources in the mountainous canyon regions of Southwest China. As hydropower projects progressively shift toward these high-altitude areas, water-diversion tunnels now exhibit larger scales and greater burial depths, thereby imposing more complex structural demands (Wang and Tan, 2010). Under such challenging geological conditions, appropriate linings and supports become essential to ensure surrounding rock stability and structural safety. Unlike transportation tunnels, hydraulic tunnels face combined internal and external water pressures, making their structural integrity under multi-field loading a critical concern. According to the continuum mechanics-based New Austrian Tunneling Method (NATM), tunnel stability is fundamentally maintained through synergistic interaction between linings and surrounding rock (Chen, 2006).
The selection of interaction models for rock-lining interfaces significantly influences structural calculations. Although analytical and numerical methods are extensively employed in tunnel engineering (Timoshenko and Goodier, 2007), three persistent limitations hinder practical applications: the complexity of contact due to material heterogeneity at the lining-rock interfaces, the computational inefficiency of deriving rapid analytical solutions, and insufficient quantification of parameter sensitivity (e.g., relative lining stiffness E2/E1, thickness d/R0, lateral pressure coefficient λ, and displacement release coefficient η). These gaps are particularly pronounced for frictional sliding contact conditions where mature methodologies remain underdeveloped.
Previous research has primarily progressed along three contact-model paradigms. The analysis of circular lining tunnels is generally conducted using the thick-walled cylinder theory from elasticity. This approach mainly distinguishes between two types of problems: those involving fully bonded contact and those involving smooth contact (Moore and Booker, 1985). For fully bonded contact, characterized by perfect displacement continuity, closed-form solutions were first derived by Bobet for pressurized tunnels considering pore water effects (Bobet, 2003), later extended to shallow tunnels (Bobet and Nam, 2007). While Li et al. investigated elastic responses to initial stress fields (Li and Wang, 2008), support delay was neglected—an omission subsequently addressed through displacement release coefficients (Lu et al., 2011). Considering the influence of pore water pressure, Guo et al. evaluated the stability of the surrounding rock of lined tunnels under full contact conditions using the Mohr-Coulomb criterion. However, they still assumed that the lining was constructed immediately after excavation (Guo et al., 2021). Wang et al. considered the support delay, but only in the radial direction, without addressing the impact of tangential displacement (Wang and Li, 2009). Han et al. further integrated support lag into complex-variable formulations (Han et al., 2018). In contrast, smooth contact models imposing zero interfacial shear stress were pioneered using relative stiffness methods (Richard, 1964; Hoeg, 1968), with rigorous benchmarks established by Moore and Booker (Moore and Booker, 1985). Recent innovations include Gao’s double-layer cylinder solutions (Gao et al., 2013) and Lu’s models combining support delay with pure slip conditions (Lu et al., 2014).
Regarding frictional sliding contact, the Coulomb friction model for rigid bodies is simple, easy to use, and widely applicable. Meschke et al. employed the Coulomb friction model to simulate the interaction between piles and soil (Meschke et al., 2013). Analytical complexity arises from nonlinear boundary constraints, leading most studies toward numerical approximations such as augmented Lagrangian methods (Cavalieri and Cardona, 2013; Cavalieri and Cardona, 2015) or segment-spring systems (Su and He, 2007; Yang et al., 2010). Although analytical solutions for circular tunnels were derived by Lu et al. (2019), comparative analyses across all three contact modes—particularly quantification of stress transitions modulated by different engineering parameters—were not conducted. Ahn and Pouya established a new analytical solution for elastic contact between the lining and ground, the comparisons are given with other works for various slip conditions, but the lining is modeled as an elastic circular shape shell (beam in 2D) (Ahn and Pouya, 2023).
A review of existing research on lined tunnels reveals that the most common approaches assume either a fully bonded or a perfectly smooth interface between the surrounding rock and the lining. However, these studies often neglect the excavation process or fail to account for the practical phenomenon of support delay. Under frictional slip contact conditions, the work of Ahn and Pouya simplifies the lining to a beam and does not consider the excavation load ratio prior to the installation of the lining, similarly assuming that the application of the lining is instantaneous. Although Lu takes support delay into account, the setup and solution process of his optimization model have inherent flaws, which lead to difficulties when extending the approach to tunnels with arbitrary cross-sections. Consequently, two critical research deficiencies persist: the absence of a unified framework comparing stress distributions across bonded, smooth, and frictional slip contacts, and limited engineering applicability due to unquantified parameter influences. To address these deficiencies, complementary analytical and numerical approaches were employed to investigate the interaction mechanisms. The engineering applicability of both methods was evaluated through rigorous comparison with conventional design methodologies. Building upon this foundation, a rapid and accurate optimization method for analytical solutions was developed, and parametric influences on stress distribution patterns were systematically analyzed. This integrated framework is intended to advance theoretical models for tunnel surrounding rock and lining, and make up for the deficiencies in the theory and practice of hydropower tunnel design.
2 Analytical methods for the rock-lining interaction
2.1 Fundamental theory
The stress-strain calculation of the surrounding rock and lining in a circular tunnel is usually simplified as a key section solution due to its high length-to-diameter ratio and high symmetry characteristics. The contact between the surrounding rock and the lining can be classified into three types: fully bonded contact, smooth contact and frictional slip contact.
Fully bonded contact assumes no relative displacement at any point along the interface. In numerical methods, this is typically simulated through shared nodes, assuming continuity of normal stress, tangential shear stress, and displacements (the subscripts I and II represent the surrounding rock and the lining, respectively). The stress and the displacement continuity conditions are expressed as Equations 1, 2, respectively:
However, actual concrete materials often cause slight separation and relative slippage, making this model conservative.
Smooth contact maintains normal stress and displacement continuity but permits tangential displacement discontinuity with zero shear stress. At this point, the expressions for the boundary conditions and continuity conditions are given by Equations 3, 4:
This model allows relative sliding but is rarely used practically due to unrealistic frictionless assumptions.
Frictional slip contact represents an intermediate state governed by Coulomb’s friction theory, as expressed in Equation 5. When the coefficient of friction is zero or exceeds a certain threshold, the analytical solutions for two extreme contact conditions (perfect combined contact and smooth contact) can be derived.
This method is also often referred to as an optimization algorithm based on the complex function theory, in which, relative sliding may occur when the friction coefficient is below a critical threshold, while higher values induce bonded behavior. Therefore, the application of complex function theory requires determining analytic function coefficients from boundary conditions and contact models to derive stress and deformation fields.
2.2 Engineering construction of analytical function
The computational model of deeply buried circular tunnels under in-situ stresses and internal water pressure was established as shown in Figure 1. Parameters were specified as: p0 = 2.0 MPa, R1 = 3.0 m, R0 = 2.5 m, μ1 = 0.25 (rock), μ2 = 0.20 (lining), E2/E1 = 10.0, and η = 0.20. The coefficient η quantifies support delay, where η = 0 indicates immediate lining installation after excavation and η = 1 corresponds to installation after complete rock deformation. For frictional slip contact, fr = 0.5 was initially adopted.
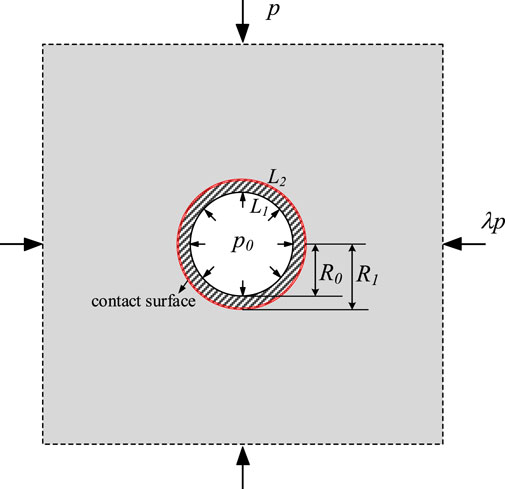
Figure 1. Analytical function calculation model under in-situ stresses and internal water pressure.
After tunnel excavation, the surface forces on the boundary are released, and the displacement resulting from this excavation can be expressed in Equation 6,
Where
The two complex potential functions in the rock and lining are γR(z), χR(z), γL(z), χL(z), they can be expressed by Taylor and Laurent series. The expressions for the stress and displacement of the surrounding rock are given by Equations 7, 8.
In the lining, the expressions for the stress and displacement of the lining are given by Equations 9, 10.
Based on the boundary conditions and contact conditions described in Section 2.1, a system of equations (or inequalities) for determining the coefficients of the analytic functions can be formulated. The calculation processes of the analytical solutions under the three different contact modes are as follows respectively:
1. Fully bonded contact needs to take into account the internal boundary conditions of the lining, the continuity conditions at the contact interface, the displacement boundary conditions, and the contact interface conditions. For circular tunnels, according to the derivation process, only nine parameters are required to determine the corresponding analytical function, as follows:
where, I1 = 1-η, I2=(1-η)*κ1, I3 = G1/G2, I5 = 1+λ, I6 = 1- λ, the same applies below. The coefficients of the analytic function can be determined by solving the system of equations composed of expressions (Equations 11–19).
2. Smooth contact modifies five equations while retaining Equations 11–13, 17 due to differences in continuity of the contact interface and the contact conditions:
By simultaneously solving Equations 6–8, 12, 20–24, the coefficients of the analytic functions under smooth contact conditions can be obtained.
3. Frictional slip contact due to the lack of contact condition equations, only eight equations can be formulated, similarly. And the equations different from those for smooth contact are given by Equation 25:
There are nine unknowns but only eight equations, so it is necessary to use additional conditions for optimal solution.
Characteristics of frictional sliding contact conditions are defined by identifying the onset of minimal relative sliding as the critical point. According to the Coulomb friction theory, the corresponding inequality equation is as follows:
Taking the minimization of the relative slip on the contact surface as the objective function,
Finally, by employing optimization computational methods, the coefficients of the analytical functions that satisfy the boundary conditions can also be obtained.
Here, a novel optimization method is considered to solve this problem. The expressions for the inequality constraints and the objective function are given in Equations 26, 27, respectively. The original optimization model contains 9 design variables and 8 sets of equality equations. By selecting any one of the variables in xi (i = 1, … , 9) as the design variable—for example, x9—and assigning it an initial value, the remaining 8 variables xi (i = 1, … , 8) can be determined by solving the 8 equations. Subsequently, these values of xi (i = 1, … , 8) are substituted into the following optimization model to obtain the optimized result.
Similarly, by employing the augmented penalty function method for optimization, and compared with the traditional penalty function form that includes equality constraints, the penalty function form given in Equation 28 does not contain the quadratic loss term with
To compare the accuracy of the two models, we use frictional slip contact as an example. When fr = 0.1, the objective function values (i.e., the tangential displacement difference) calculated by the new and old models are 2.4129 and 2.4659, respectively, representing an improvement of approximately 2.2%. Comparing the stress results obtained by the two models, and taking the radial stress at the inner boundary of the lining as an example, the theoretical value is 2.0 MPa. The maximum relative error of the stress obtained using the new optimization model is 2.025 × 10⁻²%, whereas the maximum relative error obtained using the old optimization model is 2.047%. Therefore, with respect to the theoretical solution, the results from the old optimization model exhibit a larger error. Meanwhile, in the old optimization model, the objective function was accessed approximately 1,000 to 3,000 times, whereas in the new model, this number has been reduced to the range of 200–300. This improvement is attributed to the fact that the method proposed in this paper can ensure, through equation solving, that
2.3 Process of solving the analytical function
After determining the coefficients of the analytic functions, the stress components within the lining (
The stress field in the surrounding rock is formulated by superimposing three distinct components: the initial stress before excavation, the stress state after excavation, and the stress after support installation. The complete expressions are given in Equations 32–34:
The tangential displacements for both surrounding rock and lining are similarly obtained, and their expressions are given by Equations 35, 36:
The distributions of contact stress under the three contact modes are analyzed within the [0°–90°] interval, utilizing the inherent symmetry of circular tunnels. To maintain consistency and facilitate the analysis of stress distribution patterns, the stresses in the figures are presented in the form of stresses p. Computations employ a lateral pressure coefficient λ = 0.5 and cohesion c = 0.15 MPa. As demonstrated in Figure 2, when the friction coefficient fr = 0 and cohesion c = 0, the interfacial contact stresses exhibit exact correspondence with smooth contact solutions. Conversely, when fr ≥ 0.59, the results converge completely to fully bonded contact solutions. For intermediate values of fr, the solutions consistently reside between these two limiting cases.
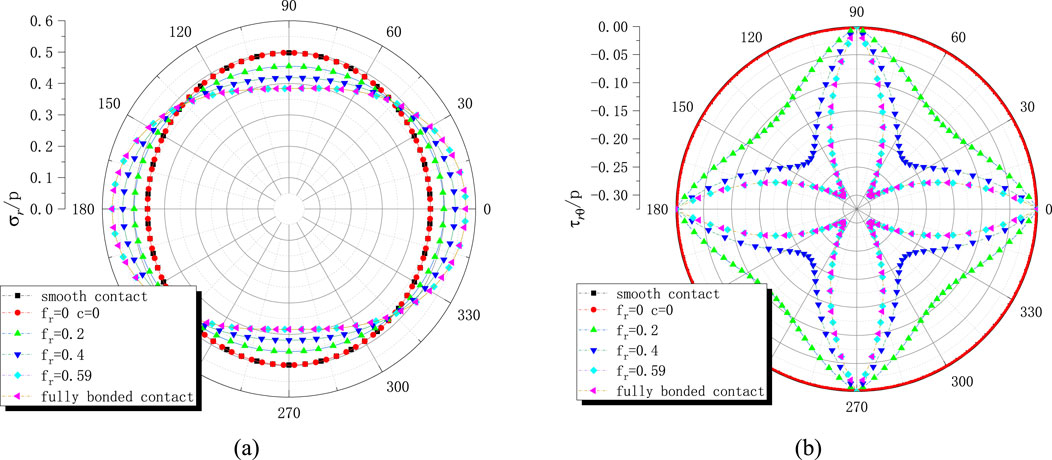
Figure 2. Distribution of contact stress on the contact surface: (a) Variation of radial stress
Further analysis in Figure 3 reveals that the maximum relative slip between the lining and surrounding rock occurs at the 45° position, corresponding to the arch shoulder, with the magnitude of slip diminishing progressively as fr increases. The radial stress σr at the 45° arch shoulder remains invariant when the horizontal in-situ stress is less than the vertical component. Under smooth contact conditions (fr = 0), peak radial stresses are observed at the arch crown (90°) and arch base (0°). However, when the friction coefficient exceeds 0.2, the stress peak shifts toward the arch haunch. As fr continues to increase, the distribution of radial stress around the tunnel periphery transitions toward a flattened elliptical pattern, characterized by reduced stress at the crown and elevated stress at the haunch.
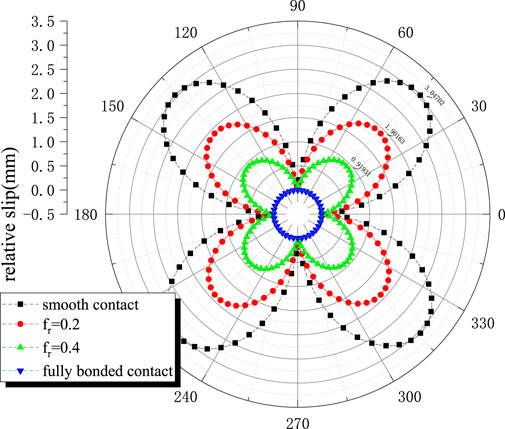
Figure 3. Distribution of relative slip on the contact surface.
Shear stress τrθ and tangential displacement differences exhibit an inverse relationship: increases in shear stress correspond to decreases in relative displacement differences, with both parameters attaining their maximum values in the vicinity of the arch shoulder. When the friction coefficient attains the critical threshold frl = 0.59, the condition
3 Validation and analysis
3.1 Numerical validation of the analytical results
The accuracy of the analytical solutions is verified through stress and displacement results from the three contact models. To further validate these results, ANSYS software is employed for numerical analysis. Unlike the conventional “load-structure model” historically used in design, a contact model incorporating initial ground stress is implemented in this study. The “reverse stress release method” is adopted to simulate the delayed support installation process. Equivalent nodal loads after excavation are calculated, with the released load magnitude modeling the support delay effect. In the elastic state, when the displacement release coefficient is η, the remaining (1-η) portion of the load acts on the lining, inducing rock-lining interaction. The final stress at the excavation boundary is determined by superimposing the initial in-situ stress and the stress induced by releasing η times the equivalent load.
Among several contact models in ANSYS, the “surface-to-surface” contact was selected due to its numerous advantages, such as supporting large sliding and friction, providing frictional stress results, and allowing multiple modeling controls. During the calculation process, the PLANE42 element was employed to simulate both the surrounding rock and the lining components. The contact between the surrounding rock and the lining was realized through the “surface-to-surface” contact approach in ANSYS. Specifically, the surface of the lining was subdivided into target elements (TARGE169) through mesh division, which were paired with the contact elements (CONTA171) on the surface of the surrounding rock. Both shared the same real constant set to form a contact pair. Since the study addresses a frictional slip contact problem, the KEYOPT (12) keyword option was set to 2 to allow relative sliding, and the friction coefficient between the two materials was set to 0.5. In this study, a mapping function is used to map the ζ-plane onto the z-plane. As a result, the theoretical solution is rotated 90° degrees clockwise relative to the numerical software results.
The boundary conditions and load application schemes of the simulation examples in ANSYS are shown in Figure 4. The external boundary of the selected model measures 50.0 m × 50.0 m, with an excavated tunnel radius of 3.0 m. Point constraints are applied at location A in both the horizontal and vertical directions, while only vertical constraint is imposed at point B. A surface load of 2.0 MPa is applied to the lining’s inner boundary, and the calculated equivalent nodal loads are applied to nodes on the contact surface.
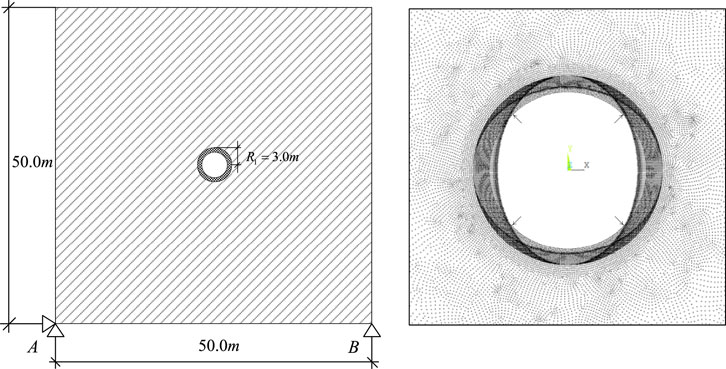
Figure 4. Ansys computational model.
Figure 5 shows the Tangential stress and shear stress distribution contour plot of the lining. Within the range of [0 °–90 °], the tangential stress gradually decreases, while the shear stress reaches its maximum value at 45 °. Figure 6 presents a comparison between the numerical and analytical solutions. Due to symmetry, the results within the range of [0 °–90 °] are compared. At the rock-lining interface, contact stresses obtained by both methods show close agreement, with the maximum relative error of approximately 3.84% occurring at the crown. This minor deviation is attributed to the full compliance with contact conditions at boundaries, demonstrating the superiority of this contact model over traditional “load-structure” approaches. Displacement comparisons reveal a maximum relative error of 13.1% at the crown, further confirming model consistency.
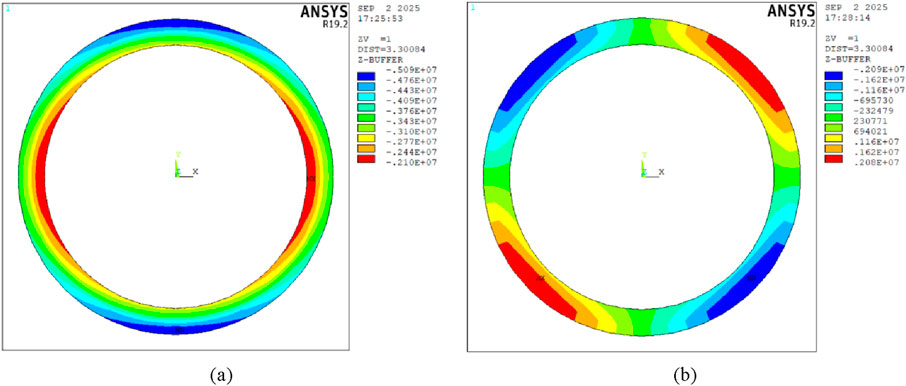
Figure 5. Tangential stress and shear stress distribution contour maps of the lining. (a) Tangential stress; (b) shear stress.
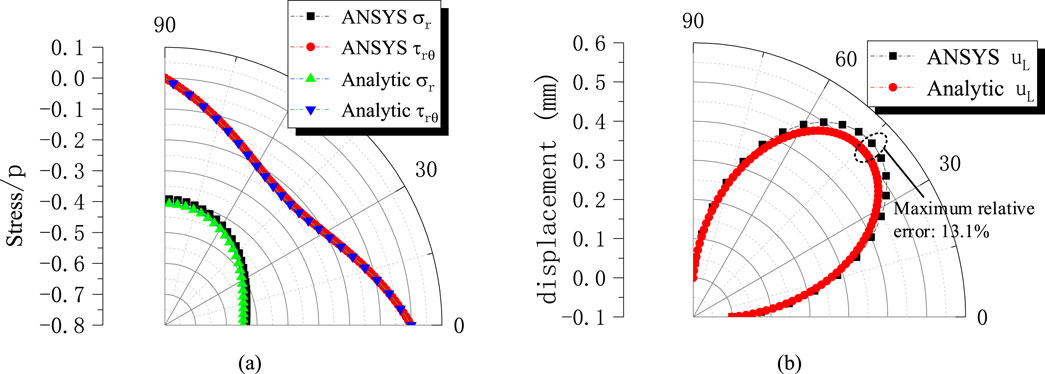
Figure 6. Comparison between analytical solutions and ANSYS numerical solutions. (a) Comparison of contact stresses; (b) Comparison of tangential displacements of the contact surface lining.
3.2 Analysis of stress distribution in surrounding rock and lining
The effects of relative lining thickness and material stiffness on lining and rock stresses are systematically analyzed. Given the significant support delay typical in hydraulic tunnel construction, a displacement release coefficient of η = 0.8 is adopted. All parameters except those under investigation remain unchanged, with analysis focused on the [0 °–90 °] range and engineering-critical tangential stresses.
The influence of elastic modulus ratio E2/E1 is first examined through values of 2, 3, 4, and 5, simulating varying rock-concrete combinations. As shown in Figure 7a, lining stress is significantly affected by modulus ratio changes, exhibiting both tensile and compressive states. At the 0° haunch position, compressive stress is observed, while tensile stress occurs at the 90° crown. Both stress magnitudes increase with higher E2/E1 ratios: when the ratio increases by 2.5 times, haunch compressive stress rises by 50.9%, and crown tensile stress increases by approximately 80.3%, indicating more pronounced effects on crown tension. Figure 7b shows the surrounding rock under compression throughout, with compressive stress gradually decreasing from haunch to crown. Higher modulus ratios reduce the range of stress variation.
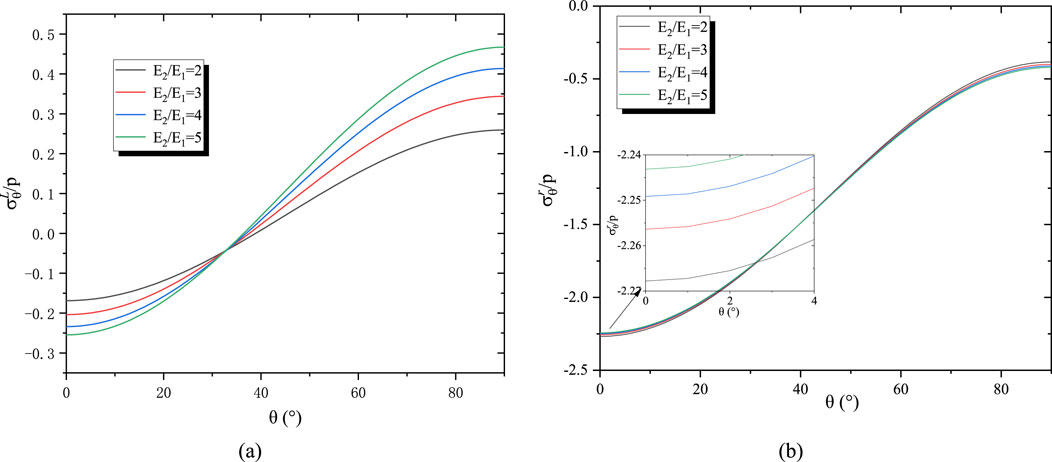
Figure 7. The influence of the modulus ratio on stress distribution. (a) Tangential stress on the inner boundary of the lining for different
The effect of relative lining thickness is then investigated while maintaining constant tunnel internal diameter. Ratios of d/2R0 = 1/8, 1/10, 1/12, and 1/16 are considered. Figure 8a demonstrates that lining thickness has lesser influence than modulus ratio. Compressive stress near the haunch decreases while tensile stress near the crown increases as the lining thins: when thickness is halved, haunch compressive stress reduces by approximately 7.4%, and crown tensile stress increases by 11.4%. Figure 8b confirms compressive stress throughout the surrounding rock, with the range of variation expanding as lining thickness decreases. Collectively, lining stress is more sensitive to elastic modulus and thickness variations than surrounding rock stress, with crown regions exhibiting greater susceptibility than haunch locations.
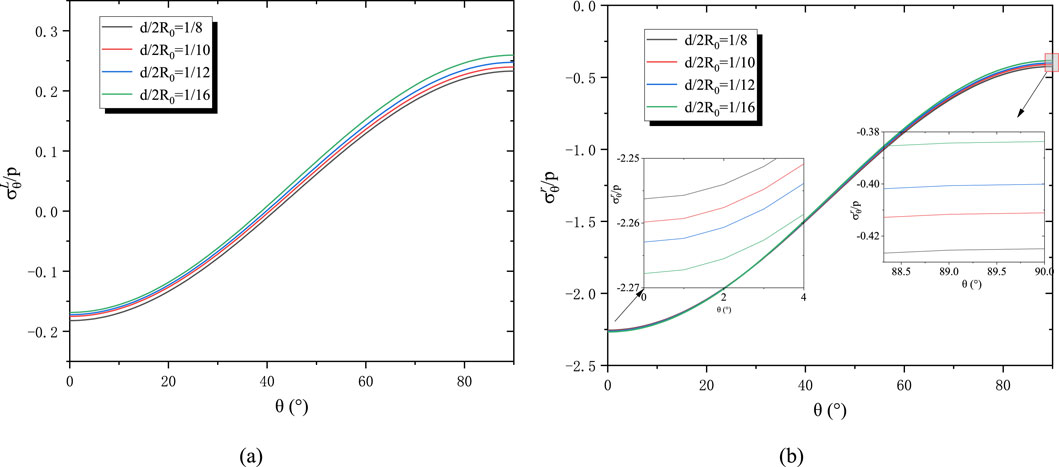
Figure 8. The influence of the relative lining thickness on stress distribution. (a) Tangential stress on the inner boundary of the lining for different relative lining thickness; (b) Tangential stress of the surrounding rock at the contact surface for different relative lining thickness.
Next, the influence of the lateral pressure coefficient λ and displacement release coefficient η on stress distribution is conducted. As indicated by the aforementioned results, the lining stress is more sensitive to changes in these parameters. Therefore, the following analysis focuses primarily on the tangential stress of the lining and the shear stress at the contact interface, with particular attention to stress variations within the 0 °–90 ° range.
As shown in Figure 9, variations in the lateral pressure coefficient (λ = 0.5, 0.8, 1.0, 1.5) lead to significant changes in both tangential and shear stresses. When λ = 1, meaning the horizontal and vertical stresses are equal, both the tangential stress and shear stress remain constant. For smaller values of λ (<0.8), the tangential stress reaches its minimum at the 0° haunch position and its maximum at the 90° crown. Conversely, for larger values of λ, the distribution pattern is reversed, with the minimum tangential stress occurring at the 90° crown. The shear stress attains its extremum at 45 °, and as λ gradually increases, the shear stress shifts from negative to positive. When λ = 1, there is no shear stress on the contact surface, and no relative sliding occurs. Figure 10 illustrates the stress distribution patterns as the displacement release coefficient varies. Similarly, the stress distribution is highly sensitive to changes in the displacement release coefficient. When η = 0, the entire excavation-induced displacement of the surrounding rock is borne by the lining; at this point, both the tangential and shear stresses reach their maximum values. The maximum tangential stress occurs at the 0° haunch position, while the maximum shear stress remains at the 45° position. As η increases, the distribution of tangential stress becomes more uniform, resulting in a more even load on the lining, and the magnitude of the shear stress gradually decreases. When η = 1, indicating that the excavation-induced displacement of the surrounding rock is fully released, the pressure acting on the lining drops to zero, the shear stress at the interface becomes zero, and the lining is subjected only to internal water pressure, thereby exhibiting a tensile state.
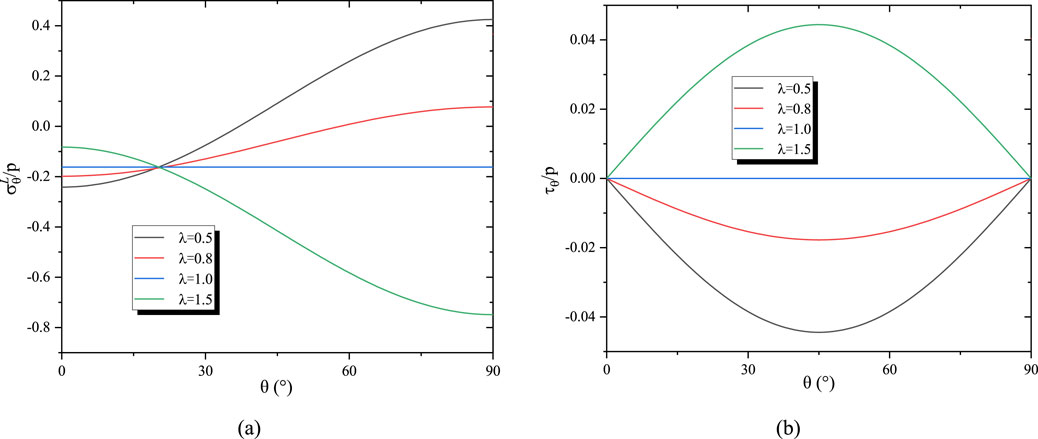
Figure 9. The influence of the lateral pressure coefficient on stress distribution. (a) Tangential stress of the lining; (b) shear stress at the contact surface.
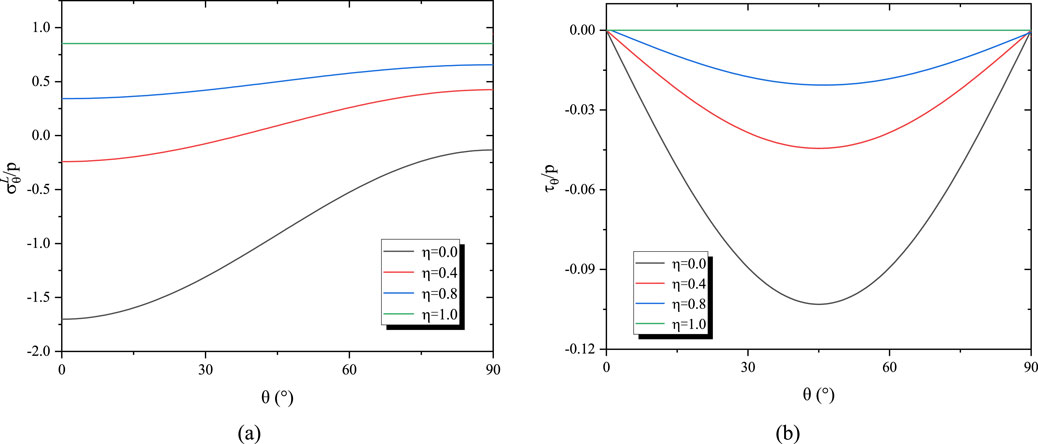
Figure 10. The influence of the displacement release coefficient η on stress distribution. (a) Tangential stress of the lining; (b) shear stress at the contact surface.
4 Engineering applications and comparative analysis
4.1 Project background: Yingliangbao diversion tunnels
The Yingliangbao Hydropower diversion tunnels serve as a validation case study due to their large-scale and representative characteristics, featuring an internal diameter of 13.1 m and significant lengths of 14,316.909 m (Tunnel No. 1) and 14,418.569 m (Tunnel No. 2). Operating under internal water pressures ranging from 0.30 to 0.74 MPa, these tunnels employ full-section reinforced concrete linings with thicknesses varying according to surrounding rock classifications: 0.4 m for class III1, 0.5 m for class III2, 0.8 m for class IV, and 1.0 m for class V. Debris collection pits installed in favorable rock sections prevent turbine damage, while connections to dedicated surge chambers Nos. 1-2 ensure operational stability.
This analysis focuses on class III1 rock sections (Figure 11), utilizing surrounding rock parameters (unit weight 26.5 kN/m3, deformation modulus 10 GPa, Poisson’s ratio 0.25) and C25 concrete properties (unit weight 25 kN/m3, elastic modulus 28 GPa, tensile strength 1.27 MPa) as specified in Table 1 and 2.
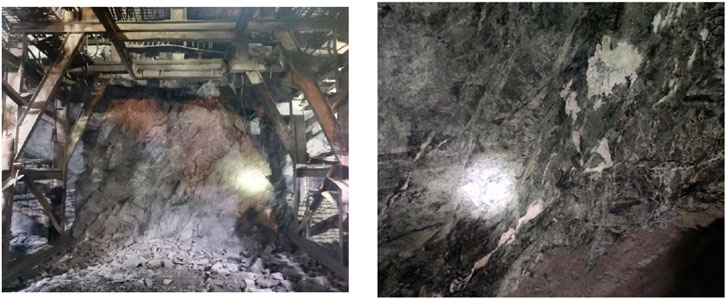
Figure 11. Site photograph of the excavation face in the Class III surrounding rock tunnel section.
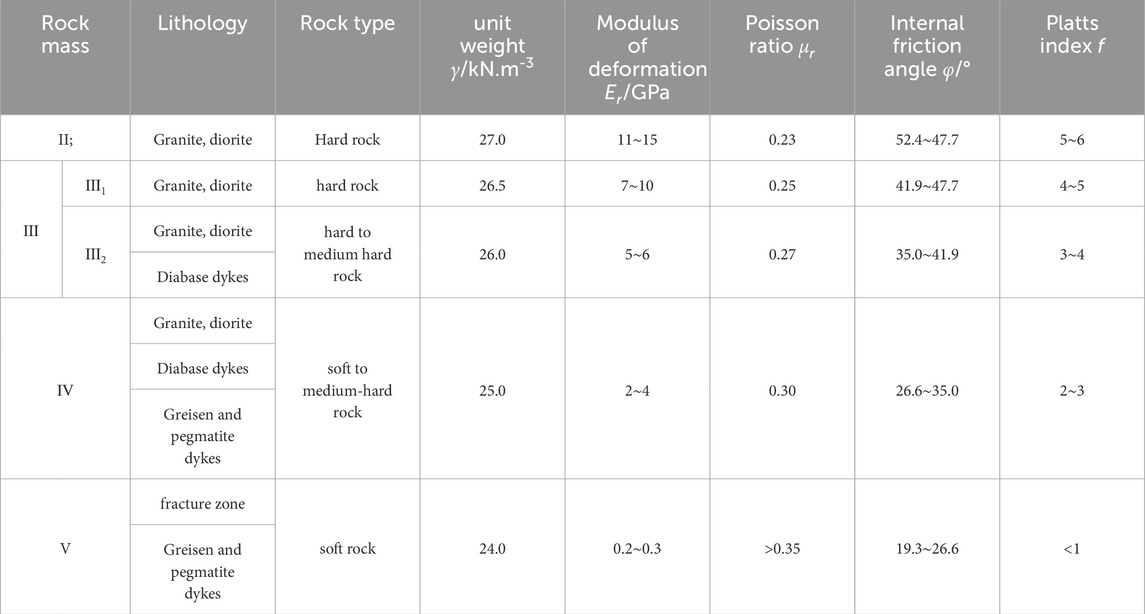
Table 1. Rock mass classification and recommended values for physical-mechanical parameters.

Table 2. Calculation Parameters of C25 concrete.
4.2 Parallel computational framework
A dual modeling approach is implemented to evaluate lining performance. The proposed analytical method adopts frictional slip contact with a friction coefficient fr = 0.5 based on field measurements and displacement release coefficient η = 0.8 to account for support delay, explicitly simulating interfacial relative slip effects. Comparative analysis employs a conventional load-structure model in ANSYS, where the lining is modeled with BEAM3 elements (192 nodes, 256 elements total) and surrounding rock with COMBIN39 spring elements. Earth pressures are calculated per GB-T 51394-2020 collapse arch theory, incorporating empirical reductions for actual rock conditions. The load application sequence initiates with full constraint imposition at spring elements, followed by gravitational acceleration on all elements, and concludes with internal pressure transmission through rock-lining connection springs, as depicted in Figure 12.
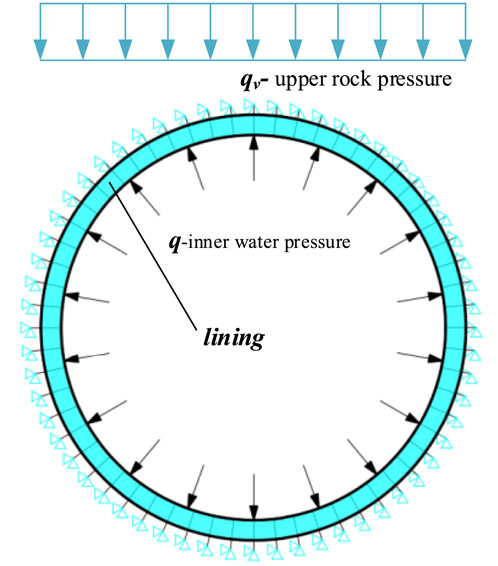
Figure 12. Operational condition load calculation model.
4.3 Result comparison and discrepancy analysis
Both computational methods identify the vault inner edge as the critical tensile stress concentration zone. The analytical solution (Figure 13a) demonstrates progressive tensile stress increases from haunch (0 °) to crown (90 °), reaching peak values of 0.941 MPa at the inner edge and 0.875 MPa at the outer edge. In contrast, the numerical solution exhibits analogous distribution patterns but yields 9.51% higher peak tension (1.04 MPa), calculated as Δσt = ∣1.04–0.941∣/0.941% × 100%. This discrepancy arises because the numerical model assumes perfect bonding, neglecting interfacial slip that reduces tensile stress in the analytical formulation. This mechanism is corroborated by principal stress contours in Figure 14b showing elevated tension at the bonded crown. Analysis of thickness effects (Figure 14) further reveals that increasing lining thickness from 0.4 m to 0.8 m decreases crown tensile stress by 15% in analytical results, while haunch compressive stress variations remain below 8%.
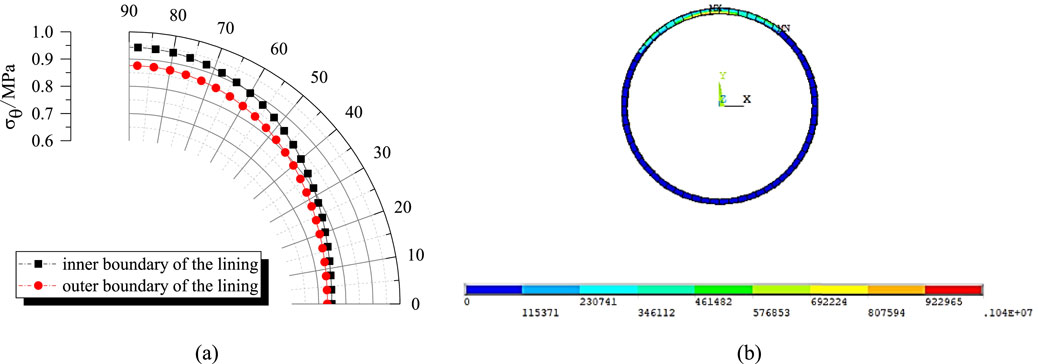
Figure 13. Tangential stress variation and major principal stress contour plot of the lining under operational condition. (a) Tangential stress by analytical method; (b) Major principal stress by numerical method.
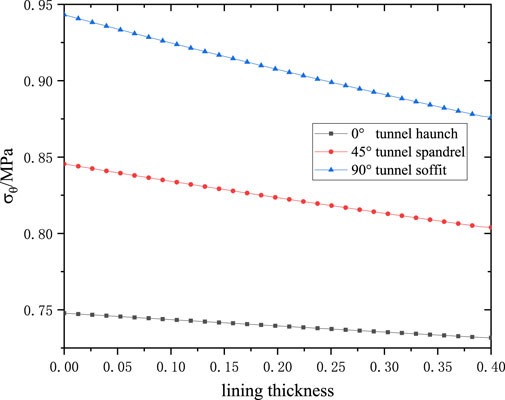
Figure 14. Distribution of tangential stress within the lining at different locations.
As for the construction conditions (Figure 15), according to Code for Design of Hydraulic Tunnel (NB/T 10391-2020), only external water pressure and rock pressure are considered, while internal water pressure is neglected. Under these conditions, the maximum compressive stress in the lining obtained by numerical method is 2.44 MPa, whereas the maximum compressive stress from the analytical solution is approximately 1.96 MPa. This discrepancy arises because the analytical solution derived in this study is currently unable to simulate the effect of external water pressure. When considering the effect of external water pressure, it is necessary to derive the expression for the inhomogeneous biharmonic equation with respect to
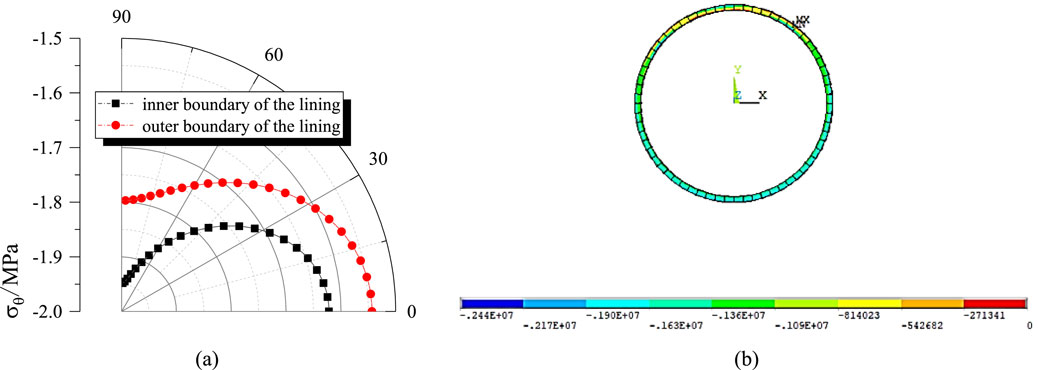
Figure 15. Tangential stress variation and third principal stress contour plot of the lining under construction condition. (a) Tangential stress by analytical method; (b) third principal stress by numerical method.
4.4 Design optimization guidelines
The comparative analysis yields three actionable engineering insights. First, interfacial behavior control through measures allowing controlled slip (e.g., geotextile interlayers) reduces crown tensile stress by approximately 9.5%, potentially decreasing reinforcement requirements by 15%–20% when evaluated against ACI 318 tension limits. Second, material optimization strategies may be considered where friction coefficients are below 0.59; reducing concrete grade from C25 to C20 decreases elastic modulus from 28 GPa to 25 GPa, subsequently lowering tensile stress by 15% while maintaining safety margins above 0.85 times tensile strength (1.08 MPa for C25). Third, model selection should be conditioned on interface parameters: frictional slip contact models are recommended when friction coefficients are below 0.59 and cohesion under 0.2 MPa, with analytical methods suitable for preliminary design and load-structure models incorporating slip allowances preferred for final safety verification. These principles have been preliminarily implemented in Yingliangbao Tunnel reinforcement design, demonstrating 12% material cost reduction in pilot sections while sustaining safety factors exceeding 2.0.
5 Conclusion
This study establishes a unified analytical framework for simulating rock-lining interaction in hydraulic tunnels, resolving longstanding challenges in contact mechanics through optimized algorithms and systematic parametric validation. The principal conclusions, substantiated by analytical and numerical results, are summarized as follows:
a. The contact mode controlled by friction has a significant impact on the stress distribution of the surrounding rock and lining of the tunnel. A critical friction coefficient threshold of fr = 0.59 determines interfacial behavior transition, below which interfacial slip redistributes stresses significantly. This is evidenced by 9.5% lower crown tensile stress in analytical solutions (0.941 MPa) versus bonded-assumption numerical models (1.04 MPa) at Yingliangbao Tunnel, attributable to peak relative slip at 45° arch shoulder driving stress migration from crown to haunch when fr > 0.2.
b. The stress sensitivity of the lining is highly dependent on the elastic modulus ratio between surrounding rock to that of the lining. Elastic modulus ratio E2/E1 dominates stress magnitude with nonlinear escalation, where increasing from 2 to 5 elevates crown tensile stress by 80.3% and haunch compression by 50.9%—exceeding thickness effects which show only 15% tensile variation when thickness reduces from 0.8 m to 0.4 m. Crucially, maximum tensile stress consistently localizes at crown inner edge across all parameters.
c. The lateral pressure coefficient and displacement release coefficient significantly influence the distribution pattern of stress. Different initial in-situ stress distributions may lead to a reversal in the spatial distribution of tangential stress within the lining, whereas their effect on shear stress is primarily reflected in numerical changes, with the extremum consistently occurring near 45°. The timing of lining installation mainly affects the range of stress variation. In practical engineering, if the surrounding rock conditions are favorable, lining construction can be delayed, potentially reducing the maximum lining stress by approximately 57.1%. Conversely, if the surrounding rock conditions are poor, the timing of lining installation should be determined by comprehensively considering the stability of the surrounding rock.
d. The calculation method of tunnel surrounding rock and lining proposed in this paper has a significant effect on improving the actual design efficiency of the project. The variable-reduction technique accelerates computation by 75%, solving 128 parametric cases in 15 min versus 2 h conventionally, while improving accuracy by 2.2% through exact boundary enforcement. This facilitates rapid sensitivity analyses previously constrained by computational cost, directly enabling material optimization strategies that reduced Yingliangbao pilot section costs by 12% while maintaining σt < 0.85ft (1.08 MPa safety margin).
These findings collectively transform tunnel lining design from an empirical practice to mechanics-based optimization. By establishing friction thresholds as design levers (fr < 0.59 for slip utilization) and quantifying modulus-thickness tradeoffs, this calculation method delivers actionable protocols for balancing safety with economy in hydropower infrastructure. Future extensions to non-circular sections will further broaden its industry impact.
Data availability statement
The original contributions presented in the study are included in the article/supplementary material, further inquiries can be directed to the corresponding author.
Author contributions
CY: Resources, Funding acquisition, Writing – review and editing, Validation, Formal Analysis, Investigation, Supervision, Data curation, Conceptualization, Software, Writing – original draft, Methodology. YX: Project administration, Funding acquisition, Writing – review and editing. ZZ: Writing – review and editing. JX: Writing – review and editing. BT: Writing – review and editing. CL: Writing – review and editing.
Funding
The author(s) declare that financial support was received for the research and/or publication of this article. This study received support from Power China Chengdu Engineering Corporation Limited of the Science and Technology project (Grant No. P54222 and Grant No. P60500). This study is supported by the science and technology project of POWER CHINA(DJ-HXGG-2023-09). The authors declare that this study received funding from Power China Chengdu Engineering Corporation Limited and POWER CHINA. The funders were not involved in the study design, collection, analysis, interpretation of data, the writing of this article, or the decision to submit it for publication.
Conflict of interest
Authors CY, YX, JX, BT, and CL were employed by POWERCHINA Chengdu Engineering Corporation Limited.
The remaining author declares that the research was conducted in the absence of any commercial or financial relationships that could be construed as a potential conflict of interest.
Generative AI statement
The author(s) declare that no Generative AI was used in the creation of this manuscript.
Any alternative text (alt text) provided alongside figures in this article has been generated by Frontiers with the support of artificial intelligence and reasonable efforts have been made to ensure accuracy, including review by the authors wherever possible. If you identify any issues, please contact us.
Publisher’s note
All claims expressed in this article are solely those of the authors and do not necessarily represent those of their affiliated organizations, or those of the publisher, the editors and the reviewers. Any product that may be evaluated in this article, or claim that may be made by its manufacturer, is not guaranteed or endorsed by the publisher.
References
Ahn, K. H., and Pouya, A. (2023). Analytical solution of circular tunnel-lining interaction with elastic contact. Tunn. Undergr. Space Technol. 140, 105311. doi:10.1016/j.tust.2023.105311
Bobet, A. (2003). Effect of pore water pressure on tunnel support during static and seismic loading. Tunn. Undergr. Space Technol. 18 (4), 377–393. doi:10.1016/s0886-7798(03)00008-7
Bobet, A., and Nam, S. W. (2007). Stresses around pressure tunnels with semi-permeable liners. Rock Mech. Rock Eng. 40 (3), 287–315. doi:10.1007/s00603-006-0123-6
Cavalieri, F. J., and Cardona, A. (2013). An augmented Lagrangian technique combined with a mortar algorithm for modelling mechanical contact problems. Int. J. Numer. Methods Eng. 93 (4), 420–442. doi:10.1002/nme.4391
Cavalieri, F. J., and Cardona, A. (2015). Numerical solution of frictional contact problems based on a mortar algorithm with an augmented Lagrangian technique. Multibody Syst. Dyn. 35 (4), 353–375. doi:10.1007/s11044-015-9449-8
Chen, X. X. (2006). Modern tunnel engineering theory and tunnel construction. Xi'an: Xi'an Jiaotong University Press.
Gao, Y. T., Wu, Q., and Lu, A. Z. (2013). Stress analytic solution of double-layered thick-walled cylinder with smooth contact interface. Eng. Mech. 30 (10), 93–99. doi:10.6052/j.issn.1000-4750.2012.06.0439
Guo, Z., Wu, B., and Jia, S. (2021). An analytical model for predicting the mechanical behavior of a deep lined circular pressure tunnel by using complex variable method. Geomech. Geophys. Geo-Energy. Geo-Resources. 7, 90. doi:10.1007/s40948-021-00282-1
Han, X., Xia, Y., Wang, X., and Chai, L. (2018). Complex variable solutions for forces and displacements of circular lined tunnels. Math. Problems Eng. 2018, 1–12. doi:10.1155/2018/2037845
Hoeg, K. (1968). Stresses against underground structural cylinders. J. Soil Mech. Found. Div. 94 (4), 833–858. doi:10.1061/jsfeaq.0001175
Li, S. C., and Wang, M. B. (2008). Elastic analysis of stress–displacement field for a lined circular tunnel at great depth due to ground loads and internal pressure. Tunn. Undergr. Space Technol. 23 (6), 609–617. doi:10.1016/j.tust.2007.11.004
Lu, A. Z., Zhang, L. Q., and Zhang, N. (2011). Analytic stress solutions for a circular pressure tunnel at pressure and great depth including support delay. Int. J. Rock Mech. Min. Sci. 48 (3), 514–519. doi:10.1016/j.ijrmms.2010.09.002
Lu, A. Z., Zhang, N., and Chen, H. Y. (2014). Analytic stress solutions for a circular pressure tunnel at great depth including support delay and pure slip boundary condition. J. Central South Univ. 45 (6), 2041–2048. doi:10.1201/b16955-173
Lu, A. Z., Yin, C. L., and Zhang, N. (2019). Analytic stress solutions for a lined circular tunnel under frictional slip contact conditions. Eur. J. Mech. - A/Solids 75, 10–20. doi:10.1016/j.euromechsol.2019.01.008
Meschke, G., Ninić, J., Stascheit, J., and Alsahly, A. (2013). Parallelized computational modeling of pile–soil interactions in mechanized tunneling. Eng. Struct. 47 (1), 35–44. doi:10.1016/j.engstruct.2012.07.001
Moore, I. D., and Booker, J. R. (1985). Simplified theory for the behaviour of buried flexible cylinders under the influence of uniform hoop compression. Int. J. Solids Struct. 21 (9), 929–941. doi:10.1016/0020-7683(85)90108-8
Richard, R. M. (1964). “Attenuation of stresses for buried cylinders,” in Proceedings of the symposium on soil-structure interaction. Tucson: University of Arizona, 379–392.
Su, Z. X., and He, C. (2007). Shell-spring-contact model for shield tunnel segmental lining analysis and its application. Eng. Mech. 24 (10), 130–136. doi:10.1016/S1872-5791(07)60033-5
Timoshenko, S. P., and Goodier, J. N. (2007). Theory of Elasticity. 3rd ed. Beijing: Tsinghua University Press.
Wang, M. B., and Li, S. C. (2009). A complex variable solution for stress and displacement field around a lined circular tunnel at great depth. Int. J. Numer. Anal. Methods Geomechanics 33 (7), 939–951. doi:10.1002/nag.749
Wang, M. S., and Tan, Z. S. (2010). The construct technology of tunnel and underground engineering in China. Strategic Study CAE 12 (12), 4–10.
Keywords: hydraulic tunnel, support delay, frictional slip contact, rock-lining interaction, reinforcement design
Citation: Yin C, Xia Y, Zhu Z, Xie J, Tang B and Luo C (2025) The computational methods and application comparisons for the interaction between surrounding rock and lining in hydraulic tunnels. Front. Earth Sci. 13:1687458. doi: 10.3389/feart.2025.1687458
Received: 17 August 2025; Accepted: 15 September 2025;
Published: 03 October 2025.
Edited by:
Binbin Yang, Xuchang University, ChinaReviewed by:
Lei Shi, China University of Mining and Technology, Beijing, ChinaYU Xuguang, Chang’an University, China
Copyright © 2025 Yin, Xia, Zhu, Xie, Tang and Luo. This is an open-access article distributed under the terms of the Creative Commons Attribution License (CC BY). The use, distribution or reproduction in other forums is permitted, provided the original author(s) and the copyright owner(s) are credited and that the original publication in this journal is cited, in accordance with accepted academic practice. No use, distribution or reproduction is permitted which does not comply with these terms.
*Correspondence: Chonglin Yin, YjIwMjEwMDRAY2hpZGkuY29tLmNu