 Wenhao Xu
 Xinglong Xie1*
- 1Center for Hydrogeology and Environmental Geology Survey, China Geology Survey, Tianjin, China
- 2Geological Survey of Jiangsu Province, Nanjing, China
- 3Natural Resources Carbon Neutralization Engineering Research Center of Jiangsu Province, Nanjing, China
The reservoir stimulation is an indispensable part in the development of hot dry rock, and the evaluation of reservoir stimulation is particularly crucial for guiding the subsequent implementation of Enhanced Geothermal Systems (EGS). This paper proposes an evaluation method for the reservoir stimulation of hot dry rock based on microseismic monitoring, and establishes a microseismic monitoring system around the hot dry rock development site for practical application. Microseismic events are located based on the amplitude superposition method. The focal mechanisms for selected microseismic events are inverted through moment tensor inversion, followed by in situ stress inversions. Taking the focal mechanisms as constraint, both discrete fracture network model and continuous fracture network model are developed to invert the reservoir permeability and evaluate the stimulated reservoir volume. The results indicate that 5,449 monitored microseismic events are predominantly spatially distributed within 200 m near the well, with a dominant expansion direction oriented NW-SE. The focal mechanism primarily consists of strike-slip faults and normal faults, and the maximum horizontal stress direction within the reservoir also aligns with NW-SE. Permeability inversion reveals relatively high values in the NW direction, while the calculated stimulated reservoir volume is approximately 7.73 million m3. These research results improve the evaluation accuracy of reservoir stimulation, and provide a foundational basis for the development of hot dry rock.
1 Introduction
Hot dry rock is regarded as one of the alternative energy sources to fossil energy in the future due to its significant resource potential and environmentally friendly development (Wang et al., 2012; Wen et al., 2023). Several developed countries have carried out Enhanced Geothermal Systems (EGS) of hot dry rock for over 50 years (Breede et al., 2013; Wu and Ansari, 2025). Currently, the predominant method of development involves injecting water as a heat exchange medium into hot dry rock reservoirs. This process allows for the efficient absorption of heat from the reservoir, after which the heated water is extracted for power generation (Tester et al., 2006; Gao et al., 2025). Prior to the development of hot dry rock, it is essential to perform reservoir stimulation through hydraulic fracturing. The purpose of this process is to create a connected complex fracture network within the hot dry rock reservoir, thereby enhancing both permeability and heat transfer capacity of the heat exchange medium in the reservoir, and then realize the efficient development of hot dry rock (Xu et al., 2012; Wang et al., 2015). The evaluation of effects following reservoir stimulation holds critical importance for accurately revealing the characteristics of the reservoir, optimizing development strategies and ensuring safety (Xu et al., 2024; Wang and Kobina, 2025). Furthermore, it is also the key challenge currently that restricts the efficient development of hot dry rock (Tan et al., 2023; Fang et al., 2018).
Microseismic monitoring method is widely used in the development of conventional oil and gas reservoirs. With the ongoing advancement and maturation of technology, its application in evaluating unconventional reservoir stimulation is also progressing rapidly (Chen et al., 2023a; Shapiro et al., 2002). In the development of dry hot rock, microseismic monitoring serves not only as a crucial component for real-time observation of induced microseismic events to ensure safe operations but also as an essential technical tool for assessing the effectiveness of reservoir stimulation (Sun et al., 2021; Liang, 2023). Globally, microseismic monitoring has been implemented during hot dry rock development to track both the location and magnitude of induced earthquakes that occur during reservoir stimulation, so as to adjust the pumping scheme of hydraulic fracturing and reduce the risk of induced seismic disasters (Chen, 2023b). Numerous studies on reservoir evaluation have been conducted based on microseismic data across various development projects (Majer et al., 2007).
During the reservoir stimulation of hot dry rock, elastic wave signals are generated due to rock mass rupture, leading to the occurrence of microseismic events. The arrival times, amplitudes and waveform characteristics contain valuable information regarding rock mechanics and geological structure, which can be utilized to ascertain the location, occurrence time and magnitude of these microseismic events. On this basis, further analyses can be conducted to evaluate flow direction of fracturing fluid, focal mechanisms, reservoir permeability, and stimulated volumes (Eisner et al., 2010; Tarrahi and Jafarpour, 2012). For instance, the Paralana project in Australia determined the characteristics of fracture structure and identified the main flow path of fracturing fluid based on the spatial location analysis of microseismic events (Albaric et al., 2014). The Basel project in Switzerland performed focal mechanism analyses on large microseismic events to infer the complex fracture network structure within hot dry rock reservoirs (Kraft and Deichmann, 2014), evaluated the reservoir permeability based on the distribution data of microseismic events, and identified the hyperpermeable structure of the reservoir (Mukuhira et al., 2020). The Soultz project in France assessed the stimulated reservoir volume based on the spatial distribution of thousands of monitored microseismic events resulting from hydraulic fracturing (Kinnaert et al., 2018). Additionally, sites such as Newberry and Raft River in the United States had all evaluated the fracture distribution characteristics through comprehensive analysis of microseismic monitoring data, providing an important basis for subsequent well location layout and reservoir reconstruction (Xu et al., 2018).
Therefore, the microseismic monitoring method plays an crucial role in the reservoir evaluation of hot dry rock. However, most previous studies on reservoir evaluation based on microseismic monitoring have focused on singular aspects, such as focal mechanism analysis or permeability assessment. There are few studies on the method system covering multiple aspects of hot dry rock reservoir evaluation. In addition, there are relatively few research and application examples of this technology in the development of hot dry rock in China (Liu et al., 2013). This paper established a comprehensive method for evaluating hot dry rock reservoirs based on microseismic monitoring and applied it to a reservoir stimulation project of hot dry rock in Jiangsu Province. By utilizing acquired microseismic data as a foundation, the effect of reservoir stimulation was comprehensively evaluated. Firstly, a microseismic monitoring system was established around the hot dry rock development site. During the reservoir stimulation, microseismic events were located according to microseismic signals, and their spatial distribution characteristics were analyzed. Subsequently, certain events were optimized to determine the focal mechanisms that served as constraints for inverting the in situ stress of reservoir. And then the model was established to evaluate the reservoir permeability and stimulated reservoir volume. The above analysis results provided a foundational basis for the development of hot dry rock.
2 Materials and methods
2.1 Study area
The hot dry rock fracturing site is situated within the Northern Jiangsu Basin of Jiangsu Province, China. This basin lies on the northeastern margin of the Yangtze Block and constitutes part of the western section of the Northern Jiangsu-South Yellow Sea Basin onshore region (Qiu et al., 2006). It is bordered by the Pacific subduction zone to the east, the Tan-Lu Fault to the west; its southern boundary aligns with the southern Jiangnan Deformation Zone which connects with Tongyang Uplift while its northern boundary corresponds with Jiashan-Xiangshui Fault belonging to Suzhou-Shandong orogenic belt adjacent to Suzhou-Shandong Uplift (Liu et al., 2020). The Northern Jiangsu Basin represents a multi-stage geological formation developed under dynamic conditions characterized by double alternating subduction processes involving both Pacific Plate and Indian Plate influences. Since the Cretaceous period, it has undergone tectonic activities including Yizheng, Wubu, Sanduo phases as well as Cenozoic movements that ultimately shaped its current structural configuration known as “one uplift and two depressions” (Wang et al., 2020; Chen, 2010), namely, Dongtai Depression, Jianhu Uplift and Yanfu Depression from south to north (Wang et al., 2021).
Pre-Mesozoic carbonate rocks with large thickness are widely developed in the Northern Jiangsu Basin, characterized by low porosity, low permeability and low water content. Additionally, secondary pores, holes and fractures are developed near the unconformity surface of these carbonate rocks, making them suitable for the development of hot dry rock resources (Li and Duan, 2010). Among these formations, the main development target of hot dry rock is Ordovician-Cambrian carbonate rock (Figure 1). The cover layers of the hot dry rock reservoir mainly include Carboniferous-Triassic carbonate rocks and Cretaceous-Quaternary continental clastic rocks. The shallowest burial depth is less than 1,000 m, while the deepest reaches over 6,000 m. The maximum thickness of this layer exceeds 2,000 m; however, it is absent in a small part of the area (Zhang et al., 2024). The lithology of the reservoir primarily consists of dolomite, gray dolomite and dolomite limestone. Logging data (Lu, 2022) indicate that porosity ranges from 3.1% to 4.9%, while permeability varies between 0.1 and 0.14 mD. Based on the logging data, the rock mechanical parameters are calculated: average Young’s modulus ranges from 73 to 91.4 GPa; bulk modulus spans from 66.9 to 76.4 GPa; shear modulus falls between 27.8 and 35.2 GPa; and Poisson’s ratio is estimated at approximately between 0.3 and 0.32.

Figure 1. Typical stratigraphic histogram of the Northern Jiangsu Basin.
2.2 Data acquisition
This study employed the monitoring method that deployed microseismic geophones in both shallow surfaces and wells. As shown in Figure 2, a total of 46 monitoring stations were arranged radially within a 5 km radius of the fractured well. At each station, a three-component geophone was installed at depths ranging from 0.5 to 30 m below ground level to facilitate superficial microseismic monitoring. The geophone has a sensitivity of 240 V/m/s, a natural frequency of 4.5 Hz, a dynamic range of 120 dB, and an operating temperature range of −40 °C–85 °C. It uses 4G full network real-time transmission. Taking the fracturing well as the center, two deep boreholes were drilled to a depth of 1,500 m at the horizontal distance of 1,200 m at both ends along the NNW-SSE direction. A fifteen-stage geophone was installed into the well for in-well microseismic monitoring. The geophone spacing is 15 m, with a dynamic range of 120 dB, an inter-stage transmission rate of 10 Mbps, and an operating temperature range of −40 °C–85 °C. A large number of shallow surface microseismic monitoring stations increased the coverage density on the plane and improved the positioning accuracy of microseismic events. The deployment of geophones in wells enhanced the vertical monitoring perspective and improved the vertical positioning accuracy of microseismic events. Due to their greater depth, the geophones located in wells experienced significantly less background noise compared to those situated at shallow surfaces; this allowed them to more sensitively detect microseismic signals emanating from around the fractured well. Consequently, the number of microseismic events monitored by downhole geophones was notably higher than that captured by shallow surface geophones.
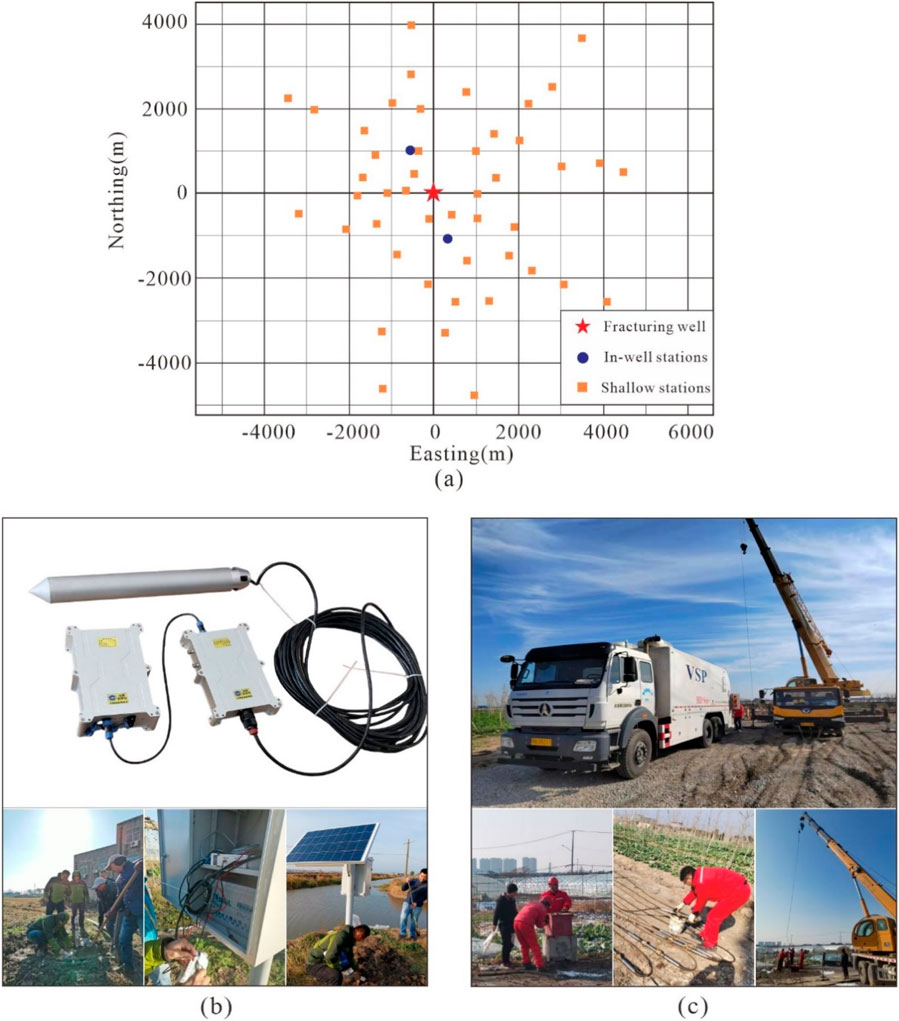
Figure 2. Deployment of microseismic monitoring system: (a) Layout diagram of the microseismic monitoring system; (b) Shallow stations: a three-component geophone installed at depths 0.5–30 m; (c) In-well stations: a fifteen-stage geophone installed in the well of 1,500 m.
2.3 Evaluation method
2.3.1 Evaluation process
The processing flow of microseismic monitoring data is presented in Figure 3. During the reservoir stimulation period, once the geophone detects a microseismic event signal, immediate location determination can be performed through waveform data aggregation and format conversion, thereby completing the preliminary processing of microseismic data. Based on the location results of all detected microseismic events, an analysis of their spatial distribution characteristics is conducted directly. Subsequently, microseismic events with distinct waveforms are selected for source mechanism analysis and ground stress inversion. Under the constraints of the focal mechanism, a discrete fracture network model is established to invert hydraulic fracture permeability; additionally, a continuous hydraulic fracture network model is developed to evaluate stimulated reservoir volume, completing the fracture analysis and reservoir evaluation. The above results of spatial distribution characteristics of microseismic events, in situ stress inversion, reservoir permeability inversion and stimulated reservoir volume evaluation provide a basis for enhanced geothermal system development.

Figure 3. Processing flow for microseismic data.
2.3.2 Location of microseismic events
With the extensive research and application of microseismic monitoring method in reservoir evaluation, methods for positioning microseismic events have matured significantly; consequently, the spatial positioning accuracy has seen continuous improvement (Chen, 2023b). Relevant studies have indicated that reasonable pre-processing such as noise suppression of microseismic data can significantly improve positioning accuracy (Wang, 2018; Ren et al., 2018). This study conducted pre-processing techniques, including static correction, dynamic correction and noise suppression on the waveform data generated by microseismic events. Subsequently, the amplitude superposition positioning method was employed to determine the source location (Wu et al., 2017). This method performs offset stacking on the arrival time of seismic waves, thereby enhancing originally weak microseismic events through multi-channel stacking, which improves the reliability of positioning (Sun et al., 2017). The positioning of microseismic events inevitably has errors. In this study, the positioning accuracy of the monitoring system was verified through perforation before reservoir fracturing. The location of the perforation was established, and the microseismic monitoring system successfully detected the microearthquakes generated by this process. The error between the positioning results and the actual perforation locations in the X, Y, and Z directions were found to be within 10–15 m.
2.3.3 Inversion of focal mechanism and in-situ stress
Conventional microseismic event location fall short of providing a detailed description of reservoir fracture propagation. Therefore, it is essential to conduct focal mechanism inversion to analyze both the rock fracture process and the mechanical type of fracture generation, including describing the strike, dip and dip angle of the focal fracture surface accurately. Such analyses enable reasonable inferences regarding fracture development and stress states, thereby enhancing evaluations of fracturing effectiveness (Diao, 2020). The moment tensor inversion method is one of the inversion methods for focal mechanisms, which does not require seismic phase analysis. In addition to inverting the occurrence of the fracture surface, it can also obtain a complete description of the source force system, making it increasingly prevalent in practice. However, this method imposes stringent requirements on the quality of microseismic monitoring data (Rong et al., 2018). In this paper, the moment tensor inversion method was adopted (Li et al., 2023a). This approach utilizes projections of the initial polarity of direct P-waves recorded by monitoring stations on a source sphere to derive solutions for fault joint surfaces, thereby elucidating focal mechanisms. The reliability of this method lies in the accurate determination of the initial polarity of the P-wave, which requires a high degree of distinctiveness of the seismic waveform. Consequently, we prioritized microseismic events characterized by distinct waveforms and strong signals—specifically those with high signal-to-noise ratios. The initial arrivals of the seismic waves were manually picked up, and the solved focal mechanisms were basically reliable. However, for low signal-to-noise ratio events exhibiting indistinct waveforms and unclear initial arrivals, it becomes challenging to resolve their focal mechanisms. As a result, the number of microseismic events suitable for focal mechanism analysis is lower than the total number monitored. Furthermore, these high signal-to-noise ratio events typically possess greater energy levels and relatively larger magnitudes that reflect key characteristics associated with main microseismic event focal mechanisms.
Based on the solution of the focal mechanism, the in situ stress can be inverted according to the sliding vector of the real section, thereby the in situ stress field with statistical significance can be obtained, which provides support for the study of microseismic geomechanics (Baig and Urbancic, 2010; Chen, 2019). In this paper, the in situ stress inversions of the above microseismic events were conducted (Li et al., 2023a). Based on multiple composite focal mechanism solutions, the stress moment tensor can be obtained by the least squares inversion method, and the orientation and dip angle of the three principal stresses could be further calculated through the eigenvalue decomposition method. And then the relative size of the maximum horizontal principal stress, the minimum horizontal principal stress and the vertical stress of the reservoir were obtained, as well as the distribution characteristics of the orientation and dip angle, so as to describe the in situ stress field of the fracturing section.
2.3.4 Inversion of permeability
A precise evaluation of reservoir permeability often requires specialized analysis based on certain measured data. The numerical model inversion method, which integrates the advantages of statistical analysis and process simulation, is the primary approach at present (Chen, 2023b). The inversion results from the focal mechanism provide critical information regarding the spatial location of the microseismic event, as well as the rupture mechanism and the occurrence parameters of the rupture surface. This paper utilized the above results as constraint conditions to conduct discrete fracture network modeling based on the discrete theory of seepage within fractured bedrock (Li et al., 2023b). Permeability inversion was carried out on the basis of discrete fracture modeling, and the discrete fracture network was modeled by random-deterministic joint modeling. For large magnitude events, there are complete attribute information, including the spatial location of microseismic events, the time of occurrence, the radius of the source, and the fracture direction and dip angle information obtained by the inversion of the focal mechanism. The information can directly assign the size and orientation of the fracture. For the small energy events monitored by the geophone in the well, the focal mechanism cannot be determined. The random modeling method was used to obtain the range of fracture size and orientation according to the deterministic modeling. In this range, the fracture size and orientation were obtained randomly. By considering factors such as the number, direction, and size of fractures in each cell, the permeability tensor in the discrete model was calculated to evaluate the permeability of hydraulic fractures in the reservoir.
2.3.5 Evaluation of stimulated reservoir volume
The stimulated reservoir volume determines the effectiveness of artificial fracturing and directly affects the development capacity of hot dry rock. Currently, most evaluations of stimulated reservoir volume rely on fracture network modeling (Xu, 2017). In this paper, the fracture network model was reconstructed based on the time-space distribution characteristics derived from microseismic events. Taking the focal mechanism as constraints, a continuous fracture network model was formed to calculate the stimulated reservoir volume of the fractured section (Li et al., 2023c). Firstly, the occurrence points of microseismic events were iteratively expanded in chronological order (Alexandre et al., 2015). Continuous hydraulic fracture network modeling was conducted based on the time-space distribution of microseismic events. The parameters for fracture size and heat transfer radius were obtained through rock physics experiments. In this study, values were assigned by taking the average value to construct the three-dimensional spatial fracture network of the reservoir after reservoir stimulation. Finally, the cumulative volume of all hydraulic fractures was calculated to determine the stimulated reservoir volume.
3 Results and discussion
3.1 Spatial distribution of microseismic events
This paper utilized microseismic monitoring data obtained from reservoir fracturing at depths ranging from 4,645 to 4,680 m as a case study. The fracturing process in this section lasted for a duration of 7 days. During the fracturing period, the injection flow rate was maintained at 2.5∼5 m3/min, the injection pressure was 40–80 MPa, and the cumulative injection was about 10,000 m3. Since the beginning of fracturing, the statistics of daily microseismic events are presented in Figure 4. It can be seen that there was a general upward trend in the number of microseismic events during the fracturing period. Following the completion of the fracturing, the number of events decreased rapidly, and basically no events occurred on the 10th day. In total, 5,449 microseismic events were monitored during this section of fracturing.
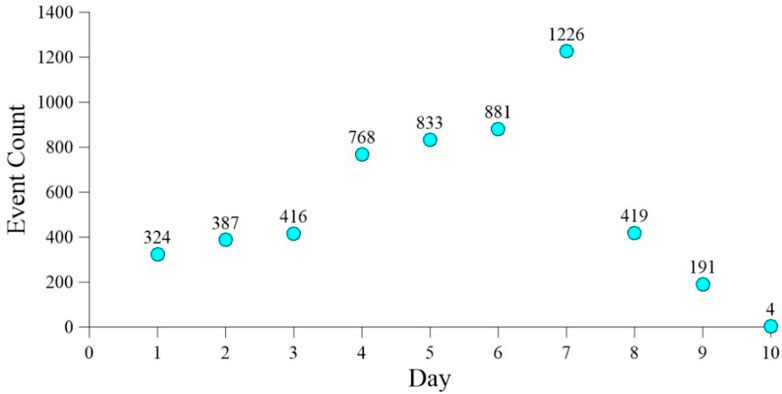
Figure 4. Daily statistics of microseismic events.
The spatial distribution is presented in Figure 5, where X represents the east direction, Y represents the north direction, Z represents the vertical depth, and the origin represents the position of the fracturing well. The results indicate that the influence range of microseismic events centered on the fracturing well is within 550 m on the plane. These events are predominantly concentrated within −400–300 m in X direction and −400–400 m in Y direction. The planar morphology exhibits an approximately elliptical shape with its long axis oriented in a NW-SE direction. Vertically, the microseismic events are distributed within the depth range of 4,500 to 4,850 m, concentrated within 4,550–4,800 m, covering the depth of the fracturing section and extending about 100 m upwards and downwards respectively. Morphologically, they present a clustered distribution pattern.
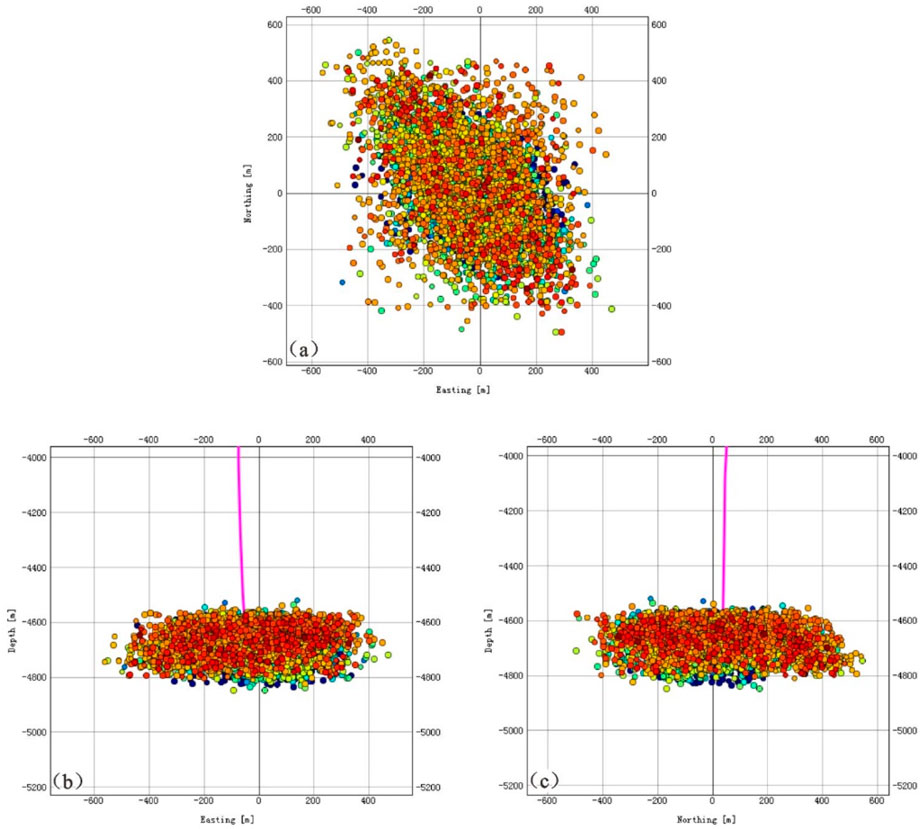
Figure 5. Spatial distribution map of microseismic events: (a) X-Y top view; (b) X-Z side view; (c) Y-Z side view.
The microseismic monitoring event density map is presented in Figure 6. It is evident that the high-density area is concentrated within a radius of 200 m centered on the fractured well, indicating that most of the microseismic events occur in the near-wellbore region. Overall, it forms an approximately elliptical shape with the fracturing well as the center and the NW-SE direction as the long axis, suggesting that microseismic events extend predominantly along this orientation. High-density zones are distributed at 200 m in the NW and 150 m in the SE of the fractured well, respectively. The high-density zone in the NW exhibits a circle with a radius of about 50 m, while the high-density area in the SE presents a strip about 200 m long, oriented NE-SW. These two areas characterized by frequent microseismic activity are hypothesized to form relatively large-scale fracture networks.
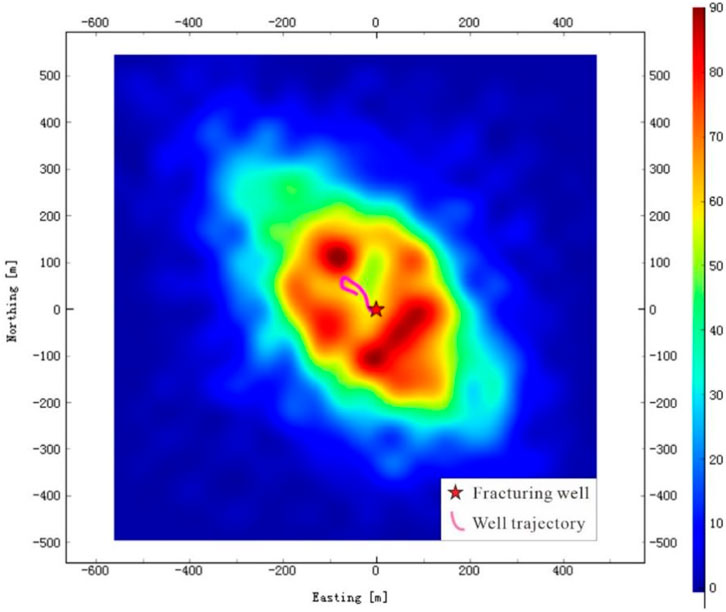
Figure 6. Microseismic event density map.
When the fluid enters the reservoir during hydraulic fracturing, the original stress balance is disrupted, leading to the occurrence of microseismic events. Consequently, the spatial distribution characteristics of microseismic events reveal both the primary flow direction and influence range of the fracturing fluid. They also indicate the expansion direction and formation range of hydraulic fractures and identify the areas with better stimulation effects. Through the spatial distribution characteristics of the above microseismic events, it is indicated that the reservoir stimulation is predominantly concentrated within 200 m near the well. And the dominant direction of hydraulic fracture expansion is oriented NE - SE, with notable zones exhibiting effective reservoir stimulation located in both NW and SE directions respectively, providing a basis for the subsequent well location layout and target design. From an engineering perspective, this implies that the observed stimulation pattern has established effective flow paths, which is a prerequisite for efficient heat transfer and sustainable production. Therefore, the distribution characteristics revealed in this study lay a solid geological foundation for subsequent well placement and the design of optimal injection-production strategies to maximize heat extraction efficiency.
3.2 Inversion of focal mechanism and in situ stress
3.2.1 Focal mechanism inversion
The focal mechanism inversion obtains the beach balls and fault rods corresponding to each microseismic event, with the spatial distribution results illustrated in Figure 7. In terms of fracture mechanisms, approximately 47.5% are identified as strike-slip faults, while around 35.6% are classified as normal faults. Consequently, the hydraulic fracturing process is predominantly characterized by strike-slip and normal faulting mechanisms. An analysis of the strike and dip angles of the fracture surfaces for these microseismic events reveals that (as shown in Figure 8) the dominant strike direction is NW, followed by NNW and NWW. The dip angles primarily exceed 40°, indicating a distinct prevalence of medium to high-angle dips.
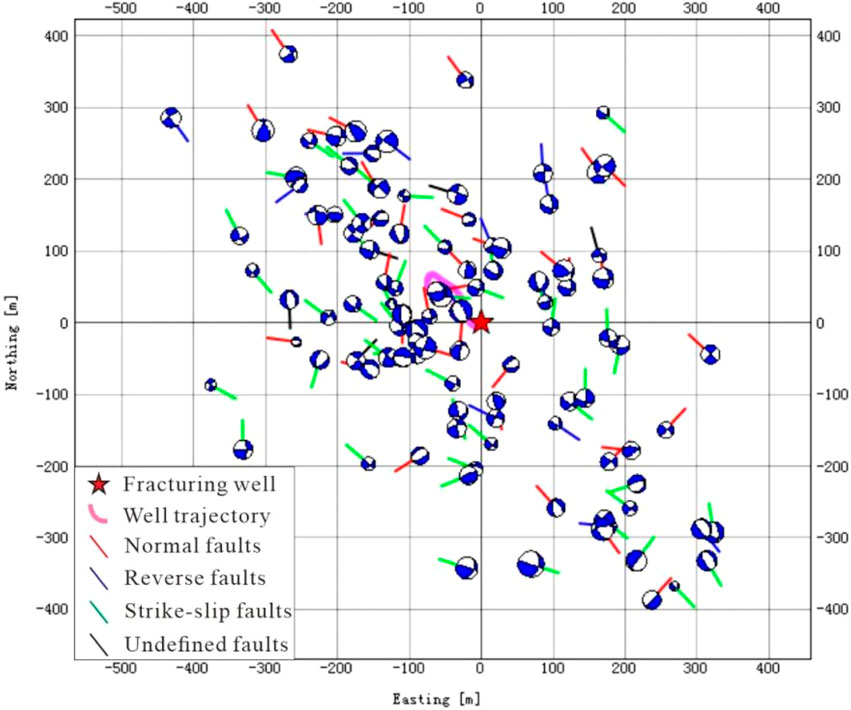
Figure 7. Plane distribution of focal mechanism beach balls and fault rods.

Figure 8. Strike rose diagram: (a) and strike-dip rose diagram; (b) of fracture surface based on focal mechanism.
The essence of microseismic events is the process of energy release due to rock mass rupture or sliding of existing faults, and the focal mechanism solution serve as core parameter for quantitatively describing this process. The focal mechanism of microseismic events provides source parameters and fracture parameters, revealing the fracture mechanism of hydraulic fractures in reservoirs and offering a key basis for achieving the “visualization” of the reservoir simulation process of hot dry rock. In this section, the fracturing mechanism mainly consists of strike-slip faults and normal faults. The fracture surface mainly is oriented towards the NW with a relatively high dip angle, indicating minimal resistance to expansion along this direction; hence, vertical extension predominates among fractures. Furthermore, development patterns involving high-angle strike-slip faults and normal faults may signify potential geological risks necessitating adjustments to subsequent fracturing parameters to mitigate such hazards.
3.2.2 In-situ stress inversion
To intuitively obtain the stress state of the reservoir, the confidence intervals of the three-dimensional stress from the focal mechanism of all events were processed. The in situ stress inversion results are presented in Figure 9. In the figure, red, green and blue represent the direction of the maximum principal stress, the intermediate principal stress and the minimum principal stress, respectively. The closest to the center of the circle represents the vertical stress, while the other two represent the maximum horizontal stress and the minimum horizontal stress. The results indicate that the vertical stress is the maximum principal stress, ranging from 345° to 15°, with an average azimuth of 0.36°. The azimuth is approximately north, and the dip angle ranges 20°–35;°. The maximum horizontal stress is the intermediate principal stress, with an azimuth range of 115°–140°, an average azimuth of 131.29°, and an dip angle of approximately 65°–80°. The minimum horizontal stress is the minimum principal stress, the azimuth range is 210°–240°, the average azimuth is 228.28°, and the inclination angle is also about 65°–80°. Notably, the direction of the maximum horizontal principal stress in the reservoir aligns with an NW-SE trend, which is consistent with the result that microseismic events display an almost elliptical spatial distribution with the NW-SE direction as the major axis.
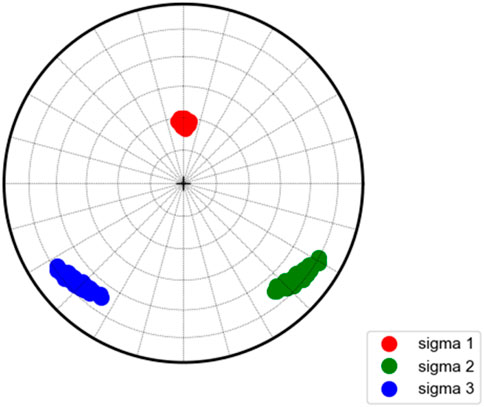
Figure 9. Distribution map of in situ stress.
In-situ stress is the core factor that control the initiation, propagation direction and network morphology of fractures in hot dry rock fracturing. The inversion of in situ stress elaborately depicts the spatial distribution of the stress field, reveals the stress state of the fracturing section, and serves as a crucial basis for optimizing subsequent fracturing construction plans. In this fracturing section, the maximum principal stress is identified as vertical stress with a relatively small dip angle, which indicates that the rock mass is mainly subjected to vertical compression; tensile or shear stress is prone to occur in the horizontal direction, resulting in horizontal or gently inclined tensile fractures. The maximum horizontal principal stress aligns along the NW-SE direction with a relatively large dip angle, which may promote the formation of high-angle shear cracks. The complex combination of the two types of fractures could potentially establish the dominant fluid channel within the reservoir. It is worth noting that the larger vertical stress leads to the closure risk of horizontal fractures in the reservoir, which should be considered in the later reservoir stimulation.
3.3 Inversion of permeability
Based on the distribution range of microseismic events, a discrete network model centered on the fracturing well was established to calculate the permeability of hydraulic fractures. The results indicate (as shown in Figure 10) that the number of hydraulic fractures with a permeability of 0–10 md is the largest. With the increase of permeability, the number of hydraulic fractures decreases significantly. The permeability predominantly ranges within 0–50 mD, and the maximum value exceeded 300 mD. The depth corresponding to the maximum hydraulic fracture permeability value is 4,619 m. The slice of the hydraulic fracture permeability body at this depth is presented in Figure 11a. It can be observed that the permeability in the NW direction of the fracturing well is higher than that in other areas. The high-permeability areas are distributed along the X direction from −100 to −250 m and in the Y direction from 0 to 200 m, with the maximum value located approximately 200 m NW of the well. Comparing with the 4,619 m depth slice of the microseismic event density body (Figure 11b), it is determined that the permeability of hydraulic fractures aligns with the distribution trend of microseismic event density.
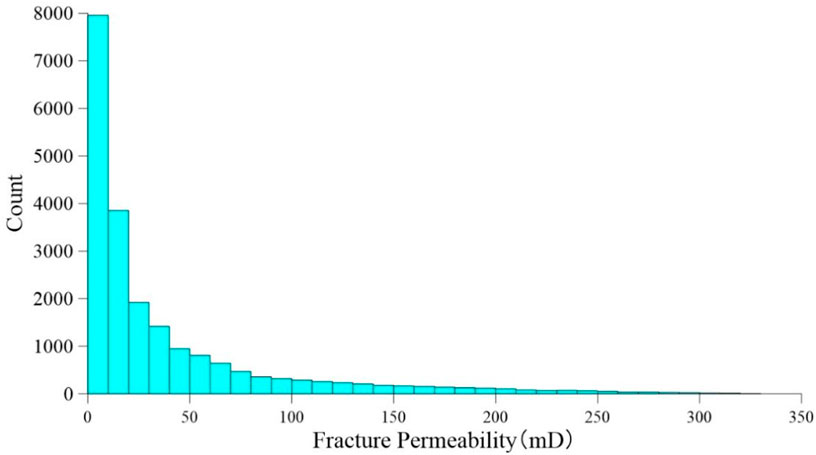
Figure 10. Numerical distribution histogram of hydraulic fracture permeability.

Figure 11. Slices of hydraulic fracture permeability (a) and microseismic event density (b) at the depth of 4,619 m.
The inversion of permeability quantitatively characterizes the distribution of permeability following reservoir stimulation. This approach effectively evaluates the effect of reservoir stimulation, delineates the areas with higher permeability, and provides a foundation for the direction design of well groups. According to international experience, reservoir permeability generally needs to exceed 100 mD to achieve efficient exploitation of hot dry rock (Cui et al., 2020; Mohais et al., 2016). The hydraulic fracture permeability in this fracturing section is mostly distributed within the range of 0–50 mD, exhibiting relatively high values near the well, particularly in the northwest direction. Thus, further artificial stimulation of the reservoir in this section is necessary to facilitate the development of hot dry rock resources. Additionally, the permeability of the fracturing well in the NW direction is relatively high, which can be served as the main reference direction for the subsequent layout of well locations.
3.4 Evaluation of stimulated reservoir volume
Based on 5,449 microseismic events of this fracturing section, a continuous fracture network model was established (as shown in Figure 12). The resulting model indicates that the fractures exhibit an approximately elliptical shape oriented in the NW-SE direction, which aligns well with both the spatial distribution of microseismic events and analyses pertaining to focal mechanisms and in situ stress conditions. Based on this model and the results of rock physics experiments, an average fracture height of 5 m and a fracture influence radius of 4 m (Li et al., 2023c) were taken to establish a volume model for fracturing reservoir stimulation (Figure 13). The calculated stimulated reservoir volume is about 7.73 million m3, indicating that the effects of reservoir reconstruction are favorable.

Figure 12. Distribution of continuous fracture network: (a) X-Y top view; (b) X-Z side view; (c) Y-Z side view.

Figure 13. Model for evaluating stimulated reservoir volume: (a) X-Y top view; (b) X-Z side view; (c) Y-Z side view.
Stimulated reservoir volume serves as a crucial indicator for verifying the effectiveness of fracturing and evaluating the fracturing effect (Ren et al., 2024). The stimulated reservoir volume is evaluated by establishing a continuous fracture network model to further enhance the evaluation accuracy of reservoir stimulation. This study referred to the analysis method of time-space connectivity of microseismic events proposed by Alexandre et al. (2015), iteratively expanding the network of microseismic event occurrence points in chronological order, connecting discrete event points, and conducting continuous hydraulic fracture network modeling. Fracture height and heat transfer radius are key parameters in the evaluation of stimulated reservoir volume. To avoid parameter arbitrariness, this study adopted the average value of experimental data for assignment, and constructed the three-dimensional spatial fracture network. The evaluation result indicated that the stimulated reservoir volume in this section is approximately 7.73 million m3, which can basically meet the development requirements of hot dry rock, confirming the effectiveness of artificial fracturing for reservoir stimulation. In view of the fact that the reservoir permeability is not at a high level at present, it is suggested that the follow-up stimulation should focus on improving the reservoir permeability.
4 Conclusion
This paper established an evaluation method for the reservoir stimulation of dry hot rock based on microseismic monitoring methods and actually applied it to the dry hot rock development site in Jiangsu, China. The following conclusions were drawn:
1. The microseismic monitoring system utilizing shallow combined borehole geophones was established, successfully recording 5,449 microseismic events during reservoir stimulation. The spatial distribution of these microseismic events on the horizontal plane exhibits an influence range extending up to 550 m from the fracturing well, forming a nearly elliptical pattern with a NW-SE orientation as the major axis. The isodensity map indicates that microseismic events are concentrated within 200 m near the well, with notable high-density areas observed in both NW and SE directions. This finding highlights the dominant expansion direction of hydraulic fractures and the areas exhibiting enhanced stimulation efficacy, providing a basis for subsequent well location layout and target design.
2. The rupture mechanism of reservoir hydraulic fractures predominantly consist of strike-slip faults and normal faults, with a prevailing strike orientation towards the NW and primarily medium to high dip angles. The in situ stress in the reservoir reveal that the maximum principal stress corresponds to vertical stress, oriented approximately northward, while the direction of maximum horizontal stress is aligned NW-SE, which is consistent with the dominant direction of the distribution of microseismic events. The above analysis offers suggestions for subsequent fracturing operations and engineering development initiatives.
3. The inversion of reservoir permeability indicates that most areas exhibit permeabilities ranging from 0 to 50 mD, with a maximum value exceeding 300 mD. Notably, permeability is higher in the NW direction, which aligns with the distribution characteristics observed in microseismic events. Furthermore, the stimulated reservoir volume was evaluated as approximately 7.73 million m3. The findings improve the accuracy of reservoir reconstruction evaluation, and provides a reference for the subsequent implementation of hot dry rock development.
Data availability statement
The original contributions presented in the study are included in the article/supplementary material, further inquiries can be directed to the corresponding authors.
Ethics statement
Written informed consent was obtained from the individuals for the publication of any potentially identifiable images or data included in this article.
Author contributions
WX: Formal Analysis, Investigation, Methodology, Writing – original draft, Writing – review and editing. XX: Data curation, Investigation, Methodology, Writing – original draft, Writing – review and editing. SY: Investigation, Writing – original draft. XJ: Funding acquisition, Writing – review and editing. JG: Resources, Writing – original draft. JC: Investigation, Writing – original draft. YY: Investigation, Writing – original draft.
Funding
The author(s) declare that financial support was received for the research and/or publication of this article. This study was supported by the Carbon Peak and Carbon Neutralization Science and Technology Innovation Special Fund of Jiangsu Province, China (Grant No. BE2022859).
Conflict of interest
The authors declare that the research was conducted in the absence of any commercial or financial relationships that could be construed as a potential conflict of interest.
Generative AI statement
The author(s) declare that no Generative AI was used in the creation of this manuscript.
Any alternative text (alt text) provided alongside figures in this article has been generated by Frontiers with the support of artificial intelligence and reasonable efforts have been made to ensure accuracy, including review by the authors wherever possible. If you identify any issues, please contact us.
Publisher’s note
All claims expressed in this article are solely those of the authors and do not necessarily represent those of their affiliated organizations, or those of the publisher, the editors and the reviewers. Any product that may be evaluated in this article, or claim that may be made by its manufacturer, is not guaranteed or endorsed by the publisher.
References
Albaric, J., Oye, V., Langet, N., Hasting, M., Lecomte, I., Iranpour, K., et al. (2014). Monitoring of induced seismicity during the first geothermal reservoir stimulation at Paralana, Australia. Geothermics 52, 120–131. doi:10.1016/j.geothermics.2013.10.013
Alexandre, H., Jean-Claude, D., Emmanuel, G., and Aymen, H. (2015). “Connecting the dots: microseismic-derived connectivity for estimating reservoir volumes in low-permeability reservoirs,” in Unconventional resources technology conference, san Antonio, Texas, 20-22 July 2015 (Society of Exploration Geophysicists, American Association of Petroleum Geologists, Society of Petroleum Engineers), 1347–1357. doi:10.15530/urtec-2015-2153402
Baig, A. M., and Urbancic, T. I. (2010). Microseismic moment tensors: a path to understanding frac growth. Lead. Edge 29 (3), 320–324. doi:10.1190/1.3353729
Breede, K., Dzebisashvili, K., Liu, X., and Falcone, G. (2013). A systematic review of enhanced (or engineered) geothermal systems: past, present and future. Geotherm. Energy 1 (1), 4. doi:10.1186/2195-9706-1-4
Chen, A. D. (2010). Tectonic features of the Subei Basin and the forming mechanism of its dustpan-shaped fault depression. Oil and Gas Geol. 31 (2), 140–150. doi:10.11743/ogg20100202
Chen, Y. Q. (2019). Study on microseismic fracture interpretation technology based on focal mechanism. Beijing: China University of Petroleum.
Chen, J. Y. (2023b). Permeability inversion in artificial geothermal reservoirs based on the tracer test and microseismic data: method and applications. Changchun: Jilin University.
Chen, X. J., Liu, T. J., Liu, J. J., Wang, K. K., Xu, G., and Xu, H. H. (2023a). Application of microseismic event density in fracturing evaluation: taking Muhu depression in Junggar Basin as an example. Fault-block Oil Gas Field. 30 (3), 488–494. doi:10.6056/dkyqt202303017
Cui, H. B., Tang, J. P., and Jiang, X. T. (2020). Influence of permeability on reservoir change during dry hot rock mining. Hydrogeology Eng. Geol. 47 (1), 171–180. doi:10.16030/j.cnki.issn.1000-3665.201811014
Diao, R. (2020). Determination technique of micro-seismic event focal mechanism. Sci. Technol. Eng. 20 (12), 5.
Eisner, L., Williams-Stroud, S., Hill, A., Duncan, P., and Thornton, M. (2010). Beyond the dots in the box: microseismicity-constrained fracture models for reservoir simulation. Lead. Edge 29 (3), 326–333. doi:10.1190/1.3353730
Fang, Y., Elsworth, D., and Cladouhos, T. T. (2018). Reservoir permeability mapping using microearthquake data. Geothermics 72, 83–100. doi:10.1016/j.geothermics.2017.10.019
Gao, S. Y., Deng, W. B., Wang, J. C., and Xu, M. Z. (2025). Wide-field electromagnetic method for deep hot dry rock fracturing monitoring: penetrating thick low-resistivity overburden. Front. Earth Sci. 13, 1579468. doi:10.3389/feart.2025.1579468
Kinnaert, X., Gaucher, E., Kohl, T., and Achauer, U. (2018). Contribution of the surface and down-hole seismic networks to the location of earthquakes at the Soultz-sous-Forêts geothermal site (France). Pure Appl. Geophys. 175, 757–772. doi:10.1007/s00024-017-1753-1
Kraft, T., and Deichmann, N. (2014). High-precision relocation and focal mechanism of the injection induced seismicity at the Basel EGS. Geothermics 52, 59–73. doi:10.1016/j.geothermics.2014.05.014
Li, Y. H., and Duan, H. L. (2010). On the time of space formation for Karst reservoir on indosinian plane in Jiangsu area-an example from well Xingcan 1. J. Oil Gas. Technol. 32 (003), 22–25. doi:10.3969/j.issn.1000-9752.2010.03.005
Li, Q. C., Wang, L. J., Xu, W. H., Yang, Y. B., Xie, X. L., Chen, J., et al. (2023a). Inversion of crustal stress based on source mechanism. Prog. Geophys. 38 (6), 2409–2416. doi:10.6038/pg2023GG0241
Li, Q. C., Xie, X. L., Cui, F. Z., Niu, X., Ming, Y. Y., et al. (2023b). Study on fracture permeability of dry hot rock based on discontinuous model. Prog. Geophys. 38 (2), 542–550. doi:10.6038/pg2023GG0239
Li, Q. C., Chen, D., Xu, W. H., Yi, S. X., Xie, X. L., Guan, J. P., et al. (2023c). Determining stimulated reservoir volume based on the microseismic continuous fracture network model. Geophys. and Geochem. Explor. 47 (4), 1048–1055. doi:10.11720/wtyht.2023.1139
Liang, X. (2023). Research and application of micro-seismicity-constraint tracer test data inversion methodology system for hydraulically enhanced fracture network characterization in the hot dry rock. Changchun: Jilin University.
Liu, Y. L., Tian, Y., Feng, X., Zheng, Q., and Chi, H. Z. (2013). Review of microseism technology and its application. Prog. Geophys. 28 (4), 1801–1808. doi:10.6038/pg20130421
Liu, D. M., Zhang, G. Y., Guan, J. P., Zhang, S., Zhang, J. Q., Zhang, L. H., et al. (2020). Analysis of geothermal resources potential for hot dry rock in the Subei Basin. Earth Sci. Front. 27 (1), 48–54. doi:10.13745/j.esf.2020.1.6
Lu, H. (2022). Dongtai depression carbonate rock geothermal reservoir features research and assessment in North Jiangsu Basin. Coal Geol. China 34, 32–38. doi:10.3969/j.issn.1672-9943.2022.01.062
Majer, E. L., Baria, R., Stark, M., Oates, S., Bommer, J., Smith, B., et al. (2007). Induced seismicity associated with enhanced geothermal systems. Geothermics 36 (3), 185–222. doi:10.1016/j.geothermics.2007.03.003
Mohais, R., Xu, C., Dowd, P. A., and Hand, M. (2016). Enhanced geothermal systems. John Wiley and Sons. Inc.
Mukuhira, Y., Ito, T., Asanuma, H., and Hring, M. (2020). Evaluation of flow paths during stimulation in an EGS reservoir using micro-seismic information. Geothermics 87, 101843. doi:10.1016/j.geothermics.2020.101843
Qiu, H. J., Xu, Z. Q., and Qiao, D. W. (2006). Progress in the study of the tectonic evolution of the Subei basin, Jiangsu, China. Geol. Bull. China 25 (9∼10), 1117–1120. doi:10.3969/j.issn.1671-2552.2006.09.023
Ren, C. F., Zhao, H. B., Chen, B. J., Feng, C. B., and Zhang, S. R. (2018). Analysis of location precision factors in surface microseismic monitoring acquisition geometry: a case study of an SZ exploration area in Daqing, China. Geophys. Prospect. petroleum 57 (5), 10. doi:10.3969/j.issn.1000-1441.2018.05.005
Ren, L., Dou, M. Y., Dong, X. W., Chen, B., Zhang, L., Sun, J., et al. (2024). Quantitative characterization of stimulated reservoir volume (SRV) fracturing effects in naturally fractured unconventional hydrocarbon reservoirs. Front. Earth Sci. 12, 1419631. doi:10.3389/feart.2024.1419631
Rong, J. J., Liu, J. W., Wang, X., Feng, C., and Zhang, Y. B. (2018). Study and application of microseismic moment tensor inversion method. Oil Geophys. Prospect. 53 (A02), 9. doi:10.13810/j.cnki.issn.1000-7210.2018.S2.027
Shapiro, S. A., Rothert, E., Rath, V., and Rindschwentner, J. (2002). Characterization of fluid transport properties of reservoirs using induced microseismicity. Geophysics 67 (1), 212–220. doi:10.1190/1.1451597
Sun, H. L., Qin, Y. S., Bai, T. Z., Qian, P., Xu, K. B., Liu, Y. H., et al. (2017). Research on joint microseismic monitoring of surface and borehole using amplitude stacking. Glob. Geol. 36 (3), 10. doi:10.3969/j.issn.1004-5589.2017.03.026
Sun, F., Hu, H. T., Zhao, F., Yang, X., Chen, Z., Wu, H. D., et al. (2021). Micro-seismic event detection of hot dry rock based on the gated recurrent unit model and a support vector machine. Acta Geol. Sin. Ed. 95 (6), 1940–1947. doi:10.1111/1755-6724.14882
Tan, X. F., Liu, X., Ma, Z. M., Lin, W. J., and Wang, G. L. (2023). Discussion on the key technology for fracture identification in hot dry rock reservoir. Drill. Eng. 50 (2), 47–56. doi:10.12143/j.ztgc.2023.02.007
Tarrahi, M., and Jafarpour, B. (2012). Inference of permeability distribution from injection-induced discrete microseismic events with kernel density estimation and ensemble Kalman filter. Water Resour. Res. 48 (10), 10506. doi:10.1029/2012WR011920
Tester, J. W., Anderson, B. J., Batchelor, A. S., Blackwell, D. D., Dipippo, R., and Drake, E. M. (2006). The future of geothermal energy: impact of Enhanced Geothermal Systems (EGS) on the United States in the 21st century. Boston, MA: Massachusetts Institute of Technology.
Wang, F., and Kobina, F. (2025). The Influence of geological factors and transmission fluids on the exploitation of reservoir geothermal resources: Factor discussion and mechanism analysis. Reservoir Science 1 (1), 3–18. doi:10.62762/RS.2025.637298
Wang, J. C. (2018). Research on micro-seismic ground monitoring and location technology based on grid division. Changchun: Jilin University.
Wang, J. Y., Hu, S. B., Pang, Z. H., He, L. J., Zhao, P., Zhu, C. Q., et al. (2012). Estimate of geothermal resources potential for hot dry rock in the continental area of China. Sci. Technol. Rev. 30 (32), 25–31. doi:10.3981/j.issn.1000-7857.2012.32.003
Wang, G. L., Ma, F., Lin, W. J., and Zhang, W. (2015). Research progress of reservoir stimulation in dry hot rock resource development project. Sci. and Technol. Rev. 33 (11), 103–107. doi:10.3981/j.issn.1000-7857.2015.11.018
Wang, Y. B., Wang, L. J., Hu, D., Guan, J. P., Hu, S. B., Wang, Z., et al. (2020). The present-day geothermal regime of the north Jiangsu Basin, east China. Ge-othermics 88, 101829. doi:10.1016/j.geothermics.2020.101829
Wang, Y. B., Bai, Y., Wang, L. J., Hu, S. B., Wang, Z., et al. (2021). Exploration process and genesis mechanism of deep geothermal resources in the North Jiangsu Basin, East China: from nothing to something. Front. Earth Sci. 9, 784600. doi:10.3389/feart.2021.784600
Wen, D. G., Zhang, E. Y., Wang, G. L., Zhang, L. Y., Wang, H., Zhang, S. Q., et al. (2023). Progress and prospect of hot dry rock exploration and development. Hydrogeology Eng. Geol. 50 (4), 1–13. doi:10.16030/j.cnki.issn.1000-3665.202304011
Wu, J. G., Zhang, P., Wu, H., and Zeng, X. X. (2017). Application of microseismic event location using amplitude summation in surface moni-toring. J. Jilin Univ. Earth Sci. Ed. 47 (1), 10. doi:10.13278/j.cnki.jjuese.201701305
Wu, J., and Ansari, U. (2025). From CO2 sequestration to hydrogen storage: Further utilization of depleted gas reservoirs. Reservoir Science 1 (1), 19–35. doi:10.62762/RS.2025.860510
Xu, D. Y. (2017). Research on SRV based on microseismic DFN model. Beijing: China University of Petruleum.
Xu, T. F., Zhang, Y. J., Zeng, S. F., and Bao, X. H. (2012). Technology progress in an enhanced geothermal system (hot dry rock). Sci. and Technol. Rev. 30 (32), 42–45. doi:10.3981/j.issn.1000-7857.2012.32.005
Xu, T. F., Hu, Z. X., Li, S. T., Jiang, Z. J., Hou, Z. Y., Li, F. Y., et al. (2018). Enhanced geothermal system: international progresses and research status of China. Acta Geol. Sin. 92 (9), 1936–1947. doi:10.3969/j.issn.0001-5717.2018.09.012
Xu, T. F., Wen, D. G., and Yuan, Y. L. (2024). Technical challenges and strategy of geothermal energy development from hot dry rock. Earth Sci. 49 (6), 2131–2147. doi:10.3799/dqkx.2023.047
Keywords: hot dry rock, reservoir stimulation, microseismic monitoring, focal mechanism, the Northern Jiangsu Basin
Citation: Xu W, Xie X, Yi S, Jin X, Guan J, Chen J and Yang Y (2025) Evaluation of hot dry rock reservoir stimulation based on microseismic monitoring method: a case study of the Northern Jiangsu Basin. Front. Earth Sci. 13:1688302. doi: 10.3389/feart.2025.1688302
Received: 19 August 2025; Accepted: 26 September 2025;
Published: 21 October 2025.
Edited by:
Qingchao Li, Henan Polytechnic University, ChinaReviewed by:
Zhengguang Zhao, North China Institute of Science and Technology, ChinaQiang Li, China University of Petroleum (Beijing) Karamay Campus, China
Copyright © 2025 Xu, Xie, Yi, Jin, Guan, Chen and Yang. This is an open-access article distributed under the terms of the Creative Commons Attribution License (CC BY). The use, distribution or reproduction in other forums is permitted, provided the original author(s) and the copyright owner(s) are credited and that the original publication in this journal is cited, in accordance with accepted academic practice. No use, distribution or reproduction is permitted which does not comply with these terms.
*Correspondence: Xinglong Xie, eGlleGluZ2xvbmdAbWFpbC5jZ3MuZ292LmNu