 Xinpeng Ma
 Jingru Li2*†
- 1School of Geoscience, China University of Petroleum (East China), Qingdao, China
- 2Shandong Earthquake Agency, Jinan, China
The distribution of water in the mantle plays a critical role in deep earth dynamic processes, including plate subduction, earthquake generation, and magmatic activity. Seismic tomography studies have consistently shown that the subducted Pacific plate beneath eastern China stagnates within the mantle transition zone. The release of water from the slab can substantially modify the surrounding electrical properties, producing pronounced high-conductivity anomalies. Resolving the regional conductivity structure is therefore essential for constraining the geometry and dehydration state of the stagnant slab, as well as for improving our understanding of the strong seismicity and widespread Cenozoic volcanism in eastern China. Conventional magnetotelluric (MT) surveys are constrained by their frequency range and cannot resolve deep structures on thousand-kilometer scales. Geomagnetic depth sounding (GDS), which utilizes ultra-long-period signals (>100 days), can image the mantle down to ∼1,600 km, making it a powerful approach for investigating mantle water content and partial melting. Here, we compile long-term geomagnetic records from an array covering eastern China and apply a three-dimensional unstructured finite-element GDS modeling and inversion scheme. The inversion employs a limited-memory quasi-Newton optimization strategy to improve computational efficiency and model stability. The resulting electrical resistivity model delineates the mantle transition zone and lower mantle beneath eastern China, clearly imaging the stagnant Pacific slab and indicating possible dehydration and melting processes. These findings offer new constraints and insights into the structure and dynamics of the deep earth.
1 Introduction
Eastern China has long been located at the leading edge of Pacific plate subduction, where its deep structural evolution is closely linked to regional geodynamic processes (Wu et al., 2005; Li et al., 2020; Li et al., 2021). Numerous studies have shown that volatile components—particularly water—carried by the subducting slab during its passage through the mantle transition zone (410–660 km) can substantially influence the physical properties and dynamic behavior of mantle materials (Karato, 1990; Karato, 2011; Xu et al., 2012). Water not only reduces mantle viscosity and solidus temperature, promoting partial melting, but also significantly enhances electrical conductivity (Yoshino et al., 2008). Therefore, imaging the deep mantle’s electrical structure is crucial for characterizing the distribution of hydrated mantle, identifying zones of partial melting, and understanding regional geodynamic processes (Ma et al., 2024; Lai et al., 2025).
While seismic tomography has achieved significant progress in delineating mantle structures and has revealed possible stagnant slab segments and their distribution beneath eastern China (Si et al., 2016; Lai et al., 2019), seismic velocity anomalies alone cannot directly constrain the hydration state or electrical properties of subsurface materials. To better resolve hydrated anomalies and physical property variations in the deep mantle, it is essential to employ geophysical techniques with higher sensitivity to electrical conductivity. Geomagnetic depth sounding (GDS), a passive-source electromagnetic method, analyzes long-period geomagnetic field variations at the Earth’s surface to image mantle conductivity structures to depths of thousands of kilometers, offering unique advantages in revealing mantle hydration, partial melt distribution, and thermal structure (Utada et al., 2003; Kelbert et al., 2009; Kuvshinov and Semenov, 2012; Püthe et al., 2015).
However, due to limitations in data availability and computational resources, most global-scale GDS studies have focused on large-scale conductivity anomalies, resulting in low-resolution images that cannot meet the requirements for detailed structural characterization in specific regions (Kelbert et al., 2009; Semenov and Kuvshinov, 2012). Kelbert et al. (2008) emphasized that station density is a key factor limiting GDS inversion resolution. In recent years, Zhang et al. (2020) systematically compiled decades of geomagnetic observations across China and developed a stable method for extracting long-period transfer functions, thereby providing a robust data foundation for high-resolution GDS investigations.
Numerous seismic tomography studies have demonstrated that the Pacific plate has subducted into the mantle transition zone beneath eastern China, extending horizontally beneath the North China and southern Northeast China regions and forming a large mantle wedge above the stagnant slab (Huang and Zhao, 2006; Tian et al., 2016; Ma et al., 2017). Complementary to these seismic observations, Guang-Jing et al. (2015) converted geomagnetic observatory records in North China into magnetotelluric scalar impedance data, and their one-dimensional inversion revealed significant electrical contrasts across the North–South Gravity Lineament. Due to the sparse distribution of geomagnetic observatories, many subsequent studies have also relied on one-dimensional inversions of geomagnetic data to investigate this region (Egbert and Booker, 1992; Utada et al., 2003; Munch et al., 2017). However, the strong heterogeneity of mantle conductivity makes one-dimensional approaches insufficient for accurately resolving the geometry and continuity of anomalous structures. Such simplified methods fail to capture the spatial complexity necessary for regional-to large-scale deep Earth imaging. Consequently, higher-dimensional inversion techniques, particularly 3D MT modeling, are essential for providing a more reliable characterization of mantle conductivity and for advancing our understanding of subduction-related geodynamic processes in eastern China.
Against this background, the present study leverages the extensive geomagnetic network across mainland China, applying a three-dimensional unstructured tetrahedral finite-element forward modeling approach combined with a limited-memory quasi-Newton optimization scheme to investigate the deep mantle conductivity beneath eastern China (Ma et al., 2024). Using high-precision 3-D GDS imaging, we resolve the electrical structure of the mantle transition zone and the uppermost lower mantle, thereby exploring the spatial distribution of hydration and partial melting. Our results are expected to provide new geophysical evidence and theoretical constraints on the distribution of deep mantle materials and the geodynamic evolution of eastern China.
2 Data and methods
2.1 Data
To investigate the deep mantle conductivity beneath eastern China, we utilized long-term geomagnetic observations from the National Geomagnetic Network Center of China, which operates approximately 200 observatories across the country. Since 2008, a large number of newly established stations have recorded only relative geomagnetic field variations, resulting in shorter observation spans. For these stations, the maximum stable period of the derived C-response is limited to 42.7 days. In contrast, stations with more than 10 years of continuous data acquisition provide C-responses with maximum periods of up to 113.7 days (Table 1). Following a rigorous data screening process, the distribution of observatories yielding stable C-responses is shown in Figure 1.
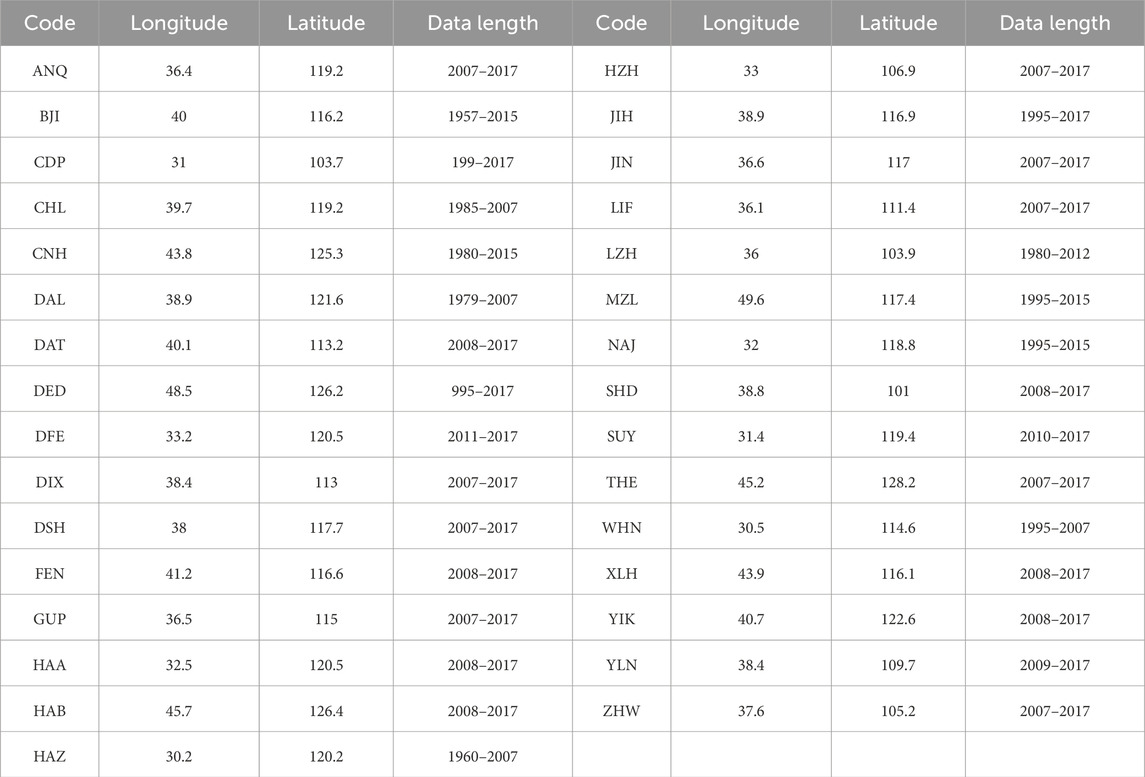
Table 1. Station details are used in this article.
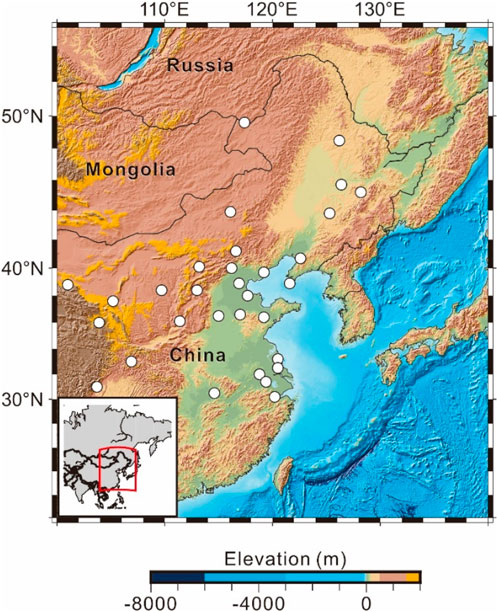
Figure 1. The locations of the geomagnetic stations. White circles indicate the geomagnetic stations.
2.2 Geomagnetic response
In GDS studies, time-series magnetic field data recorded at geomagnetic observatories are typically transformed into frequency-domain C-responses or other transfer functions to remove the influence of the source current strength. In this study, we employ the widely used C-response function. Since the variable currents in the magnetosphere can be expressed by
The computed C-response has units of kilometers. Under the assumption of a one-dimensional Earth and a
2.3 3-D forward modeling
For a time-harmonic factor eiωt, the governing curl–curl equation for the electric field in the frequency domain is Equation 2:
where ω is the angular frequency, μ0 is the magnetic permeability of free space, σ is the electrical conductivity, and E denote the electric field intensities.
The forward modeling is implemented using the finite element method (FEM). Within each tetrahedral element, the electric field is expressed as Equation 3:
where Nj is the vector interpolation basis function, and Ej is the electric field value at the midpoint of the element edge.
Applying the Galerkin method yields Equation 4:
where A and M are the stiffness and mass matrices of the tetrahedral element, respectively, and S is the source term on the outer boundary. The specific expressions are Equations 5–7:
The external magnetic field is given by Equation 8:
2.4 Inversion theory
The 3-D inversion problem for GDS can be formulated as finding the optimal model
Here,
In this study, the objective function is defined using the L2 norm minimizes the objective function, as shown in Equation 10:
where d is the observed data vector, m and m0 are the model and initial model parameter vectors, respectively.
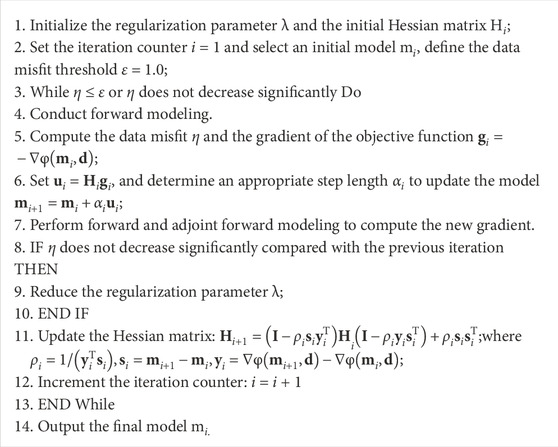
The inversion is performed using the limited-memory Broyden–Fletcher–Goldfarb–Shanno (L-BFGS) algorithm, which introduces a limited-memory strategy into the classical BFGS optimization method. This modification significantly reduces memory requirements and addresses efficiency issues caused by the loss of the inverse Hessian matrix during the initial iterations, making L-BFGS particularly suitable for large-scale 3-D electromagnetic inversion problems.
The L-BFGS workflow applied in this study is as follows:
3 Results
A pronounced contrast in conductivity between land and ocean produces the so-called ocean induction effect, which introduces significant distortions in C-response data. Kuvshinov et al. (2002) demonstrated that such effects strongly influence the responses of coastal geomagnetic stations, particularly within a period range of up to ∼20 days. It is therefore essential to account for ocean induction effects in three-dimensional GDS inversion. A common approach is to approximate Earth’s surface conductivity using a 10° × 10° land–ocean grid, however, this simplification can still result in considerable errors. To overcome this limitation, Ma et al. (2024) proposed a novel three-dimensional GDS inversion method that directly incorporates the real Earth surface conductivity distribution into the inversion model. Following this strategy, we also adopt the actual surface conductivity distribution in our inversion, as shown in Figure 2 (Everett et al., 2003).
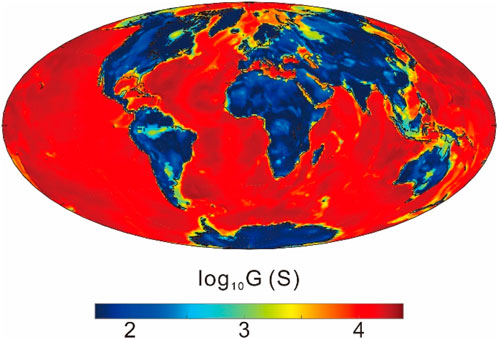
Figure 2. The map of global surface conductance.
The inversion was initialized using the global mean conductivity model of Kelbert et al. (2009) as the background (Table 2). In this setup, the eight layers above 1,600 km depth were allowed to vary freely, whereas the four layers between 1,600 km and the outer core were fixed and laterally homogeneous, owing to the limited sensitivity of geomagnetic induction to conductivity structure at such depths. The model was discretized into an unstructured tetrahedral mesh with 943,513 elements. The regularization parameter was initially set to λ = 100 and updated iteratively using a cooling strategy (Zhdanov, 2002).
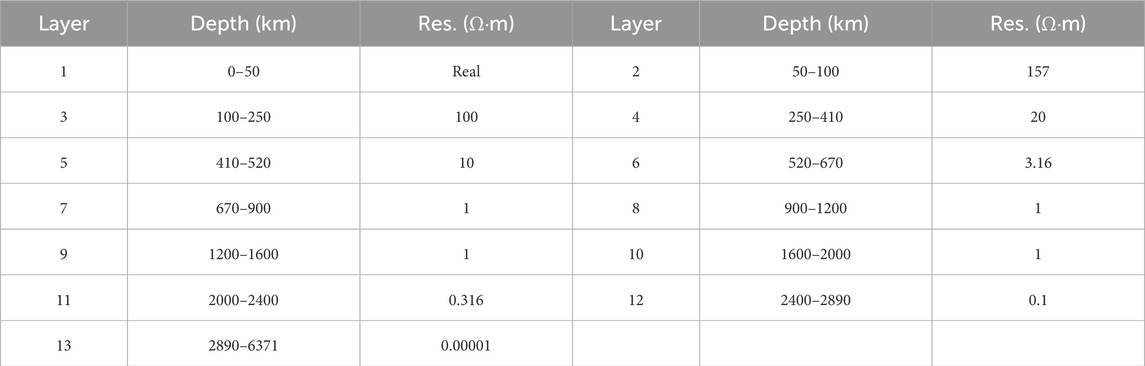
Table 2. One-dimensional layered earth resistivity model.
Observed and modeled responses for representative stations are shown in Figure 3. Short-period responses are well reproduced, whereas slight misfits appear at the longest periods for a few stations, likely due to the limited availability and lower reliability of long-period observations. Within the period range used in this study, these discrepancies exert minimal influence on conductivity estimates at depths greater than ∼1,000 km.
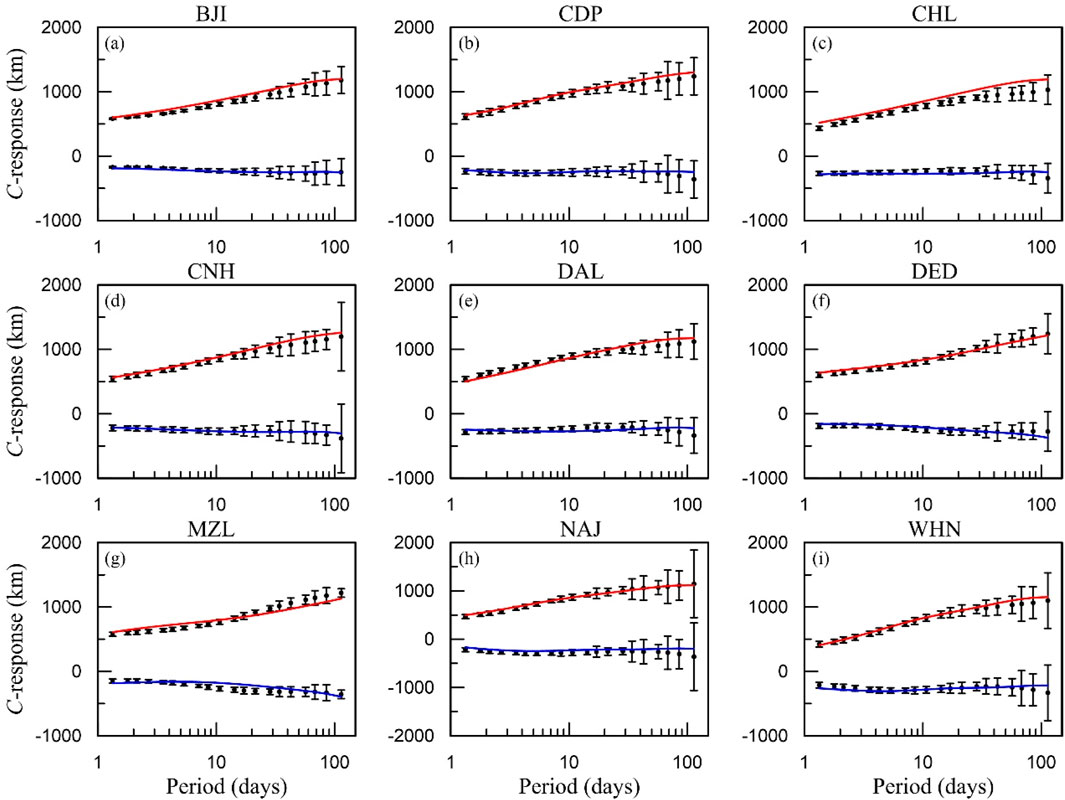
Figure 3. (a–i) show the C-responses at the representative stations. Black dots indicate field data, the red line and the blue line indicate real part and imaginary part, respectively.
To highlight deviations from the background model, the inverted three-dimensional conductivity structure was compared with the one-dimensional background model (Table 2). We computed the logarithmic ratio between the two and plotted horizontal slices for the region 10°–60°N, 90°–140°E (Figure 4). Given the shortest period used (1.13 days), the model is insensitive to structures shallower than ∼200 km. Considering the optimal resolving capability of GDS for depths between 410 and 1,200 km (Kelbert et al., 2009), we mainly present results for depths of 250–900 km. Interpretation focuses on mainland China and adjacent offshore regions where station coverage is adequate, and large-scale anomalies in Mongolia and Russia, where no station control exists, are not discussed.
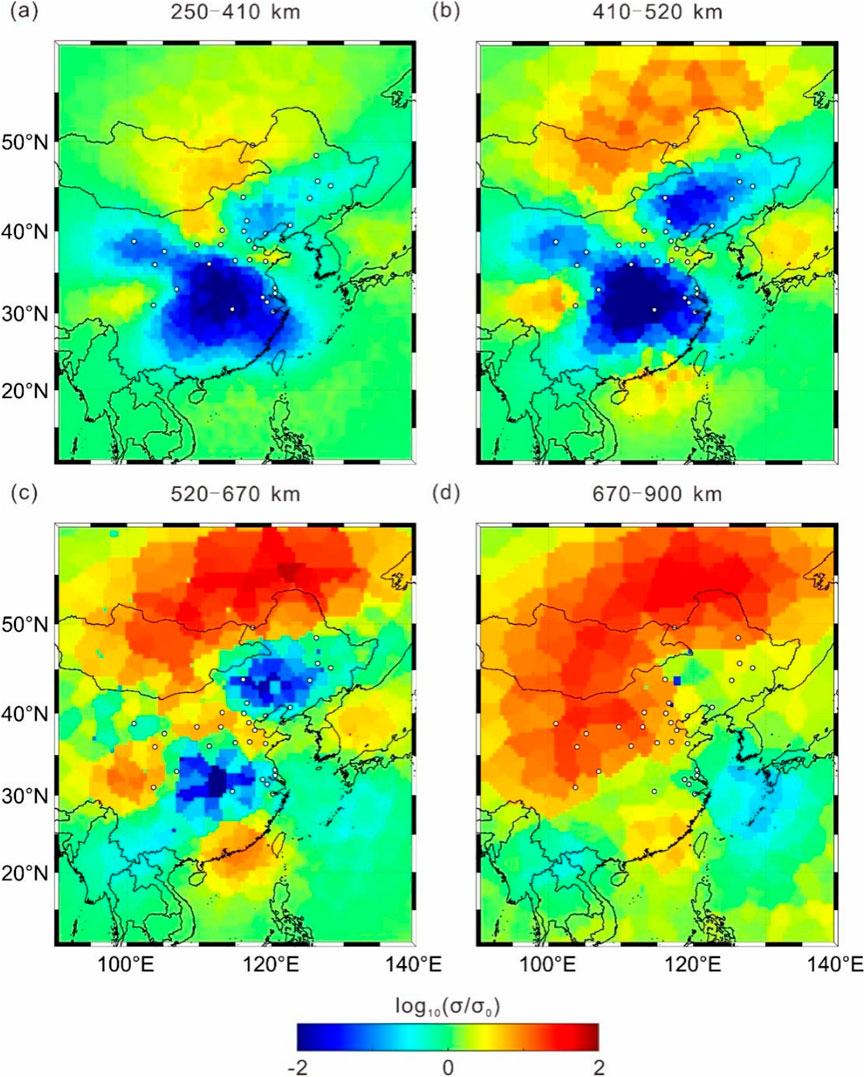
Figure 4. Electrical conductivity model of the mantle beneath eastern China, where Figure 3 (a–d) represent the models at different depths.
At depths of 250–410 km, two pronounced high-resistivity anomalies occur in central China and central–northeastern China, while the Shandong Peninsula and Bohai Bay periphery exhibit high conductivity. Between 410 and 520 km depth, the high-resistivity anomaly in northeastern China intensifies, and a high-conductivity anomaly emerges in the South China–South China Sea region, spatially coinciding with the Hainan mantle plume location identified by Li and Liu (2023). This conductor extends upward from the lower mantle through the transition zone into the upper mantle.
Between 520 and 670 km depth, the Bohai Bay conductor extends westward and develops a north–south trend. This anomaly may be related to the water-rich stagnant slab from the western Pacific subduction in northeastern China and matches the low-velocity structure beneath the Yanshan Orogen in seismic tomography images. During the same depth range, the high-resistivity anomaly in central China decreases in extent.
In the 670–900 km depth range, the previously observed high-resistivity anomalies become less distinct, and high conductivity dominates in the North China and Inner Mongolia regions, possibly reflecting the deep thermo-mechanical structure beneath the North–South Seismic Belt. In the western segment of the Central Orogenic Belt, conductivity gradients with depth remain relatively uniform and markedly lower than in surrounding regions, suggesting the presence of a relatively cold mantle channel, whose potential connection with a deep cold plume warrants further investigation.
Overall, the mantle electrical structure beneath eastern China is characterized by: (1) significant high-resistivity anomalies in central–northeastern China and central China between 250 and 670 km; (2) a persistent high-conductivity anomaly beneath the South China Sea–Hainan region from 410 to 900 km, potentially linked to mantle plume activity; and (3) a high-conductivity belt beneath the Bohai Bay and surrounding areas between 520 and 900 km, extending westward and along a north–south axis, likely influenced by the stagnant slab and its hydration. These conductivity patterns are consistent with seismic velocity structures and lithospheric geodynamic evidence.
4 Conclusion
This study presents, for the first time, a three-dimensional electrical conductivity model of the mantle beneath eastern China derived from C-response data spanning periods of 3.5–113 days, obtained from regional geomagnetic observatories. The inversion results reveal a vertically continuous conductive anomaly between 250 and 900 km depth, centered beneath the Shandong Peninsula and Bohai Bay. The conductivity model supports the interpretation that the western Pacific subduction zone delivers significant amounts of water into the mantle transition zone and provides strong evidence for the existence of the Hainan plume.
It should be noted, however, that the depth sensitivity of GDS limits its ability to resolve the geometry of stagnant slabs in the shallow upper mantle. Complementary approaches, such as long-period MT, can be employed to better constrain the upper mantle conductivity structure. Future research integrating GDS and long-period MT data through joint inversion is expected to significantly enhance our capability to investigate subduction zone processes.
Data availability statement
The data used for inversion can be downloaded from the World Data Centre. The original contributions presented in the study are included in the article, further inquiries can be directed to the corresponding author.
Author contributions
XM: Writing – original draft, Writing – review and editing, Conceptualization, Methodology, Software, Visualization, Supervision. JL: Conceptualization, Data curation, Funding acquisition, Visualization, Writing – original draft, Writing – review and editing. KX: Formal Analysis, Funding acquisition, Project administration, Supervision, Writing – review and editing.
Funding
The author(s) declare that financial support was received for the research and/or publication of this article. This research was supported by National Natural Science Foundation of China under (42274181), the National Science and Technology Major Project of China (2024ZD1004201) and the Basic Scientific Research Program of Shandong Earthquake Agency (YB2417).
Conflict of interest
The authors declare that the research was conducted in the absence of any commercial or financial relationships that could be construed as a potential conflict of interest.
The handling editor BZ declared a past co-authorship with one of the authors XM.
Generative AI statement
The author(s) declare that no Generative AI was used in the creation of this manuscript.
Any alternative text (alt text) provided alongside figures in this article has been generated by Frontiers with the support of artificial intelligence and reasonable efforts have been made to ensure accuracy, including review by the authors wherever possible. If you identify any issues, please contact us.
Publisher’s note
All claims expressed in this article are solely those of the authors and do not necessarily represent those of their affiliated organizations, or those of the publisher, the editors and the reviewers. Any product that may be evaluated in this article, or claim that may be made by its manufacturer, is not guaranteed or endorsed by the publisher.
References
Banks, R. J. (1969). Geomagnetic variations and the electrical conductivity of the upper mantle. Geophys. J. Int. 17 (5), 457–487. doi:10.1111/j.1365-246X.1969.tb00252.x
Egbert, G. D., and Booker, J. R. (1992). Very long period magnetotellurics at Tucson Observatory—Implications for mantle conductivity. J. Geophys. Res. 97 (B11), 15 099–15 112. doi:10.1029/92jb01251
Everett, M. E., Constable, S., and Constable, C. G. (2003). Effects of near-surface conductance on global satellite induction responses. Geophys. J. Int. 153 (1), 277–286. doi:10.1046/j.1365-246X.2003.01906.x
Guang-Jing, X. U., Ji, TANG, Huang, Q.-H., and Uyeshima, M. (2015). Study on the conductivity structure of the upper mantle and transition zone beneath north China. Chin. J. Geophys. (in Chinese) 58 (2), 566–575. doi:10.6038/cjg20150219
Huang, J., and Zhao, D. (2006). High-resolution mantle tomography of China and surrounding regions. Journal of Geophysical Research 111, B09305. doi:10.1029/2005jb004066
Karato, S. (1990). The role of hydrogen in the electrical conductivity of the upper mantle. Nature 347 (6290), 272–273. doi:10.1038/347272a0
Karato, S.-I. (2011). Water distribution across the mantle transition zone and its implications for global material circulation. Earth planet. Sci. Lett. 301, 413–423. doi:10.1016/j.epsl.2010.11.038
Kelbert, A., Egbert, G. D., and Schultz, A. (2008). Non-linear conjugate gradient inversion for global EM induction: resolution studies. Geophysical Journal International 173 (2), 365–381. doi:10.1111/j.1365-246X.2008.03717.x
Kelbert, A., Schultz, A., and Egbert, G. (2009). Global electromagnetic induction constraints on transition-zone water content variations. Nature 460 (7258), 1003–1006. doi:10.1038/nature08257
Kuvshinov, A., and Semenov, A. (2012). Global 3-D imaging of mantle electrical conductivity based on inversion of observatory C-responses-I. An approach and its verification: 3-D imaging of mantle conductivity-I. Geophys. J. Int. 189, 1335–1352. doi:10.1111/j.1365-246X.2011.05349.x
Kuvshinov, A. V., Olsen, N., Avdeev, D. B., and Pankratov, O. V. (2002). Electromagnetic induction in the oceans and the anomalous behaviour of coastal C-responses for periods up to 20 days. Geophysical Research Letters 29 (12), 36-1–4. doi:10.1029/2001gl014409
Lai, Y., Chen, L., Wang, T., and Zhan, Z. (2019). Mantle transition zone structure beneath northeast Asia from 2-D triplicated waveform modeling: implication for a segmented stagnant slab. Journal of Geophysical Research Solid Earth 124 (2), 1871–1888. doi:10.1029/2018JB016642
Lai, M., Ren, X., Yin, C., Liu, Y., Ma, X., Wang, Y., et al. (2025). Electrical conductivity of mantle transition zone and water content revealed by the magnetic data of China seismo-electromagnetic satellite. IEEE Journal of Selected Topics in Applied Earth Observations and Remote Sensing 18, 3173–3184. doi:10.1109/JSTARS.2024.3523671
Li, S., and Liu, Y. (2023). Cold and wet mantle transition zone beneath the Mediterranean Sea revealed by the electrical image. Applied Sciences 13 (2), 689. doi:10.3390/app13020689
Li, S., Weng, A., Zhang, Y., Schultz, A., Li, Y., Tang, Y., et al. (2020). Evidence of Bermuda hot and wet upwelling from novel three-Dimensional global mantle electrical conductivity image. Geochemistry, Geophysics, Geosystems 21 (6), e2020GC009016. doi:10.1029/2020GC009016
Li, Y., Weng, A., Xu, W., Zou, Z., Tang, Y., Zhou, Z., et al. (2021). Translithospheric magma plumbing system of intraplate volcanoes as revealed by electrical resistivity imaging. Geology 49 (11), 1337–1342. doi:10.1130/G49032.1
Ma, J., Tian, Y., Liu, C., Zhao, D., Feng, X., and Zhu, H. (2017). P-wave tomography of northeast Asia: constraints on the Western Pacific plate subduction and mantle dynamics. Phys. Earth Planet. Inter. doi:10.1016/j.pepi.2017.11.003
Ma, X., Liu, Y., Yin, C., Li, J., Li, J., Ren, X., et al. (2024). Global mantle conductivity imaging using 3-D geomagnetic depth sounding with real Earth surface conductivity constraint. Computers and Geosciences 192 (October), 105697. doi:10.1016/j.cageo.2024.105697
Munch, F. D., Grayver, A. V., Kuvshinov, A. V., and Khan, A. (2017). Stochastic inversion of geomagnetic observatory data including rigorous treatment of the ocean induction effect with implications for transition zone water content and thermal structure. Journal of Geophysical Research Solid Earth 123, 31–51. doi:10.1002/2017jb014691
Püthe, C., Kuvshinov, A., Khan, A., and Olsen, N. (2015). A new model of earth’s radial conductivity structure derived from over 10 Yr of satellite and observatory magnetic data. Geophysical Journal International 203 (3), 1864–1872. doi:10.1093/gji/ggv407
Semenov, A., and Kuvshinov, A. (2012). “Global 3-D imaging of mantle conductivity based on inversion of observatory C -Responses-II. Data analysis and results: 3-D imaging of mantle Conductivity-II. Geophysical Journal International doi:10.1111/j.1365-246X.2012.05665.x
Si, S., Zheng, Y., Liu, B., and Tian, X. (2016). Structure of the Mantle transition Zone beneath the north China craton. Journal of Asian Earth Sciences 116 (February), 69–80. doi:10.1016/j.jseaes.2015.11.006
Tian, Y., Zhu, H., Zhao, D., Liu, C., Feng, X., Liu, T., et al. (2016). Mantle transition zone structure beneath the Changbai volcano: insight into deep slab dehydration and hot upwelling near the 410 km discontinuity. Journal of Geophysical Research Solid Earth 121, 5794–5808. doi:10.1002/2016jb012959
Utada, H., Koyama, T., Shimizu, H., and Chave, A. D. (2003). A semi-global reference model for electrical conductivity in the mid-mantle beneath the north Pacific region. Geophysical Research Letters 30 (4). doi:10.1029/2002GL016092
Wu, F.-Y., Lin, J.-Q., Wilde, S. A., Zhang, X. ’Ou, and Yang, J.-H. (2005). Nature and significance of the Early Cretaceous giant igneous event in eastern China. Earth and Planetary Science Letters 233 (1), 103–119. doi:10.1016/j.epsl.2005.02.019
Xu, Y.-G., Zhang, H.-H., Qiu, H.-N., Ge, W.-C., and Wu, F.-Y. (2012). Oceanic crust components in Continental basalts from shuangliao, northeast China: derived from the mantle transition zone? Chemical Geology, Geochemical Perspectives on Mantle Dynamics and Plate Interactions in Asia A Special Issue in Honor/Memory of Dr. Shen-su Sun 328 (October), 168–184. doi:10.1016/j.chemgeo.2012.01.027
Yoshino, T., Manthilake, G., Matsuzaki, T., and Katsura, T. (2008). Dry mantle transition zone inferred from the conductivity of wadsleyite and ringwoodite. Nature 451 (7176), 326–329. doi:10.1038/nature06427
Zhang, Y., Weng, A., Li, S., Yue, Y., Tang, Yu, and Liu, Y. (2020). Electrical conductivity in the mantle transition zone beneath eastern China derived from L1-Norm C-Responses. Geophysical Journal International 221 (2), 1110–1124. doi:10.1093/gji/ggaa059
Keywords: electrical conductivity, north China, geomagnetic depth sounding, three-dimensional inversion, mantle transition zone
Citation: Ma X, Li J and Xu K (2025) Mantle conductivity structure beneath eastern China using 3-D geomagnetic depth sounding. Front. Earth Sci. 13:1688450. doi: 10.3389/feart.2025.1688450
Received: 19 August 2025; Accepted: 12 September 2025;
Published: 25 September 2025.
Edited by:
Bo Zhang, Jilin University, ChinaReviewed by:
Xiaoyue Cao, Key Laboratory of Exploration Technologies for Oil and Gas Resource (Yangtze University), Ministry of Education, ChinaXushan Lu, Shandong University, China
Copyright © 2025 Ma, Li and Xu. This is an open-access article distributed under the terms of the Creative Commons Attribution License (CC BY). The use, distribution or reproduction in other forums is permitted, provided the original author(s) and the copyright owner(s) are credited and that the original publication in this journal is cited, in accordance with accepted academic practice. No use, distribution or reproduction is permitted which does not comply with these terms.
*Correspondence: Jingru Li, bGlqaW5ncnUzMzBAMTI2LmNvbQ==
†These authors have contributed equally to this work and share first authorship