 Pan Wang
 Yunhong Wang1
- 1Xi’an Research Institute Co. Ltd., China Coal Technology and Engineering Group Corp., Xi’an, China
- 2College of Geology and Environment, Xi’an University of Science and Technology, Xi’an, China
- 3CCTEG Xi’an Transparent Geology Technology Co., Ltd., Xi’an, China
- 4State Key Laboratory of Intelligent Coal Mining and Strata Control, Xi’an, China
Quantitative detection of geological anomalies in coal mines is crucial for constructing transparent geological models and mitigating hidden disaster-causing factors. Aiming at the problem of quantitative detection of faults and goafs in underground coal mines, a multi-coal seam solid physical model including faults and goafs was designed and manufactured. The ultrasonic seismic physical simulation system was used to perform 2D solid data acquisition and migration imaging analysis of the model in direct contact with the transducer and the model. First, similarity material proportioning experiments for coal and rock were performed. After 33 groups of material ratio experiments, it was finally determined that the surrounding rock material was selected with epoxy resin and talcum powder with a mass ratio of 100:130, and the coal seam material was selected with epoxy resin and silicone rubber with a mass ratio of 100:60. The fabricated coal-rock specimens exhibited errors in Vp, Vs., and ρ all within ±5%. The 3D seismic physical models of multi-coal seams with dip angles of 45° and 90° and goafs were made by means of mold control horizon, anti-mold control structural accuracy, layer-by-layer pouring and 3D carving. Surface reflection acquisition was then performed for 2D wavefield analysis. The results show that the solid acquisition can obtain direct wave, surface wave, wave impedance interface reflection wave and interlayer multiple wave at the top and bottom interface of each coal seam. The rich wavefield responses confirm successful model fabrication, enabling quantitative analysis of anomaly characteristics.
1 Introduction
With the depletion of shallow resources, coal mining is accelerating the transfer to deep areas with more complex geological conditions. High-precision and high-efficiency detection and identification of hidden disaster-causing geological structures such as faults and goafs has become a core scientific and technological problem that needs to be solved urgently to achieve deep safe and efficient mining. At present, mine geophysical exploration technology, especially channel wave seismic exploration, has become mature in the qualitative identification of geological anomalies. However, there are still technical bottlenecks in quantitative and accurate detection for engineering applications. The existing technical system has insufficient ability to accurately invert the key spatial parameters (such as drop, strike, tendency, extension range, etc.) of the disaster-causing body, which seriously restricts the ability to construct a high-precision ‘transparent geology ‘model, thus weakening the effective prediction and active prevention and control efficiency of hidden disaster-causing sources, and becoming an important constraint for safe and efficient mining of deep coal mines (Yuan et al., 2025; Huamin and Fu, 2006; Wang et al., 2024; Jianyuan et al., 2022; Cheng et al., 2025).
The numerical simulation method has made breakthrough progress in many technical directions such as channel wave exploration, seismic while mining, and seismic while excavation. Especially in the field of channel wave detection, the identification of geological anomalies has moved from qualitative to accurate quantification of parameters. The in-seam wave velocity is used to image the faults in the coal mining face, and the fault properties are determined by the relative velocity (the low-velocity zone is the reverse fault, and the high-velocity zone is the normal fault). It is pointed out that the fault displacement can be qualitatively evaluated according to the wave velocity, or quantitatively evaluated in combination with the exposed area analogy (Zhou et al., 2007). Thickness measurement of coal seams using channel waves was studied (Schott and Waclawik, 2015; Zhu et al., 2019; Cui et al., 2009); the channel wave response characteristics of faults are studied, and the energy and frequency band of channel wave are semi-quantitatively analyzed for faults with different fault throws, but the quantitative relationship between fault throw and energy is not given (Liang, 2020; Huang and Tao, 2020); from the perspective of numerical simulation, by analyzing the influence of faults with different coal thicknesses and different fault distances on the dispersion and energy of transmitted in-seam waves, a quantitative formula between normalized fault distance and equivalent quality factor is proposed (Wang et al., 2022). The influence of faults with different fault throws on the dispersion characteristics and energy distribution mode of Love trough wave is analyzed. The equivalent reflection coefficient is proposed, and the quantitative relationship between fault throw and the change rate of equivalent reflection coefficient with wavelength is formed (Yang et al., 2025). However, the numerical simulation method is essentially dependent on the approximate solution of the wave equation and the discretization of the grid in the computational domain, which inevitably introduces numerical errors, such as false scattering of high-frequency components, simulation distortion of wave field response in complex anisotropic media, and limitations on the description of wave field dynamic characteristics (such as amplitude and waveform), thus reducing the fidelity between the simulation results and the actual wave field response under complex geological conditions.
In contrast, the physical model reproduces the whole process of seismic wave propagation in complex structures with high fidelity in a controllable experimental environment by constructing a material model similar to the real geological structure, and the wave field provided is more realistic. Compared with field geological exploration, the experimental environment is ' clean ' and controllable, which can accurately study the influence mechanism of single geological factor on wave field. In the aspect of mine seismic physical simulation, the first large-scale three-dimensional seismic physical simulation system of coal industry in China was constructed (Shi et al., 2021). The three-dimensional physical simulation of Love-type in-seam wave was successfully realized from the aspects of model key parameter design and fabrication, transducer selection, data acquisition and analysis (Wang et al., 2023). The fault was studied qualitatively by three-dimensional physical simulation (Liu et al., 2023).
Aiming at the quantitative detection of faults and goafs in underground coal mines, a three-dimensional physical model of multi-coal seams containing faults and goafs was designed and manufactured, and the two-dimensional solid data acquisition and migration imaging analysis were carried out by using the ultrasonic seismic physical simulation system. It provides experimental basis and physical understanding basis for revealing the typical wave field response induced by complex geological structures, especially hidden disaster-causing bodies, and high-precision quantitative inversion methods.
2 Methods
Ultrasonic seismic physical model technology is a simulation technology that observes the propagation process of ultrasonic wave in the model medium. The geological structure and geological body in the field are made into physical models according to a certain simulation similarity ratio, and the ultrasonic wave is propagated in the constructed model. The kinematics and dynamics characteristics of ultrasonic wave propagation in these known structures are studied, so as to infer the propagation characteristics of seismic wave in real geological structures. The basic principle of ultrasonic wave used in seismic physical simulation experiment is a kind of mechanical vibration wave excited by mechanical vibration source in elastic medium. Its essence is to transmit vibration energy in the form of stress wave, which has the same physical properties as actual seismic exploration. The wave equation of ultrasonic wave propagating in three-dimensional medium is Formula 1:
The physical model is the same as the wave equation of the actual earthquake propagation, which is expressed in the form of the following band m. Then there is Formula 3.
Ultrasonic seismic physical simulation is to reduce the field geological body in a certain proportion. When designing the physical model, the similarity between the model and the actual geological body must be considered as the Formula 4:
However, in the experiment of seismic physical model, it is very difficult to satisfy all the parameters at the same time. It is necessary to ensure that the main parameters are equal, and the secondary factors are roughly approximate.
In general, the model material can be selected according to the speed of the real geological body to be studied in the experiment, and the speed of the two can be consistent as much as possible. Finally, the similarity criterion can be simplified as:
The Formula 5 is the basic basis for judging the similarity between the model and the actual medium, and it is also the basic similarity criterion for the design of ultrasonic seismic physical model. Therefore, the similarity ratio should be determined first when the model is made.
3 Construction of seismic physical models
3.1 Design of 3D physical model with typical geological structures
The construction of physical model is the key to carry out high-precision simulation experiments. The material properties, geometric shape, structural complexity and fabrication accuracy of the model directly determine the reliability and universality of the simulation results. In order to maximize the efficiency of the model, a multi-coal seam seismic physical model with different fault distances, dip faults and goafs is designed, and multiple tests can be completed on the model. The actual length, width and height of the working face are 600 m × 200 m × 220 m respectively, and the similarity ratio is 1: 400. The length, width and height of the physical model are 1,500 mm × 500 mm × 550 mm respectively. There are seven layers in the model. From top to bottom, the seven layers represent the overlying strata, the upper group of coal, the middle and upper strata, the middle group of coal, the middle and lower strata, the lower group of coal and the lower strata. The actual design parameters are shown in Table 1.
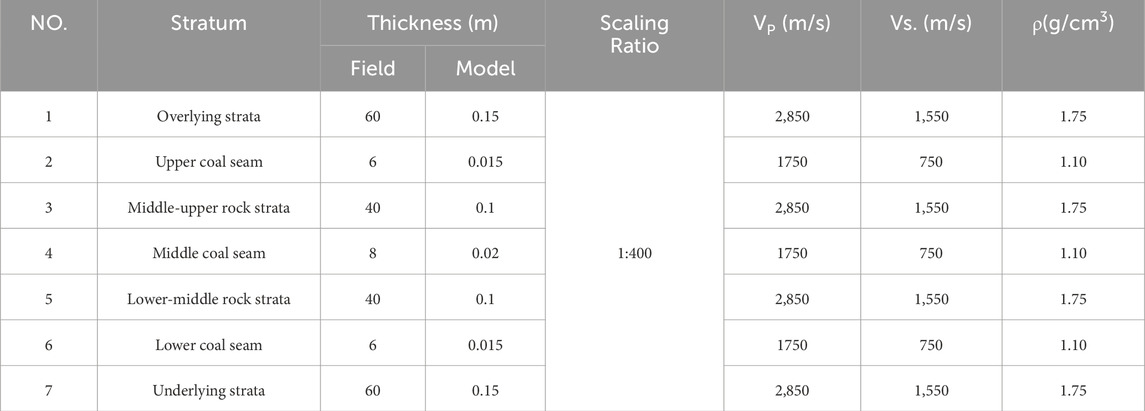
Table 1. Design parameter table corresponding to actual formation and physical model.
The three layers of coal in the upper, middle and lower groups were designed in the model, and the coal thicknesses were 15 mm, 20 mm and 15 mm, respectively. In order to avoid the mutual interference of the seismic wave field of the abnormal body, only one abnormal body is arranged in each coal seam: a normal fault is arranged at 500 mm from the left boundary of the upper coal group, the dip angle is 90°, and the drop is half of the coal thickness (7.5 mm), extending to the whole coal seam; a cylindrical goaf is arranged at 750 mm from the left boundary of the middle group coal, with a radius of 4 mm and a height of 20 mm. A fault is laid at a distance of 1,000 mm from the left boundary of the lower coal group. The fault dip angle is 45°, and the drop is 7.5 mm half of the coal thickness, which extends to the whole coal seam.
Figure 1A shows the dimensional design of the model XZ cross-section, Figure 1B displays the XZ cross-sectional view, and Figure 1C presents a three-dimensional schematic diagram of the model.
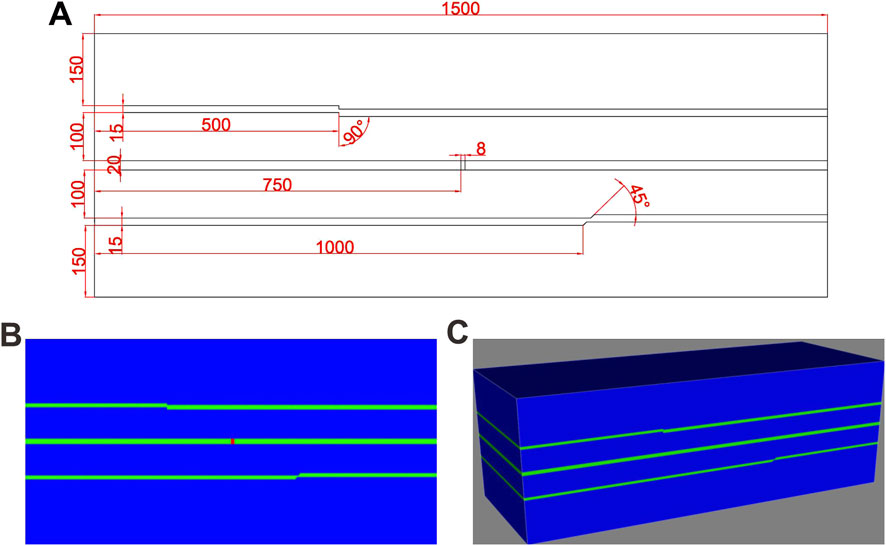
Figure 1. (A) The dimensional design of the model XZ cross-section; (B) The XZ cross-sectional view of 3D Schematic diagram of the multi-coal seam physical model; (C) 3D Schematic diagram of the multi-coal seam physical model.
3.2 Material proportioning
The base materials for seismic physical models are epoxy resin and silicone rubber. By mixing these in varying ratios, materials with velocities between 1,000 m/s and 2,600 m/s can be produced. However, as both are polymeric organic materials with low densities, the resulting mixtures have densities ranging from 1 g/cm3 to 1.2 g/cm3. To enhance the velocity and density of the modeling materials for surrounding rock fabrication, supplementary materials-typically talcum powder with a fineness of 500 mesh or higher-are added (Wang et al., 2021; Xing et al., 2021; Zhang et al., 2018; Wei and Di, 2006).
For surrounding rock material proportioning, epoxy resin was mixed with varying masses of talcum powder: 100 g of epoxy resin was combined with 10 g, 20 g, 30 g, 40 g, 60 g, 80 g, 100 g, 130 g, 160 g, 190 g, 220 g, and 250 g of talcum powder, totaling 12 experimental groups. The fabricated test blocks are shown in Figures 2A.
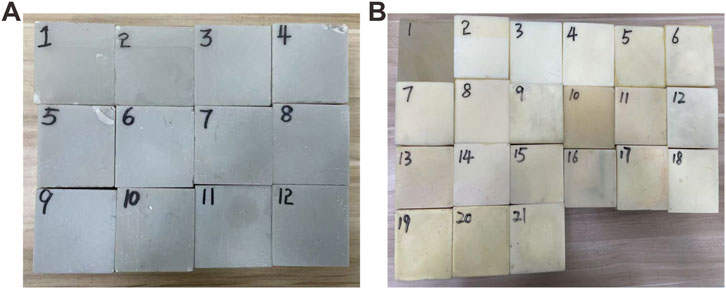
Figure 2. (A) Test specimens for surrounding rock material formulations; (B) Test specimens for coal seam material formulations.
For coal seam material proportioning, epoxy resin was mixed with varying masses of silicone rubber: 100 g of epoxy resin was combined with silicone rubber in increments of 10 g, ranging from 10 g to 200 g, totaling 21 experimental groups. The fabricated test blocks are shown in Figures 2B.
The ultrasonic testing system was employed to measure longitudinal wave velocity (Vp) and shear wave velocity (Vs.) of both coal seam and surrounding rock test specimens. Specimen densities (ρ) were determined using the underwater weighing method. The measured parameters of surrounding rock proportioning test specimens are presented in Table 2.
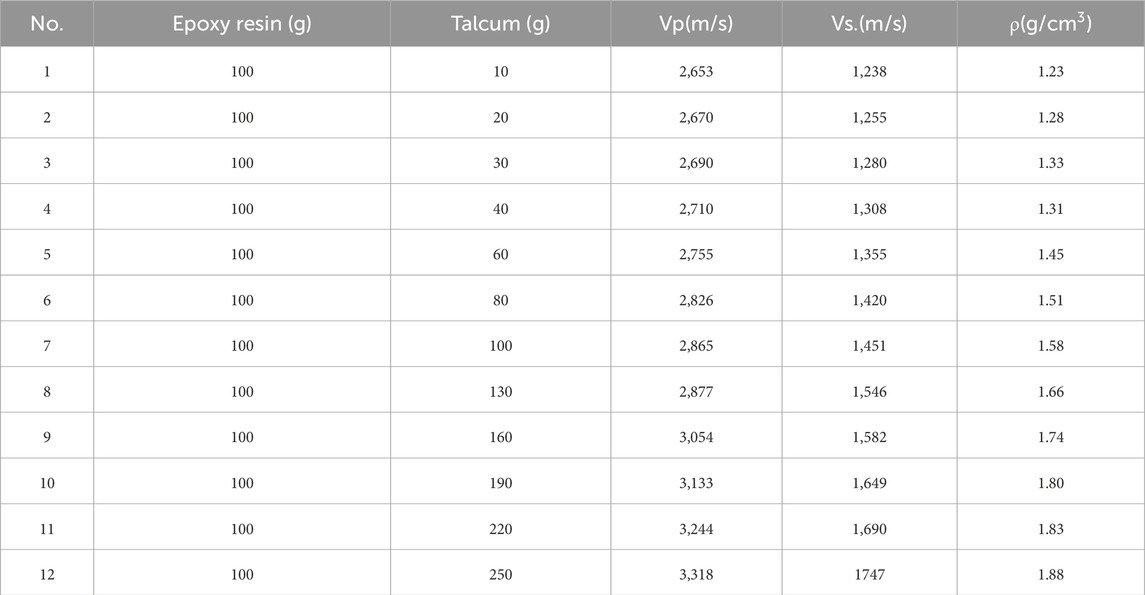
Table 2. Proportion and test parameters of epoxy resin and talcum powder.
Figure 3 illustrates the trends of Vp, Vs., and ρ with varying talcum powder content, derived from Table 2. From Table 2 and Figure 3, it can be concluded that the longitudinal wave velocity Vp range from 1,182 m/s to 3,318 m/s, the shear wave velocity Vs. range from 1,238 m/s to 1747 m/s, and the density range ρ range: 1.23 g/cm3 to 1.88 g/cm3. Vp, Vs. and ρ increased linearly with the increase of talcum powder mass. Compared with the design parameters of surrounding rock, when the mass ratio of epoxy resin to talc powder is 100: 130, it is the closest to the required parameters, so this ratio parameter is selected.
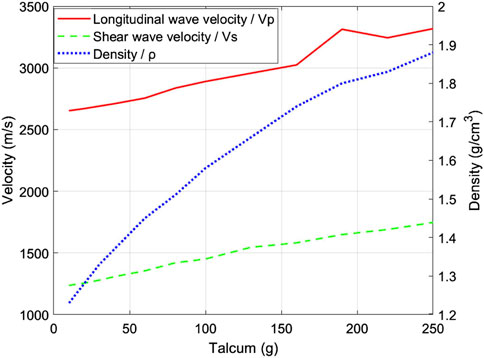
Figure 3. Variation trends of Vp, Vs., and ρ with increasing talcum powder content.
The measured parameters of coal seam proportioning test specimens are presented in Table 3, showing Vp ranging from 1,182 m/s to 2,622 m/s and Vs. from 458 m/s to 1,217 m/s (Note: When testing Vs., starting from the 15 th group ratio, the test specimen shows colloidal soft characteristics due to the high proportion of silicone rubber. The shear modulus tends to zero, which cannot form an effective shear wave propagation path, resulting in the failure of shear wave velocity detection). The range of ρ is 1.05 g/cm3 ∼ 1.18 g/cm3. Figure 4 demonstrates that Vp and Vs. decrease linearly with the increase of silicone rubber mass. The change of ρ is very small, and the silicone rubber decreases linearly before 100 g, and tends to be stable after 100 g. Compared with the design parameters of coal seam, when the mass ratio of epoxy resin to silicone rubber is 100: 60, it is the closest to the required parameters, so this ratio parameter is selected.
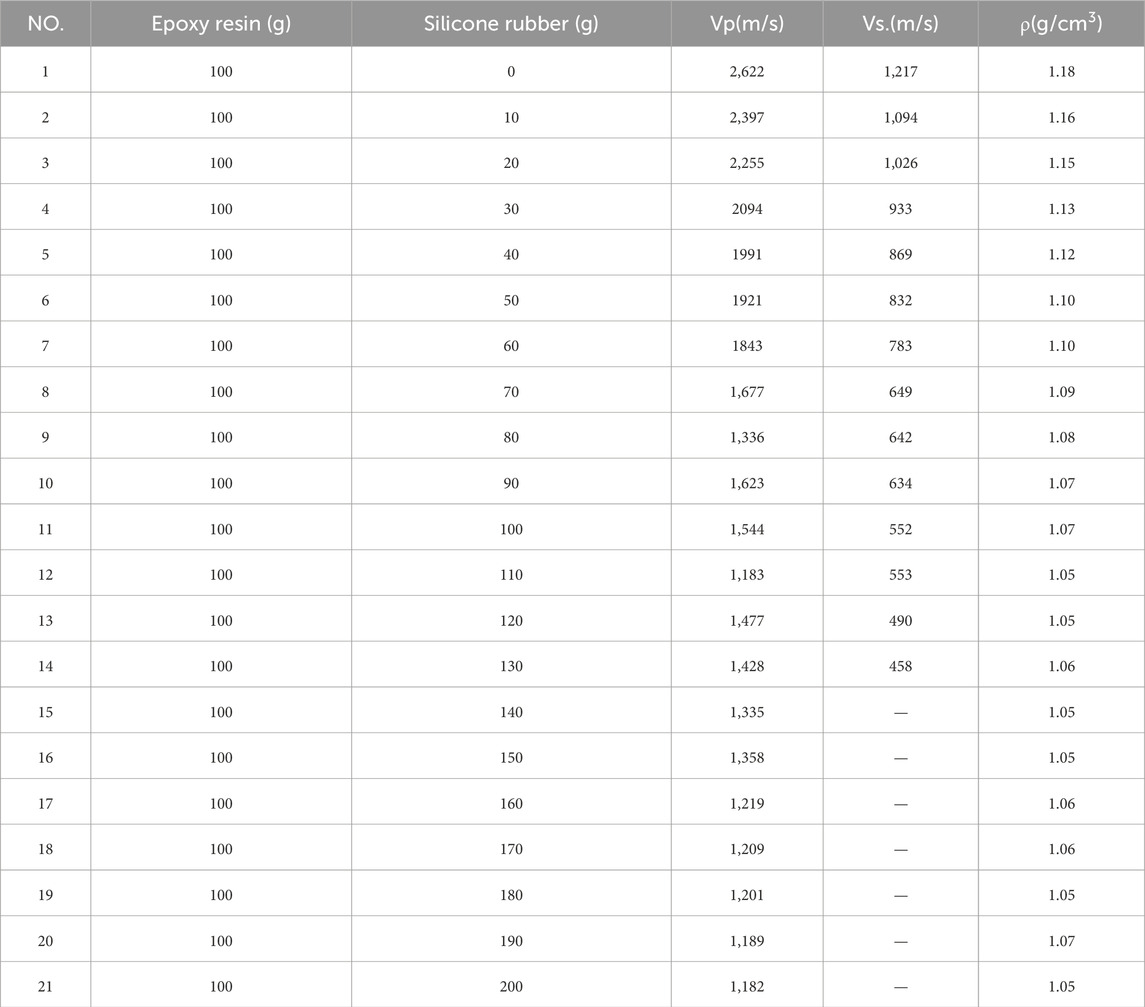
Table 3. Proportion and Test Parameters of Epoxy Resin and silicone rubber.
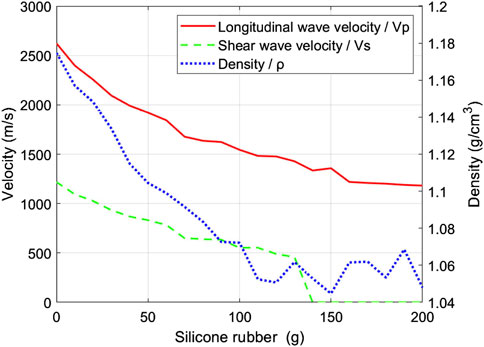
Figure 4. Variation trends of Vp, Vs., and ρ with increasing silicone rubber content.
For subsequent model fabrication, the relationship between the key parameters (Vp, Vs., ρ) of surrounding rock and coal seam and similar materials can also be fitted respectively, and the similar material ratio corresponding to the key parameters can be obtained by using the relationship.
The mass ratio of epoxy resin to talcum powder is 100: 130, and the mass ratio of epoxy resin to silicone rubber is 100: 60. Three surrounding rock and coal seam specimens were poured respectively (Figures 5A,B). In order to make the model beautiful and easy to identify, black dyeing materials are added to make coal seam materials without affecting the speed and density parameters. The parameters of the final model coal seam and surrounding rock are calculated by three sets of average values, in which the Vp of the surrounding rock is 2859 m/s, Vs. is 1548 m/s, and ρ is 1.7 g/cm3. The Vp of the coal seam is 1714 m/s, Vs. is 740 m/s, and ρ is 1.1 g/cm3. The specific parameters are shown in Table 4. The error between the surrounding rock material and the design value of the final ratio is: Vp error is 0.32%, Vs. error is −0.13%, ρ error is-2.90%, Vp error of coal seam is-2.1%, Vs. difference is-1.33%, ρ error is 0. The velocity error and density error are controlled within ±3%, and the accuracy of material parameters is high.
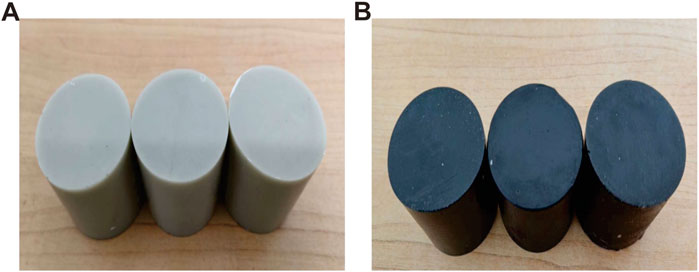
Figure 5. (A) Surrounding rock material specimens for model; (B) Coal seam material specimens for model.
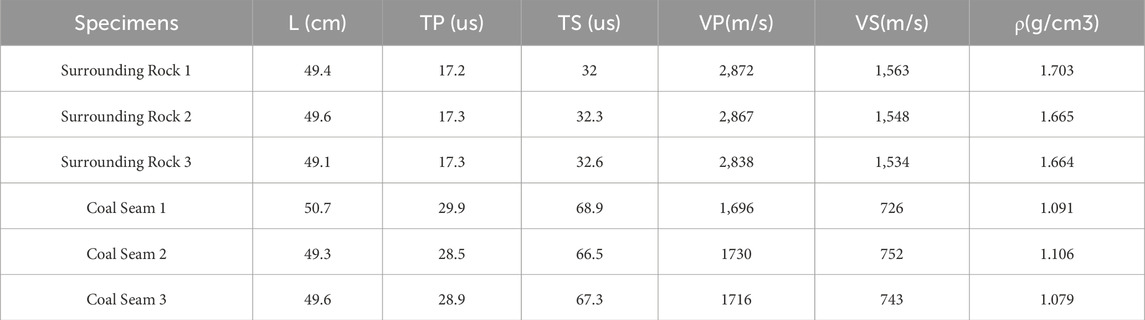
Table 4. Measured parameters of model test specimens.
3.3 Model fabrication and manufacturing process
The primary technical challenge in the construction of the whole model is the air tightness control of the goaf, which needs to ensure that the internal medium of the goaf is air and the volume is constant. The whole process adopts the stage duplex method: the first step is the goaf forming stage, and the new interlayer construction technology of pouring-bonding synergy is used to form a closed air cavity in the middle group coal area; the second step is the overall curing stage. Through the compaction-assisted layer-by-layer pouring method, the layered curing forms a ' pouring-resting ' cycle until the model is formed as a whole. The single pouring thickness is controlled within 1 cm, and the curing time of each layer is not less than 12 h. The process effectively suppresses the temperature rise deformation caused by the solidification of the material by limiting the pouring thickness, and avoids the cracking risk caused by the accumulation of residual stress.
3.3.1 Mold and lower coal-rock construction
Wooden molds were selected for fabrication due to their superior control over layer surface distribution, as the model does not involve complex structures such as stratigraphic undulations. In order to avoid the risk of coal seam positioning misalignment and structural instability caused by the compression of the operating space of the pouring bottom layer caused by the high height of the mold, the length, width and height of the inner diameter of the mold are designed to be 1,500 mm × 500 mm × 400 mm, and the height of the mold is less than 550 mm of the model height.
During model fabrication, a thin layer of 106 silicone rubber was uniformly applied to the mold perimeter and base to prevent leakage of liquid modeling materials. After sealing, model pouring commenced.
The Underlying strata was poured first as shown in Figure 6A. When the pouring reached 150 mm thickness, the lower group of coal seam (15 mm thick) intersected by a 45° normal fault was constructed. The fault was fabricated using an inverse mold process: a 500 mm × 7.5 mm×7.5 mm wedge-shaped ABS inverse mold was 3D-printed, then injected with 107 silicone rubber to create a high-precision fault mold. The silicone mold was precisely positioned at the predetermined fault location before pouring the surrounding rock material as the Figure 6B. After curing, the silicone mold was removed to form the 45° fault plane, followed by pouring the 15 mm coal seam while simultaneously reproducing the upper fault structure, ultimately completing the construction of the lower group of coal seam as the Figure 6C.
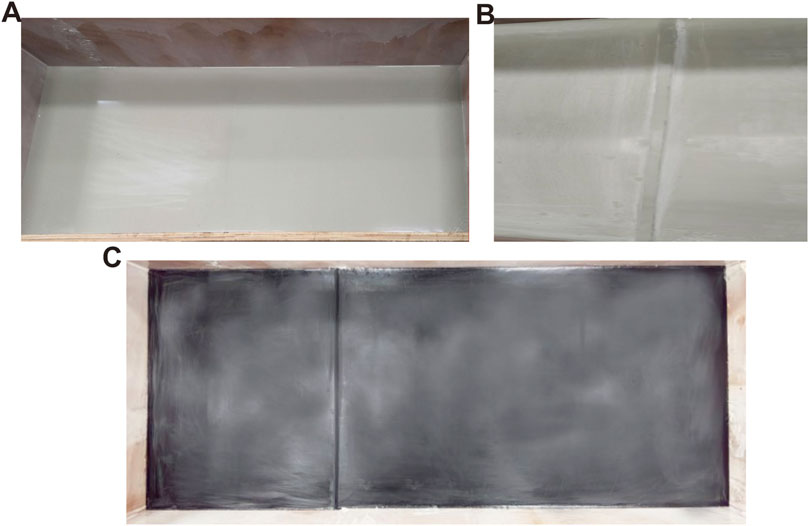
Figure 6. (A) Pouring of lower surrounding rock formation; (B) Construction of 45° normal fault structure; (C) Completion of lower group coal seam processing.
3.3.2 Goaf construction and model casting
For fabricating the 8 mm air-filled goaf in the middle coal seam, a cylindrical ABS inverse mold (8 mm diameter × 30 mm length) was 3D-printed, and high-precision cylindrical core molds were created by injecting RTV-106 silicone rubber into the inverse mold and curing. The model center was marked using a laser positioning instrument, and the core mold was fixed with low-viscosity surrounding rock adhesive to ensure verticality deviation <0.5° as the Figure 7A. The 20 mm coal seam analog material was poured in layers around the core mold, which was extracted after curing to form the goaf cavity. To prevent material infiltration during surrounding rock casting, a thin sheet material (≈0.1 mm thick) with identical composition to the surrounding rock was fabricated as the Figure 7B. The goaf periphery was coated with surrounding rock material as the Figure 7C, and the thin sheet was applied to cover the cavity top and bonded with surrounding rock material as the Figure 7D. To protect the thin sheet during subsequent 10 mm surrounding rock casting, a 2 mm surrounding rock stress buffer layer was first applied as the Figure 7E, and after curing, the main surrounding rock was cast.
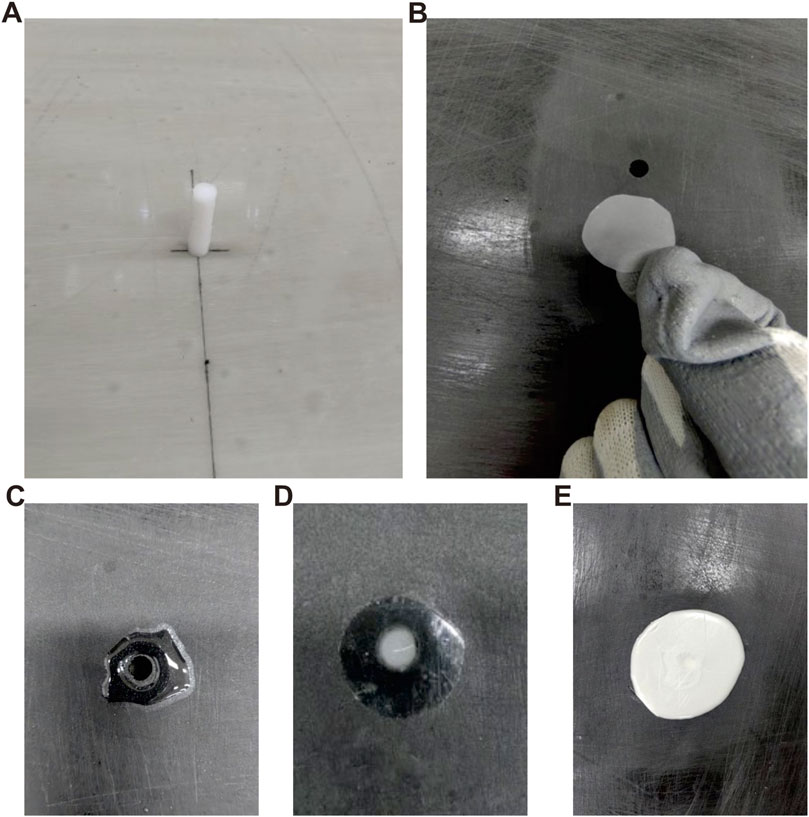
Figure 7. (A) The model center was marked using a laser positioning instrument, and the core mold was fixed with low-viscosity surrounding rock adhesive to ensure verticality deviation <0.5°; (B) To prevent material infiltration during surrounding rock casting, a thin sheet material (≈0.1 mm thick) with identical composition to the surrounding rock was fabricated; (C) The goaf periphery was coated with surrounding rock material; (D) The thin sheet was applied to cover the cavity top and bonded with surrounding rock material; (E) To protect the thin sheet during subsequent 10 mm surrounding rock casting, a 2 mm surrounding rock stress buffer layer was first applied.
After completing the casting of the middle coal seam containing the goaf, the surrounding rock, upper coal seam, and overlying strata were poured in sequence. The vertical fault in the upper coal seam was constructed using the same method as the 45° fault. Figure 8A displays the XY cross-section of the completed physical model, and Figure 8B presents a three-dimensional view of the model.
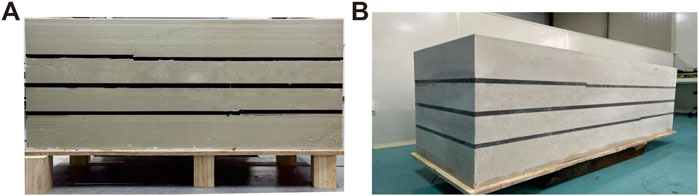
Figure 8. (A) XY plane view of physical model; (B) 3D view of physical model.
The actual measurements of layer thickness and interval velocity were compared with design values. The results show that the measured layer thickness error ≤0.2 mm and measured interval velocity error <5%, indicating high model fabrication accuracy.
4 Data acquisition
Seismic physical modeling data collected in water tanks may generate surface multiples and ghost reflections, hence ultrasonic solid data acquisition was performed on the model. The model was placed within the ultrasonic data acquisition system, and a high-precision electronic level was used to calibrate the model surface, ensuring a horizontal deviation of <0.5°. A layer of petroleum jelly was applied as a coupling agent at the 2D data acquisition positions on the model. The receiver and source transducers were then positioned on the model surface,the main frequency is 200 kHz, and data acquisition commenced after alignment. The field setup for data acquisition is shown in Figure 9A.
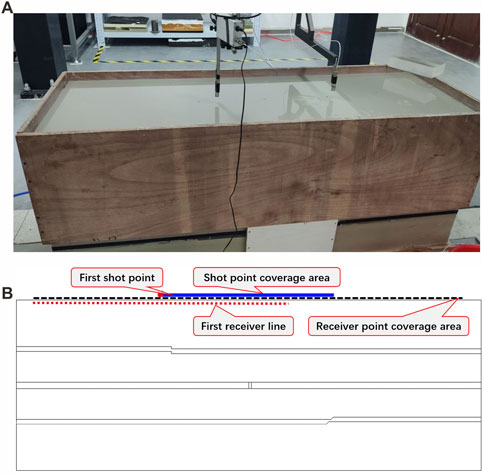
Figure 9. (A) A layer of petroleum jelly was applied as a coupling agent at the 2D data acquisition positions on the model. The receiver and source transducers were then positioned on the model surface, and data acquisition commenced after alignment; (B) A total of 270 source points were deployed, with the source line passing through three anomaly locations. The first shot was positioned at 480 mm along the X-direction of the model, and the last shot at 1,018 mm, resulting in a total source line length of 538 mm and a shot spacing of 2 mm. A total of 451 receiver points were deployed, with the first receiver at 30 mm and the last at 1,468 mm along the X-direction, yielding a receiver line length of 1,438 mm and a trace spacing of 2 mm.
The acquisition geometry is illustrated in Figure 9B. A total of 270 source points were deployed, with the source line passing through three anomaly locations. The first shot was positioned at 480 mm along the X-direction of the model, and the last shot at 1,018 mm, resulting in a total source line length of 538 mm and a shot spacing of 2 mm. A total of 451 receiver points were deployed, with the first receiver at 30 mm and the last at 1,468 mm along the X-direction, yielding a receiver line length of 1,438 mm and a trace spacing of 2 mm. The minimum offset was 20 mm, with a sampling interval of 0.1 μs and 6,000 samples per trace. Detailed acquisition parameters are listed in Table 5.

Table 5. Parameters of observation system.
5 Discussion
Figure 10 shows the original shot gather data collected. The following observations can be made:The reflection from the upper coal seam is very strong with high amplitude energy, and diffracted waves caused by fault breakpoints can be seen at the vertical fault location. The reflection from the middle coal seam is relatively weak, and the goaf cannot be identified. In addition to the influence of model thickness, the strong absorption and attenuation of ultrasonic signal energy by the upper coal seam also have a significant impact. The reflection from the lower coal seam is the weakest due to the absorption and attenuation of ultrasonic waves by two coal seams, and the fault cannot be identified.
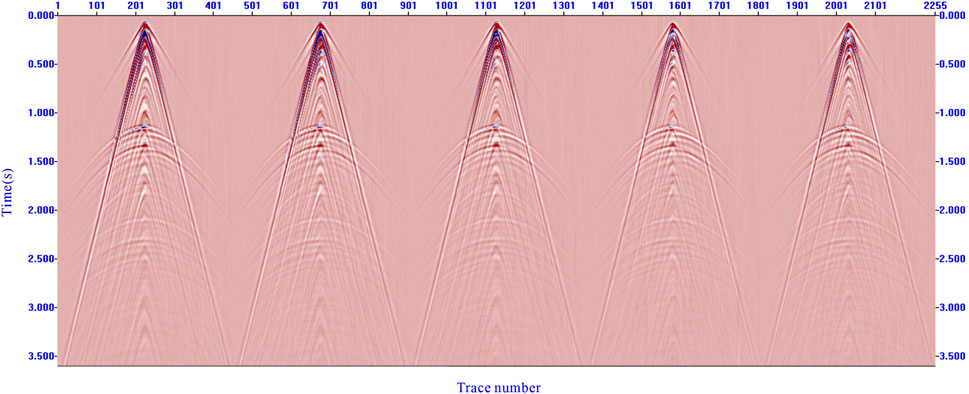
Figure 10. Shows the original shot gather data collected. The reflection from the upper coal seam is very strong with high amplitude energy, and diffracted waves caused by fault breakpoints can be seen at the vertical fault location.
The single-shot records underwent energy balancing processing with a 400 m time window, with Figure 11 presenting the resulting wavefield characteristics: wave group ① represents the direct wave, wave group ② corresponds to surface waves, wave group ③ shows continuous upper coal seam reflections with strong impedance contrasts, wave group ④ (marked by blue circle) clearly displays fault diffraction waves with identifiable breakpoints, wave group ⑤ exhibits middle coal seam reflections with strong interfaces but no discernible goaf response, while wave group ⑥ presents discontinuous and fuzzy lower coal seam reflections with weak interfaces where faults remain unidentifiable.
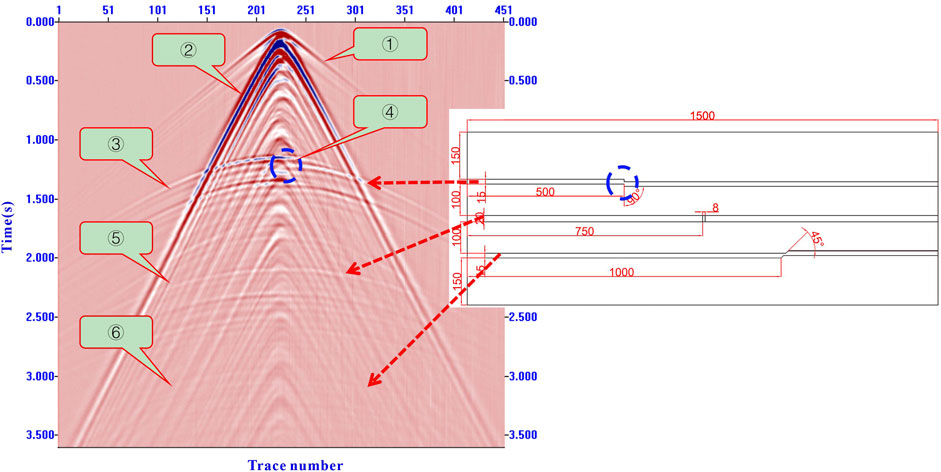
Figure 11. The single-shot records underwent energy balancing processing with a 400 m time window.
The shot gather data was further processed to obtain a migrated imaging profile, as shown in Figure 12. The distribution of the three coal seams can be clearly observed in the figure, with distinct identification of each seam’s top and bottom boundaries. The faults developed in the first and third coal seams are well imaged (yellow dashed circle), while the response characteristics of the goaf in the second seam are less pronounced (red box with magnified detail). However, when the migration profile is displayed using variable-area waveform representation, amplitude anomalies caused by the goaf can also be observed.
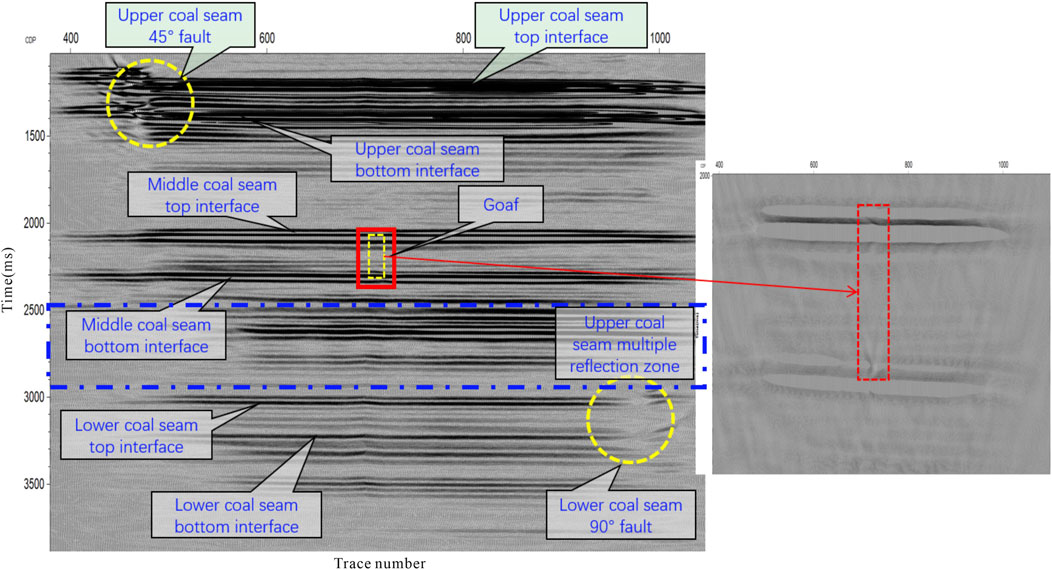
Figure 12. The distribution of the three coal seams can be clearly observed in the figure, with distinct identification of each seam’s top and bottom boundaries.
6 Conclusion
In this paper, we have made a multi-coal seam solid physical model including faults and goafs through material ratio and model design. The ultrasonic seismic physical simulation system is used to perform two-dimensional solid data acquisition and migration imaging analysis on the model in direct contact with the transducer and the model. The following conclusions are obtained.
1. Coal-rock analog material proportioning experiments with single-factor variations obtained optimal model parameter ratios, controlling errors of Vp, Vs., and ρ within ±5% in the constructed 3D physical model.
2. A new type of interlayer construction technology and anti-mold method with pouring-bonding synergy were proposed, and the model making process of forming built-in air goaf and high-precision faults in upper and lower coal seams was realized. Processes such as mold control layer, anti-mold control structure, layer-by-layer pouring, and 3D engraving were proposed to achieve high-precision model fabrication with a single-layer thickness error of ≤0.2 mm.
3. Solid acquisition can obtain clear direct wave, surface wave, wave impedance interface reflection wave and interlayer multiple wave at the top and bottom interface of each coal seam. The wave field is rich and the model is successfully made, which can be used for quantitative analysis of abnormal body characteristics in the later stage.
This study conducted 2D surface reflection acquisition, providing preliminary understanding of multi-coal seam wavefield characteristics. Quantitative anomaly analysis requires further higher-precision in-seam wave detection methods with direct coal seam excitation and reception, which will be our next research focus.
Data availability statement
The original contributions presented in the study are included in the article/supplementary material, further inquiries can be directed to the corresponding author.
Author contributions
PW: Writing – review and editing, Conceptualization, Methodology. YW: Writing – original draft. XS: Writing – original draft. BW: Writing – original draft. QL: Writing – original draft. RD: Writing – original draft.
Funding
The author(s) declare that financial support was received for the research and/or publication of this article. This work was supported in part by the National Key Research and Development Program of China under Grant 2023YFC3012105, and in part by the Natural Science Basic Research Program of Shaanxi Province under Grant 2024JC-YBQN-0268,2024JC-YBQN-0331,2025JC-YBQN-410, and in part by the Innovation Capability Support Program Project of Shaanxi Province 2024RS-CXTD-44.
Conflict of interest
Authors PW, YW, XS, BW, QL, and RD were employed by Xi'an Research Institute Co. Ltd., China Coal Technology and Engineering Group Corp.
Author QL was employed by CCTEG Xi’an Transparent Geology Technology Co., Ltd.
Generative AI statement
The author(s) declare that no Generative AI was used in the creation of this manuscript.
Any alternative text (alt text) provided alongside figures in this article has been generated by Frontiers with the support of artificial intelligence and reasonable efforts have been made to ensure accuracy, including review by the authors wherever possible. If you identify any issues, please contact us.
Publisher’s note
All claims expressed in this article are solely those of the authors and do not necessarily represent those of their affiliated organizations, or those of the publisher, the editors and the reviewers. Any product that may be evaluated in this article, or claim that may be made by its manufacturer, is not guaranteed or endorsed by the publisher.
References
Cheng, J. Y., Yan, Y., Li, Y. T., Wang, P., Zhao, R., and Jiang, B. C. (2025). Technical advances and research directions of borehole geophysical prospecting for coal mines. Coal Geol. & Explor. 53 (6), 1–21. doi:10.12363/issn.1001-1986.25.04.0263
Cui, W. X., Wang, B. L., and Wang, Y. H. (2020). High-precision inver-sion method of coal seam thickness based on transmission channel wave. J. China Coal Soc. 45 (7), 2482–2490. doi:10.13225/i.cnki.jccs.DZ20.0670
Huamin, L. I., and Fu, K. (2006). Some major technical problems and counter-measures for deep mining. J. Min. & Saf. Engineering 23 (4), 468–471.
Huang, C. H., and Tao, X. Z. (2020). Study on numerical simulation and response characteristics of reflecting in-seam wave in coaseams with faults. Coal Sci. Technol. 48 (8), 210–215. doi:10.13199/j.cnki.cst.2020.08.026
Jianyuan, C., Baoli, W., Fan, T., Yunhong, W., and Bici, J. (2022). Typical application scenes and key technologies of coal mine geological transparency. Coal Sci. Technol. 50 (7), 1–12.
Liang, S. (2020). “Study on quantitative analysis seismic response of channel wave of the coal seam fault,” in Xuhzou: chinauniversity of mining and technology.
Liu, Q., Hu, J. W., Wang, P., Shi, X. X., and Jia, Q. (2023). Analogue modeling of love-type channel waves and their response to faults. Coal Geology & Explor. 51 (12), 116–122. doi:10.12363/issn.1001-1986.23.02.0081
Schott, W., and Waclawik, P. (2015). On the quantitative determination of coal seam thickness by means of in-seam seismic surveys. Can. Geotech. J. 52 (10), 1496–1504. doi:10.1139/cgj-2014-0466
Shi, X. X., Liu, Q., Hu, J. W., Wang, P., Lian, C. G., Jia, Q., et al. (2021). A 3D seismic physical modeling system of large double triaxial air-supported positioning and multichannel data acquisition and its application. Coal Geol. & Explor. 49(6), 81–86. doi:10.3969/j.issn.1001-1986.2021.06.009
Wang, P., Zhu, S., Jia, Q., Jian, B., Zhang, M., and Dong, R. (2021). Design and construction of a seismic physical model of room-pillar goafs in shallow coal seams. Coal Geol. & Explor. 49 (6), 101–106. doi:10.3969/j.issn.1001-1986.2021.06.012
Wang, P., Cheng, J. Y., Liu, Q., Hu, J. W., Jia, Q., and Wang, B. L. (2023). 3d seismic physical simulation experiment of love in-seam waves. J. China Coal Soc. 48 (8), 3182–3190. doi:10.13225/j.cnki.jccs.2022.1233
Wang, B., Jin, D., Zhang, H., and Cheng, J. (2022). Quantitative response characteristics of transmitted in-seam channel wave in coal seam with faults. J. China Coal Soc. 47 (8), 2985–2991. doi:10.13225/i.cnki.jccs.wX22.0801
Wang, B., Li, X. Z., Shen, S., Wang, Y., She, Z. L., Su, Y. B., et al. (2024). Status and development trend of mine underground space detection technology. J. Green Mine 2 (3), 273–290.
Wei, J. X., and Di, B. R. (2006). Properties of materials forming the 3D geological model in seismic physical mode. Geophys. Prospect. Petroleum 45 (6), 586–590.
Xing, T. D., Xue, S. G., Li, X. W., Suo, C. H., Wang, H. M., and Jiao, Y. Y. (2021). Physical modeling of seismic response for the coal seams of Yan'an formation in loess tableland of north China. Coal Geol. & Explor. 49 (6), 87–94. doi:10.3969/j.issn.1001-1986.2021.06.010
Yang, R., Wang, B. L., Jin, D., and Li, Y. M. (2025). Research on the quantitative detection method of fault distance in coal mining face based on the combination of reflection and transmission channel wave [J/OL]. J. China Coal Soc. doi:10.13225/j.cnki.jccs.KT25.0082
Yuan, L., Zhang, T., Wang, Y. H., Wang, X. Z., Wang, Y. T., and Hao, X. J. (2025). Scientific problems and key technologies for safe and efficient mining of deep coal resources. J. China Coal Soc. 50 (1), 1–12. doi:10.13225/j.cnki.jccs.YG25.0016
Zhang, F. H., Huang, P., Huang, K. W., Guan, X., Zou, D. Y., and Liang, H. (2018). The construction of complex fracture geophysical model and the gathering and processing of seismic data. Geophys. and Geochemical Explor. 42 (1), 87–95.
Zhou, G. Q., Liu, S. D., Guo, L. Q., Zhang, P. S., and Cao, Y. (2007). Application of seismic wave CT techology to detect geological abnormal structurein coal mining face. Coal Seience Technol. 35 (4), 41–44. doi:10.13199/j.cst.2007.04.41.zhougq.010
Keywords: multi-coal seam, 3D seismic physical mode, similarity material proportioning, solid acquisition, wavefield analysis
Citation: Wang P, Wang Y, Shi X, Wang B, Liu Q and Dong R (2025) Fabrication of multi-coal seam physical model and wavefield analysis of solid acquisition. Front. Earth Sci. 13:1691399. doi: 10.3389/feart.2025.1691399
Received: 23 August 2025; Accepted: 29 September 2025;
Published: 24 October 2025.
Edited by:
Zhengguang Zhang, General Prospecting Institute of China National Administration of Coal Geology, ChinaCopyright © 2025 Wang, Wang, Shi, Wang, Liu and Dong. This is an open-access article distributed under the terms of the Creative Commons Attribution License (CC BY). The use, distribution or reproduction in other forums is permitted, provided the original author(s) and the copyright owner(s) are credited and that the original publication in this journal is cited, in accordance with accepted academic practice. No use, distribution or reproduction is permitted which does not comply with these terms.
*Correspondence: Pan Wang, NDY1MTY5MDkxQHFxLmNvbQ==